Embed Size (px)
Citation preview
A Bioeconomic Model of the Recreational Gulf of Maine Cod and Haddock Fishery
Min-Yang Lee1, Scott Steinback1, and Kristy Wallmo2
1NOAA Fisheries, Northeast Fisheries Science Center, Woods Hole, MA 2NOAA Fisheries, Office of Science and Technology, Silver Spring, MD

Policy/Research Questions
• How will changes in management measures alter
angler fishing effort, angler welfare, recreational
fishing mortality, and stock levels of Atlantic cod and
haddock in the Gulf of Maine?
• What combination of management measures can
achieve conservation objectives?

Outline
• Economic sub-model
• Biological sub-model
• Coupled model
• Simulation process

Model Overview
Estimate a behavioral model
for recreational anglers
Expected and actual
encounters of fish on a
trip
Simulate angler behavior under
alternative stock structures and
regulations
Fish kept and released are a
function of length structure,
selectivity, regulations
Economic Sub-Model
Aggregate and project stocks of
fish
“Biological” Sub-Model
Retained Discards
Effort
Welfare
Economic Sub Model
• Stated Preference Choice Experiment Survey
• Add-on to NMFS’ MRFSS Survey in 2009 (ME-NJ)
• Voluntary mail follow-up
• Dillman surveying approach
Economic Sub-Model

Groundfish Choice Experiment Survey
Five Components
• Description of study
• A species information page
• Screener questions – familiarity and avidity
• CE questions
• Demographic questions
Economic Sub-Model

Economic Sub-Model
8x per survey
Vary these
attributes
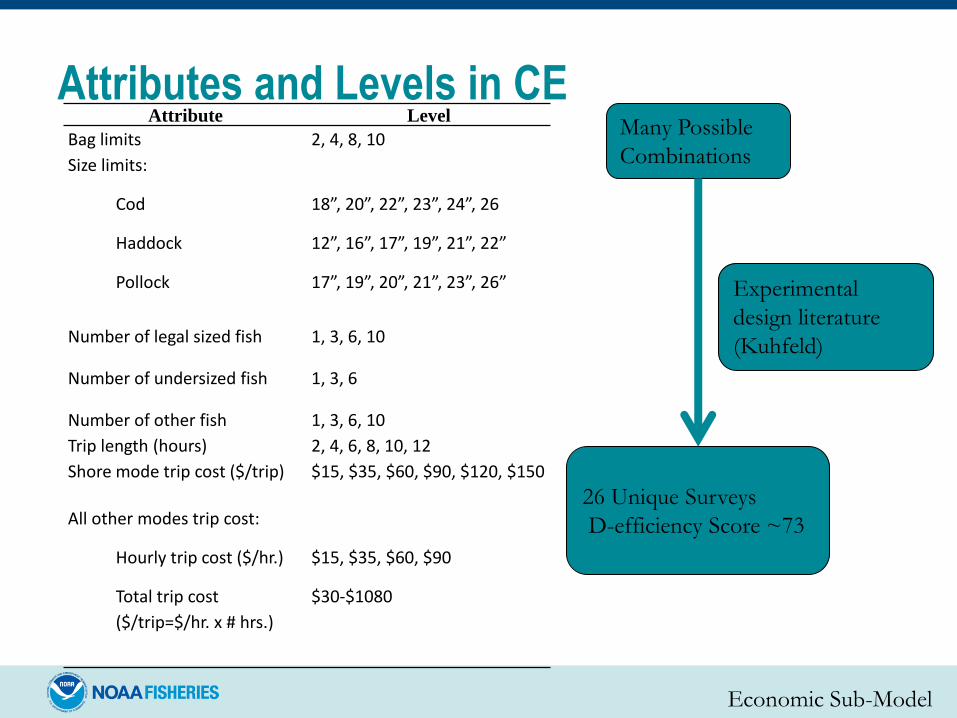
Attributes and Levels in CE Attribute Level
Bag limits 2, 4, 8, 10
Size limits:
Cod
Haddock
Pollock
18”, 20”, 22”, 23”, 24”, 26
12”, 16”, 17”, 19”, 21”, 22”
17”, 19”, 20”, 21”, 23”, 26”
Number of legal sized fish 1, 3, 6, 10
Number of undersized fish 1, 3, 6
Number of other fish 1, 3, 6, 10
Trip length (hours) 2, 4, 6, 8, 10, 12
Shore mode trip cost ($/trip) $15, $35, $60, $90, $120, $150
All other modes trip cost:
Hourly trip cost ($/hr.)
Total trip cost
($/trip=$/hr. x # hrs.)
$15, $35, $60, $90
$30-$1080
Economic Sub-Model
Many Possible
Combinations
Experimental
design literature
(Kuhfeld)
26 Unique Surveys
D-efficiency Score ~73

Response Rates by State and Residency
Intercept State Mailed
Resident
Completed
Non-
resident
Completed
Total
Completed
Completion
Rate
Maine 265 67 58 125 47%
Massachusetts 1238 272 168 440 36%
New Hampshire 536 124 66 190 35%
New Jersey 1421 310 124 434 31%
New York 725 157 7 164 23%
Connecticut 34 10 3 13 38%
Rhode Island 358 48 77 125 35%
Total 4,577 988 503 1,491 33%
Economic Sub-Model
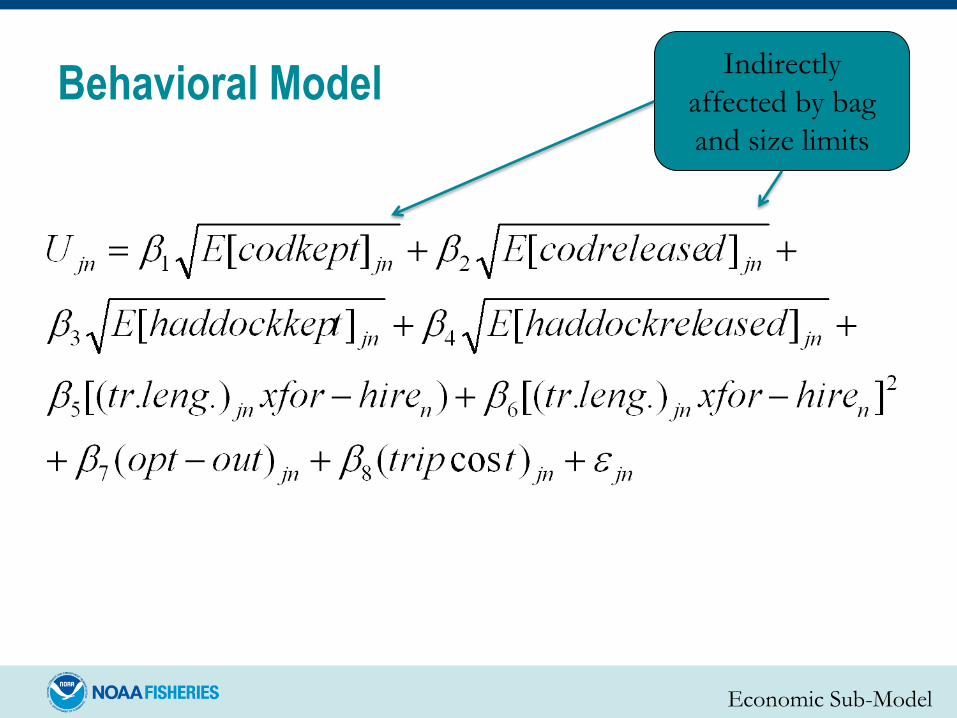
Behavioral Model
Economic Sub-Model
Indirectly
affected by bag
and size limits
U.S. Department of Commerce | National Oceanic and Atmospheric Administration | NOAA Fisheries | Page 11
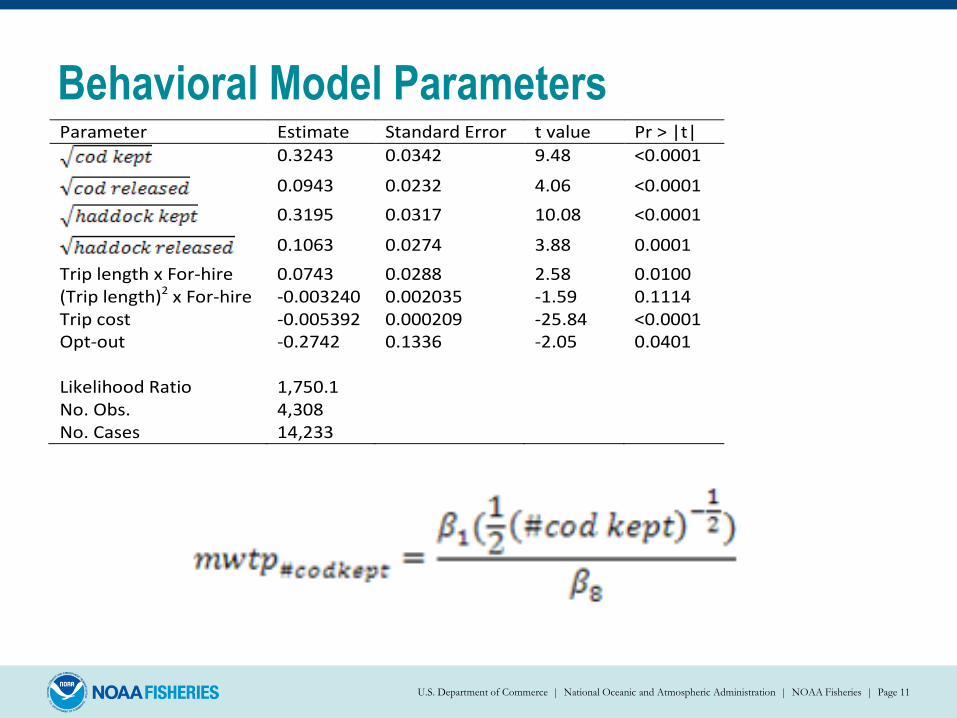
Parameter Estimate Standard Error t value Pr > |t|
0.3243 0.0342 9.48 <0.0001
0.0943 0.0232 4.06 <0.0001
0.3195 0.0317 10.08 <0.0001
0.1063 0.0274 3.88 0.0001
Trip length x For-hire 0.0743 0.0288 2.58 0.0100 (Trip length)2 x For-hire -0.003240 0.002035 -1.59 0.1114 Trip cost -0.005392 0.000209 -25.84 <0.0001 Opt-out -0.2742 0.1336 -2.05 0.0401 Likelihood Ratio 1,750.1 No. Obs. 4,308 No. Cases 14,233
Behavioral Model Parameters

But what changes expectations about kept and
released fish?
Regulations, stock structure, other factors
Behavioral Model Summary
• Model estimates how changes in expectations (mainly
catch expectations) affects the value of a fishing trip
Economic Sub-Model

Behavioral Model Limitations
• No explicit link between changes in regulations and
expected catch in behavioral model
• No consideration of stock structures
• Results are not explicitly linked to changes in
numbers of trips per season (i.e., effort shifts)
U.S. Department of Commerce | National Oceanic and Atmospheric Administration | NOAA Fisheries | Page 13

Model Overview
Estimate a behavioral model
for recreational anglers
Expected and actual
encounters of fish on a
trip
Simulate Angler behavior under
alternative stock structures and
regulations
Fish kept and released are a
function of length structure,
selectivity, regulations
Economic Sub-Model
Aggregate and Project stocks
of fish
“Biological” Sub-Model
Retained Discards
Effort
Welfare
In the “Biological” Sub-Model:
• Generate expectations about catch:
• Encounters-per-trip
• Length of encounters-per-trip
• Length structure of fish in the ocean
• Size selectivity of anglers
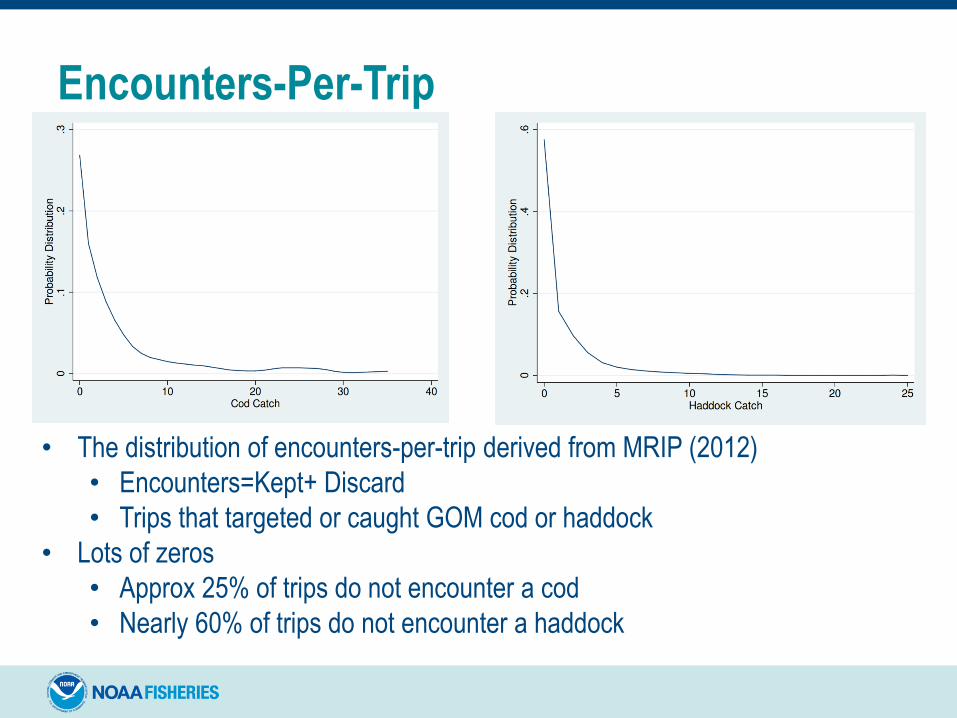
Encounters-Per-Trip
• The distribution of encounters-per-trip derived from MRIP (2012)
• Encounters=Kept+ Discard
• Trips that targeted or caught GOM cod or haddock
• Lots of zeros
• Approx 25% of trips do not encounter a cod
• Nearly 60% of trips do not encounter a haddock

Length Distribution of Encounters
• What is the length-distribution of fish encountered by recreational anglers?
• Not the same as:
• Length distribution of stock
• Length distribution of historical catch
17
Pair with bag, size
limits to determine
how many fish are
kept and released.
Doesn’t account for
targeting behavior
Doesn’t account for
changing stock
conditions

Recreational Selectivity and Catch-at-length

Last Year’s Numbers at
Age (Assessments)
Last Year’s Age-Length Data
(Bottom Trawl Survey)
+ Last Year’s Numbers at
Length
+
Last Year’s Recreational
Selectivity-at-Length
Next Year’s Projected Numbers at Age
Next Year’s Projected Recreational
CPUE-at-Length
Next Year’s Recreational
Selectivity-at-Length [ql]
≈
Combining Stock Assessment and Recreational
Catch data
Last Year’s Catch-at-Length
(MRIP)
Calculate Next Year’s Projected Numbers-at-Length x

Model Overview
Estimate a behavioral model
for recreational anglers
Expected and actual
encounters of fish on a
trip
Simulate Angler behavior under
alternative stock structures and
regulations
Fish kept and released are a
function of length structure,
selectivity, regulations
Economic Sub-Model
Aggregate and Project stocks
of fish
“Biological” Sub-Model
Retained Discards
Effort
Welfare
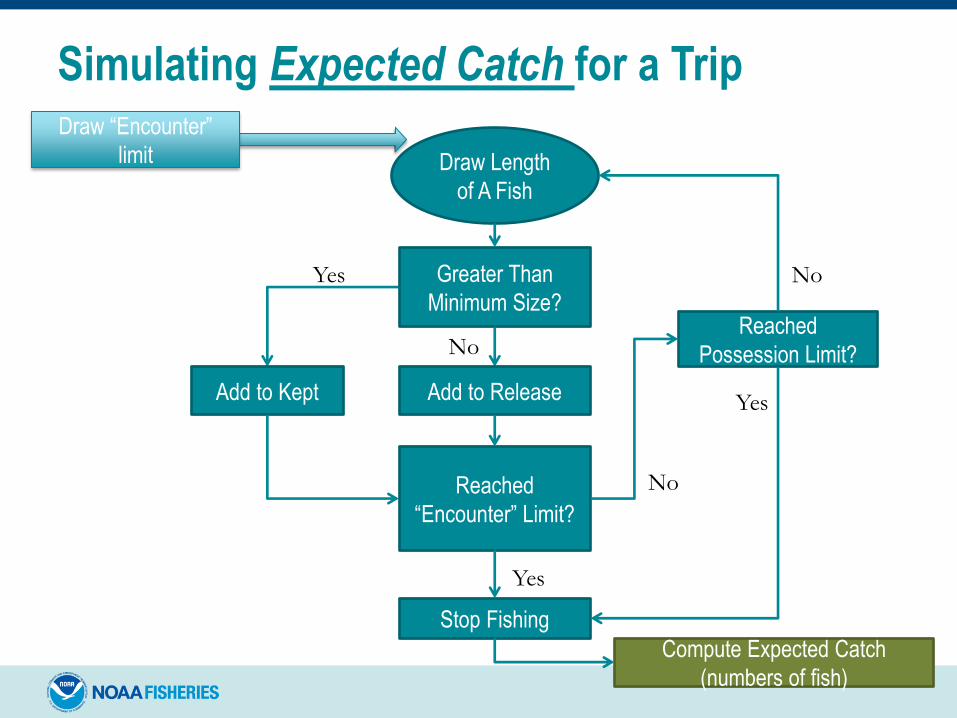
Simulating Expected Catch for a Trip
Draw Length
of A Fish
Greater Than
Minimum Size?
Add to Kept
Yes
No
Add to Release
Reached
“Encounter” Limit?
Stop Fishing
Reached
Possession Limit?
Yes
Yes
No
No
Compute Expected Catch
(numbers of fish)
Draw “Encounter”
limit

The Participation Decision
Expected Catch
RUM: Probability a
Prospective Trip Will
Occur
Trip Does
not Occur
Trip Occurs
< 50%
>50% Rum Model
Coefficients
WTP For a Trip
Other Trip Characteristics
(costs, mode, length)
Simulate Actual Catch
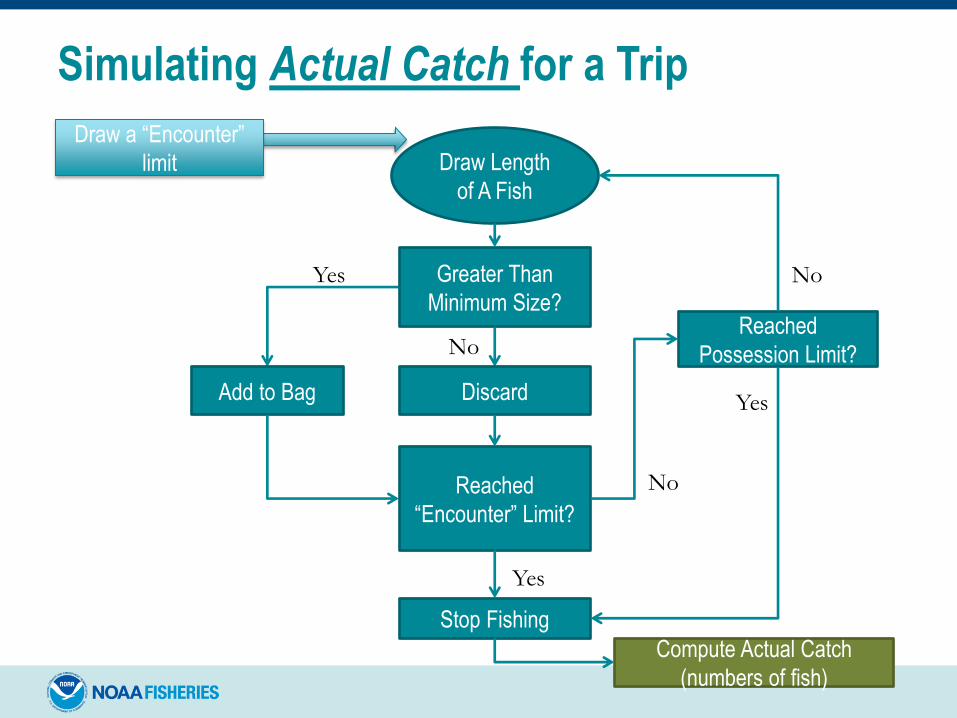
Simulating Actual Catch for a Trip
Draw Length
of A Fish
Greater Than
Minimum Size?
Add to Bag
Yes
No
Discard
Reached
“Encounter” Limit?
Stop Fishing
Reached
Possession Limit?
Yes
Yes
No
No
Compute Actual Catch
(numbers of fish)
Draw a “Encounter”
limit

Weights of Kept and Released Fish
• Compute weights of kept and released fish on each
simulated trip from length-weight equations used in
the assessments

Simulating Over Entire Fishing Year
• The algorithm simulates trips until the maximum
number of potential trips is reached
• Potential Trips?
• Set a number for potential trips that is large
enough so that it is not binding if the fishery
becomes more desirable, but is not unrealistic
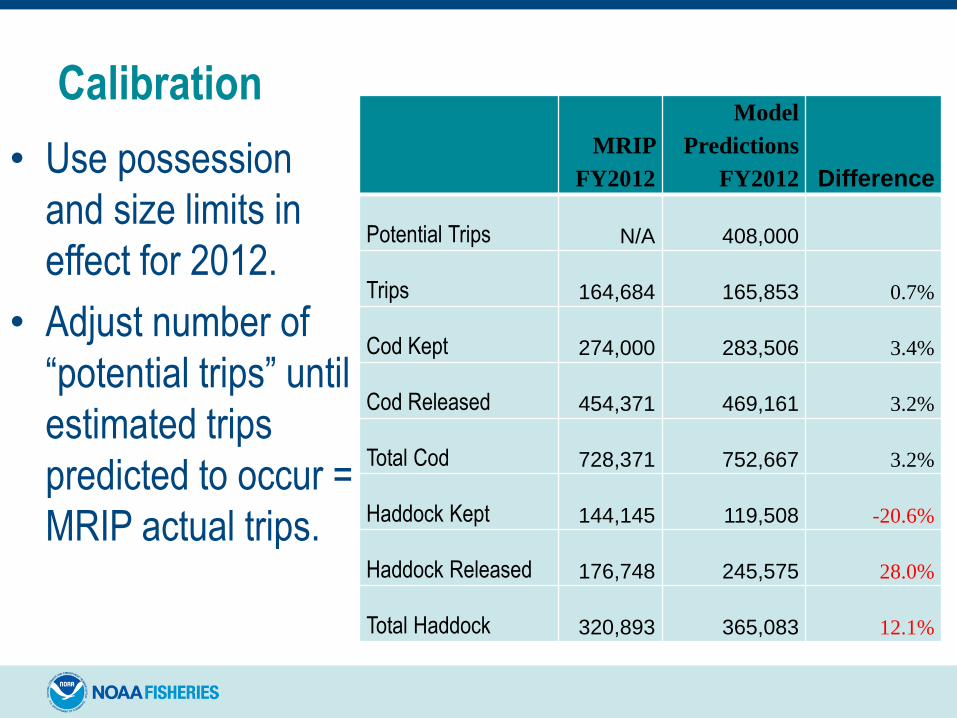
Calibration
• Use possession
and size limits in
effect for 2012.
• Adjust number of
“potential trips” until
estimated trips
predicted to occur =
MRIP actual trips.
MRIP
FY2012
Model
Predictions
FY2012 Difference
Potential Trips N/A 408,000
Trips 164,684 165,853 0.7%
Cod Kept 274,000 283,506 3.4%
Cod Released 454,371 469,161 3.2%
Total Cod 728,371 752,667 3.2%
Haddock Kept 144,145 119,508 -20.6%
Haddock Released 176,748 245,575 28.0%
Total Haddock 320,893 365,083 12.1%

FY2013 Simulation Results
Cod
Bag
Haddock
Bag
Cod
Min
Haddock
Min
Trips
(Median)
% Under
Cod
ACL
(out of
100
trials)
% Under
Haddock
ACL (out
of 100
trials)
Cod Mortality
lbs
(Median)
Haddock Mortality
lbs
(Median)
9 None 19 18 153,549 65 11 997,888 337,692
9 None 19 20 141,586 77 42 926,307 182,669
9 None 19 21 136,622 82 63 902,304 126,264
Good news: No changes needed for Cod.
Bad News: 21” minimum size needed for haddock mortality to remain below 74mt (~163,000 lbs).

Important Assumptions
• No heterogeneity in catch rates across fishing
modes
• Anglers stop fishing for either species when they hit
the “assigned encounter limit” or the bag limit
• No recreational high-grading
• No illegal retention* (too small, over bag limit)
Extensions
• Retention of sub-legal fish
• Retention of more fish than possession limit
• Medium term projections:
• Given a discard mortality assumption, we can
compute numbers-at-age of harvested cod and
haddock
• Project stocks/biomass a few years into the future

Questions?
U.S. Department of Commerce | National Oceanic and Atmospheric Administration | NOAA Fisheries | Page 30

Outcomes of some policies are very sensitive to
discard mortality
0
500,000
1,000,000
1,500,000
2,000,000
2,500,000
3,000,000
3,500,000
4,000,000
4,500,000
5,000,000
0 10 20 30 40 50 60 70 80 90 100
Co
d R
emo
vals
(K
ept
+ D
ead
Rel
ease
d in
po
un
ds)
Discard Mortality Rate (%)
10 Fish, 18" Minimum 7 Fish, 18" Minimum 7 Fish, 26" Minimum
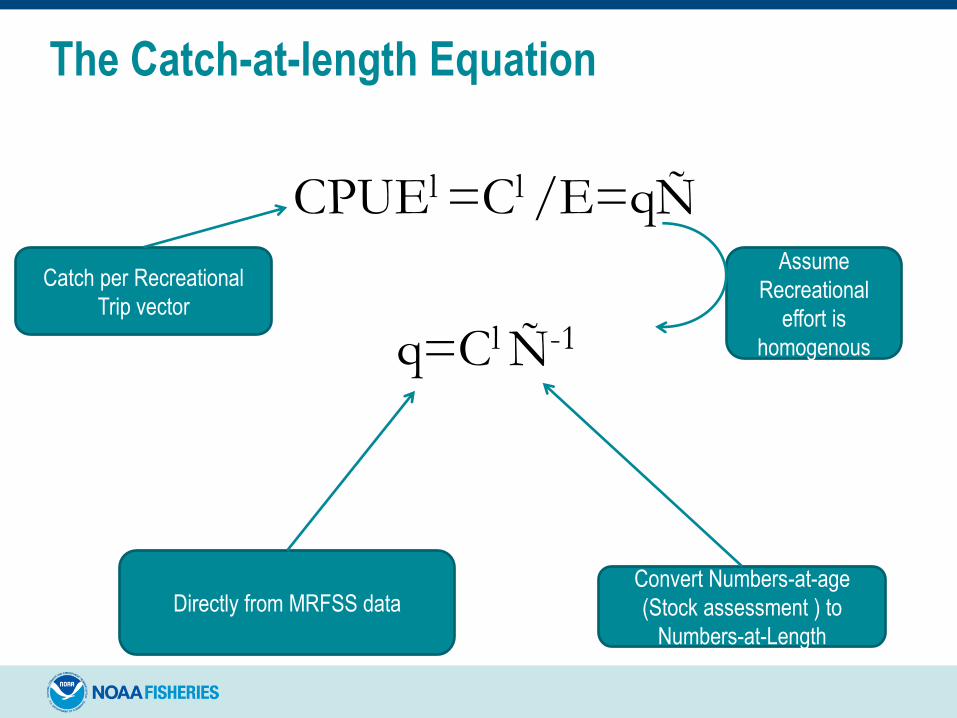
The Catch-at-length Equation
CPUEl =Cl /E=qÑ
q=Cl Ñ-1
Assume
Recreational
effort is
homogenous
Directly from MRFSS data Convert Numbers-at-age
(Stock assessment ) to
Numbers-at-Length
Catch per Recreational
Trip vector