Embed Size (px)
Citation preview

MP-69-P-47
An Assessment of CFD Effectiveness for Vortex-FlowSimulation to Meet Preliminary Design Needs
Symposium on
ADVANCED FLOW MANAGEMENT
PART A – VORTEX FLOWS AND HIGH ANGLE OF ATTACK
Loen, NORWAY, 7-11 May, 2001
The original version of this material will be published by the Research and Technology Organization, NorthAtlantic Treaty Organization (RTO/NATO) in Meeting Proceedings, MP-069 - "Advanced Flow Management,Part A Vortex Flow and High Angle of Attack", in the Spring 2002.For permission to copy or republish, contact the NATO/RTO Research and Technology Agency,BP 25 - 7, rue Ancelle - 92201 Neuilly-sur-Seine – France
NNoorrtthh AAttllaannttiicc TTrreeaattyy OOrrggaanniizzaattiioonn
Research and Technology Agency
APPLIED VEHICLE TECHNOLOGY PANEL
P. RajLockheed Martin Aeronautics Company
Marietta, GA, USA
D.B. FinleyLockheed Martin Aeronautics Company
Fort Worth, TX, USA
F. GhaffariNASA-Langley Research Center
Hampton, VA, USA

47-1
Figure 1. Flow separation fromforebody chine and wing leading-edgeand roll up to form free vortices
1.0 Introduction
The low-speed flight and transonic maneuvering characteristics of combat air vehicles designed forefficient supersonic flight are significantly affected by the presence of free vortices. At moderate-to-highangles of attack, the flow invariably separates from the leading edges of the swept slender wings, as well asfrom the forebodies of the air vehicles, and rolls up to form free vortices (see Figure 1).
The design of military vehicles is heavily driven by the need to simultaneously improveperformance and affordability.1 In order to meet this need, increasing emphasis is being placed on usingModeling & Simulation environments employing the IntegratedProduct & Process Development (IPPD) concept. The primaryfocus is on expeditiously providing design teams with high-fidelitydata needed to make more informed decisions in the preliminarydesign stage.
Extensive aerodynamic data are needed to support combatair vehicle design. Force and moment data are used to evaluateperformance and handling qualities; surface pressures provideinputs for structural design; and flow-field data facilitate systemintegration. Continuing advances in computational fluid dynamics(CFD) provide an attractive means of generating the desired data ina manner that is responsive to the needs of the preliminary designefforts. The responsiveness is readily characterized as timelydelivery of quality data at low cost.
Lockheed Martin (LM) and National Aeronautics & Space Administration-Langley Research Center(NASA-LaRC) conducted several joint as well as separate studies2-9 in the 1990s. The studies were aimed atassessing the effectiveness of the state-of-the-art CFD methods (solving Euler and Navier-Stokes equations)in producing aerodynamic data for preliminary design of combat air vehicles. The principal focus was onflight conditions where the flow is dominated by free vortices. In the present context, effectiveness isdefined as the ability to meet the desires and expectations of the design teams. It is expressed as a product oftwo factors: quality and acceptance. Accuracy and credibility of results are the quality factors, andtimeliness and affordability of the process of generating those results are the acceptance factors.
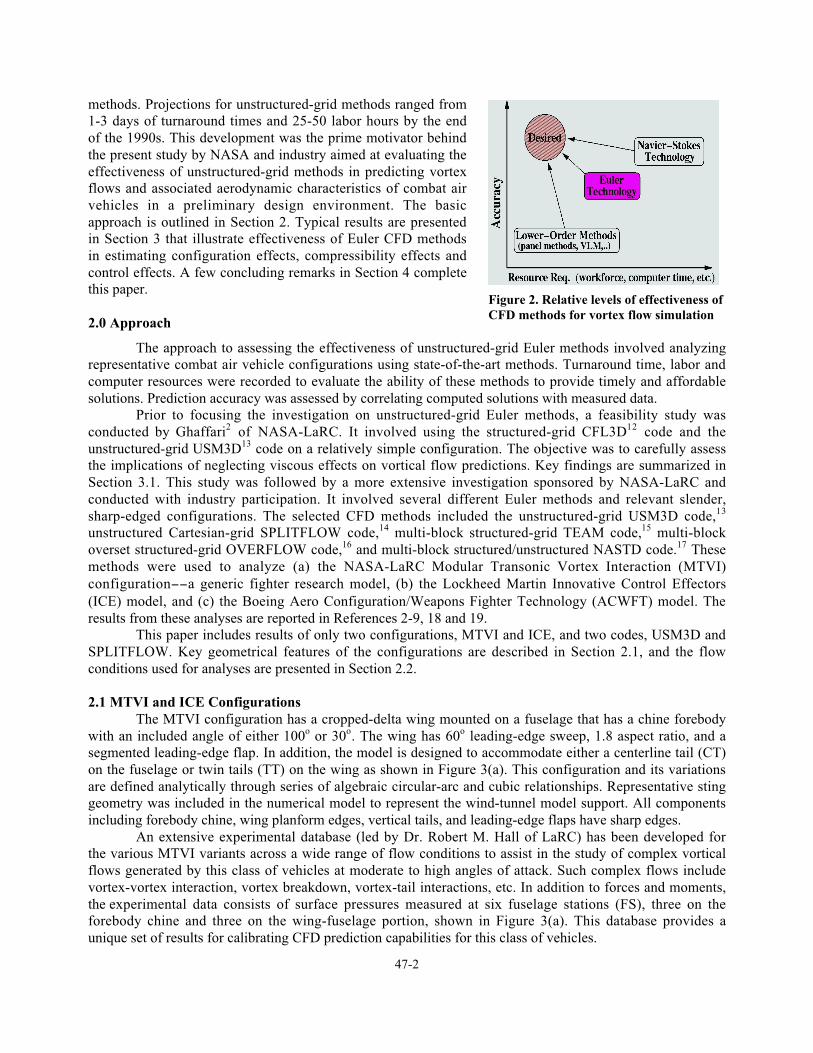
CFD methods for vortex-flow simulation can be broadly categorized into lower-order methods(based on potential-flow equations), inviscid Euler methods, and viscous Navier-Stokes (N-S) methods. Thelower-order methods rate high in acceptance factors because of rapid turnaround and low levels of labor andcomputer resources. But their rating for quality factors is quite low because their simplified physics modeldoes not allow capturing nonlinear aerodynamic effects such as transonic compressibility. By virtue of theproper model of flow physics, viscous N-S methods alleviate the deficiencies of the lower-order methods.However, a significant increase in required resources severely hampers their effectiveness for preliminarydesign applications. As illustrated in Figure 2, inviscid Euler methods offer an attractive alternative to theviscous N-S methods.
Extensive applications of structured-grid Euler methods throughout the 1980s clearly demonstratedtheir ability of modeling vortex flows.10,11 But their effectiveness for preliminary design applicationscontinues to be severely hampered by long turnaround times (2-4 weeks) and large number of labor hours(200-300 hours) associated with their use. The unstructured-grid methods that evolved during the late ‘80sand early ‘90s showed considerable promise in alleviating precisely these drawbacks of the structured-grid
AN ASSESSMENT OF CFD EFFECTIVENESS FOR VORTEXFLOW SIMULATION TO MEET PRELIMINARY DESIGN NEEDS
P. RajLockheed Martin Aeronautics Company
Marietta, GA 30063-0685, USA
D.B. FinleyLockheed Martin Aeronautics Company
Fort Worth, TX 76101-0748, USA
F. GhaffariNASA-Langley Research CenterHampton, VA 23681-2199, USA
47-2
methods. Projections for unstructured-grid methods ranged from1-3 days of turnaround times and 25-50 labor hours by the endof the 1990s. This development was the prime motivator behindthe present study by NASA and industry aimed at evaluating theeffectiveness of unstructured-grid methods in predicting vortexflows and associated aerodynamic characteristics of combat airvehicles in a preliminary design environment. The basicapproach is outlined in Section 2. Typical results are presentedin Section 3 that illustrate effectiveness of Euler CFD methodsin estimating configuration effects, compressibility effects andcontrol effects. A few concluding remarks in Section 4 completethis paper.
2.0 Approach
The approach to assessing the effectiveness of unstructured-grid Euler methods involved analyzingrepresentative combat air vehicle configurations using state-of-the-art methods. Turnaround time, labor andcomputer resources were recorded to evaluate the ability of these methods to provide timely and affordablesolutions. Prediction accuracy was assessed by correlating computed solutions with measured data.
Prior to focusing the investigation on unstructured-grid Euler methods, a feasibility study wasconducted by Ghaffari2 of NASA-LaRC. It involved using the structured-grid CFL3D12 code and theunstructured-grid USM3D13 code on a relatively simple configuration. The objective was to carefully assessthe implications of neglecting viscous effects on vortical flow predictions. Key findings are summarized inSection 3.1. This study was followed by a more extensive investigation sponsored by NASA-LaRC andconducted with industry participation. It involved several different Euler methods and relevant slender,sharp-edged configurations. The selected CFD methods included the unstructured-grid USM3D code,13
unstructured Cartesian-grid SPLITFLOW code,14 multi-block structured-grid TEAM code,15 multi-blockoverset structured-grid OVERFLOW code,16 and multi-block structured/unstructured NASTD code.17 Thesemethods were used to analyze (a) the NASA-LaRC Modular Transonic Vortex Interaction (MTVI)configuration−−a generic fighter research model, (b) the Lockheed Martin Innovative Control Effectors(ICE) model, and (c) the Boeing Aero Configuration/Weapons Fighter Technology (ACWFT) model. Theresults from these analyses are reported in References 2-9, 18 and 19.
This paper includes results of only two configurations, MTVI and ICE, and two codes, USM3D andSPLITFLOW. Key geometrical features of the configurations are described in Section 2.1, and the flowconditions used for analyses are presented in Section 2.2.
2.1 MTVI and ICE ConfigurationsThe MTVI configuration has a cropped-delta wing mounted on a fuselage that has a chine forebody
with an included angle of either 100o or 30o. The wing has 60o leading-edge sweep, 1.8 aspect ratio, and asegmented leading-edge flap. In addition, the model is designed to accommodate either a centerline tail (CT)on the fuselage or twin tails (TT) on the wing as shown in Figure 3(a). This configuration and its variationsare defined analytically through series of algebraic circular-arc and cubic relationships. Representative stinggeometry was included in the numerical model to represent the wind-tunnel model support. All componentsincluding forebody chine, wing planform edges, vertical tails, and leading-edge flaps have sharp edges.
An extensive experimental database (led by Dr. Robert M. Hall of LaRC) has been developed forthe various MTVI variants across a wide range of flow conditions to assist in the study of complex vorticalflows generated by this class of vehicles at moderate to high angles of attack. Such complex flows includevortex-vortex interaction, vortex breakdown, vortex-tail interactions, etc. In addition to forces and moments,the experimental data consists of surface pressures measured at six fuselage stations (FS), three on theforebody chine and three on the wing-fuselage portion, shown in Figure 3(a). This database provides aunique set of results for calibrating CFD prediction capabilities for this class of vehicles.
Figure 2. Relative levels of effectiveness ofCFD methods for vortex flow simulation

47-3
A composite of two ICE configurations is shown in Figure 3(b), one with straight trailing edge(bottom half) and the other with serrated edge (top half). Both configurations have blended wing, fuselageand canopy, with a substantial amount of camber near the leading edge. The wing, representative of combatair vehicles, is 4% thick with 65o leading-edge sweep and NACA 64-A airfoil section. Trailing-edge controleffectors include elevons and spoilers. The wind-tunnel models have no pressure taps; only force andmoment data are available for comparisons.
2.2 Analysis ConditionsBoth MTVI and ICE configurations were analyzed for a wide range of angles of attack and several
yaw angles at subsonic and transonic Mach numbers. As an example, the run matrix for the MTVIconfigurations is shown in Table 1 for a total of 42 runs. A similar matrix for the ICE configuration, withand without control devices, included 50 runs. It covered both subsonic and transonic Mach numbers, and arange of angles of attack up to 30 degrees and of yaw angles up to 10 degrees.8,9
Table 1. Run Matrix for MTVI AnalysisModel Mach No. (M) Angle of Attack (α) Yaw Angle (β) No. of Runs
MTVI TT 0.4, 0.85 10, 12.5, 15, 17.5, 20, 25, 3025
02,4,7
146
MTVI CT 0.4, 0.85 10, 15, 20, 25, 3015, 25
02,4,7
1012
Computed forces, moments, surface pressures and flow-field data were compared with availableexperimental data to assess the effectiveness of the CFD methods. Representative results are presented in thenext section.
3.0 Results and Discussion In this section, representative results are presented for the MTVI and ICE configurations. Key
findings of the feasibility study using the MTVI isolated fuselage model are discussed in Section 3.1. Thesefindings, combined with those obtained from other studies undertaken early on to assess the impact ofneglecting viscous effects,3,18 provided the necessary justification for performing a more extensiveevaluation of inviscid unstructured-grid Euler methods. An assessment of the effectiveness of two Eulermethods, USM3D and SPLITFLOW, in predicting configuration effects (tail placement and chine shape) isgiven in Section 3.2, compressibility effects in Section 3.3, and control effects in Section 3.4.
3.1 Feasibility StudyViscous and inviscid analyses of the MTVI isolated fuselage model were performed using the
CFL3D code,12 and inviscid analysis using the USM3D code.13 Figure 4 shows the normalized total-pressurecontours (po,l /po) at three fuselage stations from CFL3D (starboard) and USM3D (portside) computationsfor α = 19.8o, M = 0.4. The turbulent viscous results for Rft = 2.4x10⁶ are based on the Baldwin-Lomaxturbulence model with Degani-Schiff modification. All results are plotted over the same range {(po,l /po)min =
Figure 3(a). MTVI Twin-Tail (left) and Centerline-Tail (right)configurations
Figure 3(b). ICE Configuration

47-4
0.86, (po,l /po)max = 1.0} and levels {(po,l /po)increment = 0.0175}. The CFL3D and USM3D inviscid resultsqualitatively show similarities in the size and trajectory of the primary vortex-flow structure. The viscousCFL3D results show a somewhat larger primary vortex, along with a secondary vortex and a thin boundary-layer region near the surface. Note that the viscousprimary-vortex core appears to be more diffused,due to viscous damping, than the inviscid resultswhere the contour-level structures are more compactand clustered.
In Figure 5, the computed surface pressurecoefficients (Cp) obtained from the structured- andunstructured-grid methods are correlated with theexperimental data. Note that the data are shown forboth the port and the starboard sides of the model toassess any flow asymmetry. Results are shown at thesame stations as those in Figure 4. The inviscidresults obtained from the structured and unstructuredgrid methods are in excellent agreement with eachother. The viscous results show reasonableagreement with the measured surface pressurecoefficients, but the inviscid predictions indicategenerally a higher primary-vortex suction peak, i.e.,more negative Cp, that is located slightly outboard.Similar computational results and correlation with experimental data were observed for M = 0.4, α = 29.8o,Rft = 2.3x10⁶.
The computed longitudinal aerodynamic characteristics are correlated with experimental data inFigure 6. The forces and moments predicted by the thin-layer Navier-Stokes method, CFL3D, compare verywell with the experimental data. It is alsointeresting to note that the inviscid Eulerpredictions correlate reasonably well with themeasurements, despite the differences withviscous solutions in vortex flow structure andsurface pressure coefficients as shown in Figures4 and 5. This effect, which manifests itself onlyon the overall aerodynamic data, is attributed tothe integration process over local flow properties(i.e., surface pressures) to numerically determinethe global aerodynamic characteristics. Theintegration process inherently does not maintainthe variable local changes such as the differencebetween the inviscid and viscous surface pressuredistributions.
This NASA-LaRC feasibility study,combined with others10,11 performed by numerousinvestigators using structured-grid Euler methodsduring the 1980s, demonstrated that for sharp-edged vehicles the inviscid Euler analysis is aviable approach for computing aerodynamic datawith sufficient accuracy for preliminary designefforts. It cannot be overemphasized that Euler analyses and results require careful interpretation due to theinherent limitations of the inviscid model of flow physics.
Figure 4. Normalized total-pressure predictions basedon structured and unstructured grid methodologies,α = 19.8o, M = 0.4, Rft = 2.4x10⁶
Figure 5. Computed and measured surfacepressures, α = 19.8o, M = 0.4, Rft = 2.4x10⁶

47-5
3.2 Configuration EffectsIn this section, results for MTVI analyses are
presented to illustrate the effectiveness of Euler methods insimulating tail-placement and forebody chine-shape effects.
Tail Placement Effect−−Representative on- and off-surface flow features obtained using USM3D on the MTVI CTand TT configurations having forebody chine with includedangle (φ) of 100o are shown in Figure 7. The figure shows thecomputed surface pressures, off-surface total pressurecontours at six longitudinal cross-flow planes (that coincidewith the stations where surface pressures were measured), andparticle traces through the wing and forebody vortex cores.The figure clearly demonstrates the effects of vertical tailarrangement on the configuration surface and off-surface flowfields. A typical MTVI computation, with about 0.8 milliontetrahedral cells generated using VGRID,20 required 200 megawords (MWs) of memory and approximately5 hours of computing time on a Cray C90.
The computed Euler surface pressure distributions for the MTVI CT and TT configurations arecorrelated with experimental data at FS 3 (X = 14.5”) through FS 6 (X = 28.05”) in Figure 8. The effect ofdifferent vertical tail arrangements on forebody surface pressures at FS 3 is quite small, bothcomputationally and experimentally. Note the expected trends in the computed surface pressure distributionrelative to data, i.e., higher primary vortex suction peak located slightly outboard and no evidence ofsecondary-vortex loading. Theexperimental data over the wingsections generally indicate highersuction peak levels for the CT thanthe TT configuration, and both exhibitpressure distributions consisting oftwo distinct suction peaks associatedwith the wing and the forebody chinevortices. The pressure distributionspredicted over the wing by the Eulermethod, however, show somecharacteristics that are different thanexperimental data as discussed next.
At FS 4 (X = 19.05”) in Figure 8, the computed results generally show the correct pressure trends insuction peaks associated with the wing and chine vortices, though the magnitudes are somewhat offcompared to the data. Also, the computed pressure distribution indicate a low pressure region in between thewing and the chine vortex suction peaks (i.e., 2.5 < Y <3.5). This low-pressure region can be attributed tothe inboard expansion of the wing primary vortex over the flap hinge-line onto the main wing panel. Theeffect of this inboard expansion of the wing primary vortex over the flap hinge line and the resulting suctionpeak is even more pronounced at FS 5 (X = 23.55”) for both the TT and the CT models (see Figure 7 for thecorresponding computed vortical flow visualization). At FS 6 (X = 28.05”), the computed results for the TTmodel show a slight overprediction of the wing pressures in the separated flow region outboard of the tail (Y>5), and the predicted suction peak associated with the chine forebody vortex appears to be further outboardthan the data indicate. The computed pressures for the CT model clearly show a single suction peak thatappears to coincide with a region of the flow (see Figure 7) where the forebody vortex and the wing vortexcoalesce. This coalescing of the two vortices at this station gives rise to such an extreme low-pressuresuction peak that is not present in the experimental data.
Figure 7. Computed on- and off-surface flow features for MTVITT and CT models, φ = 100o, δflap = 30o, α = 22.5o, M = 0.4
Figure 6. Computed and measuredlongitudinal aerodynamic characteristics,M = 0.4, Rft = 2x10⁶

47-6
Figure 8. Surface pressure correlation for MTVI TTand CT models, φ = 100o, δflap = 30o, α = 22.5o, M = 0.4
The computed lift, drag and pitchingmoment coefficients for the MTVI TTconfiguration correlate exceptionally well withthe experimental data both in terms of magnitudeand trends across the examined range of flowconditions, except at the extreme angle of attackof 45o as shown in Figure 9. The computedresults for the MTVI CT configuration, however,compare well with the data only at the low angleof attack of 10o. The Euler code overpredicts thelift coefficient (CL) at the higher angle of attackof 22.5o and underpredicts it at 30o. This effectcould be caused by the complexities of the chineand wing vortex interactions that are verydifficult to numerically simulate and obtain goodsolution convergence. Despite the disagreementin the magnitudes of the predicted and measuredlift coefficients at higher angles of attack, theoverall trend for vertical tail placement effects iscomputed correctly by the code. This trend showsthat the MTVI CT model produces higher lift,lower drag and an increase in the nose-down pitching moment relative to the MTVI TT model for α >10o.
The MTVI configurations were also analyzed by Finley et al4 for symmetric and asymmetricconditions using the SPLITFLOW code. The SPLITFLOW predictions were similar to those of the USM3Dcode. Generally, the computed longitudinal coefficients matched well with data; but the lift and nose-downmoment predictions from SPLITFLOW were higher than those from USM3D due to grid adaption asdiscussed later on in Section 3.3. Compared to thelongitudinal coefficients, lateral-directional coefficientsshowed more variation and sensitivity to the absence ofviscous effects in predicting vortex placement. For the TTconfiguration, the SPLITFLOW accurately predicted thelateral-directional data both in terms of trends andmagnitudes. However, the nonlinear variations in the datawere not well predicted for the CT configuration. Forexample, the Euler computation did not capture a non-linearity at α = 30o and β = 3o. This non-linearity couldcorrespond to a burst vortex condition. Pressure data indicatethat the lee-side wing vortex causes a severe reduction inpeak values at the last two fuselage stations, while thecomputation shows significant suction. The integrated forcesfrom the test data indicate that more negative side force isgenerated on the CT than the TT configuration. The sideforce for the CT configuration is overpredicted compared tothat for TT, but it is consistent with the incremental increasein yawing moment seen for the CT model. Therefore, theEuler code accurately predicts the configuration change effects on stability for this case.
In summary, both CFD methods performed well in predicting the wing pressures for the TTconfiguration. The low-energy flow region on the outer wing panel outboard of the twin vertical tails is wellpredicted. The predicted behavior appears analogous to a large-scale separated flow zone. For the centerlinetail arrangement the code overpredicts the primary vortex suction peak pressure on the wing. This
Figure 9. Effects of vertical tailarrangement on MTVI longitudinalaerodynamic characteristics, φ = 100o,δflap = 30o

47-7
corresponds to an overprediction of normal force and nose-down pitching moment. In general, the Eulerpredictions capture the significant primary-vortex flow features, but miss the secondary separation.
Chine Shape Effects−−The computed and measured surface pressure distributions for the MTVITT configuration with two different forebody chine angles are shown in Figure 10 at two representativefuselage stations. The experimental data on the forebody station (FS 3) indicate that the primary vortexsuction peak moves inboard and becomes less negative for the smaller chine angle. This trend is clearlycaptured by the Euler method. Similar to the results for tail placement discussed above, the generalcharacteristics of the pressure distributions are capturedby the Euler computations (i.e., higher suction peak,located slightly outboard, and no evidence of a secondaryvortex loading). The experimental data at the most aftwing-body station (FS 6) indicate little sensitivity todifferent chine angles. Also note the asymmetry inmeasured wing pressures in the separated flow regionoutboard of the vertical tail for the 30o-chine model.Though, not shown here, the effect of different chineangle on the overall aerodynamic characteristics weresmall and the Euler method captured the effects in areasonable manner.
The SPLITFLOW code also provided goodagreement with the force coefficients for the sharper chine, including the nose-up pitching moment breakabove CL of 1.0. The model with 30o chine angle has a slight increase in lift, and a nose-up pitching moment,compared to the one with 100o chine angle.3 The Euler predictions showed the trend of inward movement ofthe suction peak, but tended to underpredict the peak in suction pressure on the forebody.
3.3 Compressibility EffectsIn order to assess the effectiveness of Euler methods for predicting compressibility effects, MTVI
CT and TT configurations with 30o chine and 0o flap deflection were analyzed at Mach numbers of 0.4 and0.85. A large number of symmetric and asymmetric flow conditions were investigated (see Table 1).References 4-6 contain extensive comparisons of computed results with test data. In general, predictions fortransonic flow (M = 0.85) matched better with experimental data than those for subsonic flow (M = 0.4).The surface pressures show large over-expansion at subsonic speeds which is much less pronounced attransonic speeds. Only a few sample results for each configuration are included here.
For the USM3D analysis, the grid for the CT model contained over 600K cells, and for the TTmodel over 800K cells. The SPLITFLOW analysis used about 500K cells for each model. For symmetriccases, both USM3D and SPLITFLOW produced converged solutions in 400 to 600 cycles using the implicitsolver. The CPU times averaged 3 hours on Cray C-90, and the required memory ranged from 110 to 120MWs. The asymmetric cases required 600 to 700 cycles for USM3D and 800 to 1000 for SPLITFLOW. Thecorresponding CPU times were about 8 hours for USM3D and 14-18 hours for SPLITFLOW, and thememory requirements ranged from200 to 230 MWs.
MTVI CT Results−−Forthe symmetric flow cases, Figure11 shows the computed lift anddrag coefficients from both codes.At subsonic speeds (M = 0.4) thepredictions correlate well witheach other and with experimentaldata for α < 20o where the vortical
Figure 10. Computed and measured MTVI TTsurface pressures, δflap = 30o, α = 22.5o, M = 0.4,Rft = 2.5x10⁶
Figure 11. Lift and Drag correlation for MTVI CT configuration

47-8
flow field is benign. At higher angles ofattack, results from both codes differed fromeach other as well as from test data. Thelargest differences were seen for the 30o
case. The SPLITFLOW code produced asolution with benign vortex flow andsignificantly overpredicted lift and drag. TheUSM3D solution, in contrast, exhibited burstvortex flow and underpredicted lift and drag.The most likely cause of this discrepancy isthe use of grid adaption in SPLITFLOW; afixed grid is used in USM3D. SPLITFLOWclusters cells in the vicinity of the vortexwhere gradients are large, and thereby keepsnumerical dissipation to relatively lowlevels. Without grid adaption in the USM3Danalysis, the vortex core meanders to regionswhere cells are relatively large withcorrespondingly higher levels of dissipation.This issue needs to be further investigated tobetter assess the effectiveness of inviscidEuler analyses in predicting vortexbursting.7
For the transonic cases (M = 0.85),computed lift and drag coefficients generallycorrelated well with data for the entire rangeof angle of attack. It should also be notedthat the pitching moment correlation (notincluded here) showed that both codes predicted the trends but discrepancies with test data increased withincreasing α.
Typical results for the α = 20o case are shown in Figure 12 at three representative stations. Ingeneral, the computed surface pressures compared well with test data on the forebody station, and inparticular, increments due to compressibility were well predicted. For the wing-body stations, computedresults matched well with test data but discrepancies increased with increasing distance from the nose. Thediscrepancies were quite noticeable at the last station, especially for the subsonic case. The surface pressuresshow large overexpansion at subsonic speed that is much less noticeable at transonic speed.
MTVI TT Results−−Figure 13 shows correlation of computed and measured lift and dragcoefficients for the symmetric flow cases. For subsonic cases, the computed lift and drag coefficients fromboth codes correlated well witheach other and with experimentaldata for α < 20o where the modelexhibits benign vortical flow field.At higher angles of attack, resultsfrom both codes differed fromeach other as well as from data.The largest differences were seenfor the 30o case. Even though theSPLITFLOW code overpredictedlift and drag, the magnitude of the
Figure 12. Comparison of USM3D (left) and SPLITFLOW(right) predictions for compressibility effects on MTVI CTconfiguration, α = 20o, M = 0.4 and 0.85
Figure 13. Lift and drag correlation for MTVI TT configuration
FS 6
FS 4
FS 6
FS 2

47-9
discrepancy was not as large as that forthe CT case (Figure 11). For thetransonic cases, M = 0.85, computed liftand drag coefficients showed very goodcorrelation for the entire range of angleof attack. A particularly noteworthyfeature was the ability of both codes toaccurately capture the break in the liftand drag variation for α between 12.5o
and 17.5o. This break is due to wing andchine vortex interactions with the twinvertical tails.5 Also, both codes predictthe pitching moment trends (not includedhere), but discrepancies with test dataincreased with increasing angle of attack.
The computed surface pressuresgenerally compared well with test data atthe forebody station as shown in Figure14. Much like the CT case, the computedcompressibility increments were in goodagreement with the measured ones. Forthe two stations on the wing-body portionshown in Figure 14, computed resultsmatched well with test data. The resultsconfirm that the primary compressibilityeffects are well captured by the Eulersimulations using both USM3D andSPLITFLOW codes. This is especiallytrue for the increments.
3.4 Control EffectsThe prediction of control effects highlights the important role of CFD in vehicle design. Frequently,
the off-body flow interaction can lead to unanticipated changes in control effectiveness. CFD can provideimportant screening of potential problems. An extensive study8 was conducted using the ICE configurationto assess the effectiveness of the SPLITFLOW code in predicting aerodynamic characteristics due todeployment of leading-edge flaps as well as trailing-edge elevons and spoilers. Euler predictions capturedthe significant changes in flow characteristics and the direction of the force and moment increments. Datafrom an attached-flow case (elevon) and a large-scale separated flow case (spoiler) are included here.
First, results for the attached flow case for symmetrically deflected trailing-edge elevon on the ICEvehicle are shown in Figure 15. The normal force (CN), axial force (CA) and pitching moment (Cm)increments due to deflection match quite well with the measured increments except at 18o angle of attack,where the code overpredicts the normal force and nose-down moment. On further investigation, it was foundthat for some angles of attack such as this, the solution had difficulty in converging and the force andmoment predictions settled in at levels that did not correlate well with data. At other angles of attack bothabove and below the troublesome one, the solution proceeded much better in terms of convergence andpredictions correlated well with test data.
The CFD code generally predicted the trend in the force and moment data correctly, even more sofor cases of massive change in flow structure such as that caused by a spoiler deflection. This is illustrated inthe prediction of incremental forces and moments for the 60o deflected spoiler case shown in Figure 16.Once again predictions for some angles of attack agree well with data while others do not. The side forceand lateral-directional coefficients for this asymmetric deflection show good correlation with data trends,
FS 4
FS 6
FS 4
FS 6
FS 2
FS 4
FS 6
Figure 14. Comparison of USM3D (left) and SPLITFLOW (right)predictions for compressibility effects on MTVI TT configuration,α = 20o, M = 0.4 and 0.85

47-10
except for the highest angle of attack of 25degrees. It was found that the code would indicatechanges in the character of force data, such asremoval of a jog in the normal force curve orchange in slope of axial force. The large-scalephysical change in flow character is also predicted.
Visualization of the off-body flowstructure is a significant benefit of the CFDanalysis. An example of the flow around the ICEmodel at α = 20o with spoiler deflection of 60o isshown in Figure 17. The complete absence ofvortical structure on the starboard side illustratesthe code's ability to capture large-scale changes inthe flow. The computed results showed a largerecirculation zone behind the spoiler on thestarboard side, representative of the flowseparation observed in tests. Analysis of otherconditions indicates the ability of CFD to capturethese significant features in the flow field, andpredict force and moment increments, which areuseful for design. It is again noted that certaincombinations of angle of attack, side-slip angle,leading-edge geometry, and control surfacedeflection posed severe challenges to solutionconvergence. For some cases, the CFD solutioneither converged to a result that did not match themeasured data or failed to converge properly. Thismay be a manifestation of the use of pseudo-time-marching in the computations which could notaccurately capture the unsteadiness of the actualflow. Hinge-moment analysis at M = 0.9 wasapplied to the data comparisons for the ICEvehicle. It was found that the inviscid Eulermethods predicted the trend in hinge moment vsdeflection angle and hinge moment vs model αrelatively well for both the spoiler and the elevon.
The grids for these flows had on the orderof 400K to 500K cells for the entire flowfield of afull (both left and right side) vehicle. In somecases a pure Cartesian mesh was employed, whilein other cases prismatic cells were layered onto thesurface triangulation, while Cartesian cells wereused for regions away from the body. It was foundthat this level of grid resolution struck the properbalance between flow field resolution (whichincludes grid adaption) and run time.
The off-body flow for the ICE vehicle wascompared at α = 24o and β = 10o for two gridresolutions of approximately 400K and 800K cells.Refinement of the mesh to 800K cells did not
Figure 15. Correlation of incremental forces andmoments for ICE configuration with 30o deflectedelevon, M = 0.9
Figure 16. Correlation of incremental forces andmoments on ICE configuration for 60o spoilerdeflection, M = 0.9

47-11
result in better agreement with test data. The two solutions had the same vortex structure and vorticitypattern (displayed on the aft cutting plane). The larger grid did have ‘tighter’ vortices and a slightly largerrecirculation zone. The amount of grid refinement used, and the refinement criterion, determined the vortexsuction peak pressure levels. Upon grid refinement, the Euler code further intensified the core rotation andsuction peak pressures. This was especially true for the ICE model in sideslip in the vicinity of 24 degrees,where the Euler code results showed significant non-linearityversus the test data.
The repeatability of the predictions was consideredgood. For example, repeat runs were made at α = 24o and β =10o of a complex flow in which the initial condition wasbrought in from a converged solution at a different angle ofattack, then the solution was re-converged at the currentcondition using either additional adaption or no furtheradaption. The resulting flow structure and surface data closelymatched those obtained from the first analysis. The number ofiterations for complex flows was about three times more thanthat for the benign flow cases. Also, for the complex flowcases, the force and moment predictions required carefulanalysis. For example, even after a large number of iterations,the computed pitching moment for complex flows fluctuatedaround a mean value with fluctuation levels of the order of±0.03 or more. In contrast, for the benign flow cases, the fluctuation levels were much smaller, on the orderof ±0.0005. The larger levels of fluctuation indicated a lack of convergence. A much more extensiveanalysis of the results is required in such cases for proper interpretation.
4.0 Concluding RemarksBased on the results of the present study, it may be readily concluded that unstructured-grid Euler
methods are quite effective in predicting configuration effects, compressibility effects and control effects tosupport preliminary design of combat vehicles with sharp, swept leading edges. For configuration tradestudies in early design stages, Euler methods are efficient given the substantial improvement in turnaroundtime and cost over viscous Navier-Stokes analysis by a factor of 3 to 5.
In the present study, computed surface pressure predictions were found to be generally in goodagreement with test data in attached flow regions, and the primary vortex flow characteristics were wellcaptured. However, the Euler methods missed secondary vortex formation and the primary vortexplacement. The magnitude of suction peaks associated with primary vortex structures was overpredicted bythe Euler methods compared to measured data, and its location was slightly outboard. Grid adaption tovortex gradients proved very useful in improving the capture of primary vortex features, but in some casesresulted in overprediction of vortex peak suction. In a few cases where the test data indicated unsteady flow,the SPLITFLOW code with grid adaption did not fully converge and produced flow features that weredifferent from those observed in experiments. Clearly, Euler methods are not expected to correctly modelcertain features of vortex flows that are dominated by viscous effects. Therefore, user expertise in closelyexamining the solution process and carefully interpreting the results is critical.
Euler methods generally provided reliable trends for integrated forces and moments, which was oneof the assessment criteria of the present investigation. However, reliable predictions of force and momentdata−−in spite of discrepancies in the associated surface pressure distributions−−indicate that integrated dataalone may not be a true measure of the prediction accuracy. Also, for maximum effectiveness in apreliminary design environment, the accuracy of a simulation must be tempered with the turnaround timeand cost factors. Efforts should continue so that Euler and Navier-Stokes methods rapidly become fullyeffective tools for supporting preliminary design needs.
Figure 17. Flow field from SPLITFLOWanalysis of ICE configuration with 60o
deflected spoiler, M = 0.9, α = 20o

47-12
References
1. Raj, P., “Aircraft Design in the 21st Century: Implications for Design Methods (Invited Paper),” AIAA98-2895, June 1998.
2. Ghaffari, F., “On the Vortical–Flow Prediction Capability of an Unstructured-Grid Euler Solver,” AIAA94-0163, January 1994.
3 . Finley, D.B., “Euler Technology Assessment Program for Preliminary Aircraft Design EmployingSPLITFLOW Code with Cartesian Unstructured Grid Method,” NASA CR 4649, March 1995.
4 . Finley, D.B. and Karman, Jr., S.L., “Euler Technology Assessment for Preliminary AircraftDesign—Compressibility Predictions by Employing the Cartesian Unstructured Grid SPLITFLOWCode,” NASA Contractor Report 4710, March 1996.
5 . Kinard, T.A. and Raj, P., “Euler Technology Assessment for Preliminary AircraftDesign—Compressibility Predictions by Employing the Unstructured Grid USM3D Code,” NASAContractor Report 4711, March 1996.
6 . Kinard, T.A., Finley, D.B., and Karman, Jr., S.L., “Prediction of Compressibility Effects UsingUnstructured Euler Analysis on Vortex Dominated Flow Fields,” AIAA 96-2499, June 1996.
7. Raj, P., Kinard, T.A. and Vermeersch, S.A., “Vortical Flow Simulation Using an Unstructured-GridEuler Method,” ICAS-96-1.4.5, September 1996.
8 . Jordan, K.J., “Euler Technology Assessment – SPLITFLOW Code Applications for Stability andControl Analysis on an Advanced Fighter Model Employing Innovative Control Concepts,” NASA CR-1998-206943, March 1998.
9. Charlton, E.F., “Numerical Stability & Control Analysis Towards Falling-Leaf Prediction Capabilitiesof SPLITFLOW for Two Generic High-Performance Aircraft Models,” NASA CR-1998-208730,September 1998.
10. Hoeijmakers, H.W.M., “Modeling and Numerical Simulation of Vortex Flow in Aerodynamics,”Chapter 1, AGARD-CP-494, July 1991.
11. Raj, P., “Recent Developments in the Computational Solutions of Euler Equations (Invited Paper),”Third International Congress of Fluid Mechanics, Cairo, Egypt, January 1990.
12. Thomas, J. L., Taylor, S. L., and Anderson, W. K., “Navier-Stokes Computations of Vortical FlowsOver Low Aspect Ratio Wings,” AIAA-87-0207, January 1987.
13. Frink, N.T., Pirzadeh, S., and Parikh, P., “An Unstructured-Grid Software System for Solving ComplexAerodynamic Problems,” NASA CP-3291, 1995, pp. 289-308.
14. Karman, Jr., S.L., “SPLITFLOW: A 3D Unstructured Cartesian/Prismatic Grid CFD Code for ComplexGeometries,” AIAA 95-0343, January 1995.
15. Raj, P., Olling, C.R., Sikora, J.S., Keen, J.M., Singer, S.W., and Brennan, J.M., “Three-dimensionalEuler/Navier-Stokes Aerodynamic Method (TEAM),” WRDC-TR-87-3074 (Revised), Volumes I-III,June 1989.
16. Buning, P.G., Chan, W.M., Renze, K.J., Sondak, D.L., Chiu, I.T., and Slotnik, J.P., “OVERFLOWUser’s Manual, Version 1.6ab,” NASA Ames Research Center, January 1993.
17. Michal, T.R. and Johnson, J., “A Hybrid Structured/Unstructured Grid Multi-block Flow Solver forDistributed Prallel Processing,” AIAA 97-1895, June 1997.
18. Treiber, D. A. and Muilenberg, D. A., “Euler Technology Assessment for Preliminary Aircraft DesignEmploying OVERFLOW Code With Multiblock Structured-Grid Method,” NASA CR-4651, March1995.
19. Michal, T. R., “Euler Technology Assessment for Preliminary Aircraft Design - Unstructured/StructuredGrid NASTD Application for Aerodynamic Analysis of an Advanced Fighter/Tailless Configuration,”NASA/CR-1998-206947, March 1998.
20. Parikh, P., Pirzadeh, S., and Loehner, R., “A Package for 3-D Unstructured Grid Generation, Finite-Element Flow Solution and Flow Field Visualization,” NASA CR-182090, 1990.


![Conception de tubes à vortex de grande capacité pour ... · Température statique dans un tube à vortex obtenue lors d’unesimulation CFD avec le modèle k-ε[5] Conception de](https://img.dokumen.tips/doc/110x75/5b2a51947f8b9a93798b4d52/conception-de-tubes-a-vortex-de-grande-capacite-pour-temperature-statique.jpg)