Embed Size (px)
Citation preview

An assessment of biofuel use and burning of
agricultural waste in the developing world
Rosemarie Yevich and Jennifer A. LoganDepartment of Earth and Planetary Sciences, Harvard University, Cambridge, Massachusetts, USA
Received 24 June 2002; revised 8 October 2002; accepted 6 February 2003; published 10 October 2003.
[1] We present an assessment of biofuel use and agricultural field burning in thedeveloping world. We used information from government statistics, energy assessmentsfrom the World Bank, and many technical reports, as well as from discussions withexperts in agronomy, forestry, and agro-industries. We estimate that 2060 Tg biomass fuelwas used in the developing world in 1985; of this, 66% was burned in Asia, and 21%and 13% in Africa and Latin America, respectively. Agricultural waste supplies about33% of total biofuel use, providing 39%, 29%, and 13% of biofuel use in Asia, LatinAmerica, and Africa, and 41% and 51% of the biofuel use in India and China. We find that400 Tg of crop residues are burned in the fields, with the fraction of available residueburned in 1985 ranging from 1% in China, 16–30% in the Middle East and India, toabout 70% in Indonesia; in Africa about 1% residue is burned in the fields of thenorthern drylands, but up to 50% in the humid tropics. We distributed this biomassburning on a spatial grid with resolution of 1� � 1�, and applied emission factors to theamount of dry matter burned to give maps of trace gas emissions in the developingworld. The emissions of CO from biofuel use in the developing world, 156 Tg, are about50% of the estimated global CO emissions from fossil fuel use and industry. The emissionof 0.9 Pg C (as CO2) from burning of biofuels and field residues together is small,but nonnegligible when compared with the emissions of CO2 from fossil fuel use andindustry, 5.3 Pg C. The biomass burning source of 10 Tg/yr for CH4 and 2.2 Tg N/yr ofNOx are relatively small when compared with total CH4 and NOx sources; this source ofNOx may be important on a regional basis. INDEX TERMS: 1610 Global Change: Atmosphere
(0315, 0325); 1803 Hydrology: Anthropogenic effects; 1615 Global Change: Biogeochemical processes
(4805); KEYWORDS: biofuel use, global biofuel burning, agricultural waste burning, biofuel emissions
Citation: Yevich, R., and J. A. Logan, An assessment of biofuel use and burning of agricultural waste in the developing world,
Global Biogeochem. Cycles, 17(4), 1095, doi:10.1029/2002GB001952, 2003.
1. Introduction
[2] Biomass burning has a significant impact on globalatmospheric chemistry since it provides large sources ofcarbon monoxide, nitrogen oxides, and hydrocarbons, pri-marily in the tropics [Crutzen et al., 1979; Logan et al.,1981]. These gases are precursors of tropospheric ozone andinfluence the chemistry of the OH radical [Logan et al.,1981; Logan, 1985]. Two notable components of biomassburning are the incineration of wood, charcoal and agricul-tural waste as household fuel, and the combustion of cropresidue in open fields. As the developing world populationcontinues to rise, the contributions from these types ofbiomass burning increase [Woods and Hall, 1994] (herein-after referred to as WH94). A quantitative description of thespatial distribution of biofuel and open field burning isrequired to assess the impact of this burning on the budgetsof trace gases.
[3] Earlier estimates of global biomass burning wereformulated using simple quantitative descriptions and gen-eralizations. The burning of woodfuel was tied directly toforestry statistics published by the Food and AgricultureOrganization (FAO) of the United Nations, while burning ofagricultural residues in the developing and developed worldwas estimated as a fraction of the available residues [e.g.,Seiler and Crutzen, 1980; Crutzen and Andreae, 1990;Andreae, 1991; Hao and Liu, 1994]. Since many factorssuch as geoclimatic conditions, vegetation distribution,farming methods, and population densities influence thesetypes of biomass burning, simple global characterizations ofthese burning practices cannot provide reliable estimates.The purpose of this paper is to provide global distributionsthat reflect major regional differences in biomass burning.We derive more realistic representations of biofuel and openfield burning in the developing countries based on exami-nation of the diverse burning practices found in the tropics.A brief overview of these practices in the developed worldis also included. All estimates are based on informationpertinent to the specific year of 1985, the year of the GEIA
GLOBAL BIOGEOCHEMICAL CYCLES, VOL. 17, NO. 4, 1095, doi:10.1029/2002GB001952, 2003
Copyright 2003 by the American Geophysical Union.0886-6236/03/2002GB001952$12.00
6 - 1

inventories for NOx and SO2 [Benkovitz et al., 1996]. Wealso provide estimates for 1995 based on an extrapolation ofour inventory for 1985.[4] We begin with a review of previous global estimates
of biofuel and open field burning (section 2). We followwith a general discussion of biofuel use in developingcountries, including specific descriptions of fuelwood, char-coal, and crop residue biofuels (section 3). The methodol-ogy used in this study is described in section 4. Moredetailed information on biomass burning in each of Africa,Asia, and Latin America is contained in sections 5, 6, and 7.We discuss use of biofuels in the developed world briefly insection 8 and assess potential errors in our estimates forbiofuel use in section 9. We present our results for 1985 inthe form of global maps in section 10, and summarize ourfindings and compare them with the results of other similarwork in section 11. In section 12 we give estimates forbiofuels use and residue burning for the year 1995. Weinclude estimates of quantities of trace gases emitted frombiomass burning in section 13. Section 14 contains a briefdiscussion and conclusions.
2. Summary of Previous Work
[5] Earlier studies [Seiler and Crutzen, 1980; Crutzen andAndreae, 1990; Andreae, 1991; Hao and Liu, 1994] usedsimilar methods to calculate fuelwood use in the developingworld, basing their estimates in some measure on theassumption that the production of fuelwood as given inthe FAO Forest Products Yearbooks is equal to the fuel-wood consumption, with modifications using additionaldata from surveys and estimates of per capita use. Theirestimates vary from 620 to 1260 Tg dry matter for thedeveloping world (Table 1). Andreae calculates his esti-mate as the mean of the FAO fuelwood production and amean estimate of per capita usage throughout the tropicsof 1.3 kg/cap/day. He suggests that using only FAOfuelwood statistics is likely to give low estimates sinceFAO considers only the marketed fuelwood production. Anonnegligible portion of the fuelwood supply in thedeveloping world is the wood debris (twigs, branches,etc. lying on the ground) which the rural populationsgather for household fuel use [Openshaw, 1978] and whichis not included in the FAO Yearbook estimates.[6] Most previous studies provide a combined estimate for
agricultural residues that are burnt as fuel and those that areburnt in the open fields to dispose of the stubble and to returnnutrients to the soil. Seiler and Crutzen [1980] and Andreae[1991] proposed that 80% of available residues are burned indeveloping countries and 50% in developed countries.Crutzen and Andreae [1990] suggested that 25% of cropwaste is burned in the fields of developing countries in thetropics, while Hao and Liu [1994] assumed that 23% ofresidues are used as fuel and 17% are burned in the field.[7] The work of Hall and collegues (WH94) has been
seminal in shifting the focus of study of biomass combustionin the developing world from the use of woodfuels to a morecomprehensive picture of ’biofuels’ combustion includingthe burning of crop residues and dung as fuels. Theirestimates of biofuel use are based on the FAO fuelwoodand charcoal estimates, the Biomass Users Network country
studies, data from the U.N. Statistical Office, and, forcountries which have little information available, on thefollowing assumption: use of 2.74 kg/cap/day for ruralpopulations and 1.37 kg/cap/day for urban populations(WH94). Unfortunately, their study does not provide abreakdown by fuel type, nor is this breakdown easilydetermined (D. Hall, personal communication, May 1994).By converting the other estimates to energy units we findthat the WH94 value of 49.9 EJ biofuels combustion for thesum of developed and developing world is almost onequarter again as large as the high-end value in the range ofestimates of biofuel burning of Crutzen and Andreae [1990](19.7–39.3 EJ).
3. Biofuels
[8] Rural areas of developing countries depend primarilyon biomass for fuel [Smil, 1979; Cecelski et al., 1979;Meyers and Leach, 1989; Leach and Gowen, 1987]. Bio-fuels include the woodfuels (fuelwood: see Openshaw[1986] and charcoal), and agricultural waste, such as cropresidues and dung. The amount of biofuel consumed variesas climate (higher consumption for colder climates) [Leach,1988], and with the plenitude of fuel resource; where fuel iseasily obtained, more is consumed [Meyers and Leach,1989]. The choice of biofuel consumed depends on avail-ability, local customs, and season [Meyers and Leach,1989]. Generally, the sub-Saharan African populationdepends mainly on wood [Cecelski et al., 1979; Scurlockand Hall, 1990], as does the rural population in LatinAmerica. The population in Asia uses all biofuels [Cecelskiet al., 1979; Meyers and Leach, 1989]. Biofuels are alsomajor energy sources in the urban areas of the developingcountries [Barnes et al., 2001]. In the developed worldbiofuels are important [Hall, 1991], but provide a smallerfraction of total energy consumed [Woods and Hall, 1994;Blandon, 1983].
3.1. Woodfuels
[9] Woodfuel is the principal source of domestic energyin developing countries [Openshaw, 1974; Eckholm, 1975;Arnold and Jongma, 1978; de Montalembert and Clement,1983]. Woodfuel includes charcoal as well as firewood,brushwood, twigs, branches, and cut branches [Openshaw,1986]. Where available, fuelwood is generally the biofuel ofchoice [Arnold and Jongma, 1978; Openshaw, 1986].Climate and terrain are the two strongest natural influenceson the growth and abundance of the forest resources, andthese vary significantly throughout the developing world
Table 1. Fuelwood Combustion, Tg DM
Seiler andCrutzen [1980]
Crutzen andAndreae [1990]
Andreae[1991]
Hao andLiu [1994]
DevelopingAfrica 182 – 240 180Asia 397 – 858 320Latin America 164 – 170 120
Subtotal 743 – 1260 620Developed 113 – – –Totals 856 1050 1430 –
6 - 2 YEVICH AND LOGAN: BIOFUEL AND WASTE BURNING

[de Montalembert and Clement, 1983]. Even in countrieswith adequate fuelwood supply, the resource may be locatedfar from the more populated regions where it is needed[de Montalembert and Clement, 1983]. Alternative biofuelsare used in regions lacking adequate fuelwood [Smil, 1979].In countries where modern fuels are available and the ruralpopulation has the income to purchase them, fuelwood useis correspondingly lower [Cecelski et al., 1979]. The prob-lems of fuelwood supply and conversion in the humidtropics [Moss and Morgan, 1981] and in Latin America[Bogach, 1985], and projected fuelwood deficit throughoutthe world [Wood and Baldwin, 1985] have been discussedalso in earlier works [Earl, 1975; Openshaw, 1986].[10] A large fraction of urban populations in the devel-
oping countries relies on charcoal for cooking and industrialfuel [Barnes et al., 2001]. We consider charcoal as aseparate fuel since trace gases are emitted during itsproduction (WH94), and emissions from burning charcoaldiffer from those for wood. The carbonization process usedin converting wood to charcoal is generally inefficient, andvolatiles including CO2, CO, CH4, and nonmethane hydro-carbons (NMHC) estimated at 60% by weight of theoriginal wood are emitted (WH94). Openshaw [1978,1980, 1986] suggests that from six to twelve tons of woodare required to make one ton of charcoal.[11] Nearly all of charcoal production occurs in the
developing world [Lew and Kammen, 1994]. About halfof the world’s charcoal is produced in Africa, where it isused as a domestic fuel in many of the urban areas and as acooking fuel in eastern and northern regions [Foley, 1986;Hibajene et al., 1993]. In Asia, the pattern of charcoalconsumption varies from extensive use as a domestic fuel inboth urban and rural Thailand [Foley, 1986; Ishiguro andAkiyama, 1995], and as a large industrial fuel for the steelindustries in the Philippines and Malaysia [Foley, 1986], toa much smaller role in the domestic energy supply in India[Foley, 1986; Leach, 1987]. In Latin America, charcoal isnot a major household fuel, but is a notable source of energyfor the steel industries of Brazil [Woods and Hall, 1994;Bogach, 1985], Bolivia [World Bank (WB), 1994a], andParaguay [WB, 1984k]. A detailed overview of charcoalconsumption in the developing countries is given by Woodand Baldwin [1985].
3.2. Agricultural Residues
[12] Billions of tons of agricultural waste are generatedeach year in the developing and developed countries.Agricultural residue includes all leaves, straw and husks
left in the field after harvest, hulls and shells removedduring processing of crop at the mills, as well as animaldung. The types of crop residue which play a significantrole as biomass fuels are relatively few.[13] The single largest category of crops is cereals, with
global production of 1800 Tg in 1985 [FAO, 1986a]. Wheat,rice, maize, barley, and millet and sorghum account for28%, 25%, 27%, 10%, and 6%, respectively, of these crops.The waste products which are the main contributors tobiomass burning are wheat residue, rice straw and hulls,barley residue, maize stalks and leaves, and millet andsorghum stalks. Sugar cane (0.95 gigatons) provides thenext sizeable residue with two major crop wastes: barbojo,or the leaves and stalk, and bagasse, the crop processingresidue. The cotton crop also gives nonnegligible residue inthe form of stalks and husks, both of which are used asbiofuels. Four minor crops provide residue from processingthat is frequently used as fuel: palm empty fruit bunch andpalm fiber, palm shells, coconut residue, groundnut shells,and coffee residue.[14] Geographical distribution of crop residue (Table 2) is
skewed by large crop productions in India and China [FAO,1986a]. The other countries of southeast Asia have rice andsugar cane as dominant crops. In the Middle East, the cropmixture is more diverse with more cereals and less rice andsugar cane. In the drylands of the Near East and Mediter-ranean northern Africa, wheat and barley predominate. Inthe sub-Saharan Sahel in Africa, millet and sorghum are themain crops (Table 2). Farther south in the subhumid andhumid regions, maize is important. All three grains aregrown in the highlands of eastern Africa. In Latin America,the crop residues of maize and sugar cane provide signif-icant field and factory waste, with Brazil as the foremostcontributor.
[15] Crop residue accumulates in the fields and infactories. The waste from the agro-processing industriesaccumulates at the mills where the crop is prepared forconsumption. These include bagasse residue from sugarcane [WB, 1986f ], rice husks, cottonseed hulls, palm,coconut, groundnut, cashew, and coffee processing waste.Agroindustrial biomass waste is used mainly as fuel forthe processing industry, and is rarely transported anydistance from the mills for other purposes [Barnard andKristoferson, 1985; Openshaw, 1986]. It is generally un-palatable as fodder, and inaccessible, except locally, forhousehold fuel. A more comprehensive discussion of theseagro-industrial wastes and estimates of use as fuel isincluded in Appendix A.
Table 2. Geographic Distribution of Available Residue for Developing Continents (Percent of Total)
Maize andM and Sa
Wheat andBarley
CerealsRice
TotalCereals Cotton
SugarCane
MinorAgro-Industry Total
Asia 13 13 39 66 5 6 1 78China 8 6 15 29 3 1 0 33India 3 3 8 14 1 3 0 18
S. America 5 1 1 7 1 5 0 13Brazil 2 0 1 3 1 4 0 8
Africa 5 1 1 7 1 1 0 9Totals 24 16 40 80 7 12 1 100
aM and S = Millet and Sorghum.
YEVICH AND LOGAN: BIOFUEL AND WASTE BURNING 6 - 3

[16] In the developing world the grain residues are used invarious ways: household fuels and construction materials inwood-deficit regions, and livestock fodder in drylandregions, as described in sections 5, 6, and 7. The majorfield residues are sugar cane barbojo, and post-harvest grainresidues as well as cotton stalks. Traditionally, the barbojo isburned in the fields as a preharvest measure to facilitate theharvesting of the sugar cane [Williams and Larson, 1993].Cotton is a ‘‘woody’’ plant (T. Townsend, personal com-munication, 1999), a more likely substitute for fuelwood ashousehold fuel, and a less likely fodder source. In addition,cotton is susceptible to a large number of pests and plagues(R. Percy, personal communications, 1999), so the cottonplants are destroyed after harvest to curtail the spread of pestand disease [WB, 1986a, 1984g; Tothill, 1954; F. Ramalho,personal communication, 1999; C. Valderrama, personalcommunication, 1999; G. Matthews, personal communica-tion, 1999]. The cotton stalks are either: mechanicallydestroyed and the leftover ploughed down [Hadar et al.,1993], as in many Latin American countries where tractorsare more accessible (F. Ramalho, personal communication,1999; C. Valderrama, personal communication, 1999;G. Cuadrado, personal communication, 1999; R. Jones,personal communication, 1999); burned in heaps as inAfrica where tractors are scarce [Tothill, 1954; Poulain,1980] (G. Matthews, personal communication, 1999;L. Gray, personal communication, 1999; S. J. Carr, personalcommunication, 1996); or burned as fuel, as in severalAsian countries where fuelwood substitutes are needed(R. Chaudry, personal communication, 1999; T. Townsend,personal communication, 1999).
4. General Methodology
[17] Detailed information on local fuel consumption andlocal burning practices is required to construct a credibleassessment of biofuel consumption and open field burningin the developing world. This information is usually gath-ered in survey/questionnaire form. Reliable surveys aredifficult to obtain: Short-term surveys frequently cannotaccount for seasonal fluctuations in residue fuel availability[Hall and Mao, 1994]; surveys which describe rural villagehabits in one locale may not be adequate to describe thehabits of rural communities located in different geoclimaticregions within the same country [Hosier, 1985]; surveysmay not document factors which affect biofuel consumptionsuch as fuelwood moisture content [Openshaw, 1986].Difficulties in survey practice are discussed in detail byHosier [1985] and Kgathi and Zhou [1995], whileOpenshaw [1986] provides guidelines for constructingcomprehensive surveys of biofuel use.
4.1. Sources
[18] Energy assessments for individual countries con-ducted by the World Bank (WB) and the United NationsDevelopment Programme (UNDP) provided the mainsource material used in this analysis. These reports giveinformation on the available energy supplies, with dataobtained from government sources and/or from surveysconducted by participants involved in the country study.They usually include an annual energy balance which
contains estimates for use of fuelwood, charcoal, bagasse,and other agricultural residues as fuel. The quality of infor-mation varies, depending on the accuracy of the governmentsources, and the nature of the surveys [Openshaw, 1986;personal communication, 1994].[19] The second major group of sources comprises indi-
vidual reports for countries or regions. The information inthese reports ranges from direct quotations of governmentalenergy statistics on biofuel use to descriptions of verycareful surveys which included many participants, extendedthrough several seasons and several locations to provide acomprehensive database for analysis. Several of the moredetailed reports will be described in sections 5, 6, and 7.[20] Agricultural statistics usually published as govern-
ment documents give details on quantities of crops andlivestock distributed within the provinces or states of aparticular country. These were included in the literaturesurvey, as well as statistics on estimated forest land andpasture/grazing lands. Various treatises on biological pro-cesses were consulted to ascertain modes of biomassdecomposition in differing climatic conditions. Other botan-ical papers were examined to determine more informationabout crop growing, processing and consumption practicesin the developing world. Specific information on cropresidue use was frequently included.[21] Finally, discussions with personnel in the sugar and
cotton processing industry, agronomists, botanists, andforesters, and others with experience in the developingworld yielded a plethora of anecdotal evidence providingpersonal observation on burning practices indicative oflarge-scale burning activities within some developingcountries.
4.2. Procedure for Biofuels
[22] Estimates of biofuels consumption are presented fordifferent survey years in diverse energy, volumetric, andgravimetric units, sometimes disaggregated into individualtypes of biofuel use, sometimes reported as a total biofuelconsumption. (We discuss the conversion factors used inthis paper in Appendix B.) Most results were reported inmass or volume units; where these were the main sources(e.g., for Africa), we derived rates of fuel consumption percapita. The selection of a value to represent the fuelconsumption for a province or country was determined bycomparing all information available; where estimates werelacking, we examined data from neighboring provinces orcountries which had similar characteristics of climate, woodsupply, population, and biofuel burning. We gave priority toestimates from larger and more careful, detailed surveys; wealso chose values which were representative of tightlyclustered estimates that had been derived from differentsources and surveys. When consulting sources published indifferent years, we favored those which reported surveys asclose to our target year of 1985 as possible. We thenassumed that household fuel consumption correlates withpopulation size, and computed total biofuel use for a givencountry by multiplying the per capita usage by the popula-tion for that country for 1985 [United Nations, 1992]. Incontrast, most sources for Latin America provided biofueluse in energy units. We utilized this information directly in
6 - 4 YEVICH AND LOGAN: BIOFUEL AND WASTE BURNING

presenting the complete biofuel scene for Latin America inenergy units in section 7. We include a discussion of energycontent of various biofuels in Appendix B. In tables whichcompare biofuels use in Latin America and other develop-ing continents, all estimates are expressed in terms ofteragrams (Tg) of dry matter fuel consumed.4.2.1. Woodfuels[23] Woodfuels consumption statistics were separated into
fuelwood use, consumption of wood to make charcoal, andcharcoal consumption. Charcoal use in Africa is primarilyan urban phenomenon; we therefore present charcoal use inunits of weight-per-urban-capita.[24] Data on charcoal use is available either as the total
amount charcoal consumed or as the total amount of woodused to produce the charcoal. For both Africa and Asia, weestimate charcoal consumption in units of wood used toproduce charcoal, a number calculated from the amount ofcharcoal used by assuming an efficiency of charcoal pro-duction, the fraction by weight of the wood that ends up ascharcoal. All efficiencies in this paper are given as percentby weight. The maximum efficiency in converting wood tocharcoal is approximately 30%. Most charcoal production ismore inefficient than this [Openshaw, 1986], with the majorexception of the industrialized production in Brazil(WH94). Efficiencies adopted in this study are given inAppendix C.4.2.2. Residues as Biofuels[25] For estimating agricultural waste used as biofuel, a
many-faceted approach was taken. We converted anyreported estimates of agricultural waste used as biofuelsto units of dry matter per capita. In other circumstances,especially in Africa, when reports specified a woodfueldeficit and the use of agricultural residues as substitute fuel,we estimated the consumption of residues as fuel insufficient quantity to fill the woodfuel deficit [Openshaw,1986; Polycarpou and El-Lakany, 1993; Pokharel andChandrashekar, 1994]. Many reports noted that agriculturalresidues were not used for fuel, either owing to sufficientwoodfuels available, or need of the residue for otherpurposes. For the dung component of biofuels, we reliedon reports of specific use in a country.
4.3. Burning in Fields
[26] The open field burning of agricultural residue is welldocumented [e.g., Ponnamperuma, 1984; Williams andLarson, 1993; Poulain, 1980]. We used direct estimates ofamount burned in the fields, when available. The actualamount of crop residue as dry matter (DM) available forburning was determined from the country-by-country talliesof crops produced in 1985 [FAO, 1986a], the residue-to-crop ratios described below, and some estimate of thefraction of residue burned. For example, we prescribed thedefault fraction of available barbojo residue which burns tobe about 85%, since a complete burn is rare (J. Kadyzewski,personal communication, 1995); barbojo is used for con-struction in some regions (see section 6). In general, toestimate the percent burned, we referenced discussions withagronomists about the fate of residues of specific crops(cotton, sugar cane, wheat and barley) in different regions ofthe world, and constructed a plan of open field residue
burning for these particular crops. For the remaining resi-dues, we first ascertained whether residues were needed forother purposes, allotted the fraction of residue to eachdesignated use, and assumed the remainder was burned inthe fields, if this practice is common in the region. We wereoften informed that open field burning was never seen ingiven regions, or that, in contrast, all agricultural waste wasburned throughout the countryside.
4.4. Residue-To-Crop Ratios
[27] The amount of residue produced as compared withthe amount of crop grown depends on climate and fertilizeruse, and on whether the crop is a high-yielding variety[Barnard and Kristoferson, 1985]. Many low-income farm-ers in the developing world choose to save seed from the oldcultivars which produce a high stalk/crop ratio, rather thanpurchase the modern cultivar seed more often used in thedeveloped countries (J. Bradow, personal communication,1999; R. Percy, personal communication, 1999). We presenta summary of residue/crop ratios available from the litera-ture since 1985 in Table 3, which compares these valueswith the review of Barnard and Kristoferson [1985]. Wehave selected default ratios which we feel best approximateaverage residue/crop production ratios for each type ofresidue, acknowledging the variations in crop variety, cli-mate, and differences in farming practice, as shown inTable 3. Country specific ratios were used where substan-tially different from the default values.
5. Africa
[28] Africa has the lowest per capita consumption ofmodern fuels in the developing world [Davidson, 1992].Modern energy resources are concentrated in a fewcountries such as Nigeria, Libya, and South Africa [Kahaneand Lwakabamba, 1990]. Most African countries are pre-dominantly rural and economic output is low, so that thepopulation cannot afford to buy oil-based fuels. The ruralpopulation (and often the urban population also [Cecelski etal., 1979;Barnes et al., 2001]) relies on wood and charcoal asthe main fuels for domestic consumption [de Montalembertand Clement, 1983].
5.1. Woodfuels
[29] Africa is marked by contrasts in geoclimatic andvegetation conditions, from the northern drylands throughthe large desert and savanna zones with fuelwood deficits,to the forest zones with fuelwood surplus, to the morepopulous temperate eastern highland areas. Lack of infra-structure makes the transportation of wood from surplus todeficit regions difficult. The per capita woodfuel con-sumption depends on availability and demand, and rangesfrom an estimated low of 0.05 kg/cap/day in Lesotho toupwards of 3.0 kg/cap/day in Eastern Highland countries(see Table 4).
5.1.1. Fuelwood[30] To facilitate analysis of fuelwood availability and
consumption, we subdivided the continent into regions(Table 4), grouping together neighboring countries thatshare similar woody vegetation and population density.
YEVICH AND LOGAN: BIOFUEL AND WASTE BURNING 6 - 5

Note, however, that an average per capita fuelwood usecannot describe local and regional variations.[31] The Mediterranean countries of North Africa have
more in common climatologically with the rainfed drylandsof the Middle East than with sub-Saharan Africa. Fuel-wood consumption is negligible in oil-rich states like Libya[de Montalembert and Clement, 1983] and modest incountries like Algeria, which, though a large oil-producer,has forested mountain zones and a sizeable low-incomerural population (Table 4).[32] The Sahel countries to the south are sparsely popu-
lated with desert and subdesert mixed with savanna regions.Chad, which has desert in the north, and desertification anddrought conditions in the south, has the lowest fuelwoodconsumption of 0.3 kg/cap/day. Mali, with its sufficient-to-surplus wood in western and southern regions [WB, 1991c],but major woodfuel shortages in the three northeasternregions (identified using satellite data [WB, 1992b]) hasthe highest consumption of 1.49 kg/day. Sudan is an excep-tion within this group in that its northern climate is desert,while its southern regions have tropical forests and savannas.[33] The coastal countries of West Africa contain areas of
wooded savanna and dense forest, with sparse to heavypopulation density. The fuelwood consumption estimatesare mostly within the range of 1.3–1.7 kg/cap/day. Guinea,which has extensive forest cover and abundant fuelwoodresources, is a notable exception, with 3.2 kg/cap/day [WB,1986d]. The country which dominates fuelwood use inAfrica, Nigeria, is included in this group, although itsnorthern provinces are in the Sahel region. Our estimate forNigeria is based on the Silviconsult, Ltd., survey (over 2350households) of the five northern provinces [Hyman, 1994]and the very careful surveys of Kersten et al. [1998] in theOsun State of southern Nigeria. Kersten et al. [1998] foundthat even in the rural areas where an adequate supply of woodwas available, there was low per capita consumption.[34] The countries of Central Africa have large zones of
dense forest with low population density, and relatively high
consumption rates, 1.5–2.5 kg/cap/day. Some countriessuch as Gabon and Equatorial Guinea are relatively pros-perous [WB, 1988c] and their populations use substantialquantities of modern fuels in addition to woodfuels.[35] The highest fuelwood consumption rates occur in
the highland countries of southeastern Africa, at 1.89 to3.24 kg/cap/day, a consequence of plentiful forest resour-ces and use of fuels for heating. Malawi [WB, 1982g],Uganda [O’Keefe, 1990], and Zambia [WB, 1983a] haveextensive forest reserves. Kenya has productive forestland in the central highlands [Senelwa and Hall, 1993],and Tanzania has about 40% forest cover, much of thismiombo woodlands [Hosier et al., 1990; WB, 1984n].[36] Countries of the eastern and southern drylands region
include sparsely populated savanna areas and dry moun-tainous zones of degraded forest cover [de Montalembertand Clement, 1983]. In many areas crop residues and dungare used as alternate fuels to supplement fuelwood, sincefuelwood is scarce. Fuelwood consumption is fairly low,between 0.05 kg/cap/day in Lesotho and 1.84 kg/cap/day inEthiopia, with an outlier of 2.04 kg/cap/day in Botswana.[37] Within the island group, there is a wide range of
fuelwood consumption. The largest population inhabitsMadagascar which is densely populated and whose fuel-wood resources are being rapidly depleted.[38] Five countries, Nigeria, Ethiopia, Tanzania, Kenya,
and Zaire use 138 Tg/yr of fuelwood or about 50% of thetotal for Africa (Table 4). Usage varies from 1.50 kg/cap/day in Nigeria to 3.21 kg/cap/day in Tanzania. The detailedsurveys for Nigeria were discussed above. Ethiopia isclassified in the Eastern/Southern Drylands region, butstraddles the Eastern Highlands region; the per capitaconsumption of 1.84 kg/cap/day is somewhat high for theEastern/Southern Drylands region. For Tanzania, Hosier etal. [1990] compared the results of four major reports onwoodfuel balances, includingKaale [1983] on districts facingwood-deficit, Openshaw’s [1984] analysis based on surveysin the 1970s, a World Bank Energy Sector Management
Table 3. Residue-to-Crop Ratios
Crop Selected Value Range Barnard and Kristoferson [1985] Referencesa
Wheat Res. 1.3 0.9–1.6 0.7–1.8 1, 2, 3, 4Maize Stalks 2.0 0.9–4.0 1.2–2.5 5, 2, 4, 6, 7, 8, 9Rice Husks 0.2 0.17–0.22 0.3 10, 7, 8, 9, 11, 12Rice Straw 1.5 0.8–2.5 1.1–2.9 13, 2, 6, 7, 9Barley Res. 1.6 1.4–2.0 0.9–1.8 14, 4, 5Millet/Sorghum Stalks 2.0 1.5–3.7 2.0–4.6 9, 2, 5, 7, 8, 15Sugar Cane Bagasse 0.15 0.05–0.2 – 3, 16Sugar Cane Barbojo 0.17 0.09–0.28 – 3, 16Cotton Hulls 0.26 – – 9Cotton Stalks 4.0 3.0–5.5 3.5–5.0 21, 2, 5, 6, 15Groundnut Shells 0.4 0.25–0.5 0.5 17Coffee Res. 0.92 0.3–1.8 – 18, 8, 15Coconut Shells+ 1.9 – 0.7–4.5 19Palm Empty Fiber Bunch 0.39 – – 20Palm Fibers 0.4 0.2–1.1 – 20Palm Shells 0.23 0.2–1.0 – 20
a1: Hall et al. [1993]; 2: Poulain [1980]; 3: Williams and Larson [1993]; 4: World Bank (WB) [1984e]; 5: Senelwa and Hall[1993]; 6: WB [1991c]; 7: WB [1986d]; 8: WB [1987a]; 9: WB [1983g]; 10: Waddle [1985]; 11: Roberts [1973]; 12: F. A.Bernardo, personal communication, 1994; 13: Ponnamperuma [1984]; 14: based on Williams and Larson [1993]; 15: WB [1984g];16: J. Kadyzewski (personal communication, 1995); 17: based on WB [1986d, 1991c, 1983g]; 18: WB [1985a]; 19: use Barnardand Kristoferson [1985]; and 20: calculations based on Husin et al. [1987], Salam [1987], and Shamsuddin and Nor [1987].
6 - 6 YEVICH AND LOGAN: BIOFUEL AND WASTE BURNING

Table 4. Fuelwood Use in Africa
Country Totals, Tg DM/yr Per Capita, kg/cap/day Other Estimates Referencesa
N. DrylandsAlgeria 7.34 0.92 – 1Egypt 0.88 0.05 – 1Libya 0.00 0.00 – 1Mauritania 0.66 1.02 – 2Morocco 6.70 0.78 1.4 3, 1Tunisia 1.11 0.42 0.8 4, 1W. Sahara 0.00 0.00
Total 16.26
SahelChad 0.55 0.30 5Mali 4.46 1.49 0.8, 1.2, 1.5, 1.8, 2.5 6, 7, 7, 8, 7, 7Niger 2.82 1.17 1.4 7, 9Senegal 1.15 0.48 0.2, 1.4, 1.6 11, 7, 10, 7Sudan 18.16 2.28 1.0, 1.4, 1.9, 2.6 78, 5, 12, 13, 80
Total 27.14
West CoastBenin 1.92 1.30 – 15Burkina Faso 4.94 1.70 1.5, 1.6, 2.0 16, 17, 7, 7Gambia 0.63 2.33 1.9, 2.3, 2.4 19, 18, 13, 14Ghana 7.94 1.71 1.1, 1.2 20, 21, 7Guinea 5.48 3.22 3.0 22, 23Guinea-B 0.39 1.22 – 24Ivory Coast 5.69 1.57 0.8, 1.2 21, 25, 7Liberia 1.79 2.24 0.6, 3.7 26, 7, 7Nigeria 52.39 1.50 1.0, 1.2, 1.7, 1.9, 2.0, 2.7 75, 7, 7, 27, 28, 14, 14Sierra Leone 2.03 1.58 1.9, 2.2, 2.5 29, 21, 7, 7Togo 1.55 1.40 – 30
Total 84.75
Central AfricaAngola 6.33 1.98 1.2 31, 32Cameroon 5.90 1.59 5Cen. Af. Rep. 1.89 1.99 5Congo 1.14 1.61 1.1, 1.5 21, 33, 21Eq. Guinea 0.29 2.54 – 5Gabon 0.58 1.61 0.7 70, 71Zaire 17.41 1.54 1.5 34, 5
Total 33.54
E. HighlandsKenya 14.03 1.89 1.9, 2.0, 2.1, 2.2, 2.7, 2.9, 3.1, 3.3 74, 13, 14, 73, 14, 37, 21, 35, 38Malawi 7.91 3.07 2.7, 3.4 39, 28, 40Tanzania 25.46 3.21 2.2, 3.1, 3.5, 4.0, 4.4 76, 13, 41, 28, 41, 13Uganda 12.45 2.18 2.6, 2.7, 3.0 42, 43, 36, 13Zambia 7.95 3.24 1.9, 2.3, 2.4, 3.2 78, 46, 45, 28, 44
Total 67.80
E. and S. DrylandsBotswana 0.80 2.04 1.3, 2.3, 2.8 50, 48, 49, 47Burundi 2.15 1.25 0.4 72, 51Ethiopia 29.11 1.84 0.7, 1.5, 1.6 52, 53, 5, 21Lesotho 0.03 0.05 0.1, 1.2 54, 5, 55Mozambique 8.37 1.66 3.1 56, 57Namibia 0.28 0.50 – 58Rwanda 3.85 1.73 1.1 48, 59Somalia 2.28 0.98 – 60South Africa 9.08 0.79 78Swaziland 0.30 1.28 1.1 61, 28Zimbabwe 4.70 1.55 1.7, 1.8 62, 28, 63
Total 60.95
IslandsCape Verde 0.09 0.77 – 64Comoros 0.28 1.66 – 65Madagascar 3.43 0.94 – 66Mauritius 0.23 0.63 0.0 67, 5
YEVICH AND LOGAN: BIOFUEL AND WASTE BURNING 6 - 7

Assistance Programme (ESMAP) [World Bank, 1984n] as-sessment of the woodfuel-deficit regions, and work byLuhanga and Kjellstrom [1988] based on remote sensinginformation. Hosier et al. [1990] analyzed the differences inthese studies and noted that, while different in detail for thetwenty regions of Tanzania, their average estimates wereremarkably similar.[39] Hosier [1985] compared the results of his survey
of energy consumption in 1981 taken in rural householdsin different ecological zones of rural Kenya with theresults of a 1978/1979 survey among the same house-holds. He noted that the average consumption rate offuelwood had decreased from 2.44 kg/cap/day to 2.17 kg/cap/day. More recently, Kituyi et al. [1999] conductedextensive surveys in both rural and urban regions ofKenya in early 1997 using Hosier’s methods and esti-mated a rate of 1.75 kg/cap/day. We derived a weightedper-capita firewood use of 1.89 kg/cap/day from the ruralestimate of Hosier [1985] and the urban estimate ofO’Keefe and Raskin [1985] along with the work of Kituyiet al. [1999].[40] Detailed analyses are available for some countries
that make smaller contributions to fuelwood use in Africa.Country-by-country summaries are included in O’Keefe andMunslow’s [1984] report on southern Africa and Karekeziand Mackenzie’s [1993] discussions on energy options.Several studies combine aerial and satellite remote sensingtogether with concomitant ground surveys to define coher-
ent data pictures of biomass energy supply and demand[Hall and Mao, 1994; WB, 1991c].5.1.2. Charcoal[41] Africa has the largest per capita charcoal use among
the developing continents [Lew and Kammen, 1994]. Infor-mation on charcoal use is provided in Table 5.[42] The greatest per capita use is in the East African
Highlands. These countries have a substantial wood supplywhich can be converted to charcoal and then transported toregions of demand. By contrast, little charcoal is used in theSouthern Drylands. Urban users in Zimbabwe and Swazilandprefer firewood and coal [Hemstock and Hall, 1997]. Nocharcoal is produced in Botswana [Wisner, 1984]. In Lesotho[Frolich, 1984], Botswana [Hall and Mao, 1994], andNamibia (K. Openshaw, personal communication, 1994),the urban population uses firewood, kerosene, and coal.[43] Sudan is unusual in that charcoal is significant as an
energy source for both the urban and rural populations[Digernes, 1977; Craig, 1991]; almost 80% of the charcoalconsumed in the Central Region is used by the ruralpopulation [Elgizouli, 1990]. This explains the very highcharcoal use expressed in per urban-capita units in Table 5.[44] Among the remaining countries, there are no obvious
regional preferences. For West Africa, the urban populationsof Burkina Faso, Mali [WB, 1991c], and Niger prefer usingfirewood to charcoal, but the populations in the largest citiesof Ghana use more charcoal [Foley, 1986]. Similarly,surveys indicate that city dwellers in Guinea [WB, 1986d],
Table 4. (continued)
Country Totals, Tg DM/yr Per Capita, kg/cap/day Other Estimates Referencesa
Sao Tome 0.10 2.56 – 68Seychelles 0.00 0.25 – 69
Total 4.13Africa Total 294.57
aExplanation of references: 1: de Montalembert and Clement [1983]; 2:World Bank (WB) [1985c]; 3: WB [1984e]; 4: WB [1992a]; 5:Meyers and Leach[1989], mostly from FAO Yearbook of Forest Products; 6: WB [1992b]; 7: Kahane and Lwakabamba [1990]; 8: WB [1991c]; 9: WB [1984f]; 10: WB[1983g]; 11: Lazarus et al. [1994]; 12: Abu Sin and Davies [1991]; 13: Arnold and Jongma [1978]; 14: Moss and Morgan [1981]; 15: WB [1985d]; 16:WB [1986a]; 17: Ernst [1977]; 18: WB [1983k]; 19: Openshaw [1978]; 20: WB [1986c]; 21: Davidson [1992]; 22: WB [1986d]; 23: WB [1986d]; 24: WB[1984i]; 25: WB [1985a]; 26: WB [1984o]; 27: WB [1993b]; 28: Raskin and Lazarus [1991]; 29: WB Sierra Leone [1987e]; 30: WB Togo [1985g]; 31: WB[1989]; 32: Bhagavan [1984]; 33: WB Congo [1988b]; 34: WB Zaire [1986b]; 35: Senelwa and Hall [1993]; 36: Cecelski et al. [1979]; 37: WB [1982a];38: O’Keefe et al. [1984]; 39: WB [1982g]; 40: Scobey [1984]; 41: WB [1984n]; 42: WB [1983i]; 43: Bashou [1990]; 44: WB [1983a]; 45: Hibajene et al.[1993]; 46: Ng’andu and Mwanza [1990] based on FAO; 47: WB [1984j]; 48: Hall and Mao [1994]; 49: Diphaha and Burton [1993]; 50: Wisner [1984];51: WB [1982c]; 52: WB [1984g]; 53: Hall [1991]; 54: WB [1984b]; 55: Frolich [1984]; 56: WB [1987b]; 57: O’Keefe and Munslow [1984]; 58: WB[1993a]; 59: WB [1982e]; 60: WB [1985l]; 61: WB [1987c]; 62: Hemstock and Hall [1997]; 63: WB [1982f]; 64: WB [1984h]; 65: WB Comoros [1988a];66: WB [1987a]; 67: Baguant [1992]; 68: WB [1985e]; 69: WB [1984d]; 70: same as Congo; 71: WB [1988c]; 72: same as Zaire; 73: Banwell and Harriss[1992]; 74: estimate based on Hosier [1985], O’Keefe and Raskin [1985], Kituyi et al. [1999]; 75: estimate based on Hyman [1994] and Kersten et al.[1998]; 76: estimate based on data of Hosier et al. [1990]; 77: Woods [1990]; 78: estimate of Keith Openshaw based on data of WB [1983h]; 79: Scholesand van der Merwe [1995]; and 80: Mukhtar [1978].
Notes to Table 5aAssume 15% efficiency in converting wood to charcoal.bCharcoal is mainly an urban phenomenon in Africa.cExplanation of references: 1: WB [1982c]; 2: O’Keefe [1990]; 3: Senelwa and Hall [1993]; 4: Meyers and Leach [1989]; 5: WB [1982a, 1982b, 1982c,
1982d, 1982e, 1982f, 1982g, 1982h]; 6: Foley [1986]; 7: Hall and Mao [1994]; 8: K. Openshaw, personal communication, 1994; 9: WB [1983i]; 10:Barnes and Qian [1992]; 11: Hibajene et al. [1993]; 12: Hemstock and Hall [1997]; 13: Frolich [1984]; 14: WB [1993a]; 15: K. Openshaw, personalcommunication, 1994; 16: WB [1983h] and assuming 20% efficiency in charcoal production; 17: WB [1989]; 18: Bhagavan [1984]; 19: WB [1985d]; 20:World Wildlife Fund [1993]; 21: WB [1984h]; 22: WB [1988a]; 23: WB [1988b]; 24: WB [1984g]; 25: WB [1986c]; 26: WB [1986d]; 27: WB [1984i]; 28:WB [1985a]; 29: Kahane and Lwakabamba [1990]; 30: WB [1987a]; 31: WB [1991c]; 32: WB Mauritania [1985a, 1985b, 1985c, 1985d, 1985e, 1985f,1985g, 1985h, 1985i, 1985j, 1985k, 1985l]; 33:WB [1984e]; 34:WB [1984f]; 35: Lazarus et al. [1994]; 36:WB [1983g]; 37:WB [1987e]; 38:WB [1985l];39: WB [1985g]; 40: WB [1992a]; 41: estimated from Morocco; 42: WB [1986b]; 43: Openshaw [1997b] assumes 23.6% conversion efficiency; 44:estimate based on Hosier et al. [1990]; 45: Woods [1990]; 46: estimate based on Hosier [1985], Mungala and Openshaw [1984], and Kituyi et al. [1999].
dBotswana, Lesotho, South Africa, Swaziland.eAssume 20% efficiency in converting wood to charcoal.
6 - 8 YEVICH AND LOGAN: BIOFUEL AND WASTE BURNING

Togo [WB, 1985g], Senegal [Lazarus et al., 1994; Foley andvan Buren, 1982], and Sierra Leone [WB, 1987e] are heavycharcoal consumers.
5.2. Agricultural Residues
[45] Crop residue produced in Africa accounts for about10% of the total agricultural residue in the developing
world, as shown in Table 2 [FAO, 1986a]. We examinethe fate of these residues in the five agro-climatic regionsdescribed by McIntire et al. [1992], and results are pre-sented in Table 6. About 80% of wheat and barley is grownin the rainfed drylands of the northern coast, while a similarfraction of millet and sorghum is grown in the sub-Saharansemi-arid Zone. Egypt, Madagascar, and Nigeria provide
Table 5. Charcoal Use in Africa
Country Total Wood Needed, Tga Choice kg Charcoal/Urbancap/yrb Other Estimates Referencesc
Eastern HighlandsBurundi 0.2 165 – 1Kenya 6.4 283 306, 459, 562, 594 46, 2, 3, 4, 5Mozambique 2.6 217 – 6Rwanda 0.4 197 – 7Tanzania 4.5 177 125, 170, 187, 290, 353 44, 6, 6, 2, 8, 6Uganda 1.9 192 184 9, 2Zambia 5.1 256 160, 168, 158 45, 10, 6, 11
Total 21.1
Southern DrylandsNamibia <0.1 8 – 14Zimbabwe <0.1 1 – 12Othersd <0.1 0 7, 12, 13, 15
Total <0.0
Sudane 15.0 667 420 16, 6
Rest of AfricaAngola 1.3 73 185 17, 18Benin 0.1 27 – 19Burkina Faso 0.1 12 – 10Cameroon 0.6 24 – 20Cape Verde <0.1 3 1 10, 21Cen. Af. Rep. 0.4 49 – 20Chad 0.4 53 – 15Comoros <0.1 1 – 22Congo 0.3 40 10 20, 23Djibouti 0.1 28 – 15Egypt 0.1 1 – 15Eq. Guinea 0.1 125 – 20Ethiopia 1.3 43 36 24, 4Gabon <0.1 3 – 20Gambia <0.1 22 – 15Ghana 3.0 110 – 25Guinea 0.5 57 – 26Guinea-B 0.1 61 – 27Ivory Coast 1.1 41 – 28Liberia 0.7 189 – 29Libya 0.1 4 – 15Madagascar 1.2 84 – 30Malawi 0.6 103 – 43Mali 0.4 34 – 31Mauritania 0.1 143 44 10, 32Mauritius <0.1 9 – 15Morocco 0.8 13 – 33Niger <0.1 4 – 34Nigeria 1.2 12 – 15Reunion <0.1 7 – 15Sao Tome <0.1 41 – 20Senegal 1.8 162 82, 115 15, 35, 36Sierra Leone 1.0 169 63 15, 37Somalia 1.2 113 55 15, 38Togo 0.3 110 – 39Tunisia 0.2 7 – 40Western Sahara <0.1 6 – 41Zaire 4.0 49 52 15, 42Total 23.1Total Africa 59.2
YEVICH AND LOGAN: BIOFUEL AND WASTE BURNING 6 - 9

62% of the rice residues in Africa, and Egypt and Sudantogether produce 47% of the cotton residues. Maize isgrown for the most part (about 75%) in the eastern countriesof Africa, from Egypt south through the temperate high-lands countries to, and including, South Africa. Most of theminor agro-industrial crop waste of palm (95%), coffee(56%), groundnut (50%), and coconut (40%) is producedin the tropical subhumid and humid zones.5.2.1. Rainfed Drylands Zone[46] The residues of the wheat and barley grown in
Mediterranean North Africa are generally used as livestockfeed (Figure 1) [Hadjichristodoulou, 1994; Whitman et al.,1989], similar to practices in the Near East (section 6.2). InAlgeria, barley is grown primarily for fodder [Tully, 1989].In Morocco, the cereal crop residue and barley crops are themain forage for the ruminant livestock [Tully, 1989; Fenster,1989]. Once the residue has been harvested for winterfeeding, the ruminants are allowed to graze the remainingstubble. We assumed 99% of the residues are used forfodder, and, as there is evidence of burning where livestockare few [United Nations Environment Programme, 1977],
we arbitrarily assumed that 1% of residues are burned in thefield before planting (Figure 1, Table 6).5.2.2. Semi-Arid Sub-Saharan Zone[47] This zone with annual precipitation of 200–
1000 mm/yr and frequent drought is a region of low biomassproductivity, lacking forest cover. The major crops whichcan be grown without irrigation are millet, sorghum andcowpea [Christensen, 1994; Norman et al., 1981]; maize,groundnut, rice, and cotton are also grown. This regionproduces the most agricultural residue in Africa, in partbecause of the high residue-to-crop ratios from millet andsorghum and maize. As in the drylands zone, crop residuesare a good source of feed for livestock, especially in the post-harvest and dry seasons [Tothill, 1954: Norman et al., 1981;Lamers et al., 1996; McIntire et al., 1992; Sandford, 1989].Crop residues are also needed as household fuel [Ernst,1977]. Sorghum and maize stalks are important constructionmaterials [Reddy, 1981; F. Harris, personal communication,1995; M. Mortimore, personal communication, 1995].Whatever crop residue remains after these uses is eitherdecomposed, eaten by termites [Ofori, 1989;Miracle, 1967],
Table 6. Agricultural Residues in Africa
Region Residue Available, Tg DM Biofuels, Tg Burn in Fields, Tg Total Burned, Tg (%)
Rainfed Drylands 15 <1 <1 �1 (5)Semi-Arid Zone 70 19 21 40 (57)Sub-Humid Zone 39 9 10 19 (49)Humid Zone 15 3 7 10 (67)Eastern Highlands 27 13 6 19 (70)South Africa (sugar cane) 7 3 4 7 (100)Africa 173 47 48 95 (55)
Figure 1. Crop residue use (%) in Africa distributed within five major geoclimatic regions: EasternHighlands, Semi-Arid Zone, Sub-Humid Zone, Humid Zone, and Rainfed Drylands Region (RANER),plus total Africa. Residue use categories are as follows: biofuel, burning in the fields, decomposition ofresidue, and fodder for livestock. (Note that fodder use for RANER is 96%, but is truncated at 50%.)
6 - 10 YEVICH AND LOGAN: BIOFUEL AND WASTE BURNING

or burned in the open field prior to the planting season[Watts, 1987].[48] Livestock are integral to the lives of the farming
and transhumant herder populations. In detailed aerial andground surveys of land use covering 1.5 � 106 km2 insub-Saharan Africa, a strong correlation was found be-tween livestock density and the amount of cultivated land[Wint and Bourn, 1994]. While many tribesmen areexclusively stock owners, farmers who do not own anylivestock are rare [Pingali et al., 1987; Mortimore, 1987;Dederi, 1990; FAO, 1986a, 1986b]. The rural populationneeds crop residues for both fuel and fodder [Alhassan,1990; Umunna and Alawa, 1990; Morgan, 1980]. InBurkina Faso [Sivakumar and Gnoumou, 1987], Mali[Dicko and Sangare, 1986], and Niger [Reed, 1992],reports provide evidence of large herds of cattle, sheep,and goats grazing post-harvest crop residues.[49] While the importance of cereal residues as fodder is
evident [Oyenuga, 1968], the task of quantifying this use isdifficult. We relied primarily on measurements of vegetationgrazed in millet and sorghum fields. In Niger, farmersusually leave the residue of the millet crop in the fieldsfor cattle to graze [Reed, 1992]. Measurements showed that100% of the millet leaves and about 30% of the millet stemswere eaten by cattle [McIntire et al., 1992]. In neighboringNigeria, the main use of sorghum straw is for post-harvestand dry season animal feed [Alhassan, 1990; Umunna andAlawa, 1990]. Studies on grazing habits indicate that ineight weeks after harvest, cattle graze almost all leaves, 47%of millet stalks and 40% of sorghum stalks [Powell, 1985];another study suggests that passing ruminants graze 34% ofthe total edible sorghum residue left in the fields [van Raayand de Leeuw, 1971]. These data indicate that 30–43% ofmillet and sorghum residue collectively are grazed by cattle.Given that sizeable numbers of sheep and goats also grazein the semi-arid zone, we selected the upper end of therange, 43%, to represent the amount of millet and sorghumstalks used for fodder.[50] Straw and stalks in the semi-arid zone are used in
construction of fences, houses, and compounds [Reddy,1981; van Raay, 1975]. In this case, post-harvest milletand sorghum fields are burned rapidly to clear leaves; thestalks are then cut and bundled for construction use [WB,1985d]. As much as two thirds of available sorghum stalksare estimated to be used for construction in Kano, Nigeria(F. Harris, personal communication, 1995). On farms withno livestock, millet straw is often used as a mulch [Poulain,1980]. We estimate that 20% of residue is allocated to thefollowing categories: construction use, mulching, low-leveldecomposition in this dry region, and termite attack.[51] A significant portion of crop residue in this zone is
used for household fuel (Table 6). Figures for the estimatedwoodfuel deficit in the northern provinces of Benin [WB,1985d], Burkina Faso [WB, 1986a], Mali [WB, 1991c],Togo [WB, 1985g], and Nigeria [WB, 1993b; Federal Officeof Statistics, 1986; Population Association of Nigeria,1991] together with estimates of the rural population ineach province were combined to give a crude guess as toper capita woodfuel deficit. From this, a per capita residue-as-substitute-fuel was estimated, and the corresponding
amount of residue needed as fuel calculated. For thosecountries and regions where surveys of residue biofueluse were reported, these estimates superceded our roughcalculations.[52] To summarize, approximately 60% of the residue
was apportioned for nonburning uses, with the remaindereither burned as household fuel or as trash in the field. Weuse country specific reports as guidelines for partitioning theleftover residue between these two types of burning(Table 6). The farmers burn the leftover stubble to releasenutrients into the soil in preplanting field preparation inMarch and April [Watts, 1987; Poulain, 1980].5.2.3. Sub-Humid Zone[53] The subhumid zone covers a band south of the semi-
arid region through the center of west Africa and into eastand southern Africa. This zone is better suited for agricul-ture, with 1000–1500 mm/yr rainfall [McIntire et al., 1992]and a growing period of 6 to 9 months. A greater variety ofcrops is grown here, with more maize and rice than in thesemi-arid zone. However, this zone is less favorable forlivestock, due to prevalence of trypanosomiasis and otherlivestock diseases [Areola, 1991; Sivakumar and Gnoumou,1987]. In estimating fodder use of the residues for thelivestock, we note that millet and sorghum are grown inroughly equal proportion in this area; using the post-harvestgrazing measurements of Powell [1985] as a guide, weassume 43% of millet and sorghum residue are used forfodder. We assume that maize residue is used in similarproportions. We note that much of the crop residue decom-poses in this zone, given the favorable temperature andmoisture conditions (see Appendix D).[54] Most countries, with the exceptions of Malawi and
Ivory Coast, have sufficient wood for household use, sothere is limited need of residues for construction or fuel. Weapportion the remaining cereal residue for decomposition(based on the information in Appendix D), termite con-sumption, and mulching, with open field burning of anyresidual crop waste.[55] The cotton harvest residue is another nonnegligible
crop waste. The stalks are usually piled in heaps in the fieldand burned [Poulain, 1980; WB, 1986a], and the cottonseedhulls accumulating at the mills are used mainly as fuel (seeAppendix A).5.2.4. Humid Zone[56] This zone which extends along the coast of west and
central Africa and through the Congo has heavy rainfalland a long growing season [McIntire et al., 1992]. Manydifferent crops are grown, and here also, livestock numbersare low due to threat of stock diseases [McIntire et al.,1992]. Since forests and natural grazing lands are abundant,crop residue is not in great demand for either fuel or fodder.For the disposition of these residues, we propose thefollowing. After the harvesting and some livestock grazing,the remaining residue decomposes in the fields for four tosix months until March or April. The farmers then burn(Figure 1) the leftover crop waste in the fields beforeplanting [Watts, 1987; Miracle, 1967; J. Holtzmann, per-sonal communication, 1996]. Based on the discussion inAppendix D, we estimate that in the time between grazingand the spring preplant burn, 52% of millet and sorghum
YEVICH AND LOGAN: BIOFUEL AND WASTE BURNING 6 - 11

straw and stalk, 62% of maize stalks, and 50% rice strawdecompose. These estimates are adjusted if country-specificinformation is available on the fate of the individual cropresidue.5.2.5. Highland Region[57] The highland region has a temperate climate, fertile
volcanic soils, and a long growing season which support ahigher population density and higher livestock density,since the threat of trypanosomiasis is almost nil [McIntireet al., 1992]. The high livestock count in the countries inthis zone, Kenya, Ethiopia, Tanzania, Rwanda, and Bur-undi, suggests that much of the edible crop residue is usedfor animals [McIntire et al., 1992]. In addition to fodder, theresidue is needed as household fuel (Table 6, Figure 1).[58] In Kenya crop residue is a commodity, bought or
exchanged for plowing time, grazing land, etc. [McIntire etal., 1992; English et al., 1994]. Although Kenya has one ofthe highest rates of fuelwood use in Africa, Senelwa andHall [1993] estimate that over 40 PJ (or, about 2.76 milliontons) of crop residue (mainly sorghum and maize stalks) isused as household fuel. The use of millet stems as fuel isalso reported [Mburu, 1989]. To achieve the level ofhousehold fuel estimated by Senelwa and Hall, we appor-tioned the fate of maize residue as 70%:20%:10% forfuel:fodder:decomposition. The sorghum and millet stalks/
stems were divided equally between household fuel anddecomposition in fields, as millet stems are rarely used tofeed animals, but usually gathered for fuel or left todecompose in the fields [Mburu, 1989].[59] In Tanzania the rural areas depend almost exclusively
on wood for fuel, despite a number of wood-deficit regionsin the country [Hosier et al., 1990]. We assigned its millet,sorghum, and maize residues to reflect this, prescribing only15% for household fuel use. In contrast, there are manyfuelwood deficit regions throughout Ethiopia [WB, 1984g],so that dung and crop residues are also used as householdfuel.
6. Asia
[60] Asia is the largest contributor to the burning ofbiofuels and agricultural residue in the developing world,because of the dominance of China and India; thesecountries are described in sections 6.3 and 6.4, respectively.Estimates for woodfuel consumption are given in Table 7and those for residue fuel use and field burning in Table 8.Aside from China and India, eight other countries accountfor 75% of the remaining biofuel (woodfuel plus residuefuel) consumption on the continent: Indonesia, Vietnam,Thailand, Philippines, Turkey, Myanmar, Bangladesh, and
Table 7. Woodfuels Use in Asia
Country Total, Tg Percent Charcoal Choice, kg/cap/day Other Estimates, kg/cap/day Referencesa
Middle EastAfghanistan 3.8 NA 0.57 1Iran 0.9 NA 0.05 2Iraq 2.4 NA 0.42 3Pakistan 14.7 0.8 0.42 0.64, 0.42 4, 1, 5Turkey 17.8 NA 0.97 0.64, 0.73 6, 32, 3YemenAR 4.5 1.3 1.57 7Other Countries 0.3 NA 0.00–0.06 3
Far EastBangladesh 14.5 0 0.4 0.07, 0.09, 0.34, 0.55 8, 9, 5, 10, 1Bhutan 2.2 3 4.43 1Brunei 0.2 NA 2.43 1Myanmar 25.4 4 1.81 1.68, 2.07 31, 11, 1Indonesia 60.1 1.1 1.00 1.57, 1.30, 1.44, 1.02, 0.92 12, 1, 13, 5, 14, 3Japan 19.0 50 0.43 1Cambodia 7.4 NA 2.83 1Korea N 3.1 NA 0.42 1Korea S 4.6 NA 0.31 0.23 1, 15Laos 4.3 NA 3.26 1Malaysia 8.6 8 1.48 1Mongolia 1.0 NA 1.45 1Nepal 9.8 2 1.57 0.78, 1.28, 1.43, 2.54 16, 17, 17, 17, 1Philippines 29.9 5 1.52 1.0 1, 5Sri Lanka 6.4 1 1.06 1.27, 0.93 1, 18, 19Taiwan 1.3 NA 0.18 10Thailand 28.3 53 1.50 2.26, 0.7, 1.22, 2.7, 6.3 33, 20, 21, 5, 22, 10Vietnam 25.8 7 1.18 0.41, 0.69, 0.81 23, 24, 5, 25W Samoa 0.1 0 1.25 26Pacific Islands 3.4 NA 0.7–2.1 1, 27, 28, 29, 30Total 299.8
aExplanation of references: 1: K. Openshaw, personal communication, 1991; 2: Fesharaki [1976]; 3: de Montalembert and Clement, [1983]; 4: Ebinger[1981]; 5: Meyers and Leach [1989]; 6: World Bank (WB) [1983b]; 7: WB [1984p]; 8: Islam [1984]; 9: WB [1982h]; 10 Office of Technology Assessment[1991]; 11 WB [1985f]; 12: Soesastro [1984]; 13: WB [1981]; 14: Di Marzo [1994]; 15: Yager [1984]; 16: WB [1983j]; 17: Earl [1975]; 18: Leach [1987];19: WB [1982b]; 20: Openshaw [1978]; 21: WB [1985j]; 22: Openshaw [1978]; 23: WB [1994b]; 24: Tuan and Lefevre [1996]; 25: England and Kammen[1993]; 26: WB [1985i]; 27: WB [1982d]; 28: WB [1983e]; 29: WB [1992c]; 30: WB [1985h]; 31: Ministry of Forestry: Myanmar [1997]; 32: Ileri andGurer [1998]; 33: K. Openshaw, personal communication, 1998.
6 - 12 YEVICH AND LOGAN: BIOFUEL AND WASTE BURNING
Pakistan. Indonesia is the main contributor, with the largestpopulation in Asia after China and India. (Note that whilewe list the biofuels use in Japan as part of Asia’s total, Japanis not considered a developing country.)
[61] Throughout Asia, regions of similar geography andclimate frequently share similar patterns of biofuels use. Inthe Near East drylands, many countries have abundantsupplies of petroleum. However, rural populations of someof the larger of these countries use wood, as well assignificant quantities of residue and dung in the fuelwood-deficit zones. Some countries in the Middle East also havenotable fuelwood-deficit regions, and rural populations relyon alternative biofuels [de Montalembert and Clement,1983]. In southeast Asia, rural populations have access toa plentiful wood supply; this is the biofuel of choice. Greatquantities of unusable agricultural residue are burned in theopen fields.[62] A variety of detailed studies and reviews are available
for Asia. Biomass as rural energy is discussed in country-specific reports in a compendium by Islam et al. [1984]; thereport on Bangladesh, for example, analyzes the results ofeight major surveys. Ebinger [1981] presents the results of agovernment survey that documents the fuel use patternsthroughout Pakistan. Leach [1987] cites these studies andother surveys in his book describing household energy inSouth Asia. A more recent monograph on Vietnam providesdata from surveys in rural and urban areas of different agro-ecological regions [WB, 1994b]. For urban use, we referredto the work of Barnes and Qian [1992], who collected datain surveys in mid-to-large cities in Indonesia, Thailand, andthe Philippines. Studies on crop residue use in the drylandsof the Near and Middle East are described byWhitman et al.[1989] and Papendick and Parr [1988].
6.1. Woodfuels
[63] Fuelwood is used throughout Asia for cooking andalso for heating, especially in the higher plateaus andHimalayan Zones. However, in some regions with abun-
dant fuelwood, dung is customarily used as a householdfuel. Grouping the developing countries of Asia into thedivisions of Middle and Far East facilitates the discussion,although we note that within the two regions, woodfuelsconsumption habits are not homogeneous. Per capitaconsumption rates for countries in Asia are included inTable 7.6.1.1. Near East and Middle East[64] Here, geography ranges from the mountains and
steppe to shrub deserts, with climate varying from dry tohumid. Turkey, with its large natural forest areas supportedby vigorous reforestation programs [de Montalembert andClement, 1983], has a relatively high per capita fuelwoodconsumption rate (1.0 kg/capita/day). Other woodfuel con-sumers are Iraq, Afghanistan and Pakistan (see Table 7).These countries have fuelwood-deficit regions: high moun-tain zones where people have higher energy requirements,and open mixed forest-grassland and shrub vegetation zoneswith only a small wood supply available to the large ruralpopulations [de Montalembert and Clement, 1983].6.1.2. Far East Excluding Indonesia[65] The vast forest resources of southeast Asia offer a
plentiful woodfuel supply, though many of these forestshave been severely degraded by the densely populated ruralsociety and other forests are almost inaccessible [deMontalembert and Clement, 1983]. In contrast, the hillyand mountainous countries of Nepal, Northern Myanmar,and Upper Thailand have limited fuelwood resources. Ruralpopulations in the wood-deficit areas supplement woodfuelswith crop residues and dung. Another exceptional case isthe densely populated nation of Vietnam. Both rural andurban populations use fuelwood to provide energy, but therural households also use large quantities of crop residue inall regions of Vietnam except the Mekong Delta [WB,1994b; Tuan, 1997].6.1.3. Indonesia[66] Wood is the dominant biomass fuel here. Few
systematic surveys of woodfuel use within the densely
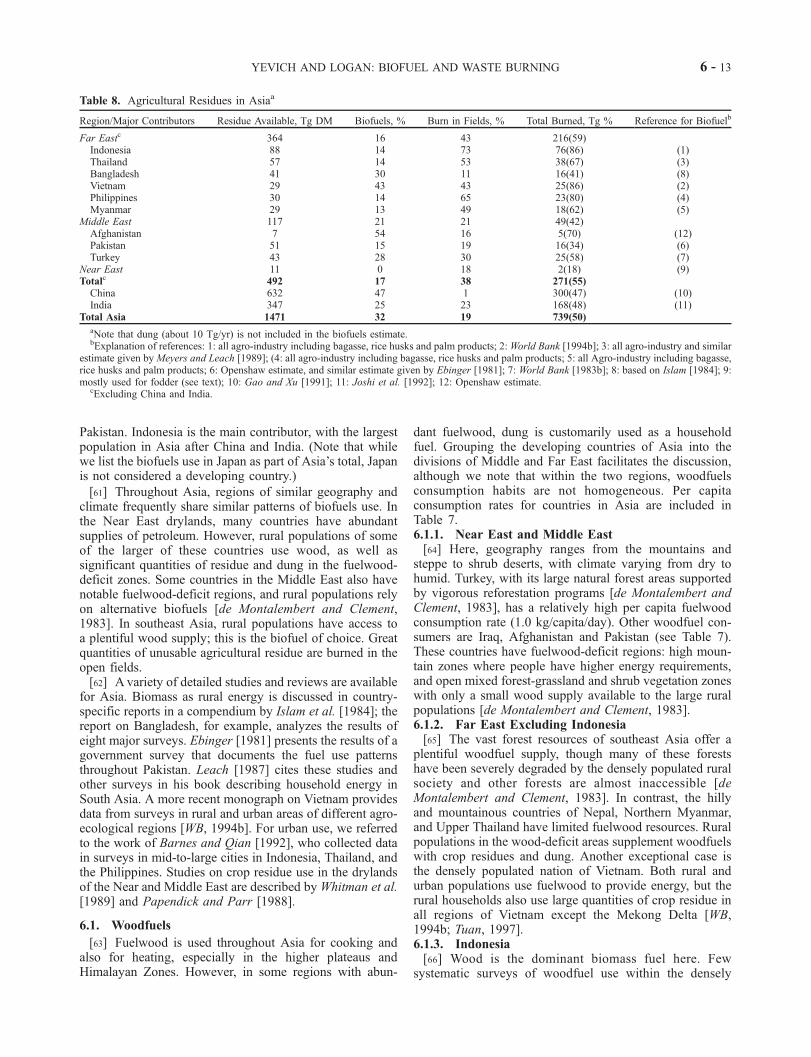
Table 8. Agricultural Residues in Asiaa
Region/Major Contributors Residue Available, Tg DM Biofuels, % Burn in Fields, % Total Burned, Tg % Reference for Biofuelb
Far Eastc 364 16 43 216(59)Indonesia 88 14 73 76(86) (1)Thailand 57 14 53 38(67) (3)Bangladesh 41 30 11 16(41) (8)Vietnam 29 43 43 25(86) (2)Philippines 30 14 65 23(80) (4)Myanmar 29 13 49 18(62) (5)
Middle East 117 21 21 49(42)Afghanistan 7 54 16 5(70) (12)Pakistan 51 15 19 16(34) (6)Turkey 43 28 30 25(58) (7)
Near East 11 0 18 2(18) (9)Totalc 492 17 38 271(55)
China 632 47 1 300(47) (10)India 347 25 23 168(48) (11)
Total Asia 1471 32 19 739(50)
aNote that dung (about 10 Tg/yr) is not included in the biofuels estimate.bExplanation of references: 1: all agro-industry including bagasse, rice husks and palm products; 2:World Bank [1994b]; 3: all agro-industry and similar
estimate given byMeyers and Leach [1989]; (4: all agro-industry including bagasse, rice husks and palm products; 5: all Agro-industry including bagasse,rice husks and palm products; 6: Openshaw estimate, and similar estimate given by Ebinger [1981]; 7: World Bank [1983b]; 8: based on Islam [1984]; 9:mostly used for fodder (see text); 10: Gao and Xu [1991]; 11: Joshi et al. [1992]; 12: Openshaw estimate.
cExcluding China and India.
YEVICH AND LOGAN: BIOFUEL AND WASTE BURNING 6 - 13

populated rural communities of Indonesia have beenreported. Many of the survey results reported by Soesastro[1984] describe rural communities with very differentwoodfuel use patterns. From these data a countrywide ruralper-capita woodfuels use was calculated by combiningsurvey information for rural West Java and other rural Javawith estimates for the rest of rural Indonesia, and weightingby the population of each sector. This rural per capitawoodfuel consumption together with a value for urbanwoodfuel consumption taken from Barnes and Qian[1992] was used to calculate a weighted average of1.0 kg/cap/day. This estimate falls in the range of reportedvalues (0.6 to 4.0 kg/cap/day) [Soesastro, 1984; Woods andHall, 1994; Di Marzo, 1994; Kleeman, 1994] with manyvalues clustering about 1.0 kg/cap/day (see Table 7). Ourestimate lies on the low end of the range; we feel that surveyinformation does not support the high estimates provided inother reports.
6.2. Agricultural Residues
[67] From an agricultural perspective, the main features ofAsia are the drylands in the Near East separated from thetropical moist regions in the southeastern portion of thecontinent by the unusable lands of the Himalayan Moun-tains [Matthews, 1983]. There is a concomitant variation incrops from west to east. The main crops and residues grownin the drylands of the Near East are wheat, barley andcotton. Farther east, in Iran, Afghanistan, Pakistan, andnorthern India, sugar cane and rice are also grown. Rice,maize, and sugar cane are the major crops in Southeast Asia[FAO, 1986a]. The distribution of these crop residuesamong the Near East, Mideast, and Far East is shown inFigure 2 (which does not include the crop residues in Chinaand India, the dominant sources).[68] The farmers of the Near East and Middle East rely
on the wheat and barley residues for livestock feed [Ofori,1989; Papendick and Parr, 1988; Jaradat, 1988], and alsouse the agricultural residues as household fuel in thewood-deficit Middle Eastern region [Ofori, 1989]. How-ever, the rice straw and barbojo in the southeast Asianpeninsula and archipelago are generally burned in thefields [Ponnamperuma, 1984]. Estimates of agricultural
residue burned within the regions of Asia and in the largecontributing countries are presented in Table 8.6.2.1. Near East and Middle East: Residue as Fodder[69] Much of the farmland is located in rainfed drylands
[Tully, 1989], and the main crops are wheat, barley,(Figure 2) and pulses. Almost all the straw is gathered upafter harvest for winter feeding, and the remaining stubblegrazed by sheep and goats [Papendick and Parr, 1988;Jaradat, 1988]. The crop residue for livestock feed issometimes more important than the grain for human con-sumption [Pearson et al., 1995]. In Iran, crop residuestogether with weeds provide about 70% of the livestockfeed and are almost completely removed from the land[Fenster, 1989]. Within the drylands of Pakistan, no part ofa crop is returned to the soil; the stubble is grazed by thelivestock [Khan et al., 1989]. In Turkey, one of the largestwheat producers in the Middle East, the farmers tradition-ally burn the wheat and barley residue in the fields (Table 8)after the animals graze [Whitman et al., 1989; J. Parr,personal communication, 1995].6.2.2. Middle East: Residue as Biofuel[70] The use of agricultural residues as fuel depends
mainly on the availability of woodfuels. For the sizeablerural populations of wood-deficient countries such as Paki-stan and Afghanistan, agricultural residues provide a largeportion of the total biomass energy [Khan et al., 1989; deMontalembert and Clement, 1983]. In Turkey, quantities ofbagasse are used as fuel in the sugar cane processingindustry.6.2.3. Southeast Asia: Residue Burned in Fields[71] Crop residue is used only in small quantities for fuel
with several exceptions (see below), and the burning ofdung for fuel is practically unknown in Southeast Asia[Leach, 1987]. In some regions large quantities of surplusrice straw are incinerated to clear the fields [Ponnamperuma,1984; Tanaka, 1974; Yoshida, 1978]. In southern Vietnamand the Philippines, farmers grow more than one rice cropper year generating tons of residue which is then burned[Nguyen et al., 1994; Yoshida, 1978]. On the central plainsof Thailand, the floating rice area and surrounding deepwater areas produce rice plants more than 2 m in heightwith significant straw waste, also burnt [Department ofAgriculture, 1978]. Similar practices are reported for othercountries in the region, including Malaysia and Indonesia,but there are notable exceptions farther north. In Japan andthe Koreas, rice straw is cut close to the ground and used ascompost, fodder, and fuel, but rarely burned [Tanaka, 1974;Yoshida, 1978]. In north and northeastern Thailand andnorthern Myanmar and Sri Lanka, the straw is cut and fedto the animals [Department of Agriculture, 1978; Tanaka,1974] An exception to the low residue fuel use is noted forVietnam: In North Vietnam, rice straw is a principal cookingfuel in wood-deficit rural areas [WB, 1994b]. Also, inBangladesh which has wood resources, the rural populationtraditionally uses residues and dung for almost half of thehousehold fuel supply [Islam, 1984].
6.3. China
[72] China has the single largest impact on global biomassenergy use. In China biofuel burning is generally confined
Figure 2. Amount of crop residue in Asia distributed byregion in Tg dry matter. China and India are excluded.
6 - 14 YEVICH AND LOGAN: BIOFUEL AND WASTE BURNING

to household use; commercial energy is used for industry[Wen and En-Jian, 1983]. Fuelwood is a main source ofrural energy and provides about half of the total biomassconsumption [ESMAP, 1996]. Agricultural residues supplythe other half, and dried dung accounts for just one percent[ESMAP, 1996]. Increasingly, however, coal and electricityare replacing the fuelwood and residue use as domesticfuels, and more residue is being burned in the fields. For themodel year of this paper, 1985, rural energy consumptionwas still based on use of fuelwood, agricultural residues anddung, and the component of excess residue burned in thefields was minimal.6.3.1. Woodfuels[73] Despite the significance of the biomass energy use in
China, little information had been gathered on the structureof rural energy consumption until the mid-1980s. Gao andXu [1991] presented the results of a nationwide survey in1986 and 1987 on fuelwood consumption and fuelwooddeficit estimates in 26 of 29 provinces. Their work is incontrast to previous surveys which measured only theavailable forest resources allocated for consumption. Theresults of Gao and Xu compare favorably with othernational and regional estimates available as shown inTable 9; values in Table 9 are not scaled to a common yearestimate. All biofuel use estimates except for one are fromthe 1980s; the Gao and Xu woodfuel estimate is mid-to-high within the range of estimates, and their residueestimate is midway within a narrow range of estimates.Gao and Xu’s estimates for fuelwood consumption in ruralChina by province are shown in Table 10.6.3.2. Residues as Biofuel[74] Gao and Xu [1991] provided an estimate of total
agricultural residue use as fuel in China. We distributed thisresidue fuel use in the provinces using residue availabilityas a guide (Table 10). However, the two northern provinceswith large amounts of fuelwood available were assigned alower residue fuel consumption, despite high residue avail-ability; this assumption was based on the finding thatfuelwood was the preferred biofuel [ESMAP, 1996]. Theresulting distribution is supported by information on thefuelwood deficit in each region [Gao and Xu, 1991].6.3.3. Dung as Fuel[75] An estimate of dung use as biomass fuel was given
by Gao and Xu [1991]. This was apportioned among therural population in the four westernmost provinces, basedon the following factors: there is major use of animal wastes
for energy there [Wen and En-Jian, 1983], forest cover islow [Changchun Institute of Geography, 1990], grain pro-duction is also low, but the draught animal population isvery high [State Statistical Bureau, 1992]. The ESMAP[1996] study showed minimal use of dung in its survey ofsix counties in other provinces of China.6.3.4. Residue Burned in Fields[76] All indications are that grain residue was not burned
in the fields in China in 1985; other uses such as fodder,domestic fuel, and fertilizer took priority [Te et al., 1985].To account for burning of stubble in preplant clearing, weallowed for 1% burning of all grain residue, which may behigh. For the preharvest burning of sugar cane, we estimatedthat only 10% of the barbojo is burned in the fields (basedon J. Kadyszewski 1995 personal communication). Weassumed that the woody cotton stalks are used as householdfuel.
6.4. India
6.4.1. Biofuels[77] Biofuel is the primary energy source in rural India.
Dung use increases from south to north, agricultural residueuse increases from north to south, and fuelwood consump-tion reaches its highest levels in the Eastern plateau andEastern Himalayan Zones [Joshi et al., 1992]. A largenumber of surveys and studies of rural energy consumptionwere conducted in the 1980s for the purposes of determin-
Table 9. Estimates of Biofuel Consumption in China (MTCE)a
Source and Estimate Yearb Wood Crop Residue Dung
Gao and Xu [1991] 1986 141 136 10ESMAP [1996] 1979 104 114 –ESMAP [1996] 1989 138 136 –Qui [1992] 1987 132 150 –Office of Technology
Assessment [1991] 1987168 – –
Meyers and Leach [1989] 1989 109 – –Barnard and
Kristoferson [1985] 1985– 120 –
a1 MTCE = 29.3 PJ [Gao and Xu, 1991].bAll estimates are per year indicated.
Table 10. Woodfuel, Residue, and Dung Domestic Fuels in China,
Tg DM/yra
Province Woodfuel Agricultural Residue Dung
Xinjiang 2.36 5.11 6.72Xizang – 0.44 0.98Qinghai 0.21 0.81 2.01Gansu 1.21 4.66 10.08Yunnan 22.08 7.85 –Sichuan 34.62 28.83 –Heilongjiang 4.52 7.22 –Nei Monggol 8.60 6.99 –Ningxia 0.29 1.48 –Jilin 3.65 5.00 –Liaoning 5.74 11.56 –Guangxi 15.05 10.06 –Guizhou 20.37 6.04 –Guangdong 13.03 14.04 –Hunan 19.84 19.79 –Hubei 11.48 16.36 –Shaanxi 10.50 7.57 –Shanxi 2.83 5.34 –Henan 14.03 21.30 –Jiangxi 15.47 12.18 –Fujian 13.34 5.97 –Zhejiang 15.55 12.36 –Anhui 7.55 12.18 –Jiangsu 3.20 22.28 –Shandong 15.70 27.18 –Hebei 2.64 16.38 –Beijing – 2.12 –Tianjin – 1.50 –Shanghai – 1.85 –Totals 263.85 294.48 19.79
aTaken from Gao and Xu [1991] and scaled to 1985 using populationsfrom FAO [1986a]. See text.
YEVICH AND LOGAN: BIOFUEL AND WASTE BURNING 6 - 15

ing the extent of the rural energy crisis. The results of thesestudies were analyzed by Joshi et al. [1992] as a function ofagro-climatic zones, and the statewide use of each biofuelwas then determined for 1991. We scaled these results to1985 based on rural population statistics, and appliednational mean estimates for Jammu and Kashmir for whichno estimate was given, as shown in Table 11.6.4.2. Residue Burned in Fields[78] Crop residues are especially important as cattle feed
in the semi-arid regions where much of the land is cultivatedand little grassland and pasture land remains [Rao, 1985]. Inthe northern wheat and barley growing zones and inmountain villages, the straw is used for fodder [Pal, 1966;Negi, 1994; J. Parr, personal communication, 1995; J. Day,personal communication, 1995]. The farmers of the north-eastern provinces prefer to grow traditional rice with longstraw as opposed to the short straw modern varietiesbecause the straw is needed for water buffalo fodder(R. Huke, personal communication, 1998). Similarly, farm-ers throughout India grow wheat varieties which give goodreturns in straw to provide fodder [Pal, 1966]. In thenorthwest, the rice straw is mixed with cow dung for useas fuel. Elsewhere, sorghum straw provides a major share ofcattle feed [von Oppen and Rao, 1982]. In some parts ofIndia, millet is grown exclusively as a forage crop[Sampath, 1989]. However, residue is burned in the fieldsin India; for example, in Punjab [Meelu et al., 1991; Jenkinset al., 1992; Salour et al., 1989; Desai, 1985]. Rice straw inthe central region around Hyderabad is also burned in thefields.[79] To estimate the amount of residue burned in the fields
in each province in India, we used the total crop productiongiven in the FAO Production Yearbook [FAO, 1986a], andassumed that while total crop production changes year to
year, the distribution of individual crops throughout thestates is similar each year. We derived the distributionsusing individual crop production data for each state (millet[Sivakumar et al., 1984]; maize [Reddy, 1991]; wheat [Pal,1966]; rice [Pal, 1972]; sugar cane [India Directorate ofEconomics and Statistics, 1971]; sorghum [Oppen and Rao,1982]). Joshi et al. [1992] provided estimates for province-by-province consumption of crop residue as biofuel. Wetook this into account in our assessment of how muchresidue would be burned in the fields. In addition, for theregions where wheat and barley residues were in abun-dance, we assumed most residues are used as fodder, andthat only 5% is burned in the fields. Maize stalks and ricestraw are more indigestible as fodder, and the burning oflarge quantities of rice straw is well documented; 35% ofthese residues was assumed to be burned based on advicefrom D. Pimentel (personal communication, 1993). Thecotton stalks are useful as household fuel (T. Townsend,personal communication, 1999), but, we assume a 5%burning in the fields for those areas which have other fuels,and where control of cotton pests is needed. Sugar cane isgrown mainly in central and southern India, and the barbojois needed for thatch; we assumed that 20% is burned (basedon J. Kadyszewski 1995 personal communication). Resi-dues of the agro-industrial processing are burned in theopen (see Appendix A).
7. Central and South America
[80] The biomass resources of Latin America are abun-dant [de Montalembert and Clement, 1983]. Althoughbiofuel use dominates fuel consumption in rural areas ofLatin America, these fuels provide a lower fraction of thetotal household energy use than in the other developingcontinents [Meyers and Leach, 1989] since the populationhas larger income and greater access to modern fuels[Leach, 1988]. In addition to sizable forest resources andsugar cane residues available as biofuels, Latin Americaalso has large oil supplies in the northern countries andsignificant hydroenergy available from the Andes moun-tains [Organizacion Latinoamericana de Energia (OLADE),1981; de Montalembert and Clement, 1983].[81] Throughout Latin America firewood is the primary
source of biomass energy [OLADE, 1981]. Regions ofwoodfuel abundance are located mainly in the tropics,while zones of scarcity are found in the Andean moun-tains, in some arid semi-desert areas and in some of thedensely populated sections of Central America andthe Caribbean [de Montalembert and Clement, 1983].The countries of Argentina, Brazil, Chile, Mexico, andVenezuela have established forest plantations to producewood for paper-making, household fuel use, and charcoalproduction [de Montalembert and Clement, 1983]. Of theagricultural residues, bagasse has major significance as abiofuel, especially in Brazil (WH94). Dung is also used asa household fuel in many rural highland communities[Winterhalder et al., 1974].[82] Estimates of biofuels consumption in Latin America
given in Table 12 are based on data from a variety of generaland country-specific reports, drawnmainly from government
Table 11. Woodfuel, Residue, and Dung Domestic Fuels in India,
Tg DM/yr
State Woodfuel Agricultural Residue Dung
Andhra Pradesh 20.11 16.12 8.23Assam 11.87 2.34 1.21Bihar 29.55 6.76 7.11Gujarat 7.45 2.60 1.99Haryana 1.47 1.30 2.25Himachal Pradesh 1.56 0.00 0.26Jammu and Kashmir 1.85 0.71 0.61Karnataka 9.19 6.76 2.25Kerala 6.41 0.87 1.04Madhya Pradesh 28.25 4.94 5.37Maharashtra 17.33 6.59 2.51Manipur 0.78 0.17 0.09Meghalaya 0.87 0.17 0.09Nagaland 0.61 0.09 0.09Orissa 22.53 6.59 3.73Punjab 1.65 1.56 2.60Rajasthan 8.49 2.43 6.76Tamil Nadu 15.51 12.05 6.50Tripura 1.39 0.26 0.17Uttar Pradesh 14.39 4.85 32.24West Bengal 17.59 9.10 7.80Arunachal Pradesh 0.43 0.09 0.09Mizoram 0.26 0.09 0.00Sikkim 0.26 0.09 0.00Totals 219.82 86.51 93.00
6 - 16 YEVICH AND LOGAN: BIOFUEL AND WASTE BURNING

sources: the FAO Fuelwood Report [de Montalembert andClement, 1983], the LBL (Lawrence Berkeley Laboratory)report [Meyers and Leach, 1989] with biofuels use estimatestaken from FAO Forest Products Yearbooks and fromgovernment documents, and the energy balances report forLatin America [OLADE, 1981]. Other notable sources forLatin America were country-specific reports, many providedby the World Bank which contained biofuel estimatesderived from detailed surveys (or projections based on earliersurveys), and data on forest resources and modern fuelsavailable.
7.1. Biofuels in Brazil
[83] Brazil is the third largest biofuels consumer in theworld, following China and India (see Tables 4, 7, and 13).The biofuels consumed in Brazil include wood, charcoal
and bagasse and represent half of all biofuels utilized in LatinAmerica. We used the estimates from Brasilia Ministerio dasMinas e Energia [1987] in Table 12. Brazil is the world’slargest charcoal producer [Woods and Hall, 1994; Brito,1997; Wood and Baldwin, 1985], and the largest globalproducer and consumer of bagasse [FAO, 1986a], which isalmost entirely burned in the sugar mills [Ogden et al., 1991;De Carvalho Macedo, 1992].[84] Household consumption of biofuels versus modern
fuels depends on income of the family, with firewood usedecreasing as income rises [Behrens, 1986]. Charcoal use ashousehold fuel is small, no higher than 9% for any incomegroup, and generally about 1% of total household fuel use[Behrens, 1986]. The use of agricultural residues as house-hold fuel is not reported.
7.2. Biofuels in Other Latin American Countries
[85] For the purposes of this discussion, the remainingcountries in Latin America have been grouped into theAndean zone (including neighbors), Central America, andthe Caribbean region and North Coast countries of SouthAmerica. Mexico is discussed separately.7.2.1. Mexico[86] Mexico is the second highest consumer of biofuels in
Latin America (Table 12) and several consumption esti-mates are available [Guzman et al., 1987]. We relied on thesummary of Martinez [1992] which describes energy use inthe rural communities based on surveys in 1987 [Secretariade Energia, Minas e Industria Paraestatal (SEMIP), 1988].For this comprehensive study, Mexico was divided into tenmacroregions where energy supply and demand in the ruralpopulation is roughly homogeneous; these were dividedinto 38 subregions which were surveyed on both household-based and community-based energy use. The SEMIP reportconcluded that firewood provides about 70% of energyconsumed in the rural sectors. Rural per capita fuelwood usevaries significantly, from a low of 1.0 kg/cap/day in thePacifico Norte region to 3.0 kg/cap/day in the Pacifico Surregion, depending on the abundance of wood and the needfor heating. No use of agricultural residues and dung asbiofuels was mentioned. However, Guzman et al. [1987]noted that bagasse is burnt as fuel in the sugar mills.7.2.2. Andean Countries and Neighbors[87] Rural populations in this region rely heavily on
firewood [WB, 1994c, 1984c, 1986e; Division deProgramacion Energetica, 1986]. The Andean countrieshave considerable hydroenergy resources [de Montalembertand Clement, 1983; OLADE, 1981] that are used within theurban and commercial sectors but not by the ruralpopulation. Analysis of comprehensive surveys in Ecuadorof over 1750 urban, suburban, and rural householdsindicated that woodfuels accounted for about 10% of urbanhousehold energy use and about 74% of rural householdenergy use [Del Buono, 1993; WB, 1994c]. The highest rateof woodfuel consumption is in Paraguay (about 2.9 kg/cap/day: [Division de Programacion Energetica, 1986]) at 2 to 3times the rate of any other South American country[WB, 1984k]. The industrial woodfuel use in Paraguay issecond only to that of Brazil. This large fuelwood use maybe explained by the abundant forest resources, and the low
Table 12. Biomass Fuel Use in Latin America, PJ Fuel/yr (1985)a,b
Country Wood Chrcl Ag Res.c Dung Refs.d
Andean PlusColombia 196.7 0.0 26.6 0.0 1, 1Peru 120.2 5.0 20.2 24.7 2, 2, 2, 3Chile 65.5 0.0 0.0 0.0 4Ecuador 29.6 0.1 15.1 0.0 5, 5, 6Bolivia 22.7 2.5 5.2 7.1 7, 8, 6, 7Paraguay 57.7 4.6 3.7 0.0 9, 9, 10, 10Argentina 36.0 11.4 28.6 0.0 4, 4, 6Uruguay 23.9 0.0 1.4 0.0 4, 6
Central AmericaGuatemala 111.8 0.8 19.5 0.0 11, 11, 6El Salvador 55.0 0.0 4.3 0.0 12, 12Honduras 50.5 1.3 4.1 0.0 13, 13, 13Nicaragua 30.0 4.2 7.3 0.0 14, 14, 6Costa Rica 20.9 0.5 7.3 0.0 15, 15, 6Panama 14.0 0.0 7.6 0.0 12, 12Belize 1.0 0.0 2.5 0.0 16, 6
CaribbeanCuba 57.9 0.0 189.5 0.0 4, 6Haiti 41.4 3.9 7.8 0.0 17, 17, 6Dominican Rep 11.2 20.9 26.5 0.0 18, 18, 6Jamaica 1.6 18.2 6.1 0.0 19, 19, 6Other 0.4 1.6 2.6 0.0 20, 20, 6
North CoastVenezuela 17.0 0.0 14.8 0.0 21, 6Guyana 5.0 0.0 9.2 0.0 4, 6Surinam 1.3 0.0 0.3 0.0 4, 6Fr. Guyana 0.3 0.0 0.0 0.0 22
Brazil 1070.0 565.0 639.2 0.0 23, 23, 6Mexico 293.0 0.0 98.4 0.0 24, 6Totals 2334.6 640.0 1149.7 31.8
aIn energy units for comparison of different biofuels.bNo estimates for residue burned in the fields included.cMainly bagasse as agro-industrial fuel.dOnly given for nonzero values which have been adjusted to year 1985.
Explanation of references: 1: World Bank (WB) [1986e]; 2: WB [1984c];3 WB [1990]; 4: Organizacion Latinoamerica de Energia (OLADE)[1981]; 5: World Bank [1994c]; 6: Bagasse in agroindustry; 7: World Bank[1994a]; 8: World Bank [1983c]; 9: Division de Programacion Energetica[1986]; 10: World Bank [1984k]; 11: World Bank [1993c]; 12: Bogach[1990]; 13: World Bank [1987d]; 14: van Buren [1990]; 15: World Bank[1984a]; 16: use woodfuel per capita of Colombia; 17: World Bank[1991d]; 18: World Bank [1991a]; 19: World Bank [1985b]; 20: Grenada:OLADE [1981]; St. Lucia, World Bank [1984l]; St. Vincent and theGrenadines, World Bank [1984m]; Trinidad and Tobago: WB [1985k].
YEVICH AND LOGAN: BIOFUEL AND WASTE BURNING 6 - 17

price of fuelwood compared to other Latin Americancountries [WB, 1984k]. Per-capita consumption of fuelwoodis the lowest among the rural peoples in the Altiplano region[WB, 1994a], a part of the Andes which extends throughPeru, eastern Bolivia and northern Chile and Argentina[Winterhalder et al., 1974; Heber and Zieroth, 1986]. Inthese highland zones with particularly rigorous climate,wood is scarce, and dung is a main energy source[WB, 1994a; Winterhalder et al., 1974; Heber and Zieroth,1986]. Dung provides some 19% of total biofuels in Bolivia[WB, 1994a] and about 15% in Peru [WB, 1990] (Table 12).In the more densely populated urban environments of theAndean countries and their close neighbors, households alsouse some biofuels, less than 10% of fuel use in Ecuador[WB, 1994c] and Peru [WB, 1990] and under 20% in Bolivia[WB, 1994a]. Paraguay is an exception in that manyurban households use wood [Division de ProgramacionEnergetica, 1986].[88] Charcoal is mainly consumed in the tin smelting
mills in Bolivia [WB, 1994a], in the steel mills in Paraguay[WB, 1984k], and in the ironworks and other small urbanindustries in Peru [WB, 1990]. Charcoal is used in limitedamounts as a household fuel, primarily in urban environ-ments [WB, 1994c, 1994a, 1990].[89] Bagasse is the main residue that is burned. Some
sugar cane mills use other sources of energy for processing,and burn the accumulating bagasse as a waste product[WB, 1994a], but most reports suggest that bagasse isalmost completely burnt as fuel in the mills [WB, 1986e,1984k]. Other agricultural residues are burned as householdfuel in Bolivia [WB, 1994a] and Ecuador [WB, 1994c], andcoconut shells and cotton residues are burned in agro-processing industries in Paraguay [WB, 1984k].7.2.3. Central America[90] Per capita fuelwood use is higher in Central than in
South America due mainly to the large forest resources.Forests cover more than 34% of the land with the exceptionof El Salvador [Central Intelligence Agency, 1991]. As in theAndean countries, fuelwood provides most of the householdenergy and is used largely for cooking. In Nicaragua, about47% of the total energy requirement from 1970–1982 wassupplied by woodfuels [van Buren, 1990]. Charcoal use isnegligible in the rural regions of Central America, and islimited to the urban household and commercial sectors [van
Buren, 1990; WB, 1987d, 1993c, 1984a]. From the reportsof Bianchi et al. [1990], consumption of agriculturalresidues for biofuel is dominated by bagasse; other residuesused in agro-processing plants are coffee husks, coconutshells, and oil palm kernels [WB, 1984a].7.2.4. Caribbean and North Coast[91] Patterns of energy use are very similar among the
Caribbean countries [Minott, 1992]. Biofuels are important,but the densely populated zones have limited forestresources [de Montalembert and Clement, 1983]. OLADE[1981] reports that firewood is mainly used in the householdsector (for cooking), or transformed to charcoal forcommercial as well as household use. The primary energyneeds in the commercial arena are for sugar caneprocessing; this explains the relatively high portion ofbiofuel (Table 12) supplied by bagasse [OLADE, 1981; WB,1985b, 1991a, 1991d]. The major contributor in the NorthCoast region is Venezuela, an oil-rich country.
7.3. Open-Air Burning of Residues
[92] Very little has been published as to the extent of openair burning of agricultural residues in Latin America. Thestandard practice on the sugar cane plantations is to burnthe barbojo in a preharvest burn. [De Carvalho Macedo,1992; Ball-Coelho et al., 1993]. We assume that this is thecase, unless reports indicate otherwise [Williams andLarson, 1993]. For Brazil, sugar cane production in eachprovince is available [Fundacao Instituto Brasileiro deGeografia e Estatistica, 1984]; we follow the suggestion ofBall-Coelho et al. [1993] that sugar cane residue is burnedover 90–99% of the sugar cane crop area of Brazil(H. Tiessen, personal communication, 1995) before harvest.We estimate that 50% of tobacco wastes are burned in thefield as pest-control measures throughout Central and SouthAmerica [Hall et al., 1993]. By law, cotton stalks must bedestroyed as a pest control measure in Colombia; we use theestimate of a 40% residue burn in the fields (C.Valderrama,personal communication, 1999). For Mexico, Brazil, andArgentina, cotton stalks are mechanically destroyed andploughed down after harvest (R. Jones, personal commu-nication, 1999; F. Ramalho, personal communication,1999; G. Cuadrado, personal communication, 1999). Inother countries of South and Central America, farmersburn the cotton stalks in the field. Wheat residue is burned
Table 13. Biomass Combustion, Tg DM (1985)
Burn in Fields
Biofuel
Total Fuel Total DM Burned (Residue)bResidue Dung Woodfuela
Africa 49 47 11 354 412 461 (96)Asia 274 465 123 784 1372 1646 (739)India 81 87 93 220 400 481 (168)China 6 294 20 264 578 584 (300)Latin America 85 85 2 186 273 358 (170)Brazil 42 47 – 102 149 191 (89)Totals Developing World 408 597 136 1324 2057 2465 (1005)N. America, CIS, W. Europe 36 (US) – – 388 388 424 (36)Australia 7 – – 2 2 9 (7)Totals 451 597 136 1714 2447 2898 (1048)
aWoodfuel combustion includes all fuelwood and all wood used to make charcoal.bThe last column gives the total dry matter burned, including woodfuels, dung, residue burned as fuel and residue burned in
fields. The number in parentheses is the total amount of residue burned.
6 - 18 YEVICH AND LOGAN: BIOFUEL AND WASTE BURNING

in northern Mexico (J. McIntire, personal communication,1996). The remaining agricultural residues are either usedas fuel, or fodder and mulch [Dewalt, 1993], or ploughedback into the soil [WB, 1983c].
8. Developed World
[93] Although the focus of this paper is the developingworld, we include estimates for the developed world for thepurposes of comparison (Table 13). National emissioninventories for the developed world sometimes includeconsumption from uses of wood fuel and agriculturalresidue [Environmental Protection Agency (EPA), 1997;Benkovitz et al., 1996]. While estimates for woodfuel useand residue burning in the fields are included in sometables, they are not presented in the global maps of biofuelsand residue burning (Figures 3, 4, and 5).
8.1. Woodfuels
[94] Although developed countries are significant contrib-utors to the global fuelwood consumption totals, wood isrelatively unimportant in their energy budgets. Informationon recent woodfuel use in the United States and Canada isnot readily available (R. Lowe, personal communication,1998; S. Phelps, personal communication, 1998). TheUnited States has estimates of state-by-state use through1981 [Energy Information Administration, 1982], and alsoestimates for total woodfuel use in the United States, about59 Tg residential and about 116 Tg industrial for 1985[Office of Technology Assessment (OTA), 1991]. Emissionsfrom burning of wood fuel are included in inventories givenby the Environmental Protection Agency [EPA, 1997]. TheCanadian Forest Service provides profiles of fuelwood useby province (4.8 Tg total), major consumers being papermills in Quebec and Ontario [Statistics Canada, 1992]. Anestimate for Australia of about 2.1 Tg woodfuels use is
reported in the Economic and Social Commission for Asiaand the Pacific [1987].[95] Forest residues are a nonnegligible source of bioen-
ergy in Europe [International Energy Agency (IEA), 1987].Information on woodfuels use in western Europe is reportedin several sources [IEA, 1989, 1987; Woods and Hall,1994], giving a total of approximately 100 Tg. France,Sweden, Finland, and Italy are the main contributors. Forthe former Soviet Union (FSU), estimates of biofuel userange from 703 PJ (about 43 Tg) for woodfuel [Bergsen andLevine, 1983] to 1720 PJ (in the range of 108–127 Tg) forall bioenergy (WH94). We chose the highest estimate forfuelwood use (108 Tg), as it is our experience that mostestimates for the FSU tend to be on the low side. Blandon[1983] indicates that about 1.3% of the fuel needs of theFSU were met by firewood. While this is not a largefraction, it provides a substantial contribution to thewoodfuels burned in the developed world (390 Tg). Ourestimate for the woodfuels used in the developed world issimilar to that for the continent of Africa (Table 13).
8.2. Residues Burned in Fields
[96] In the developed world in 1985, residues were alsoburned at reportable levels in the fields, as discussed inAppendix E. For Canada the only major residue subject toopen field burning is wheat straw in Manitoba, Saskatch-ewan and Alberta (V. Knerr, Department of Agriculture,Manitoba, personal communication, 1995). In the UnitedStates, barbojo (W. Webb, personal communication, 1995)and some cereal residues are burned in the fields [Jenkins etal., 1991] (P. Seilhon, personal communication, 1995).Emissions from the burning of these residues are included inthe emission inventories for the United States [EPA, 1997].Many countries in western Europe ban open field burning[Jenkins et al., 1992]. In 1985, however, the U.K. and
Figure 3. Woodfuel use in the developing world distributed on a grid of 1� latitude by 1� longitude inunits of Tg dry matter. Woodfuel includes fuelwood and charcoal. See color version of this figure at backof this issue.
YEVICH AND LOGAN: BIOFUEL AND WASTE BURNING 6 - 19

several Mediterranean countries [i.e., Ezcurra et al., 1996]reported burning of cereal straw, �14 Tg residue. InAustralia, residues of wheat and coarse grains, as well assugar cane, some 7 Tg, are burnt in the fields [NationalGreenhouse Gas Inventory Committee, 1996]. The onlyfield burning we assumed for the former USSR in 1985 wasthat of cotton stalks within the Central Asian Republics andas these are needed for fuel during the severe winters(J. Silvertooth, personal communication, 1999), we esti-mated a minimal burning in the fields of 5%.
9. Error Estimate for Biofuel Use
[97] The difficulties in calculating fuelwood use weredescribed in section 4. We assessed uncertainty in ourestimates by examining both the range of per capita esti-mates in the regions with similar geoclimatic conditions(Tables 4 and 7) and standard deviations for per capita wooduse for countries with many reported estimates. To establishthe range of fuelwood use, we chose the minimum andmaximum per capita use within a region as representative ofall countries in the region, discarding outliers. From theregional extrema, fuelwood usage for Africa was calculatedto be between 214 Tg DM/yr and 422 Tg DM/yr, comparedto our best estimate of 295 Tg DM/yr, giving an error of�30% to +40%. Applying the same method to Asia, ourestimate for woodfuels of 300 Tg DM/yr (excluding Indiaand China) has a range of 181–585 Tg DM/yr, or �40% to+95%.[98] For most countries in Africa and Asia, we have too
small a sample of per capita fuelwood estimates to derivemeaningful statistics. We consider the sample size largeenough for Nigeria, Ethiopia, Kenya, Tanzania, andZambia in Africa. The standard deviation for Tanzania is0.8 kg/capita/day; for the other four countries, the standarddeviations cluster around 0.5 kg/capita/day. The coefficient
of variation (standard deviation/mean) for these countriesis between 0.2 to 0.3. These are somewhat smaller than theerror estimates based on the ranges. Data is even moresparse for the countries of Asia. For Indonesia, Thailand,and Bangladesh, we compute coefficients of variation inper capita fuelwood use of 0.2, 0.5, and 0.7.[99] We adopted an error estimate of 40% for Africa and
Asia, and also used this for Latin America, where there arevery few independent estimates. Our estimates for India andChina are derived from single sources. If we adopt a 40%error for China and India, and add in a 40% error incharcoal estimates for Africa and Latin America, wederive a range for woodfuel consumption in the develop-ing world of 860 to 2000 Tg DM/yr, with a centralestimate of 1430 Tg DM/yr.[100] The uncertainties in quantity of residue used as fuel
are extremely difficult to quantify. Sources of error includecrop production numbers reported in FAO [1986a], residue-to-crop ratios, the estimates of how much residue is neededfor animal feed, construction, and mulch, and the errors inthe survey information we used. Clearly, the estimates oftotal residue production provide a rough upper limit on theamount of residue that can be burned, either as fuel or in thefield. While we believe our estimates represent a significantimprovement over prior work which prescribe a uniformfraction of residue to be burned, we caution that ourestimates could be uncertain to at least (±50).
10. Spatial Distribution of Biomass Fuel Use andBurning of Agricultural Waste
[101] Each of these types of biomass burning: woodfuels(including charcoal), agricultural residues (including dung)as biofuel, and crop residue burning in the fields, is spatiallydisaggregated on a grid of 1� latitude by 1� longitude asshown in Figures 3, 4, and 5. The same color scale was used
Figure 4. Crop residue and dung use as biofuels in the developing world distributed on a grid of 1�latitude by 1� longitude in units of Tg dry matter. See color version of this figure at back of this issue.
6 - 20 YEVICH AND LOGAN: BIOFUEL AND WASTE BURNING
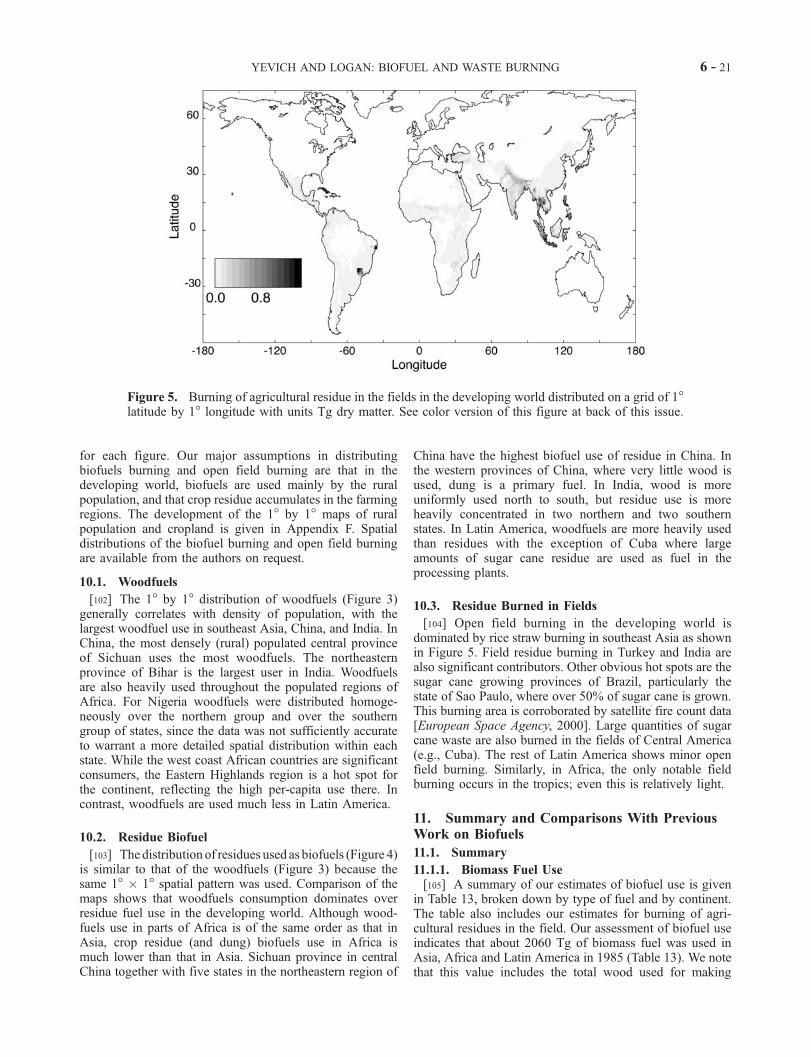
for each figure. Our major assumptions in distributingbiofuels burning and open field burning are that in thedeveloping world, biofuels are used mainly by the ruralpopulation, and that crop residue accumulates in the farmingregions. The development of the 1� by 1� maps of ruralpopulation and cropland is given in Appendix F. Spatialdistributions of the biofuel burning and open field burningare available from the authors on request.
10.1. Woodfuels
[102] The 1� by 1� distribution of woodfuels (Figure 3)generally correlates with density of population, with thelargest woodfuel use in southeast Asia, China, and India. InChina, the most densely (rural) populated central provinceof Sichuan uses the most woodfuels. The northeasternprovince of Bihar is the largest user in India. Woodfuelsare also heavily used throughout the populated regions ofAfrica. For Nigeria woodfuels were distributed homoge-neously over the northern group and over the southerngroup of states, since the data was not sufficiently accurateto warrant a more detailed spatial distribution within eachstate. While the west coast African countries are significantconsumers, the Eastern Highlands region is a hot spot forthe continent, reflecting the high per-capita use there. Incontrast, woodfuels are used much less in Latin America.
10.2. Residue Biofuel
[103] Thedistribution of residues used as biofuels (Figure 4)is similar to that of the woodfuels (Figure 3) because thesame 1� � 1� spatial pattern was used. Comparison of themaps shows that woodfuels consumption dominates overresidue fuel use in the developing world. Although wood-fuels use in parts of Africa is of the same order as that inAsia, crop residue (and dung) biofuels use in Africa ismuch lower than that in Asia. Sichuan province in centralChina together with five states in the northeastern region of
China have the highest biofuel use of residue in China. Inthe western provinces of China, where very little wood isused, dung is a primary fuel. In India, wood is moreuniformly used north to south, but residue use is moreheavily concentrated in two northern and two southernstates. In Latin America, woodfuels are more heavily usedthan residues with the exception of Cuba where largeamounts of sugar cane residue are used as fuel in theprocessing plants.
10.3. Residue Burned in Fields
[104] Open field burning in the developing world isdominated by rice straw burning in southeast Asia as shownin Figure 5. Field residue burning in Turkey and India arealso significant contributors. Other obvious hot spots are thesugar cane growing provinces of Brazil, particularly thestate of Sao Paulo, where over 50% of sugar cane is grown.This burning area is corroborated by satellite fire count data[European Space Agency, 2000]. Large quantities of sugarcane waste are also burned in the fields of Central America(e.g., Cuba). The rest of Latin America shows minor openfield burning. Similarly, in Africa, the only notable fieldburning occurs in the tropics; even this is relatively light.
11. Summary and Comparisons With PreviousWork on Biofuels
11.1. Summary
11.1.1. Biomass Fuel Use[105] A summary of our estimates of biofuel use is given
in Table 13, broken down by type of fuel and by continent.The table also includes our estimates for burning of agri-cultural residues in the field. Our assessment of biofuel useindicates that about 2060 Tg of biomass fuel was used inAsia, Africa and Latin America in 1985 (Table 13). We notethat this value includes the total wood used for making
Figure 5. Burning of agricultural residue in the fields in the developing world distributed on a grid of 1�latitude by 1� longitude with units Tg dry matter. See color version of this figure at back of this issue.
YEVICH AND LOGAN: BIOFUEL AND WASTE BURNING 6 - 21
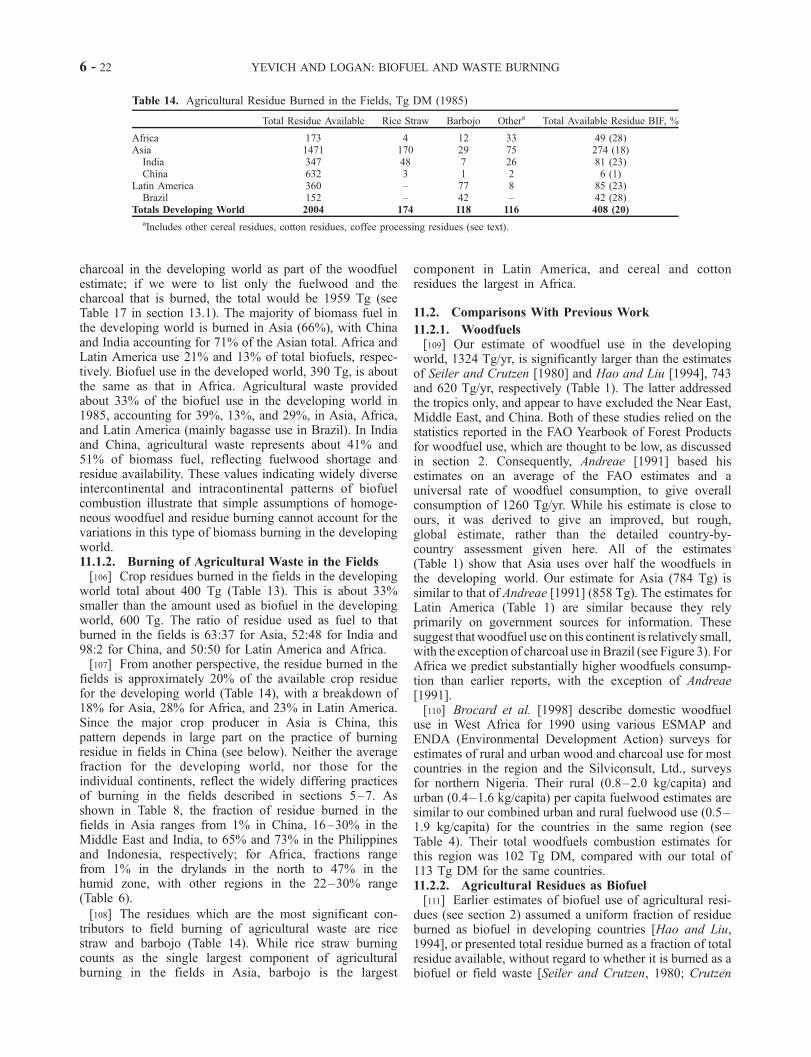
charcoal in the developing world as part of the woodfuelestimate; if we were to list only the fuelwood and thecharcoal that is burned, the total would be 1959 Tg (seeTable 17 in section 13.1). The majority of biomass fuel inthe developing world is burned in Asia (66%), with Chinaand India accounting for 71% of the Asian total. Africa andLatin America use 21% and 13% of total biofuels, respec-tively. Biofuel use in the developed world, 390 Tg, is aboutthe same as that in Africa. Agricultural waste providedabout 33% of the biofuel use in the developing world in1985, accounting for 39%, 13%, and 29%, in Asia, Africa,and Latin America (mainly bagasse use in Brazil). In Indiaand China, agricultural waste represents about 41% and51% of biomass fuel, reflecting fuelwood shortage andresidue availability. These values indicating widely diverseintercontinental and intracontinental patterns of biofuelcombustion illustrate that simple assumptions of homoge-neous woodfuel and residue burning cannot account for thevariations in this type of biomass burning in the developingworld.11.1.2. Burning of Agricultural Waste in the Fields[106] Crop residues burned in the fields in the developing
world total about 400 Tg (Table 13). This is about 33%smaller than the amount used as biofuel in the developingworld, 600 Tg. The ratio of residue used as fuel to thatburned in the fields is 63:37 for Asia, 52:48 for India and98:2 for China, and 50:50 for Latin America and Africa.[107] From another perspective, the residue burned in the
fields is approximately 20% of the available crop residuefor the developing world (Table 14), with a breakdown of18% for Asia, 28% for Africa, and 23% in Latin America.Since the major crop producer in Asia is China, thispattern depends in large part on the practice of burningresidue in fields in China (see below). Neither the averagefraction for the developing world, nor those for theindividual continents, reflect the widely differing practicesof burning in the fields described in sections 5–7. Asshown in Table 8, the fraction of residue burned in thefields in Asia ranges from 1% in China, 16–30% in theMiddle East and India, to 65% and 73% in the Philippinesand Indonesia, respectively; for Africa, fractions rangefrom 1% in the drylands in the north to 47% in thehumid zone, with other regions in the 22–30% range(Table 6).
[108] The residues which are the most significant con-tributors to field burning of agricultural waste are ricestraw and barbojo (Table 14). While rice straw burningcounts as the single largest component of agriculturalburning in the fields in Asia, barbojo is the largest
component in Latin America, and cereal and cottonresidues the largest in Africa.
11.2. Comparisons With Previous Work
11.2.1. Woodfuels[109] Our estimate of woodfuel use in the developing
world, 1324 Tg/yr, is significantly larger than the estimatesof Seiler and Crutzen [1980] and Hao and Liu [1994], 743and 620 Tg/yr, respectively (Table 1). The latter addressedthe tropics only, and appear to have excluded the Near East,Middle East, and China. Both of these studies relied on thestatistics reported in the FAO Yearbook of Forest Productsfor woodfuel use, which are thought to be low, as discussedin section 2. Consequently, Andreae [1991] based hisestimates on an average of the FAO estimates and auniversal rate of woodfuel consumption, to give overallconsumption of 1260 Tg/yr. While his estimate is close toours, it was derived to give an improved, but rough,global estimate, rather than the detailed country-by-country assessment given here. All of the estimates(Table 1) show that Asia uses over half the woodfuels inthe developing world. Our estimate for Asia (784 Tg) issimilar to that of Andreae [1991] (858 Tg). The estimates forLatin America (Table 1) are similar because they relyprimarily on government sources for information. Thesesuggest that woodfuel use on this continent is relatively small,with the exception of charcoal use in Brazil (see Figure 3). ForAfrica we predict substantially higher woodfuels consump-tion than earlier reports, with the exception of Andreae[1991].[110] Brocard et al. [1998] describe domestic woodfuel
use in West Africa for 1990 using various ESMAP andENDA (Environmental Development Action) surveys forestimates of rural and urban wood and charcoal use for mostcountries in the region and the Silviconsult, Ltd., surveysfor northern Nigeria. Their rural (0.8–2.0 kg/capita) andurban (0.4–1.6 kg/capita) per capita fuelwood estimates aresimilar to our combined urban and rural fuelwood use (0.5–1.9 kg/capita) for the countries in the same region (seeTable 4). Their total woodfuels combustion estimates forthis region was 102 Tg DM, compared with our total of113 Tg DM for the same countries.11.2.2. Agricultural Residues as Biofuel[111] Earlier estimates of biofuel use of agricultural resi-
dues (see section 2) assumed a uniform fraction of residueburned as biofuel in developing countries [Hao and Liu,1994], or presented total residue burned as a fraction of totalresidue available, without regard to whether it is burned as abiofuel or field waste [Seiler and Crutzen, 1980; Crutzen
Table 14. Agricultural Residue Burned in the Fields, Tg DM (1985)
Total Residue Available Rice Straw Barbojo Othera Total Available Residue BIF, %
Africa 173 4 12 33 49 (28)Asia 1471 170 29 75 274 (18)
India 347 48 7 26 81 (23)China 632 3 1 2 6 (1)
Latin America 360 – 77 8 85 (23)Brazil 152 – 42 – 42 (28)
Totals Developing World 2004 174 118 116 408 (20)
aIncludes other cereal residues, cotton residues, coffee processing residues (see text).
6 - 22 YEVICH AND LOGAN: BIOFUEL AND WASTE BURNING

and Andreae, 1990; Andreae, 1991]. In contrast, we haveshown that the practice of residue burning varies signifi-cantly from region to region. Our results are considerablylower than those reported previously, with the exception ofestimates of Hao and Liu [1994], as shown in section 2. Weconcur with Smil [1979] who has suggested that cropresidue is used in significant amount as livestock fodder; insome regions this precludes any burning of crop wastewhatsoever.11.2.3. Biofuel by Country[112] Some reports present country by country estimates
of biofuels used in the developing world. The report ofWoods and Hall (WH94) which does not specify thewoodfuel and agricultural residue components of the bio-fuel use separately was described in section 2. Streets andWaldhoff [1998] (hereinafter referred to as SW98) compileda biofuel inventory for 94 regions of Asia. Their estimates,based on information gathered from many sources (some ofwhich were used in this work, for example, [Joshi et al.,1992] for India), provide a detailed breakdown by region offuelwood, crop residue and animal waste as biofuels for theyear 1990.[113] We compare the results of WH94 and SW98
estimated for 1990 with our work (1985) in Table 15. Thiscomparison is given in energy units, those used by WH94and SW98, as we could not readily convert the results ofWH94 (which include all biofuels) to dry matter. Thelargest discrepancy between our estimates for Asia andthose of WH94 and SW98 is that for India. While we tookthe TERI [Joshi et al., 1992] estimates for biofuel useamong the rural populations in the provinces of India (weadded in Jammu and Kashmir) and scaled them only bypopulation for 1985, SW98 used the TERI 1995 databaseand added in a component of biofuel use for urbanpopulations. This may provide a more realistic estimate,in that some portion of the urban population uses biofuels.The difficulty is in determining a good estimate of urbanuse. WH94 prescribed their default urban per capita
estimate to be half of their default rural per capita estimatefor the developing world while SW98 simply applied therural per-capita rate in major cities like Calcutta. The SW98estimate is likely to be high. A report on the fuel use in theurban area of Hyderabad suggests that biofuels are onlyused by one third of the urban population with the remainderusing commercial fuels [Energy Sector ManagementAssistance Programme (ESMAP), 1999]. The report alsoestimates the urban woodfuels use in Hyderabad in 1982 tohave been about 0.26 kg/cap/yr. Our estimate for Indiabased on rural population alone is likely to be low; if we usethe ESMAP [1999] per capita estimate as representative ofthe urban population of India, our total woodfuels usewould increase by about 18 Tg (or 282 PJ) for 1985. Forindividual countries like Indonesia and Vietnam, our resultsare more similar to those of SW98 and much lower thanthose of WH94. If we project our 1985 Asia totals for theyear 1990 using a simple population ratio (United Nations[1999]), we estimate that 1990 Asia biofuel use would be22,606 PJ, just higher than the estimate of SW98 (22,000 PJfor 1990), and significantly lower than WH94 (29,700 PJfor 1990).[114] For Latin America, biofuel use given by WH94 is
10% lower than our estimate. While their estimate forMexico is very similar to ours, their estimate for Brazil is30% lower than ours. It is lower also than the FAO estimatefor Brazil’s wood and charcoal use alone.[115] The WH94 biofuel estimate for Africa in 1990 is
9160 PJ, 42% larger than ours, with the largest contributionfrom Nigeria (2200 PJ). WH94 takes its woodfuels useestimate for Nigeria (969 PJ) from FAO Forest ProductsYearbook [FAO, 1990]. The total biofuel estimate of WH94(including residue use) is more than twice the FAO estimatefor Nigeria. Our estimates of fuelwood use in Nigeria (838PJ for 1985) were based, in part, on the Silviconsult, Ltd.,survey [Hyman, 1994], mentioned above; this survey alsoincluded an estimate of the use of sorghum stalk residue asbiofuel (about 2.2 Tg, or 30 PJ) in the northern provinces
Table 15. Biofuels Combustion-Estimates, PJ
Estimate Year Streets and Waldhoff [1998] 1990 Woods and Hall [1994] 1990 This Work 1985
Total Asia 22,000 29,695 20,605China 9800 9300 8483India 7254 8543 6130Indonesia 1190 2655 1138Vietnam 537 896 589Thailand 397 – 559Philippines 309 856 532Myanmar 272 550 460Turkey – 605 447Pakistan 724 1246 434Bangladesh 499 1523 438Japan 88 6 304
Total Africa – 9,160 6,443Nigeria – 2,225 932Ethiopia – 540 698Tanzania – 925 497Sudan – 843 564Kenya – 404 395
Total Latin America – 3726 4156Brazil – 1604 2274Mexico – 404 391
Total developing world – 42,631 31,203
YEVICH AND LOGAN: BIOFUEL AND WASTE BURNING 6 - 23

where the sorghum is mostly grown. Our estimate of cropresidue used as biofuel for Nigeria is about 5.5 Tg, or 74 PJ.Given the sources we have examined, it is difficult to justifythe large WH94 estimate for biofuel use in Nigeria.11.2.4. Burning of Agricultural Waste in the Fields[116] Although the average fraction of residue burned in
the fields in our work (20% in Table 14) is similar to theuniform fraction adopted for the developing world byCrutzen and Andreae [1990] (25%) and Hao and Liu[1994] (17%), the earlier studies cannot provide a realisticgeographical distribution of very different burning practices.Comparing the developing continents (Table 14) andincluding China as the largest residue producer gives arange of 1–28% of field burning of residues in thedeveloping world.
12. Biomass Combustion Estimates for 1995
[117] Using methods for estimating biomass burning inthe developing world for the target year of 1985, estimatesfor 1995 were calculated. For a simple update, we assumedthat the changes in burning could be divided into two parts:those correlated with a change in population and those tiedto changes in crop production. Our assumption is thatbiofuel use is proportional to population, but that theamount of residue used as agro-industrial fuel in theprocessing of the crop and the amount of residue burnedin the fields increase as crop production increases. We giveestimates for changes in quantities burned between 1985and 1995 in Table 16.[118] We scaled the numbers appropriately by continent
(with China, India, and Brazil estimated separately), usingpopulations from the United Nations [1999] and cropproduction data from Food and Agriculture Organization(FAO) (FAO Statistical Database/FAOSTAT AgricultureData, available at http://apps.fao.org/, 2000). Overall, thebiomass fuel combustion increased by 20%, and residueburning in the fields by 22% for the developing world(Table 16).
[119] Our projection for 1995 assumes that fuel availabil-ity did not change through 1995, that fuel preference did notchange (no increase in use of modern fuels andcorresponding decrease in biofuels), and that the habits ofburning residue in the fields have been constant. The firstassumption ignores the increased woodfuel shortagereported for some countries in Africa [Barnes, 1990] andAsia [Smil, 1993; Fesharaki et al., 1982] leading todecrease in woodfuels use in those regions. The lastassumption may not be reliable based on the followingobservations. The use of mechanization in agriculture isincreasing, as reflected in the major increase in the numberof tractors in the developing world, 40% from 1985 to 1995[FAO, 2000]. One consequence of this trend is that thepreharvest burning of sugar cane trash is a decliningpractice, at least in Brazil (H. Tiessen, personal commu-nication, 1999), and likely in the other regions of LatinAmerica where tractors are common.[120] In China where the rural population has greater
access to coal as domestic fuel, Streets et al. [2001] reportthat biofuel use has declined from an estimated 9.2 EJ in1990 to 7.6 EJ in 2000. In addition, the organic compostingof residue is declining with the increase in use of chemicalfertilizers [Zhuang et al., 1996]. The residue must bedisposed of before planting, which could correlate with anincrease in field burning. This change in practice iscorroborated by remote sensing reports of increases in fieldburning of residues from rice, wheat, and maize in theYangtze and Yellow River plains [Dwyer et al., 2000]. Inaddition, a study on use of straw as fodder for ruminantsestimated that about 100 Tg of straw was burned in the fieldin 1999 [Suoping et al., 1999]. We derived an upper limit offield burning in China from an estimate of residue availablefrom rice, wheat, maize, and sugar cane crops in 1995, 634Tg [FAO, 2000] by subtracting out crop waste used asbiofuel, 290 Tg, and as fodder, 160 Tg. We assumed thatwaste used as biofuel has not increased since 1985, and that25% of crop waste is used as fodder [Tingshuang andZhenhai, 1996]. Our upper limit of field burning, 184 Tg,
Table 16. Biomass Combustion Estimated for 1995, Tg DM
Burning in Fields Agr. Residues Plus Dung (Biofuel) Fuel Wood Plus Charcoal Total Biomass Fuel
Africa1985 49 58 354 4121995 57 72 464 536Change +16% +24% +31% +30%
Asia1985 274 588 784 13721995 348 678 930 1608Change +27% +15% +19% +17%
Latin America1985 85 87 186 2731995 91 107 221 328Change +7% +23% +19% +20%
Totals1985 408 733 1324 20571995 496 857 1615 2472Change +22% +17% +22% +20%
6 - 24 YEVICH AND LOGAN: BIOFUEL AND WASTE BURNING
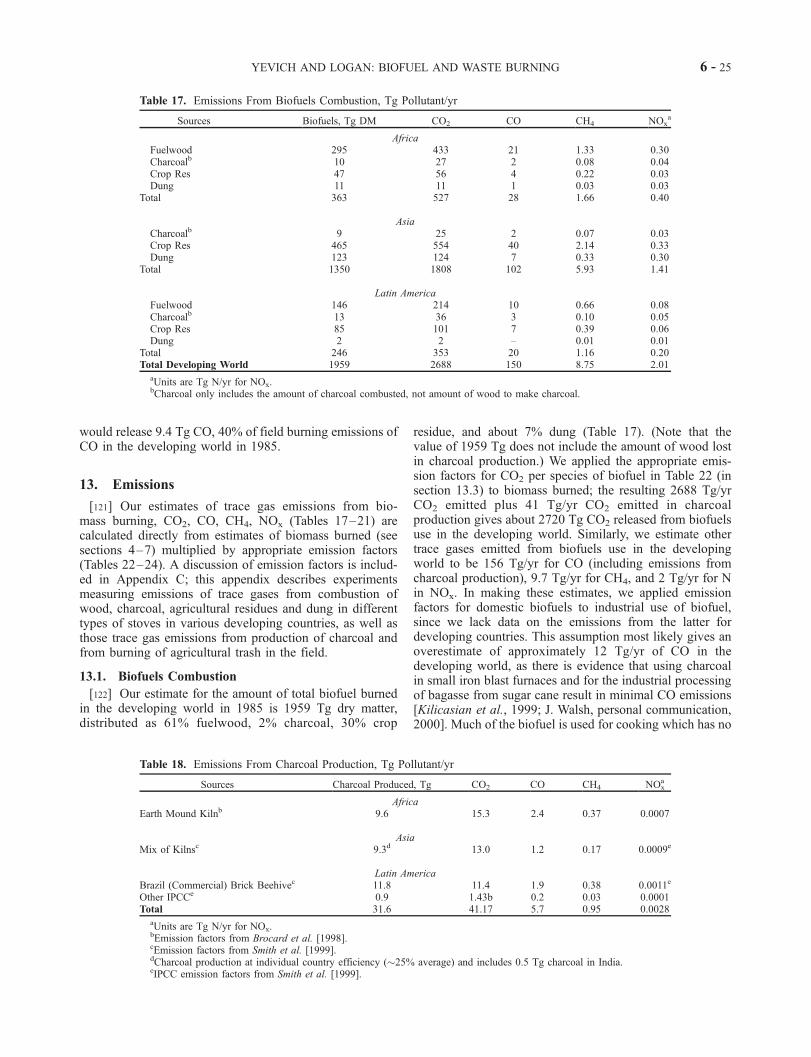
would release 9.4 Tg CO, 40% of field burning emissions ofCO in the developing world in 1985.
13. Emissions
[121] Our estimates of trace gas emissions from bio-mass burning, CO2, CO, CH4, NOx (Tables 17–21) arecalculated directly from estimates of biomass burned (seesections 4–7) multiplied by appropriate emission factors(Tables 22–24). A discussion of emission factors is includ-ed in Appendix C; this appendix describes experimentsmeasuring emissions of trace gases from combustion ofwood, charcoal, agricultural residues and dung in differenttypes of stoves in various developing countries, as well asthose trace gas emissions from production of charcoal andfrom burning of agricultural trash in the field.
13.1. Biofuels Combustion
[122] Our estimate for the amount of total biofuel burnedin the developing world in 1985 is 1959 Tg dry matter,distributed as 61% fuelwood, 2% charcoal, 30% crop
residue, and about 7% dung (Table 17). (Note that thevalue of 1959 Tg does not include the amount of wood lostin charcoal production.) We applied the appropriate emis-sion factors for CO2 per species of biofuel in Table 22 (insection 13.3) to biomass burned; the resulting 2688 Tg/yrCO2 emitted plus 41 Tg/yr CO2 emitted in charcoalproduction gives about 2720 Tg CO2 released from biofuelsuse in the developing world. Similarly, we estimate othertrace gases emitted from biofuels use in the developingworld to be 156 Tg/yr for CO (including emissions fromcharcoal production), 9.7 Tg/yr for CH4, and 2 Tg/yr for Nin NOx. In making these estimates, we applied emissionfactors for domestic biofuels to industrial use of biofuel,since we lack data on the emissions from the latter fordeveloping countries. This assumption most likely gives anoverestimate of approximately 12 Tg/yr of CO in thedeveloping world, as there is evidence that using charcoalin small iron blast furnaces and for the industrial processingof bagasse from sugar cane result in minimal CO emissions[Kilicasian et al., 1999; J. Walsh, personal communication,2000]. Much of the biofuel is used for cooking which has no
Table 17. Emissions From Biofuels Combustion, Tg Pollutant/yr
Sources Biofuels, Tg DM CO2 CO CH4 NOxa
AfricaFuelwood 295 433 21 1.33 0.30Charcoalb 10 27 2 0.08 0.04Crop Res 47 56 4 0.22 0.03Dung 11 11 1 0.03 0.03
Total 363 527 28 1.66 0.40
AsiaCharcoalb 9 25 2 0.07 0.03Crop Res 465 554 40 2.14 0.33Dung 123 124 7 0.33 0.30
Total 1350 1808 102 5.93 1.41
Latin AmericaFuelwood 146 214 10 0.66 0.08Charcoalb 13 36 3 0.10 0.05Crop Res 85 101 7 0.39 0.06Dung 2 2 – 0.01 0.01
Total 246 353 20 1.16 0.20Total Developing World 1959 2688 150 8.75 2.01
aUnits are Tg N/yr for NOx.bCharcoal only includes the amount of charcoal combusted, not amount of wood to make charcoal.
Table 18. Emissions From Charcoal Production, Tg Pollutant/yr
Sources Charcoal Produced, Tg CO2 CO CH4 NOxa
AfricaEarth Mound Kilnb 9.6 15.3 2.4 0.37 0.0007
AsiaMix of Kilnsc 9.3d 13.0 1.2 0.17 0.0009e
Latin AmericaBrazil (Commercial) Brick Beehivec 11.8 11.4 1.9 0.38 0.0011e
Other IPCCe 0.9 1.43b 0.2 0.03 0.0001Total 31.6 41.17 5.7 0.95 0.0028
aUnits are Tg N/yr for NOx.bEmission factors from Brocard et al. [1998].cEmission factors from Smith et al. [1999].dCharcoal production at individual country efficiency (�25% average) and includes 0.5 Tg charcoal in India.eIPCC emission factors from Smith et al. [1999].
YEVICH AND LOGAN: BIOFUEL AND WASTE BURNING 6 - 25

seasonal pattern; trace gases from this burning are emittedthroughout the year in contrast to other types of biomassburning which tend to follow seasonal patterns [Duncan etal., 2003].[123] Differences in our estimates of trace gases emitted
and those in other reports are correlated with differenceseither in amount of biofuel burned or in the choice ofemission factors, or both. For the region of West Africa,Brocard et al. [1998] reported estimates of 153 Tg CO2 and7.9 Tg CO released in woodfuel combustion which aresimilar to our values of 166 Tg CO2 and 8.4 Tg CO for thesame region. As discussed in section 11.2, the Brocardestimates for fuel use [Brocard et al., 1998] are very similarto our estimates, and we use their emission factors for CO2
and CO emitted from woodfuel burning. Their estimate of0.32 Tg CH4 differs from ours (0.51 Tg) in that we used alarger emission factor. In comparing our estimates of CO2
(527 Tg) and CO (26 Tg) released from biofuel for all ofAfrica with those of Marufu [1999] 1085 Tg and 65 Tg,respectively, we note that Marufu used higher CO2 and COemission factors for biofuel burning (Table 22), as well asthe Hall-based biofuel consumption estimates for Africa(WH94), notably higher than our estimates (Table 15).Olivier et al. [1996, 1999] give an estimate for globalemissions of CO from biofuel of 181 Tg in 1990, as part ofthe EDGAR 2 inventory. They relied on biofuel estimates ofHall et al. [1994] for the developing world, which arehigher than ours as discussed above, and used emissionfactors of about 75 gCO/kg for wood and 45 gCO/kg foragricultural waste; their wood emission factor is similar toours, but the crop waste factor is just above half of our
factor. Their estimate is similar to ours for 1985 if we allowfor emissions from biofuel use in the developed world,increasing our total for 1985 from 155 Tg to 177 Tg, but thesimilarity is a consequence of their use of higher biofuelestimates and a lower crop waste emissions factor. TheEDGAR 3 inventory has recently been released on-line, andgives estimates for CO from biofuel of 215 Tg for 1990 and231 Tg for 1995 [Olivier and Berdowski, 2001; Olivier etal., 2001] (EDGAR 3, available at http://www.rivm.nl/env/int/coredata/edgar/). EDGAR 3 also relies on Hall et al.[1994] for most of the developing world, but uses theOLADE statistics for South America and emission factorsgiven in IPCC [1997]. We believe that our estimates aremore reliable than those given in EDGAR, because of theirreliance on Hall et al. [1994] for biofuel use.
13.2. Emissions From Charcoal Production
[124] Estimates of worldwide charcoal production rangefrom 18.7 Tg for 1985 (21.2 Tg for 1995) (Food andAgriculture Organization (FAO), Forest Energy Data/Wood-fuel Consumption, available at http://www.fao.org/forestry/,1998) to 100 Tg [Smith et al., 1999]. The amount of COemitted from these estimates (using the IPCC default 0.21kg pollutant/kg charcoal produced [Smith et al., 1999])would be 3.92 Tg and 21 Tg, respectively. Our charcoalproduction total is 31.6 Tg in the developing world for 1985(Table 18) with about 5.8 Tg CO emitted from this process,using the emission factors for different types of kilns inTable 23. For the other trace gases, we estimate developingworld totals of 41 Tg CO2, 1.94 Tg/yr CO, 0.38 Tg/yr CH4,and 0.003 Tg N from NOx from this process. We compareour estimates for Brazil (11.4 Tg CO2, 1.94 Tg CO, 0.38 TgCH4) with those of Pennise et al. [2001] who estimated8.6 Tg/yr CO2, 2.0 Tg/yr CO and 0.31 Tg/yr CH4 emissionsfor 1996; we note that any agreement is fortuitous since notonly are their estimates of charcoal production much lowerthan ours (6.4 Tg vs 11.8 Tg), but the emission factorswhich they used are much higher [Pennise et al., 2001].
13.3. Emissions From Burning Residue in the Fields
[125] On a global scale, the contributions to the totalannual trace gas emissions from the field burning ofresidues are comparatively small (0.5 Pg CO2, 23 Tg CO,1 Tg CH4, and 0.2 Tg N from NOx: see Tables 19 and 20).However, this type of burning can have major effects
Table 19. Emissions From Field Burning of Residues, Tg
Pollutant/yr
CO2 CO CH4 NOxa TPM
Africa 55 2.5 0.11 0.02 0.20Asia 310 14.0 0.60 0.14 1.15
India 91 4.1 0.18 0.04 0.34China 7 0.3 0.01 0.00 0.02
Latin America 96 4.3 0.19 0.04 0.36Brazil 48 2.1 0.09 0.02 0.18
N. America, CIS,W. Europe, Australia
49 2.2 0.09 0.02 0.18
Totals 510 23.0 0.99 0.22 1.89
aUnits are Tg N/yr for NOx.
Table 20. Global Emission Estimates (1985)a
CO2 CO CH4 NOx
Fossil Fuel, Industry 5.3 (1) 300–400 (2) 75–110 (3) 21 (3)Biomass Fuelb 0.74 150 9 2.0Charcoal Productionb – 6 1 –Field Residue Burningc 0.14 23 1 0.2Biomass Burning 2.3 (3) 300–770 (3) 23–55 (3) 3–13 (3)Total Sources 2100–2800 (3) 500–600 (3) 44–52 (3)
aUnits are Pg C/yr for CO2, Tg CO/yr, Tg CH4/yr, and Tg N/yr for NO. Estimates are given for 1985 for fossil fuel and industry. Explanation ofreferences that are given in parentheses: 1: Marland et al. [2001]; 2: Olivier et al. [1999], Duncan et al. [2003]; 3: Intergovernmental Panel on ClimateChange [2002].
bFrom developing world only.cAlso includes BIF of developed world.
6 - 26 YEVICH AND LOGAN: BIOFUEL AND WASTE BURNING

seasonally on a regional scale, for example, during themonths of rice straw burning in Southeast Asia, or sugarcane harvesting in Brazil. Clearly, the largest emissionscome from Asia (rice straw), followed by emissions fromthe burning in Latin America (mainly barbojo), then fromAfrica and the developed world. While we have focused ourdiscussion of residue burning in fields on deriving annualestimates of amount burned, we note that most burning infields occurs in preplanting, or post harvest seasons. For theNorthern Hemisphere, these would be February through
early May and end September through mid November, theactual timing depending on latitude, altitude, type of cropand year-specific meteorology. More information on sea-sonality of this and other types of biomass burning is givenby Duncan et al. [2003].[126] Olivier et al. [1996, 1999] give an estimate for CO
emissions from agricultural waste burning in 1990 of208 Tg, but this clearly reflects an error in theirimplementation of the results of Andreae [1991]. Thisestimate is revised to 18.6 Tg for 1990 and 16.4 Tg for 1995
Table 21. Comparison of Biofuel and Fossil Fuel Combustion, Tg C (1985)
Biofuel
Total Biofuel Total Fossil FuelaResidue Dung Woodfuel
Africa 19 4 159 182 168Asia 186 43 353 582 1286
India 35 33 99 167 133China 118 7 119 244 531
Latin America 34 1 84 119 239Brazil 19 – 46 65 48
Totals Developing World 239 48 596 883 1693N. America, CIS, W. Europe – – 175 175 2977Australia – – 1 1 61Totals 239 48 772 1059 5405b
aCarbon Dioxide Information Analysis Center (CDIAC) website.bCDIAC global total also includes bunker fuels, asphalt oxidation, etc. (T. Boden, personal communication, 2002).
Table 22. Emission Factors for Biofuels Combustion in Simple Cookstoves, gm Pollutant/kg Dry Mattera
Sources, % C CO2 CO CH4 NOxb TSP
FuelwoodZhang et al.c (44.5–45.6) 1410–1630 (1520) 24–123 (69.2) 0.54–19.9 (5.06) 0.12–2.78 (1.19) 1.51–8.73 (3.82)Smith et al.d (41.8–45.5) 1260–1536 (1395) 60–139 (66.5) 3.4–11 (3.93) – (0.89) 8–25 (5.17)Brocard et al.e (46) 1467 70 2 0.7 –Marufuf (50/45) 1610/1486 100/90 – 0.52 –Bertschi et al.g (48) 1525 96 10.6 0.95 –Early reportsh 1460–1480 39–106 – – 2.9–15.0
Choice Dev. World 1467 70 4.5i 1.0i 4.5i
CharcoalZhang et al.c 2450 275 – – –Smith et al.j 2740 230 8 – –Bertschi et al.g 2402 134 6.9 0.7 –Lazarusk 2780 264 – – –
Choice Dev. 2740 230 8 3.9World Dung
Smith et al.d (33.4) 974–1065 (1010) 32–60 (60) 3.3–17.0 (17) – – 0.54–2.03 (1.22)Maruful (50/33.4) 1610/1103 84/58 – – –
Choice Dev. World 1010 60 2.7 f 2.4f 1.22Crop Residue (mix)
Zhang et al.c (34.8–40.3) 834–1370 (1130) 24–223 (86) .004–15.9 (4.6) .004–2.2 (0.70) 1.12–29.0 (8.1)Smith et al.d (38.1–42.1) 983–1302 (1192) 55–101 – 3.8–25 – – – 0.63–14.9 (1.08)Maruful (50/34.8) 1720/1200 63/44 – 1.7 –Smithm 1220 110 – – 35
Choice Dev. World 1192 86 4.6 0.7 8.1
aFirst line gives range of emission factors and second line is the mean.bUnits are grams N for Nox.cZhang et al. [2000].dSmith et al. [2000].eBrocard et al. [1998].fMarufu [1999].gBertschi et al. [2003] assumed all burned carbon was volatilized.hMainly Butcher et al. [1984] as summarized by Lazarus and Diallo [1992] and Smith [1987].iMean Smith et al. [2000] and Zhang et al. [2000].jSmith et al. [1993].kIslam [1987] given by Lazarus and Diallo [1992].lA slash is used to give the recalculated value of CO2 if Marufu had used a more realistic C-content of the fuel.mSmith [1987].
YEVICH AND LOGAN: BIOFUEL AND WASTE BURNING 6 - 27

in EDGAR 3 (http://www.rivm.nl/env/int/coredata/edgar/).Their new estimate assumes that constant fractions ofagricultural waste are burned either as fuel or in the field,30% in the developing world, and 20% in Eastern Europeand the former Soviet Union, and 5% in OECD countries[Olivier et al., 2001]. Their results are about 25% smallerthan ours, and we have shown that the assumption that auniform fraction of waste is burned is not valid.
14. Comments and Conclusions
14.1. Biomass Fuel Use
[127] Our assessment of biofuel use indicates that about2060 Tg of biomass fuel was used in the developingworld in 1985 (Table 13). This is equivalent to 880 Tg C(Appendix B), and is 52% of the amount of fossil fuelburned on these continents in 1985, as shown in Table 21.We find that similar amounts of biomass and fossil fuel areburned in Africa, while in Asia and Latin America, the
amount of biomass fuel is approximately half the amount offossil fuel. Biofuel use in the developed world is about thesame as that in Africa (Table 13); it is only 6%, however, offossil fuel use in the developed world.
14.2. Emissions
[128] The source of CO from burning of biomass fuel inthe developing world, 150 Tg, is 40–50% of that fromfossil fuel combustion and industrial activity for the entireworld, 300–400 Tg CO, as shown in Table 20. Emissions ofCO from field burning of field agricultural residues, 23 Tg,is a relatively minor source of CO, as is charcoal manufac-ture, 6 Tg.[129] The source of CO2 from burning of biofuels in the
developing world, 0.73 Pg C, is 14% of the global sourceof CO2 from burning of fossil fuels. Of the biofuel source,0.5 Pg is from burning of wood fuels, and the remainderfrom burning of agricultural residue and dung. The lasttwo fuels do not provide a net source of CO2 to the
Table 23. Emission Factors for Charcoal Production, gm Pollutant/kg Charcoal Produced
Sources CO2 CO CH4 NOxa
Earth Mound Kilns (Africa)Smith et al. [1999] 1140 226 28 –Brocard et al. [1998] 1593 254 39 0.073Pennise et al. [2001] 1058–3027 143–333 32.2–61.7 –
Brick Beehive Kiln (Brazil Commercial)Smith et al. [1999] 966 162 32 –Pennise et al. [2001] 543–1533 162–373 36.5–56.8 –
Mix of Kilns (Asia)Smith et al. [1999] 1403 133 18 –
World AverageIPCC [Smith et al., 1999] – 210 30 0.091
aUnits are grams N for NOx.
Table 24. Emission Factors for Residue BIF, gm Pollutant/kg DM
Sources (Residue) CO2 CO CH4 NOxa TPM
Ezcurra et al. [1996]Cerealb 1032–1283 – – 0.69–0.77 16.0–26.0
Nguyen et al. [1994]Rice,c 977 79 4.1 – –Rice,c wet season 831 143 12.3 – –
Jenkins and Turn [1994]Ricec 1072 29 0.7 0.62 3.2Ricec & cerealsd 1091–1201 35–92 1.6–2.3 0.32–0.55 5.4–7.2
Scholes and van der Merwe [1995], IPCCSugar canee – 54–90 2.89–5.37 0.21–0.66 –Choice 1132 51 2.2 0.52 4.2
Andreae and Merlet [2001]Savannaf 1613 65 2.3 1.82 8.3
aSources differ in definition of NOx; these units are in grams N for NOx.b10% moisture content wet basis (MC).cMC is 8.5%.dMC is 6.9–8.6%.eMC is 15%.fMC is not specified.
6 - 28 YEVICH AND LOGAN: BIOFUEL AND WASTE BURNING

atmosphere. The impact of the wood fuels source on theCO2 budget depends on the extent to which harvesting ofwood is balanced by annual regrowth [e.g., Houghton,1999].[130] The methane source of 10 Tg from biofuel and field
burning of agricultural waste is a relatively small source ofCH4, and is much less that the source from other types ofbiomass burning, 23–55 Tg (Table 20). The source of NOx
from biofuel and field burning is about 10% of the sourcefrom fossil fuel combustion. However, the biofuel sourcemay be important on a regional basis, given the shortlifetime of NOx.
14.3. Conclusions
[131] Biofuels use in the developing world is dominatedby about twenty major countries led by China, India, Brazil,and Indonesia. Realistic assessments of the current biofuelsuse and the trends in fuel use within these countries wouldbe sufficient to provide a fairly good basis for estimatingpresent and future emissions from biofuels use within thedeveloping world.[132] In comparison with biofuels consumption, field
burning of residue contributes a relatively small amountto trace gas emissions. However, we note that as Chinadominates in the production of wheat and rice, and thatChina is currently changing its customs of disposing of theresidue from these grains and burning more in the fields,the contribution to the global trace gas emissions from thefield burning of residue should increase significantly(section 12). Reliable estimates of trace gas emissionsfrom biomass burning depend not only on good estimatesof the amount of matter burned, but also on goodestimates of emission factors from burning of householdfuels together with comprehensive assessments of theconditions of domestic fuel use throughout the developingworld.
Appendix A: Agro-Industrial Use of Residues
[133] Sugar cane bagasse is the largest category of agro-industrial residues, followed closely by rice hull residue[FAO, 1984, 1986a]. Coconut shells, cottonseed andgroundnut hulls, palm and coffee residues accrue in muchsmaller amounts.[134] For sugar cane processing, we relied on the work
of Williams and Larsen (1993). Bagasse is used as fuel inmost of the sugar factories and alcohol distilleries world-wide [Williams and Larson, 1993; WB, 1986a, 1991c,1987c, 1983a, 1985l, 1984g, 1983g, 1984n, 1982a, 1983i].Williams and Larson [1993] indicate that factories usuallyare sufficiently inefficient so as to consume all availablebagasse while processing the cane [cf. WB, 1991b, 1986a],so we assume that 100% of the bagasse is burned.[135] Rice hulls are a low density, low nutritive byprod-
uct of the rice-processing industry and are generallyconsidered a nuisance [Oyenuga, 1968; F. A. Bernardo,personal communication, 1994]. In many countries, ricehusks are consumed in the boilers of rice processing plants[WB, 1981, 1987a; F. A. Bernardo, personal communica-tion, 1994]. They are also used as domestic cooking fuel
[Waddle, 1985; Islam et al., 1984; WB, 1985j] and foranimal feed [WB, 1987a], but there is also evidence thatthey are left in heaps to decompose [WB, 1987a] or burnedin the open [Roberts, 1973]. Estimates of how much isburned are rare. We interpret phrases such as ‘‘substantialquantities’’ [WB, 1985j] and ‘‘all’’ [WB, 1981] of the ricehusks produced from milling operations consumed as fuelto mean 100% rice husk used in the processing plants insoutheast Asia. In India, rice processing plants arefrequently diesel-powered, hence, rice hulls accumulatein piles around the mill and are burnt there (R. Huke,personal communication, 1998). We estimate that 40% ofrice hulls are burnt outside the mills. For Africa, whoserice production is only 2% of the global total, the WBreports for Mali [WB, 1991c] and Madagascar [WB,1987a] suggest that rice husks are used as an energysource in the factories, that small amounts are used forfodder, but that much of the residue is hauled away todecompose or burn. We assumed that 50% is used asindustrial fuel, 45% is burned in the open field, and 5% isleft to decompose.[136] Coconut residues are the most important of the
minor agricultural residues. The largest suppliers of coco-nuts are Indonesia, the Philippines, Malaysia, and SriLanka. In many cases, the husks and shells are needed foropen-fire drying of the copra [Thampan, 1987; Pushparajahand Soon, 1986; WB, 1985i, 1984n, 1985h, 1983f ], for thefuel in the boilers of the processing factories [WB, 1985i,1985a], for charcoal-making [WB, 1985a; Pushparajah andSoon, 1986], and for domestic fuels [WB, 1985d, 1985a,1985i]. These sources provide some data on how much huskand shell may be burned. We estimate the use of coconutresidue as boiler fuel to be 50–60%, with the reminder usedfor open-air drying of copra. Where specific estimates aregiven for such uses as charcoal-making and fish-drying[WB, 1985a], we assume these values to be estimates ofdomestic fuel use.[137] Cottonseed hulls are burned in processing industries,
mainly in vegetable oil refineries [WB, 1986a], but also insugar refineries [WB, 1983i] and breweries [WB, 1982g].Some individual reports give estimates of the amount ofcottonseed husks used for agro-industrial fuel, 30–75% inTogo and �100% in Ivory Coast [WB, 1985g, 1985a]. Weassumed that 75% of the waste is used as industrial fuel incotton-growing countries where quantitative information islacking, and that the remaining 25% decomposes or burns inthe fields [WB, 1984f ].[138] Groundnut hulls are often used as fuel in the
groundnut processing plants [WB, 1983g, 1983k, 1983h,1985j]. Estimates of this use vary from none in Mali[WB, 1991c] and Guinea Bissau [WB, 1984i] to 50%[WB, 1983g] and 100% [WB, 1983k]. Remaining groundnuthulls are left to decompose or burn [WB, 1991c]. Weassumed equal amounts were used as agro-industrial fueland burned in the open (possibly near the plants) in thecountries for which we had no specific data.[139] Coffee residues are used as fuel in the boilers of the
coffee processing industry [Silva et al., 1998]; in addition,the excess also accumulates at the processing mills[Senelwa and Hall, 1993; WB, 1984g, 1985a, 1986d]. The
YEVICH AND LOGAN: BIOFUEL AND WASTE BURNING 6 - 29

detailed WB report for Ethiopia describes the practice ofpiling the coffee cherry skins and husks outside thedecortication mills. At times, the internal temperature inthe piles of husks gets so high that the decomposing mixignites spontaneously. Several other reports indicate onlyminimal fuel use. In Uganda, the trucks which deliver thedry coffee cherry to the processing plants return to thefarms with the coffee hulls for mulch in the coffee gardens(S. J. Carr, personal communication, 1996). Given thisqualitative information, we have crudely apportioned thecoffee residue use to be 50% decomposition and 50% open-air burning.[140] Malaysia, Indonesia, and Nigeria provide 80% of
the world’s palm oil. In Malaysia, leftover fruit bunches areburnt on site at the mills [Husin et al., 1987; Salam, 1987;R. Philips, personal communication, 1995]. Similarly, inNigeria the fiber and shells are used as fuel in the steamboilers [Omereji, 1993]; shells are also used as artisanal andhousehold fuels [Ay, 1980]. Additional detailed reports onpalm oil processing in Benin [WB, 1985d] and Togo[WB, 1985g] suggest all residue in this industry is used forenergy. We assume that 100% of palm processing residuesare burned as part of the industry, except in Nigeria wherewe assume 100% of the empty fiber bunch and 50% theshells are burned as part of the industry, with the other 50%used for household fuel.
Appendix B: Units and Energy Values
[141] To compare the amounts of biomass burned, all datawere expressed in gravimetric units. Within this report,using ‘‘ton’’ as a unit refers to 1000 kg, or 1 Mg. Weconverted woodfuel amounts in volumetric units to units ofweight using conversion factors of 1.4 m3/Mg (15% mois-ture content), or 1.5 m3/Mg, depending on whether thewood was more dense (in the more arid regions) or lessdense (in regions with significant rainfall) (K. Openshaw,personal communication, 2000). If survey data included avolume to weight ratio, it superceded our default values.[142] Openshaw [1986] provides a detailed discussion of
the factors influencing the energy content of various typesof biofuels. The moisture content for wood, and moistureand inorganic content (ash) for crop residues and dung arethe main determinants of their energy values. As themoisture content of wood varies from wet to fully dried, theenergy values range from 8.2 MJ/kg to 18.7 MJ/kg[Openshaw, 1986]; for a default, we chose 16.0 MJ/kg asthe energy value for fuelwood, assuming a 15% moisturecontent (dry basis). For crop residue, the energy valuesrange from 5.8 MJ/kg for fresh (100% moisture) residuewith 20% ash content, to 16.7 MJ/kg for a completely dryresidue with 5% ash content; for our default residue energyvalue, we have selected 13.5 MJ/kg, for 10% ash contentand 15% moisture content (dry basis). The energy values fordung range from 6.8 MJ/kg for wet matter and 25% ashcontent to 17.0 MJ/kg for totally dry matter and 20% ashcontent; we chose as default 14.5 MJ/kg. For conversion toamount carbon per amount dry matter, we used themultiplicative factors 0.45 gm C/gm DM for wood,0.40 gm C/gm DM for crop residue, and 0.35 gm C/gm
DM for dung [Smith et al., 2000], unless other conversionswere indicated.
Appendix C: Emission Factors
[143] The emission factors of trace gases from biomasscombustion are influenced by several factors includingthe actual amount of carbon in the preburned dry matter,the size, shape and moisture content of the sample, and theflaming versus smoldering pattern of the burning process[Ward et al., 1996]. Most published emission factors arebased on emission ratios using a carbon balance methodwhich requires knowing the carbon content of the fuel. Thecarbon content of the biomass fuel is inversely proportionalto the moisture content and the noncarbon ash content[Smith et al., 1993] which can range from 0.3% by weight(dry basis) for ponderosa pine to 24% for rice straw left inthe field over the winter [Jenkins and Ebeling, 1985].Carbon in the preburned biofuels or residue can vary from35% by weight (for rice straw [Jenkins, 1989]) to 54%(South Africa leaves [Susott et al., 1991]), but is oftenassumed to be about 50% [Marufu, 1999; Smith et al.,1993]. Errors in the assumed carbon content can lead todiscrepancies in emission factors calculated using thecarbon balance method. This method equates the totalcarbon in the preburn fuel to the sum of carbon in all itspostburn forms, from the charred uncombusted fuel to thevolatiles [Ward and Radke, 1993; Smith et al., 1993].Published emission factors for CO2 are 1393–1620 gmpollutant/kg biofuel with carbon content ranging from41.8–50% [Smith et al., 2000; Zhang et al., 2000; Brocardet al., 1998; Smith et al., 1993;Marufu, 1999]; if we adopt a50% carbon content, the emission factor range is reduced to1551–1664 gm CO2/kg biofuel. The distribution of carbonin the products from biomass burning: CO2, CO, CH4,NMHC, TSP, ash, and uncombusted fuel, is stronglyinfluenced by the temporal pattern of flaming and smolder-ing (more and less efficient combustion, respectively) in theburning process [Brocard et al., 1998; Marufu, 1999;Jenkins and Turn, 1994; Ward et al., 1996; Joshi et al.,1989].
C1. Biofuels
[144] Several groups have designed experiments whichreplicate conditions commonly found in the combustionpractices in developing countries in order to characterizeemission factors for biofuels [Zhang et al., 1999; Brocard etal., 1998; Marufu, 1999; Bertschi et al., 2003]. Marufu andBrocard et al. used stoves common to Zimbabwe and WestAfrica, depression-in-the-ground and three-stone stove,respectively; Zhang et al. [1999] examined burning of56 combinations of fuels and stoves commonly used inIndia and China, and Bertschi et al. [2003] studiedtraditional cooking fires in rural Zambia.[145] We display the results reported by these and other
groups in Table 22. We included the percent carbon mea-sured or assumed for the biofuel in the first column, ifavailable. Marufu [1999] assumed 50% carbon; we used thecarbon balance to calculate the CO2 and CO emissions if hehad assumed the values of Zhang et al. [2000] and Smith etal. [2000]: 45% C in fuelwood, 33.4% C in dung and 34.8%
6 - 30 YEVICH AND LOGAN: BIOFUEL AND WASTE BURNING

C in maize residues. Using the measured carbon contentbrings the results of Marufu closer to those of Zhang et al.[2000] and Smith et al. [2000], except for crop residues. Incomparing emission factors in Table 22, we observe that therange of factors reported from the experiments of Zhang etal. [2000] and Smith et al. [2000] encompass the factorspublished in the other reports, at least for fuelwoodcombustion. We note that within the developing world,domestic fuel burning involves using wood with differentcarbon and moisture content with different methods offlaming and smoldering, depending on the need to conservefuel; we do not have information on the how these variableschange, region to region. The experiments described aboveuse various techniques to measure the products of burningand make different assumptions of carbon dispersal. Morecareful assessment of traditional practices of household fueluse in the developing countries is needed, together withcorresponding experiments to monitor trace gas emissionsfrom this burning.[146] To derive estimates of these emissions, we propose
the following: biofuels used in household combustion areusually air-dried (giving them higher moisture content thanoven-dried samples used in experiment) and also frequentlyinclude brush and twigs with higher ash content (B. Jenkins,personal communication, 2002) which argues for fuel with alower carbon content; we selected 45%. We then chose theemission factors of Brocard et al. [1998] from experimentsin West Africa of 1467 and 70 grams pollutant/kg dry fuelfor CO2 and CO, respectively; these are close to averages ofthe mean for India [Smith et al., 2000] and for China [Zhanget al., 2000] (Table 22). For the emission factors of CH4,NO2, and TSP, we averaged the mean values of Smith et al.[2000] and Zhang et al. [2000], since Zhang et al. [2000]note that these fuel/stove combinations represent a largefraction of combinations in use worldwide. The spread ofvalues for emission factors of CH4 and NOx is much largerthan those of CO.[147] The charcoal burning emission factors are taken
from the results of Smith et al. [1993] except for NOx,which is from the review of Andreae and Merlet [2001].Two independent studies on combustion of dung [Smith etal., 2000; Marufu, 1999] give very similar emission factorsfor CO and CO2, when adjusted to the correct carboncontent; we chose the values from Smith et al. [2000]. Forthe other gases, we used the work of Andreae and Merlet[2001]. While the range of values for residue burning islarge, mean emission factors for CO2 and CO fromcombustion of rice straw, mustard stalk, maize residue,and wheat straw are similar. We used the Zhang et al.[2000] values for all emission factors, except for CO2; forthis we took the Smith et al. [2000] as it is close to the otherresults given in Table 22.
C2. Charcoal Production
[148] Emissions of atmospheric gases during charcoalproduction depend on the type of kiln used [Openshaw,1986; Smith et al., 1999], as well as the type and moisturecontent of wood used, and the skill of the operator [Foley,1986; Openshaw, 1986]. Since emission factors are oftenexpressed as amount of trace gas per amount of charcoal
produced, and information on charcoal production is givenin terms of amount of wood used for charcoal production,knowing the efficiency of the conversion process isessential to calculate the trace gas emissions. Kilns in thedeveloping world range from the traditional earth moundsor pits with efficiencies as low as 10% [Foley, 1986] toindustrial kilns with efficiencies of up to 33% (WH94).[149] In Africa, the earth mound kiln is used almost
exclusively (Africa [Smith et al., 1999], West Africa[Brocard et al., 1998], Zambia [Hibajene et al., 1993],Malawi [Openshaw, 1997a, 1997b], Kenya [Kituyi et al.,1999; Pennise et al., 2001], Senegal and Tanzania [Foleyand van Buren, 1982]). From World Bank reports for the1980s, the estimates of efficiencies for these kilns variedfrom 9% to 20%, and were lower than those given in the1990s (20–29%) [Smith et al., 1999; Brocard et al., 1998;Openshaw, 1997a; Hibajene et al., 1993]. We chose anestimate of 15% efficiency (20% efficiency for Sudan) forour charcoal numbers for 1985, and used the emissionfactors of Brocard et al. [1998] as representative of all thekilns in Africa (see Table 23).[150] Smith et al. [1999] described the types of charcoal
kilns used in Thailand and suggested that these arerepresentative for Asia; the efficiencies of these kilnsranged from 29.4 to 33.3%. From other sources, we haveestimates of 18–25% efficiency for kilns in Asia[WB, 1994b, 1985f ] (see also the IPCC Reference Manualprovided by Smith et al. [1999]). We chose an efficiency of25% for Asian kilns, unless specified for an individualcountry and used the charcoal production emission factorsfrom Smith et al. [1999] (see Table 23).[151] Most of the charcoal used commercially in Brazil is
produced in brick or mud beehive kilns which have anefficiency of 33% (WH94). We used emission factors forproduction in brick beehive kilns from Smith et al. [1999]for Brazil, as well as for the commercially producedcharcoal for the steel and iron industries of Bolivia, Peru,and Paraguay. The recent report of Pennise et al. [2001]presents studies on emissions from Brazilian kilns whichmay provide more realistic emission factors than those wechose. For charcoal produced for domestic use in LatinAmerica, we adopted the kiln efficiency of 17% reported byvan Buren [1990] and used the Intergovernmental Panel onClimate Change (IPCC ) [1997] default world averageemission factors (Table 23).
C3. Open Field Burning
[152] The emission factors for CO2 from residue com-busted in the open field (Table 24) are similar to those forresidue used as biofuel (Table 22). The open field burningemissions of CO and CH4 tend to be much lower than thosemeasured for biofuel. Given that the moisture and ashcontent are very similar [Jenkins and Turn, 1994; Zhanget al., 2000], we can explain the differences by postulatingthat a larger proportion of uncombusted fuel remains. Avariety of techniques have been used to measure emissionsfrom burning of agricultural waste. Ezcurra et al. [1996]used an aerosol dilution chamber to burn samples of cerealstraw while Jenkins and Turn [1994] burned samples ofbarley, corn, rice, and wheat residues on a conveyor belt in a
YEVICH AND LOGAN: BIOFUEL AND WASTE BURNING 6 - 31

combustion wind tunnel; Nguyen et al. [1994] measuredgaseous emissions during burning of rice straw out in thefields in both the wet and dry seasons, but did not providethe biomass loading.[153] We present all emission factors in units of gm
pollutant/kg dry matter to be burnt in Table 24 and comparethe values for straw burning with estimates for mean valuesfor savanna burning given by Andreae and Merlet [2001].The residues which are the most significant contributors tofield burning of agricultural waste are rice straw and barbojo(see Table 14). We determined emission factors for theburning gases by weighting the emissions factors for ricestraw [Jenkins and Turn, 1994], barbojo, and other cerealsby the fraction of global burning in fields ascribed to thethree components (weighting of 40:31:20%) Our chosenemission factors fall within the ranges presented in Table 24for CO2 and CO, are somewhat high for NOx (reflecting thedominant rice straw burning), and are typical for TPM.
Appendix D: Decomposition
[154] Decomposition of residues left in the fields afterharvest is influenced by substrate composition and theenvironment, particularly temperature and moisture [Bell,1974]. The tropical regions provide optimal conditions formicrobial decomposition of plants. In a simple view, thesequence of the breakdown of plant matter is that thestarches and sugars decompose most rapidly, followed bycellulose and hemicellulose, and finally the woody part ofthe stalk, known as lignin [Bell, 1974]. Since the leafyportion of the residue decomposes very quickly in thetropical rain forest [Bates, 1960] (100% decomposition), weconfine our discussion to the stalks and straw of four majorcrops: maize, millet, sorghum, and rice.[155] For all four types of stalk and straw, we assume that
the soluble organic matter totally decomposes between thecrop harvest and the next preplant burn [Martin et al., 1942;Satchell, 1974], and that the lignin portion of the residue(about 10%) remains almost entirely intact [Martin et al.,1942] and burns in the preplant burn. The remaining matter,the hemicellulose and cellulose portion, only partiallydecomposes [Swift et al., 1979].[156] For the case of the maize stalks, lignin represents
about 8.5% of the dry weight of the stalk [Muller et al.,1971], hemicellulose about 18%, and cellulose about 30%[Swift et al., 1979]. From experiments on decompositionrates over 40% of the cellulose and hemicellulose havedecomposed after 30 days [Swift et al., 1979]. Using thesedata, we estimate that 62% (including the soluble organicmatter) of the stalks left in the fields decompose, and thatthe remaining 38% is burned before planting.[157] The soluble cell content of millet straw is approx-
imately 24% and that of sorghum straw about 30% [Reed,1992; Alhassan, 1990]. Assuming that 40% of thehemicellulose and cellulose decomposes for these residuesalso, we estimate that 52% of millet and sorghum stalksdecompose, and 48% burn in the fields.[158] Quantitative information on the decomposition of
rice straw was unavailable, so we based our estimates onwheat straw [Swift et al., 1979], for which about half the
straw decomposes. The remaining 50% is assumed to beburned in the fields, unless other information is available.For the Southeast Asia region where several rice crops aregrown per year, we presume that with no time fordecomposition of the residue, most of the rice straw isburned.
Appendix E: Open Field Burning in theDeveloped World
[159] Here we discuss burning of crop residue in theUnited States, Canada, countries in Western Europe, andcountries of the former Soviet Union (FSU). Open fieldburning of barbojo and cereal residues occurs in parts ofthe United States. About 90% of the barbojo is burned inthe four sugar cane producing regions (Hawaii, PuertoRico, Florida, Louisiana) (W. Webb, personal communica-tion, 1995; P. Seilhon, personal communication, 1995). Asproduction of cane has declined recently in Hawaii andPuerto Rico (United States Department of Agriculture,Farm Service Agency, Sweetener Market Data: Sugar,available at http://www.fsa.usda.gov/AO/epas/dsa/sugar/fy98fwrd.htm/), we would expect the corresponding fieldburning to decline as well. Of the cereals, over 1 Tg ofrice straw, �90%, is burned in California [Jenkins et al.,1991] (P. Seilhon, personal communication (EPA report of1992), 1992), but only small amounts are burned in thesouthern states (e.g., 7.5% in Louisiana, 1% in Texas), dueto the much faster decomposition of the straw in thewarmer, wetter climate of the south (P. Seilhon, personalcommunication, 1995). Estimates of the burning of wheatstubble for 1985 range from minor (0–5%) in the south-western states of Colorado, Arizona, and New Mexico(R. Young, personal communication, 1995) to 5–20% inMissouri, Kansas, Louisiana, Tennessee (D. Fjell, personalcommunication, 1995; R. Fears, personal communication,1995), to �30 in Montana and North Dakota where it iscolder and drier and decomposition is slow (V. Knerr,Gallatin County Extension, personal communication, 1995).Corn residue in the midwest states is left to decompose inthe fields [Jenkins et al., 1991; J. W. Dudley, personalcommunication, 1995]. Cotton stalks in Texas and Cali-fornia are ploughed under to prevent growth of pests(C. Crane, personal communication, 1995). Grass-seedresidue is burned in Oregon, the major grass seed producerin the United States [Young, 1998; R. Fears, personalcommunication, 1995; W. Young, personal communication,1995].[160] The major grain-producing provinces in Canada are
the large wheat-growing states of Manitoba, Saskatchewan,and Alberta. Estimates of wheat straw burned are less than10% for 1985 (Agricultural Representative: Department ofAgriculture, Manitoba).[161] The agricultural wastes burned in Australia are
residues of wheat, coarse grains, and sugar cane [Hurst etal., 1996; National Greenhouse Gas Inventory Committee(NGGIC ), 1996; Gupta et al., 1994; Canteromartinez et al.,1995]. We used the state-by-state profiles of crop produc-tion for 1990 of the Australian National Greenhouse GasInventory [NGGIC, 1996] for distributing the FAO
6 - 32 YEVICH AND LOGAN: BIOFUEL AND WASTE BURNING

estimates of Australian production of wheat, coarse grains,and sugar cane in 1985 [FAO, 1986a]. In addition, theinventory contained estimates of residue-to-crop ratio,percent dry matter, and fraction of residue burned in thefield for each crop. We used these estimates in constructingour distributions of agricultural waste burned in the fields,even though, in the case of sugar cane, there wereunresolved differences between estimates of the Australian[NGGIC, 1996] and the ones suggested by the United StatesEnvironmental Protection Agency (EPA) [2000].[162] There is a general trend to prohibit burning in
western Europe [Jenkins et al., 1992]. However, in theUnited Kingdom up to 1989, approximately 30% of barleyand wheat straw residue (or about 6 Tg) was burnedannually [Jenkins et al., 1992]. Ezcurra et al. [1996]document the burning of more than 6 Tg of cereal waste inSpain. In Greece, the burning of up to 80% of wheat straw(about 2 Tg) occurs [Kalburtzi et al., 1990; K. Kalburtzi,personal communication, 1996].[163] For the FSU in 1985, a portion of the crop residue
was used as animal fodder (S. Zhourek, personal commu-nication, 1994). Much of the remaining residue is taken offthe field and piled in heaps and left to decompose. InKazakhstan, combines collected the straw and left it in pilesand the leftover stubble was ploughed under; the rice strawin the Dnieper River region was not burned (K. Gray,personal communication, 1996). We assumed that the cottonstalks were burned mainly as fuel, but in minor amount astrash in the fields; since 80% of the FSU cotton was grownin the five Central Asian Republics [FAO, 1995], we haveconcentrated it there. From recent AVHRR data compositefire images over southern Russia indicate major burning(C. Heald, personal communication, 2001) in March; thesefires might be preplant burning of agricultural trash leftoverfrom the previous year’s harvest. More careful analysis isneeded to determine if this should be added in to theagricultural residue burning estimate.
Appendix F: Spatial Distribution of Biofuel Useand Agricultural Waste Burning
[164] Biofuel use within each country (and province forChina, India and Brazil) was spatially distributed using amap of rural population density that we developed specif-ically for this purpose. We used a digital database developedat the NASA Goddard Institute for Space Studies [Lerner etal., 1988], which labels each land 1� � 1� cell of the worldwith a code identifying the country. China, India and Brazilare subdivided into their major political entities. Nationalpopulations for 1985 were taken from the UN UnitedNations [1992], and those for the subdivisions fromEncyclopedia Brittanica [1987]. The rural fraction of thepopulation, and the agriculturally active population in eachcountry were taken from the same sources.[165] Two other global 1� � 1� databases were used to
distribute the rural population within each country, the firstto identify habitable land [Lerner et al., 1988], and thesecond to locate regions of crop production [Ramankuttyand Foley, 1998]. Habitable land was identified using adatabase developed for the purpose of locating animals; in
this case, each grid cell was assigned to use either byanimals, lumber industry, ice, or no use at all [Lerner et al.,1988]. We considered grid cells designated as animal useand lumbering to be habitable. In countries which wouldcontain no habitable area in this plan, we reassigned certaincells as habitable based on published population maps [e.g.,London Times, 1990]. The locations of agriculture wereidentified using a global map of croplands distribution thatdetailed the crop fractions within gridboxes of 5 min by5 min resolution; these had been determined by analyzingseasonal variations in vegetation indices for AVHRR data[Ramankutty and Foley, 1998]. We note that although thecropland cover within a gridbox provides a suitablesurrogate for locating the farming population of a country,it does not give information as to the density of theagricultural population or the density of crops. This is asource of error in distributing both the biofuel use(population based) and amount of residue burned in thefields (crop based).[166] We assume that the major users of biofuels are the
rural population. Within each country, the agriculturallyactive portion of the population was distributed equallywithin the agricultural cells and the remaining rural popu-lation was apportioned over all habitable cells. For China,India, and Brazil, the population was distributed in theappropriate province. The burned biomass in each country(or province) was then spread among the appropriate cellsusing the population density, to generate Figures 3–5. Theburning of crop residues in the fields was distributeddirectly according to the croplands map [Ramankutty andFoley, 1998].
[167] Acknowledgments. We extend our sincere appreciation for thedetailed advice and information provided by Keith Openshaw in assessingwoodfuel and charcoal use in Africa and Asia. We acknowledge usefuldiscussions with Doug Barnes on biofuel use in China and in urbanenvironments. Special thanks are due to Judith Bradow for providing manyinteresting facts on cotton production both nationally and globally. Wethank James Parr for sharing his expertise on fodder use of crop residue innorthern Africa and the Near East. We benefited from conversations withJohn Kadyszewski on characteristics of sugar cane burning worldwide. Wewould like to thank Bryan Jenkins, who supplied detailed reports andexplanations of experiments to determine emission factors of trace gasesfrom field burning of crop residues. We appreciated both the anecdotal andquantitative information from the late David Hall. Finally, we gratefullyacknowledge the assistance of the World Bank in providing many of theirreports on energy use in developing countries. This work was funded withsupport from the National Science Foundation, grants ATM-9320778 andATM-9903529, and from the National Aeronautics and Space Administra-tion, including grant NAG1-2025.
ReferencesAbu Sin, M. E., and H. R. J. Davies (Eds.), The Future of Sudan’s CapitalRegion: A Study in Development and Change, 273 pp., Khartoum Univ.Press, Khartoum, Sudan, 1991.
Alhassan, W. S., The potential of sorghum straw as a livestock feed inNigeria, paper presented at Symposium on the Current Status and Poten-tial of Industrial Uses of Sorghum in Nigeria, 4–6 December 1989,Kano, Nigeria, Int. Crops Res. Inst. for the Semi-Arid Trop. (ICRISAT),Zaria, Nigeria, 1990.
Andreae, M. O., Biomass burning: Its history, use, and distribution and itsimpact on environmental quality and global climate, in Global BiomassBurning: Atmospheric, Climatic and Biospheric Implications, edited byJ. S. Levine, MIT Press, Cambridge, Mass., 1991.
Andreae, M. O., and P. Merlet, Emission of trace gases and aerosols frombiomass burning, Global Biogeochem. Cycles, 15, 955–966, 2001.
Areola, O., Ecology of Natural Resources in Nigeria, 258 pp., Gower,Brookfield, Vt., 1991.
YEVICH AND LOGAN: BIOFUEL AND WASTE BURNING 6 - 33

Arnold, J. E. M., and J. Jongma, Fuelwood and charcoal in developingcountries: An economic survey, Unasylva, 29, 2–9, 1978.
Ay, P., Fuelwood and charcoal in the West African forest: Field research inWestern Nigeria, in Rural Energy Systems in the Humid Tropics: Pro-ceedings of the First Workshop of the United Nations University RuralEnergy Systems Project, edited by W. B. Morgan, R. P. Moss, and G. J.A. Ojo, pp. 26–38, U. N. Univ., Tokyo, 1980.
Baguant, J., The case of Mauritius, in Energy Management in Africa, editedby M. R. Bhagavan and S. Karekezi, pp. 127–176, Zed, London, 1992.
Ball-Coelho, B., H. Tiessen, J. W. B. Stewart, I. H. Salcedo, and E. V. S. B.Sampaio, Residue management effects on sugarcane yield and soil prop-erties in Northeastern Brazil, Agron. J., 85, 1004–1008, 1993.
Banwell, P. S., and R. C. Harriss, Enhancing biomass energy use in Kenya,Nat. Resour. Forum, 20, 298–307, 1992.
Barnard, G., and L. Kristoferson, Agricultural Residues as Fuel in the ThirdWorld, 178 pp., Earthscan Energy Inf. Programme, London, 1985.
Barnes, D. F., Population growth, wood fuels, and resource problems insub-Saharan Africa, in Population Growth and Reproduction in Sub-Saharan Africa, edited by G. T. F. Acsadi, G. Johnson-Acsadi, andR. A. Bulatao, pp. 44–59, World Bank, Washington, D. C., 1990.
Barnes, D. F., and L. Qian, Urban interfuel substitution, energy use, andequity in developing countries: Some preliminary results, paper presentedat the International Conference of the International Association forEnergy Economics, Int. Assoc. for Energy Econ., Honolulu, Hawaii, July8–10, 1992.
Barnes, D. F., K. Krutilla, and W. Hyde, The urban energy transition:Energy, poverty, and the environment in the developing world, draftreport, World Bank, Washington, D. C., 2001.
Bashou, S. A., New approaches to the development and utilisation ofrenewable energy resources in Uganda, in African Energy: Issues inPlanning and Practice, pp. 15–19, Zed, London, 1990.
Bates, J. A. R., Studies on a Nigerian forest soil: The distribution of organicmatter in the profile and in various soil fractions, J. Soil Sci., 11, 246–257, 1960.
Behrens, A., Total energy consumption by Brazilian households, Energy,11, 607–611, 1986.
Bell, M. K., Decomposition of herbaceous litter, in Biology of Plant LitterDecomposition, vol. I, edited by C. H. Dickinson and G. J. F. Pugh,chap. 2, 37–67, Academic, San Diego, Calif., 1974.
Benkovitz, C. M., M. T. Schultz, J. Pacyna, L. Tarrason, J. Dignon, E. C.Voldner, P. A. Spiro, J. A. Logan, and T. E. Graedel, Global griddedinventories for anthropogenic emissions of sulfur and nitrogen, J. Geo-phys. Res., 101, 29,239–29,253, 1996.
Bergsen, A., and H. S. Levine (Eds.), The Soviet Economy: Toward theYear 2000, 452 pp., Allen and Unwin, Concord, Mass., 1983.
Bhagavan, M. R., Angola, in Energy and Development in Southern Africa:SADCC Country Studies Part I, edited by P. O’Keefe and B. Munslow,pp. 7–64, Beijer Inst., R. Swed. Acad. of Sci., Uppsala, Sweden, 1984.
Bianchi, A., V. S. Bogach, G. Best, and M. Wionczek, Energy in LatinAmerica, 138 pp., U. N. Univ., Tokyo, 1990.
Blandon, P., Soviet Forest Industries, 290 pp., Westview, Boulder, Colo.,1983.
Bogach, V. S., Wood as Fuel: Energy for Developing Countries, 153 pp.,Praeger, Westport, Conn., 1985.
Bogach, V. S., Energy options in Central America, in Energy in LatinAmerica, edited by A. Bianchi et al., pp. 64–94, U. N. Univ., Tokyo,1990.
Brasilia Ministerio das Minas e Energia, National Energy Balance 1987,Minist. of Mines and Energy, Brasilia, 1987.
Brito, J. O., Fuelwood utilization in Brazil, Biomass Bioenergy, 12, 69–74,1997.
Brocard, D., J. P. Lacaux, and H. Eva, Domestic biomass combustion andassociated emissions in West Africa, Global Biogeochem. Cycles, 12,127–139, 1998.
Butcher, S. S., U. Rao, K. R. Smith, J. Osborn, P. Azuma, and H. Fields,Emission factors and efficientices for small-scale open biomass combus-tion: Toward standard measurement techniques, paper presented atAnnual Meeting, Am. Chem. Soc., Washington, D. C., 1984.
Canteromartinez, C., G. J. Oleary, and D. J. Connor, Stubble retention andnitrogen fertilisation in a fallow—wheat rainfed cropping system: 1. Soilwater and nitrogen conservation, crop growth and yield, Soil Tillage Res.,34, 79–94, 1995.
Cecelski, E., J. Dunkerley, and W. Ramsay, Household Energy and thePoor in the Third World, Resour. for the Future, Washington, D. C., 1979.
Central Intelligence Agency, World Factbook, 1984, Washington, D. C.,1984.
Central Intelligence Agency, World Factbook, 1991, Washington, D. C.,1991.
Changchun Institute of Geography, Conservation Atlas of China, 238 pp.,Science, Beijing, 1990.
Christensen, J., North east arid zone development programme: NEAZDP,in The Sahel: Population, Integrated Rural Development Projects, andResearch Components in Development Projects: Proceedings of the 6thDanish Sahel Workshop, 6–8 January, 1994, edited by A. Reenbergand B. Markussen, pp. 57–63, Aarhus Univ. Press, Risskov, Denmark,1994.
Craig, G. M., (Ed.), The Agriculture of the Sudan, 468 pp., Oxford Univ.Press, New York, 1991.
Crutzen, P. J., and M. O. Andreae, Biomass burning in the tropics: Impacton atmospheric chemistry and biogeochemical cycles, Science, 250,1669–1678, 1990.
Crutzen, P. J., L. E. Heidt, J. P. Krasnec, W. H. Pollock, and W. Seiler,Biomass burning as a source of atmospheric gases CO, H2, N2, NO,CH3Cl and COS, Nature, 282, 253–256, 1979.
Davidson, O. R., Energy issues in sub-Saharan Africa, Ann. Rev. EnergyEnviron., 17, 359–403, 1992.
De Carvalho Macedo, I., The sugar cane agro-industry—Its contributionto reducing CO2 emissions in Brazil, Biomass Bioenergy, 3, 77–80,1992.
Dederi, W. I., Management of the Nigerian environment with reference tothe activities of the Kano State, in Sustainable Development in Nigeria’sDry Belt: Problems and Prospects, Proceedings of the NEST AnnualWorkshop, edited by K. O. Ologe, chap. 11, pp. 81–87, Niger. Environ.Study/Action Team, Ibadan, Nigeria, 1990.
Del Buono, M., Ecuador: Energy and social equity: A preview of the energyconsumption survey, ESMAP Connection, 1, 1–12, 1993.
de Montalembert, M. R., and J. Clement, Fuelwood supplies in thedeveloping countries, FAO For. Pap. 42, Food and Agric. Org., Rome,1983.
Department of Agriculture/Ministry of Agriculture and Cooperatives inThailand, Traditional and modern practices of utilizing organic materialsas fertilizers in Thailand, in Organic Recycling in Asia, Workshop on theUse of Organic Materials as Fertilizers in Asia, 26 October–5 November1976, in Bangkok, Thailand, FAO Soils Bull. 36, Food and Agric. Org.,Rome, 1978.
Desai, A. V., Ends and means in rural energy surveys, Rep. IDRC-MR112e,Int. Dev. Res. Cent., Ottawa, June 1985.
Dewalt, B. R., Population and resource destruction in Honduras, in Popula-tion and Land Use in Developing Countries: Report of a Workshop,edited by C. L. Jolly and B. B. Torrey, pp. 106–123, Natl. Acad.,Washington, D. C., 1993.
Dicko, M. S., and M. Sangare, Feeding behaviour of domestic ruminants inSahelian Zone, in Rangelands: A Resource Under Siege, Proceedings ofthe Second International Rangeland Congress, edited by P. J. Joss, P. W.Lynch, and O. B. Williams, pp. 388–390, Cambridge Univ. Press, NewYork, 1986.
Digernes, T. H., Wood for fuels: Energy crisis implying desertification:The case of Bara, the Sudan, thesis, 128 pp., Geografish Inst., Bergen,Norway, 1977.
Di Marzo, L., A conceptual framework of analysis and action on energy andthe environment in Indonesia, Environ. Rep. 26, Dalhousie Print. Cent.,Halifax, N.S., Canada, 1994.
Diphaha, J. B. S., and R. Burton, Photovoltaics and solar water heaters inBotswana, in Energy Options for Africa: Environmentally SustainableAlternatives, edited by S. Karekezi and G. A. Mackenzie, pp. 139–153, Zed, London, 1993.
Division de Programacion Energetica, La Demanda de Lena y CarbonVegetal en el Paraguay, Proyecto PAR/85/003 PNUD/BIRF, ProgramaNacional de Desarrollo Energetico, Republica del Paraguay, Presidenciade la Republica, Secretaria Tecnica de Planificacion, Division deProgramacion Energetica, Asuncion, Paraguay, November 1986.
Duncan, B. N., R. V. Martin, A. C. Staudt, R. Yevich, and J. A. Logan,Interannual and seasonal variability of biomass burning emissions con-strained by satellite observations, J. Geophys. Res., 108, 4100,doi:10.1029/2002JD002378, 2003.
Dwyer, E., S. Pinnock, J. M. Gregoire, and J. M. C. Pereira, Global spatialand temporal distribution of vegetation fire as determined from satelliteobservations, Int. J. Remote Sens., 21, 1289–1302, 2000.
Earl, D. E., Forest Energy and Economic Development, 128 pp., Clarendon,Oxford, UK, 1975.
Ebinger, C. K., Pakistan: Energy Planning in a Strategic Vortex, 155 pp.,Indiana Univ. Press, Bloomington, Ind., 1981.
Eckholm, E. P., The other energy crisis: Firewood, Worldwatch Pap. 1,22 pp., Worldwatch Inst., Washington, D. C., September 1975.
Economic and Social Commission for Asia and the Pacific, Statistical Year-book for Asia and the Pacific, U. N., Bangkok, Thailand, 1987.
6 - 34 YEVICH AND LOGAN: BIOFUEL AND WASTE BURNING

Elgizouli, I. A. R., Rural—Urban household energy use and inter-relation inthe central region of the Sudan, in African Energy: Issues in Planningand Practice, pp. 37–41, Zed, London, 1990.
Ellegard, A., Charcoal utilisation in Zambia, Renewable Energy Dev., 7, 4,1994.
Energy Information Administration (EIA), Estimates of U.S. wood energyconsumption from 1949 to 1981, Rep. DOE/EIA-0341, U.S. Dep. ofEnergy, Washington, D. C., August 1982.
Energy Sector Management Assistance Programme, China: Energy for ruraldevelopment in China, An assessment based on a joint Chinese/ESMAPstudy in six counties, Report of the Joint UNDP/World Bank EnergySector Management Assistance Program and the Ministry of Agriculture,Government of China No. 183/96, The World Bank, Washington, D. C.,July 1996.
Energy Sector Management Assistance Programme, India: Householdenergy strategies for urban India, the case of Hyderabad, Rep. 214/99,World Bank, Washington, D. C., June 1999.
England, S. B., and D. M. Kammen, Energy resources and development inVietnam, Annu. Rev. Energy Environ., 18, 137–167, 1993.
English, J., M. Tiffen, and M. Mortimore, Land resource management inMachakos District, Kenya, 1930–1990, World Bank Environ. Pap. 5,World Bank, Washington, D. C., 1994.
Environmental Protection Agency, National air pollutant emissions trends,1970–1996, EPA-454/R-97-011, Research Triangle Park, N. C., 1997.
Environmental Protection Agency, U.S. Emissions Inventory, report,Research Triangle Park, N. C., April 2000. (Available at http://www.epa.gov/globalwarming/publications/emissions/us2000/)
Ernst, E., Fuelwood consumption among rural families in Upper Volta,paper presented at 8th World Forestry Congress, Peace Corps, Ouaga-dougou, Upper Volta, 1977.
European Space Agency, ATSR World Fire Atlas, Frascati, Italy, 2000.(Available at http://shark1.esrin.esa.it/FIRE/AF/ATSR/)
Ezcurra, A. T., I. O. de Zarate, J.-P. Lacaux, and P.-V. Dinh, Atmosphericimpact of Cereal—Waste burning in Spain, in Biomass Burning andGlobal Change, vol. 2, Biomass Burning in South America, SoutheastAsia, and Temperate and Boreal Ecosystems, and the Oil Fires of Kuwait,edited by J. S. Levine, pp. 780–786, MIT Press, Cambridge, Mass.,1996.
Federal Office of Statistics, Draft report of general household survey, April1984–March 1985, report, 89 pp., Household Surveys Unit, Fed. Off. ofStat., Lagos, Nigeria, 1986.
Fenster, C. R., Effect of weed control on soil water conservation forrainfed agriculture in the Near East, in Soil, Water, and Crop/LivestockManagement Systems for Rainfed Agriculture in the Near East Region:Proceedings of the Workshop at Amman, Jordan, January 18–23, 1986,edited by C. E. Whitman et al., U.S. Dep. of Agric., Washington, D. C.,1989.
Fesharaki, F., Development of the Iranian Oil Industry: International andDomestic Aspects, 315 pp., Praeger, Westport, Conn., 1976.
Fesharaki, F., H. Brown, C. M. Siddayao, T. A. Siddiqi, K. R. Smith, and K.Woodward, Critical Energy Issues in Asia and the Pacific, 314 pp.,Westview, Boulder, Colo., 1982.
Foley, G., Charcoal making in developing countries, Tech. Rep. 5, Int. Inst.for Environ. and Dev., London, 1986.
Foley, G., and A. van Buren, Coal substitution and other approaches toeasing the pressure on woodfuel resources, Nat. Resour. Forum, 6, 127–149, 1982.
Food and Agriculture Organization, Production Yearbook 1983, Rome,1984.
Food and Agriculture Organization, Production Yearbook 1985, Rome,1986a.
Food and Agriculture Organization, 1985 Yearbook of Forest Products,FAO For. Ser., Rome, 1986b.
Food and Agriculture Organization, 1988 Yearbook of Forest Products,FAO For. Ser., Rome, 1990.
Food and Agriculture Organization, The State of Food and Agriculture1995, Rome, 1995.
Frolich, A., Lesotho, in Energy and Development in Southern Africa:SADCC Country Studies Part I, edited by P. O’Keefe and B. Munslow,Beijer Inst. and Scand. Inst. of African Stud., Uddevalla, Sweden, 1984.
Fundacao InstitutoBrasileiro deGeografia e Estatistica,CensoAgropecuario,Brasil, Rio de Janeiro, Brazil, 1984.
Gao, S., and D. Xu, Rural Energy and fuel forests in China, BiomassBioenergy, 1, 297–299, 1991.
Gupta, V. V. S. R., M. M. Roper, J. A. Kirkegaard, and J. F. Angus,Changes in microbial biomass and organic matter levels during the firstyear of modified tillage and stubble managment practices on a red earth,Aust. J. Soil Res., 32, 1339–1354, 1994.
Guzman, O., A. Yunez-Naude, and M. S. Wionczek, Energy Efficiency andConservation in Mexico, 354 pp., Westview, Boulder, Colo., 1987.
Hadar, Y., Z. Kerem, and B. Gorodecki, Biodegradation of lignocellulosicagricultural wastes by Pleurotus ostreatus, J. Biotechnol., 30, 133–139,1993.
Hadjichristodoulou, A., Breeding barley for forage and grain production indrylands, Tech. Bull. 158, Agric. Res. Inst., Minist. of Agric. and Nat.Resour., Nicosia, Cyprus, May 1994.
Hall, D. O., Biomass Energy, Energy Policy, 19, 711–737, 1991.Hall, D. O., and Y. S. Mao (Eds.), Biomass Energy and Coal in Africa, 196pp., African Energy Policy Res. Network, London, 1994.
Hall, D. O., F. Rosillo-Calle, R. H. Williams, and J. Woods, Biomass forenergy: Supply prospects, in Renewable Energy: Sources for Fuels andElectricity, edited by H. Kelly, A. K. N. Reddy, and R. H. Williams,chap. 14, pp. 593–651, Island, Washington, D. C., 1993.
Hall, D. O., F. Rosillo-Calle, and J. Woods, Biomass utilization in house-holds and industry: Energy use and development, Chemosphere, 29,1099–1119, 1994.
Hao, W. M., and M. H. Liu, Spatial and temporal distribution of tropicalbiomass burning, Global Biogeochem. Cycles, 8, 495–503, 1994.
Heber, G., and G. Zieroth, Rural Energy Supply Options in the AltiplanoArea of Peru, Spec. Energy Programme Doc. 2, 207 pp., Bundesminis-terium fur wirtschaftliche Zusammenarbeit, Eschborn, Germany, 1986.
Hemstock, S. L., and D. O. Hall, A biomass energy flow chart for Zim-babwe: An example of the methodology, Sol. Energy, 59, 49–57, 1997.
Hibajene, S. H., E. N. Chidumayo, and A. Ellegard, Summary of the Zam-bia Charcoal Industry Workshop, 59 pp., Stockholm Environ. Inst.,Stockholm, 1993.
Hosier, R., Energy Use in Rural Kenya: Household Demand and RuralTransformation, Energy, Environment, and Development in Africa, 7,177 pp., Beijer Inst. and Scand. Inst. of African Stud., Stockholm, 1985.
Hosier, R., J. Boberg, M. Luhanga, and M. Mwandosya, Energy planningand wood balances: Sustainable energy future for Tanzania, Nat. Resour.Forum, 14, 143–154, May 1990.
Houghton, R. A., The annual net flux of carbon to atmosphere fromchanges in land use 1850–1990, Tellus, Ser. B, 51, 298–313, 1999.
Hurst, D. F., D. W. T. Griffith, and G. D. Cook, Trace gas emissions frombiomass burning in Australia, in Biomass Burning and Global Change,vol. 2, Biomass Burning in South America, Southeast Asia, andTemperate and Boreal Ecosystems, and the Oil Fires of Kuwait, editedby J. S. Levine, pp. 787–792, MIT Press, Cambridge, Mass., 1996.
Husin, M., Z. Z. Zakaria, and A. H. Hassan, Potentials of oil palm by-products as raw materials for agro-based industries, in Proceedings of theNational Symposium on Oil Palm By-Products for Agro-based Industries,5–6 November 1985, Kuala Lumpur, Malaysia, pp. 7–15, Palm Oil Res.Inst. of Malaysia, Kuala Lumpur, 1987.
Hyman, E. L., Fuel substitution and efficient woodstoves: Are they theanswers to the fuelwood supply problem in northern Nigeria?, Environ.Manage., 18, 23–32, 1994.
Ileri, A., and T. Gurer, Energy and exergy utilization in Turkey during 1995,Energy, 23, 1099–1106, 1998.
India Directorate of Economics and Statistics, Indian Agricultural Atlas, 76pp., Dep. of Agric., Minist. of Agric., Govt. of India, New Delhi, 1971.
Intergovernmental Panel on Climate Change, Revised 1996 IPCC Guide-lines for national greenhouse gas inventories, Int. Energy Agency, Paris,1997.
Intergovernmental Panel on Climate Change, Revised 1996 IPCC Guide-lines for National Greenhouse Gas Inventories Reference Manual, vol. 3,Int. Energy Agency, Paris, 2002. (Available at http://www.ipcc-nggip.iges.or.jp/public/gl/invs1.htm)
International Energy Agency, Renewable Sources of Energy, 334 pp., Org.for Econ. Coop. and Dev., Washington, D. C., March 1987.
International Energy Agency, World energy statistics and balances (1971/1987), Org. for Econ. Coop. and Dev., Paris, 1989.
Ishiguro, M., and T. Akiyama, Energy Demand in Five Major Asian Devel-oping Countries: Structure and Prospects, 181 pp., World Bank,Washington, D. C., 1995.
Islam, M. N., Energy and rural development: Critical assessment of theBangladesh situation, in Rural Energy to Meet Development Needs:Asian Village Approaches, edited by M. N. Islam, R. Morse, and M. H.Soesastro, 561 pp., Westview, Boulder, Colo., 1984.
Islam, M. N., R. Morse, and M. H. Soesastro (Eds.), Rural Energy to MeetDevelopment Needs: Asian Village Approaches, 561 pp., Westview,Boulder, Colo., 1984.
Jaradat, A. A., An Assessment of Research Needs and Priorities for RainfedAgriculture, 415 pp., U.S. Agency for Int. Dev., Irbid, Jordan, 1988.
Jenkins, B., Physical properties of biomass, in Biomass Handbook,pp. 860–891, Gordon and Breach, Newark, N. J., 1989.
YEVICH AND LOGAN: BIOFUEL AND WASTE BURNING 6 - 35

Jenkins, B., and J. M. Ebeling, Correlation of physical and chemical proper-ties of terrestrial biomass with conversion, in Energy From Biomass andWastes IX Symposium Papers, Lake Buena Vista, Florida (January 28–February 1, 1985), pp. 371–403, Inst. of Gas Technol., Chicago, Ill.,1985.
Jenkins, B., and S. Q. Turn, Primary atmospheric pollutants from agri-cultural burning: Emission rate determinations from wind tunnel si-mulations, Pap. 946008, Am. Soc. of Agric. Eng., St. Joseph, Mich.,1994.
Jenkins, B., S. Q. Turn, and R. B. Williams, Survey documents openburning in the San Joaquin Valley, Calif. Agric., 45, 12–16, 1991.
Jenkins, B., S. Q. Turn, and R. B. Williams, Atmospheric emissions fromagricultural burning in California: Determination of burn fractions, dis-tribution factors, and crop-specific contributions, Agric. Ecosyst. Environ.,38, 313–330, 1992.
Joshi, V., C. Venkataraman, and D. R. Ahuja, Emissions from burningbiofuels in metal cookstoves, Environ. Manage., 13, 763–772, 1989.
Joshi, V., C. S. Sinha, M. Karuppasamy, K. K. Srivastava, and P. B. Singh,Rural energy database, final report, Tata Energy Res. Inst., New Delhi,September 1992.
Kaale, B. K., Tanzania Five Year National Village Afforestation Plan: 1982/83–1986–87, report, Min. of Nat. Resour. and Tourism, Dar-es-Salaam,Tanzania, 1983.
Kahane, A., and S. Lwakabamba, Energy in West Africa, in Energy inAfrica, edited by A. Kahane et al., Wiley Eastern Limited, New Delhi,1990.
Kalburtzi, K. L., D. S. Veresoglou, and P. A. Gerakis, Effects of burnt ofunburnt straw on wheat and fababeans as influenced by N fertilisation,Agric. Ecosyst. Environ., 31, 173–185, 1990.
Karekezi, S., and G. A. Mackenzie (Eds.), Energy Options for Africa:Environmentally Sustainable Alternatives, 184 pp., Zed, London, 1993.
Kersten, I., G. Baumbach, A. F. Oluwole, I. B. Obioh, and O. J. Ogunsola,Urban and rural fuelwood situation in the tropical rain-forest area ofsouthwest Nigeria, Energy, 23, 887–898, 1998.
Kgathi, D. L., and P. Zhou, Biofuel use assessments in Africa: Implicationsfor greenhouse gas emissions and mitigation strategies, Environ. Monit.Assess., 38, 253–269, 1995.
Khan, A. R., A. Qayyum, and G. A. Chaudhary, A country paper on soil,water, and crop management systems for dryland agriculture in Pakistan,in Soil, Water, and Crop/Livestock Management Systems for RainfedAgriculture in the Near East Region, Proceedings of the Workshop atAmman, Jordan, January 18–23, 1986, edited by C. E. Whitman et al.,pp. 88–94, U.S. Dep. of Agric., Washington, D. C., 1989.
Kilicasian, I., H. I. Sarac, E. Ozdemir, and K. Ermis, Sugar cane as analternative energy source for Turkey, Energy Convers. Manage., 40, 1–11, 1999.
Kituyi, E., L. Marufu, S. O. Wandiga, I. O. Jumba, M. O. Andreae, andG. Helas, Biofuel availability and domestic use patterns in Kenya,Biomass Bioenergy, 20, 71–82, 1999.
Kleeman, M., (Ed.), Energy Use and Air Pollution in Indonesia: SupplyStrategies, Environmental Impacts, and Pollution Control, Avebury Stud.in Green Res., 288 pp., Avebury, Brookfield, Vt., 1994.
Lamers, J., A. Buerkert, H. P. S. Makkar, M. Vonoppen, and K. Becker,Biomass production and feed and economic value of fodder weeds as by-products of millet cropping in a Sahelian farming system, Exper. Agric.,32, 317–326, 1996.
Lazarus, M., and S. Diallo, Integrated energy-environment planning: Initialresults from Senegal: Preliminary report, paper presented at Seminar onEnergy Management Policy and the Environment, U. N. Environ. Pro-gramme, Nairobi, July 1992.
Lazarus, M., S. Diallo, and Y. Sokona, Energy and environment scenariosfor Senegal, Nat. Resour. Forum, 18, 31–47, 1994.
Leach, G., Household Energy in South Asia, 111 pp., Elsevier, New York,1987.
Leach, G., Residential energy in the Third World, Ann. Rev. Energy, 13,47–65, 1988.
Leach, G., and M. Gowen, Household energy handbook: An interim guideand reference manual, Tech. Pap. 67, World Bank, Washington, D. C.,1987.
Lerner, J., E. Matthews, and I. Fung, Methane emission from animals: Aglobal high-resolution database, Global Biogeochem. Cycles, 2, 139–156, 1988.
Lew, E., and D. Kammen, Social and environmental impacts of charcoal,Report, Sci., Technol. and Environ. Policy (STEP) Program, WoodrowWilson School of Public and Int. Affairs, Princeton Univ., Princeton, N. J.,1994.
Logan, J. A., Tropospheric ozone: Seasonal behavior, trends and anthro-pogenic influence, J. Geophys. Res., 90, 10,463–10,482, 1985.
Logan, J. A., M. J. Prather, S. C. Wofsy, and M. B. McElroy, TroposphericChemistry: A global perspective, J. Geophys. Res., 86, 7210–7254,1981.
London Times, Times Atlas of the World, 8th comprehensive ed., TimesBooks, New York, 1990.
Luhanga, M. L., and B. Kjellstrom, Potential for use of biomass derivedfuels in Tanzania, report, Beijer Inst., Stockholm, 1988.
Marland, G., T. A. Boden, and R. J. Andres, Global, regional, and nationalCO2 emissions, in Trends: A Compendium of Data on Global Change,Carbon Dioxide Inf. Anal. Cent., Oak Ridge Natl. Lab., U.S. Dep. ofEnergy, Oak Ridge, Tenn., 2001.
Martin, T. L., E. A. Anderson, and R. Goates, Influence of the chemicalcomposition of organic matter on the development of mold flora in soil,Soil Sci., 54, 297–307, 1942.
Martinez, M., Renewable energy for rural development in Mexico, inEnergy for Rural Development: Proceedings of the United Nations Groupof Experts on the Role of New and Renewable Sources of Energy inIntegrated Rural Development, edited by M. R. Bhagavan andS. Karekezi, pp. 219–224, Zed, London, 1992.
Marufu, L., Photochemistry of the African troposphere—The influence ofbiomass burning, thesis, 145 pp., Faculteit Natuur- en Sterrenkunde,Univ. Utrecht, Utrecht, Netherlands, 1999.
Matthews, E., Global vegetation and land use: New high-resolution databases for climate studies, J. Clim. Appl. Meteorol., 22, 474–487, 1983.
Mburu, C., Cropping systems, production technology, and utilization ofsmall millets with special reference to finger millet in Kenya, in SmallMillets in Global Agriculture: Proceedings of the First InternationalSmall Millets Workshop, October 29–November 2, 1986, in Bangalore,India, edited by A. Seetharam, K. W. Riley, and G. Harinarayana, pp.305–308, IBH, New Delhi, 1989.
McIntire, J., D. Bourzat, and P. Pingali, Crop—Livestock Interaction inSub-Saharan Africa, 246 pp., World Bank, Washington, D. C., 1992.
Meelu, O. P., Y. Singh, and B. Singh, Green manure and crop residuemanagement in rice-wheat rotation, in Extended Summary, Proceed-ings International Symposium Rice Research: New Frontiers, edited byK. Muralidharan et al., pp. 355–356, Dir. of Rice Res., Hyderabad, India,1991.
Meyers, S., and G. Leach, Biomass fuels in the developing countries: Anoverview, LBL-27222, Lawrence Berkeley Lab., Berkeley, Calif., 1989.
Ministry of Forestry, Myanmar: Asia-Pacific Forestry Sector OutlookStudy: Country Report-Union of Myanmar, Working Pap. APFSPOS/WP/08, For. Policy and Plann. Div., Reg. Off. for Asia and the Pacific,Bankok, June 1997.
Minott, D., The potential of renewable energy in the Caribbean, in Energyfor Rural Development: Proceedings of the United Nations Group ofExperts on the Role of New and Renewable Sources of Energy in Inte-grated Rural Development, edited by M. R. Bhagavan and S. Karekezi,pp. 211–218, Zed, London, 1992.
Miracle, M. P., Agriculture in the Congo Basin, 355 pp., Univ. of Wisc.Press, Madison, Wisc., 1967.
Morgan, W. B., Rural energy production and supply—With special refer-ence to southwestern Nigeria, in Rural Energy Systems in the HumidTropics: Proceedings of the First Workshop of the United Nations Uni-versity Rural Energy Systems Project Ife, Nigeria, 10–12 August 1978,56 pp., edited by W. B. Morgan, R. P. Moss, and G. J. A. Ojo, pp. 10–13,U. N. Univ., Tokyo, 1980.
Mortimore, M., The lands of northern Nigeria: Some urgent issues, inPerspectives on Land Administration and Development in NorthernNigeria, edited by M. Mortimore, E. A. Olofin, R. A. Cline-Cole, andA. Abdulkadir, chap. 2, pp. 13–23, Dep. of Geogr., Bayero Univ., Kano,Nigeria, 1987.
Moss, R. P., and W. B. Morgan, Fuelwood and Rural Energy Productionand Supply in the Humid Tropics: Report for the United Nations Uni-versity, Tycooly Int., Dublin, 1981.
Mukhtar, Wood fuel as a source of energy in the Sudan, paper presented atFirst Energy Conference, Minist. of Energy and Min., Khartoum, 1978.
Muller, L. D., R. F. Barnes, L. F. Bauman, and V. F. Colenbrander, Varia-tions in lignin and other structural components of brown midrib mutantsof maize, Crop Sci., 11, 413–415, 1971.
Mungala, P. M., and K. Openshaw, Estimation of present and futuredemand for woodfuel in Machakos District, in Wood, Energy andHouseholds: Perspectives on Rural Kenya, vol. 6, edited by C. Barnes,J. Ensminger, and P. O’Keefe, Beijer Inst., Stockholm, 1984.
National Greenhouse Gas Inventory Committee, National Greenhouse GasInventory 1988 to 1994, vol. 7, Canberra, ACT, Canada, 1996.
Negi, G. C. S., High yielding vs. traditional crop varieties: A socio-agro-nomic study in a Himalayan village in India,Mt. Res. Dev., 14, 251–254,1994.
6 - 36 YEVICH AND LOGAN: BIOFUEL AND WASTE BURNING

Ng’andu, A. N., and A. M. Mwanza, The influence of comparative price inthe substitution of coal for woodfuel and charcoal: The Zambian Case, inAfrican Energy: Issues in Planning and Practice, pp. 106–110, Zed,London, 1990.
Nguyen, B. C., N. Mihalopoulos, and J. P. Putaud, Rice straw burning inSoutheast Asia as a source of CO and COS to the atmosphere, J. Geo-phys. Res., 99, 16,435–16,439, 1994.
Norman, D. W., M. D. Newman, and I. Ouedraogo, The semi-arid tropics ofwest Africa, in Farm and Village Production Systems in the Semi-AridTropics of West Africa: An Interpretive Review of Research, Res. Bull. 4,pp. 1–4, Int. Crops Res. Inst. for the Semi-Arid Tropics, Patancheru,Andhra Pradesh, India, October 1981.
Office of Technology Assessment, Energy in developing countries, OTA-E-486, U.S. Congress, Washington, D. C., 1991.
Ofori, C. S., Utilization of crop residues in semiarid regions for effectivesoil and water conservation, in Soil, Water, and Crop/Livestock Manage-ment Systems for Rainfed Agriculture in the Near East Region, Proceed-ings of the Workshop at Amman, Jordan, January 18–23, 1986, edited byC. E. Whitman et al., pp. 270–277, U.S. Dep. Of Agric., Washington,D. C., 1989.
Ogden, J. M., R. H. Williams, and M. E. Fulmer, Cogeneration applicationsof biomass gasifier/gas turbine technologies in the cane sugar and alcoholindustries, in Energy and the Environment in the 21st Century, edited byJ. W. Tester, D. O. Wood, and N. A. Ferrari, pp. 311–346, MIT Press,Cambridge, Mass., 1991.
O’Keefe, P., Energy in East Africa: Consumer and resources, in Energy inAfrica, edited by A. Kahane et al., pp. 26–53, Wiley Eastern Limited,New Delhi, 1990.
O’Keefe, P., and B. Munslow, Energy and development in southernAfrica: SADCC country studies, in Energy, Environment and Devel-opment in Africa 4, Beijer Inst. and Scand. Inst. of African Stud.,Stockholm, 1984.
O’Keefe, P., and P. Raskin, Fuelwood in Kenya: Crisis and opportunity,Ambio, 14, 220–227, 1985.
O’Keefe, P., P. Raskin, and S. Barrow (Eds.), Energy and Development inKenya: Opportunities and Constraints, 185 pp., Beijer Inst., Stockholm,1984.
Olivier, J. G. J., and J. J. M. Berdowski, Global emissions sources andsinks, in The Climate System, edited by J. Berdowski, R. Guicherit, andB. J. Heij, pp. 33–78, A. A. Balkema, Brookfield, Vt., 2001.
Olivier, J., A. F. Bowman, C. van der Maas, J. Berdowski, C. Veldt,J. Bloos, A. Visschedijk, P. Zandveld, and J. Haverlag, Description ofEDGAR Version 2.0: A set of global emission inventories of greenhousegases and ozone-depleting substances for all anthropogenic and mostnatural sources on a per country basis and on a 1� � 1� grid, RIVMRep. 771060, Natl. Inst. for Public Health and the Environ., Bilthoven,Netherlands, 1996.
Olivier, J., J. P. J. Bloos, J. J. M. Berdowski, A. J. H. Visschedijk, and A. F.Bouwman, A 1990 global emission inventory of anthropogenic sourcesof carbon monoxide on 1� � 1� developed in the framework of EDGAR/GEIA, Chemosphere, 1, 1–17, 1999.
Olivier, J., et al., CO2, CH4, and N2O emissions for 1990 and 1995: Sourcesand methods, in CO2 Emissions from Fuel Combustion 1971–1999, 2001ed., pp. III.9– III.29, Int. Energy Agency, Paris, 2001.
Omereji, G. O., Establishment and management of a modern oilpalm estate for maximum productivity, in International Palm OilConference: Progress, Prospects and Challenges Towards the 21stCentury, pp. 199–208, Palm Oil Res. Inst. of Malaysia, Kuala Lumpur,1993.
Openshaw, K. O., Wood fuels the developing world, New Sci., 61, 271–272, 1974.
Openshaw, K. O., Woodfuel: A time for reassessment, Nat. Resour. Forum,3, 35–51, 1978.
Openshaw, K. O., Woodfuel—A time for reassessment, in Energy in theDeveloping World: The Real Energy Crisis, edited by V. Smil and E.Knowland, pp. 35–51, Oxford Univ. Press, New York, 1980.
Openshaw, K. O., ‘Tanzania’ in Energy Development in Southern Africa,Country Rep. Energy Environ. Dev. Africa, vol. 4, edited by P. O’Keefeand B. Munslow, 87–132, Beijer Inst. and Scand. Inst. of African Stud.,Stockholm, 1984.
Openshaw, K. O., Concepts and methods for collecting and compilingstatistics on biomass used as energy, report, U. N. Stat. Off., New York,1986.
Openshaw, K. O., Urban biomass fuels: Production, transportation, andtrading study, consolidated report, Malawi Minist. of Energy and Mining,Alt. Energy Dev., Inc., Silver Spring, Md., 1997a.
Openshaw, K. O., Malawi: Biomass energy strategy study, Alt. EnergyDev., Inc., Silver Spring, Md., December 1997b.
Organizacion Latinoamericana de Energia, Energy Balances for LatinAmerica, edited by M. Banados, Artes Graficas Senal, Quito, Ecuador,November 1981.
Oyenuga, V. A., Nigeria’s Foods and Feeding-Stuffs: Their Chemistry andNutritive Value, 99 pp., Ibadan Univ. Press, Ibadan, Nigeria, 1968.
Pal, B. P., Wheat, 370 pp., Indian Counc. of Agric. Res., New Delhi, 1966.Pal, B. P., Modern rice research in India, paper presented at Tenth Anni-versary Celebration of the IRRI, Int. Rice Res. Inst., Los Banos, Philip-pines, 20–21, April 1972.
Papendick, R. I., and J. F. Parr, Considerations for research planning oncrop residue management to optimize crop/livestock production andresource conservation in Near East Drylands, paper presented at Work-shop on Crop Residue Management to Optimize Crop/Livestock Produc-tion and Resource Conservation in the Near East Region, WorkshopComm., Amman, Jordan, 31 January to 2 February 1988.
Pearson, C. J., D. W. Norman, and J. R. Dixon, Sustainable dryland crop-ping in relation to soil productivity, Soils Bull. 72, Food and Agric. Org.of the U. N., Rome, 1995.
Pennise, D. M., K. R. Smith, J. P. Kithinji, M. E. Rezende, T. J. Raad,J. Zhang, and C. Fan, Emissions of greenhouse gases and other airbornepollutants from charcoal making in Kenya and Brazil, in J. Geophys.Res., 106, 24,143–24,155, 2001.
Pingali, P., Y. Bigot, and H. P. Binswanger, Agricultural Mechanization andthe Evolution of Farming Systems in Sub-Saharan Africa, 216 pp., JohnsHopkins Univ. Press, Baltimore, Md., 1987.
Pokharel, S., and M. Chandrashekar, Biomass resources as energy in Nepal,Nat. Resour. Forum, 18, 225–230, 1994.
Polycarpou, A., and M. H. El-Lakany, Forestry policies in the Near Eastregion: Analysis and synthesis, FAO For. Pap. 111, Food and Agric. Org.of the U.N., Rome, 1993.
Ponnamperuma, F. N., Straw as a source of nutrients for wetland rice, inOrganic Matter and Rice, pp. 117–135, Int. Rice Res. Inst., Los Banos,Laguna, Philippines, 1984.
Population Association of Nigeria, Population Information, Education andCommunication: Proceedings No. 8 of the 1990 Conference Held at theNigerian Defence Academy, 303 pp., Ibadan, Nigeria, 1991.
Poulain, J. F., Crop residues in traditional cropping systems of west Africa:Effects on the mineral balance and level of organic matter in soils—Proposals for their better management, Soils Bull. 43, Food and Agric.Org., Rome, 1980.
Powell, J. M., Yields of sorghum and millet and stover consumption bylivestock in the Subhumid Zone of Nigeria, Trop. Agric., 62, 77–81,1985.
Pushparajah, E., and C. P. Soon, (Eds.), Cocoa and Coconuts: Progressand Outlook, Proceedings of the International Conference on Cocoa andCoconuts, Progress and Outlook, 15–17 October, 1984, Kuala Lumpur,Malaysia, Inc. Soc. of Planters and the Malaysian Cocoa Growers Assoc.,Kuala Lumpur, 1986.
Qui, D. X., The role of renewable energy in rural development in China:Achievements and prospects, in Energy for Rural Development: Pro-ceedings of the United Nations Group of Experts on the Role of Newand Renewable Sources of Energy in Integrated Rural Development,edited by M. R. Bhagavan and S. Karekezi, pp. 155–174, Zed, London,1992.
Ramankutty, N., and J. Foley, Characterizing patterns of global land use:An analysis of global croplands data, Global Biogeochem. Cycles, 12,667–685, 1998.
Rao, P. P., Marketing of fodder in rural and urban areas of India, in Agri-cultural Markets in the Semi-Arid Tropics: Proceedings of the Interna-tional Workshop at ICRISAT Center, India, 24–28 October 1983, Int.Crops Res. Inst. for the Semi-Arid Trop., Patancheru, Andhra Pradesh,India, 1985.
Raskin, P., and M. Lazarus, Regional energy development in southernAfrica: Great potential, great constraints, Ann. Rev. Energy Environ.,16, 145–178, 1991.
Reddy, A. V., Agriculture Marketing, 258 pp., Printwell, Jaipur, India,1991.
Reddy, K. V. S., Pest management in Sorghum: II, in Sorghum in theEighties, Proceedings of the International Symposium on Sorghum, 2–7 November 1981, pp. 237–246, Int. Crops Res. Inst. for the Semi-AridTrop., Patancheru, Andhra Pradesh, India, 1981.
Reed, J. D., Sorghum and millets as forage crops in the semi-arid tropics, inUtilization of Sorghum and Millets, edited by M. I. Gomez et al., 216 pp.,Int. Crops Res. Inst. for the Semi-Arid Trop., Patancheru, AndhraPradesh, India, 1992.
Roberts, R. L., Rice hull utilization, paper presented at 58th AnnualMeeting, Am. Assoc. of Cereal Chem., St. Paul, Minn., 4–8 November,1973.
YEVICH AND LOGAN: BIOFUEL AND WASTE BURNING 6 - 37

Salam, B. A., The contribution of the oil palm by-products towards thenational energy policy—An economist point of view, in Proceedingsof the National Symposium on Oil Palm By-Products for Agro-basedIndustries, pp. 133–145, Palm Oil Res. Inst. of Malaysia, KualaLumpur, 1987.
Salour, D., B. M. Jenkins, M. Vafaei, and M. Kayhanian, Combustion ofrice straw and straw/wood fuel blends in a fluidized bed reactor, Pap. 89-6574, Am. Soc. of Agric. Eng., St. Joseph, Mich., 1989.
Sampath, S. R., Scope for using small millets as forage in India, in SmallMillets in Global Agriculture: Proceedings of the First InternationalSmall Millets Workshop, October 29–November 2, 1986, in Bangalore,India, edited by A. Seetharam, K. W. Riley, and G. Harinarayana,pp. 341–345, IBH, New Delhi, 1989.
Sandford, S. G., Crop residue/livestock relationship, in Soil, Crop, andWater Management Systems for Rainfed Agriculture in the Sudano-Sahe-lian Zone, Proceedings of an International Workshop, 11–16 January1987, Int. Crops Res. Inst. for the Semi-Arid Tropics, Patancheru, AndhraPradesh, India, 1989.
Satchell, J. E., Introduction: Litter—Interface of Animate/Inanimate Matter,in Biology of Plant Litter Decomposition, vol. I, edited by C. H.Dickinson and G. J. F. Pugh, pp. xiii –xl, Academic, San Diego,Calif., 1974.
Scholes, R. J., and M. R. van der Merwe, South African greenhouse gasinventory, Rep. DEA-918, Dep. of Environ. Affairs and Tourism, Pretoria,1995.
Scobey, R., Malawi, in Energy and Development in Southern Africa:SADCC Country Studies Part I, edited by P. O’Keefe and B. Munslow,pp. 171–186, Beijer Insti., Stockholm, 1984.
Scurlock, J. M. O., and D. O. Hall, The contribution of biomass to globalenergy use (1987), Biomass, 21, 75–81, 1990.
Secretaria de Energia, Minas e Industria Paraestatal, Energia Rural enMexico, Comision de Comunidades Europeas, Mexico City, November1988.
Seiler, W., and P. Crutzen, Estimates of the gross and net flux of carbonbetween the biosphere and the atmosphere from biomass burning, Clim.Change, 2, 207–247, 1980.
Senelwa, K. A., and D. O. Hall, A biomass energy flow chart for Kenya,Biomass Bioenergy, 4, 35–48, 1993.
Shamsuddin, A. H., and M. T. M. Nor, Potential of fluidised bed technologyfor combustion of oil palm solid by-products, in Proceedings of theNational Symposium on Oil Palm By-Products for Agro-based Industries,pp. 146–154, Palm Oil Res. Inst. of Malaysia, Kuala Lumpur, 1987.
Silva, M. A., S. A. Nebra, M. J. M. Silva, and C. G. Sanchez, The use ofbiomass residues in the Brazilian soluble coffee industry, Biomass Bioe-nergy, 14, 457–467, 1998.
Sivakumar, M. V. K., and F. Gnoumou, Agroclimatology of West Africa:Burkina Faso, Inf. Bull. 23, 192 pp., Int. Crops Res. Inst. for the Semi-Arid Trop., Patancheru, Andhra Pradesh, India, 1987.
Sivakumar, M. V. K., A. K. S. Huda, and S. M. Virmani, Physical environ-ment of sorghum and millet-growing areas in south Asia, in Agrometeor-ology of Sorghum and Millet in the Semi-Arid Tropics: Proceedings of theInternational Symposium, edited by S. M. Virmani and M. V. K.Sivakumar, Int. Crops Res. Inst. for the Semi-Arid Trop., Patancheru,Andhra Pradesh, India, 1984.
Smil, V., Energy flows in the developing world, Am. Sci., 67, 522–531,1979.
Smil, V., China’s Environmental Crisis: An Inquiry into the Limits ofNational Development, 257 pp., M. E. Sharpe, London, 1993.
Smith, K. R., Biofuels, Air Pollution, and Health: A Global Review, 452pp., Plenum, New York, 1987.
Smith, K. R., M. A. K. Khalil, R. A. Rasmussen, S. A. Thornloe,F. Manegdeg, and M. Apte, Greenhouse gases from biomass and fossilfuel stoves in developed countries: A Manila pilot study, Chemosphere,26, 479–501, 1993.
Smith, K. R., D. M. Pennise, P. Khummongkol, V. Chaiwong, K. Ritgeen,J. Zhang, W. Panyathanya, R. A. Rasmussen, and M. A. K. Khalil,Greenhouse gases from Small-scale combustion in developing countries:Charcoal-making kilns in Thailand, report, U.S. Environ. Prot. Agency,Research Triangle Park, N. C., 1999.
Smith, K. R., R. Uma, V. V. Kishore, J. Zhang, V. Joshi, and M. A. K.Khalil, Greenhouse implications of household stoves: An analysis forIndia, Annu. Rev. Energy Environ., 25, 741–763, 2000.
Soesastro, M. H., Policy analysis of rural household energy needs in WestJava, in Rural Energy to Meet Development Needs: Asian VillageApproaches, edited by M. N. Islam, R. Morse, and M. H. Soesastro,pp. 92–105, Westview, Boulder, Colo., 1984.
State Statistical Bureau of the People’s Republic of China, China StatisticalYearbook, Int. Cent. for the Advance. of Sci. and Technol., Beijing, 1992.
Statistics Canada, Canadian Forestry Statistics 1989, Industry Div.,Ottawa, 1992.
Streets, D. G., and S. T. Waldhoff, Biofuel use in Asia and acidifyingemissions, Energy, 23, 1029–1042, 1998.
Streets, D. G., K. Jiang, X. Hu, J. E. Sinton, X. Zhang, D. Xu, M. Z.Jacobson, and J. E. Hansen, Recent reductions in China’s greenhousegas emissions, Science, 294, 1835–1837, 2001.
Suoping, L., Z. Cungen, G. Tingshuang, and S. Waldron, The ‘‘Straw forRuminants’’ Project in China, Agric. and Nat. Resour. Econ. Discuss.Pap. 4/99, School of Nat. and Rural Syst. Manage., St. Lucia, Australia,September 1999.
Susott, R. A., G. J. Olbu, S. P. Baker, D. E. Ward, J. B. Kauffman, and R. W.Shea, Carbon, hydrogen, nitrogen, and thermogravimetric analysis oftropical ecosystem biomass, in Global Biomass Burning: Atmospheric,Climatic and Biospheric Implications, edited by J. S. Levine, pp. 250–259, MIT Press, Cambridge, Mass., 1991.
Swift, M. J., O. W. Heal, and J. M. Anderson, Decomposition in TerrestrialEcosystems, 372 pp., Univ. of Calif. Press, Berkeley, Calif., 1979.
Tanaka, A., Methods of handling of cereal crop residues in Asian countriesand related problems, Food and Fertil. Technol. Cent. Ext. Bull. 43,Asian Pacific Manage. Resour., Taipei City, Taiwan, 1974.
Te, A., S. G. Zhu, S. L. Travers, H. F. Lai, and R. W. Herdt, The economicsof hybrid rice production in China, report, Agric. Econ. Dept., Int. RiceRes. Inst., Los Banos, Laguna, Philippines, 1985.
Thampan, P. K., Handbook on Coconut Palm, 311 pp., Oxford and IBH,New Delhi, 1987.
Tingshuang, G., and Y. Zhenhai, New developments in livestock systemsbased on crop residues in China, paper presented at Second FAO Elec-tronic Conference on Tropical Feeds (Livestock Feed Resources withinIntegrated Systems), Food and Agric. Org.,Rome, 2 December 1996.
Tothill, J. D., (Ed.), Agriculture in the Sudan, Being a Handbook ofAgriculture as Practised in the Anglo-Egyptian Sudan, 972 pp., OxfordUniv. Press, New York, 1954.
Tuan, N. A., Energy and environmental issues in Vietnam, Natural Resour.Forum, 21, 201–207, 1997.
Tuan, N. A., and T. Lefevre, Analysis of household energy demand inVietnam, Energy Policy, 24, 1089–1099, 1996.
Tully, D., Rainfed farming systems of the Near East region, in Soil, Water,and Crop/Livestock Management Systems for Rainfed Agriculture in theNear East Region: Proceedings of the Workshop at Amman, Jordan,January 18–23, 1986, edited by C. E. Whitman et al., pp. 20–34,U.S. Dep. Of Agric., Washington, D. C., 1989.
Umunna, N. N., and J. P. Alawa, Feed uses of sorghum grain and stover, inIndustrial Utilization of Sorghum, Summary Proceedings of a Symposiumon the Current Status and Potential of Industrial Uses of Sorghum inNigeria 4–6 December 1989, Kano, Nigeria, pp. 43–44, Int. Crops Res.Inst. for the Semi-Arid Trop., Zaria, Nigeria, 1990.
United Nations, Demographic Yearbook (1991), Dep. of Econ. and Soc.Dev., Stat. Div., New York, 1992.
United Nations, Demographic Yearbook (1997), Dep. of Int. Econ. and Soc.Affairs, Stat. Off., New York, 1999.
United Nations Environment Programme, Residue utilization manage-ment of agricultural and agro-industrial residues, paper presented atIndustry Section Seminars, Food and Agric. Org., Rome, 18 –21January 1977.
van Buren, A., The Woodfuel Market in Nicaragua, 257 pp., Cent. de Estud.y Doc. Latinoamericanos, Amsterdam, 1990.
van Raay, H. G. T., Rural Planning in a Savanna Region, Rotterdam Univ.Press, Rotterdam, Netherlands, 1975.
van Raay, H. G. T., and P. N. de Leeuw, The importance of crop residues asfodder: A resource analysis in Katsina Province, Nigeria, Samaru Res.Bull. 139, Inst. of Agric. Res., Zaria, Nigeria, 1971.
von Oppen, M., and P. P. Rao, Sorghum marketing in India, in Sorghum inthe Eighties: Proceedings of the International Symposium on Sorghum,vol. 2, pp. 659–674, Int. Crops Res. Inst. for the Semi-Arid Trop.,Patancheru, Andhra Pradesh, India, 1982.
Waddle, D. B., Rice hull energy uses in the Philippines, Pap. 85-5507, Am.Soc. of Agric. Eng., St. Joseph, Mich., 1985.
Ward, D. E., and L. F. Radke, Emissions measurements from vegetationfires: A comparative evaluation of methods and results, in Fire in theEnvironment: The Ecological, Atmospheric and Climatic Importance ofVegetation Fires, edited by P. J. Crutzen and J. G. Goldammer, pp. 53–76, John Wiley, New York, 1993.
Ward, D. E., W. M. Hao, R. A. Susott, and R. E. Babbitt, Effect of fuelcomposition on combustion efficiency and emission factors for Africansavanna ecosystems, J. Geophys. Res., 101, 23,569–23,576, 1996.
Watts, M., Drought, environment and food security: Some reflections onpeasants, pastoralists and commoditization in dryland West Africa, in
6 - 38 YEVICH AND LOGAN: BIOFUEL AND WASTE BURNING

Drought and Hunger in Africa: Denying Famine a Future, edited by M.H. Glantz, pp. 171–211, Cambridge Univ. Press, New York, 1987.
Wen, W., and C. En-Jian, Our views on the resolution of China’s ruralenergy requirements, Biomass, 3, 287–312, 1983.
Whitman, C. E., J. F. Parr, R. I. Papendick, and R. E. Meyer (Eds.),Preface, in Soil, Water, and Crop/Livestock Management Systems forRainfed Agriculture in the Near East Region: Proceedings of the Work-shop at Amman, Jordan, January 18–23, 1986, edited by C. E. Whitmanet al., p. 5, U.S. Dep. Of Agric., Washington D. C., 1989.
Williams, R. H., and E. D. Larson, Advanced gasification-based biomasspower generation, in Renewable Energy: Sources for Fuels and Electri-city, edited by T. B. Johansson et al., Island, Washington, D. C., 1993.
Wint, W., and D. Bourn, Livestock and land-use surveys in sub-SaharanAfrica, Oxfam Res. Pap. 11, Environ. Res. Group Oxford, Oxfam,Oxford, UK, 1994.
Winterhalder, B., R. Larsen, and R. B. Thomas, Dung as an essentialresource in a highland Peruvian community, Human Ecol., 2, 89–104,1974.
Wisner, B., Botswana, in Energy and Development in Southern Africa:SADCC Country Studies Part I, edited by P. O’Keefe and B. Munslow,Beijer Inst., Uppsala, Sweden, 1984.
Wood, T. S., and S. Baldwin, Fuelwood and charcoal use in LDC’s, Annu.Rev. Energy, 10, 407–429, 1985.
Woods, J., and D. O. Hall, Bioenergy for development: Technical andenvironmental dimensions, Environ. and Energy Pap. 13, Food andAgric. Org., Rome, 1994.
World Bank, Indonesia: Issues and options in the energy sector, 3543-IND,Washington, D. C., November 1981.
World Bank, Kenya: Issues and options in the energy sector, 3800-KE,Washington, D. C., May 1982a.
World Bank, Sri Lanka: Issues and options in the energy sector, 3794-CE,Washington, D. C., May 1982b.
World Bank, Burundi: Issues and options in the energy sector, 3778-BU,Washington, D. C., June 1982c.
World Bank, Papua New Guinea: Issues and options in the energy sector,3882-PNG, Washington, D. C., June 1982d.
World Bank, Rwanda: Issues and options in the energy sector, 3779-RW,Washington, D. C., June 1982e.
World Bank, Zimbabwe: Issues and options in the energy sector, 3765-ZIM,Washington, D. C., June 1982f.
World Bank, Malawi: Issues and options in the energy sector, 3903-MAL,Washington, D. C., August 1982g.
World Bank, Bangladesh: Issues and options in the energy sector, 3873-BD,Washington, D. C., October 1982h.
World Bank, Zambia: Issues and options in the energy sector, 4110-ZA,Washington, D. C., January 1983a.
World Bank, Turkey: Issues and options in the energy sector, 3877-TU,Washington, D. C., March 1983b.
World Bank, Bolivia: Issues and options in the energy sector, 4213-BO,Washington, D. C., April 1983c.
World Bank, Nigeria: Issues and options in the energy sector, 4440-UNI,Washington, D. C., April 1983d.
World Bank, Fiji: Issues and options in the energy sector, 4462-FIJ,Washington, D. C., June 1983e.
World Bank, Solomon Islands: Issues and options in the energy sector,4404-SOL, Washington, D. C., June 1983f.
World Bank, Senegal: Issues and options in the energy sector, 4182-SE,Washington, D. C., July 1983g.
World Bank, Sudan: Issues and options in the energy sector, 4511-SU,Washington, D. C., July 1983h.
World Bank, Uganda: Issues and options in the energy sector, 4453-UG,Washington, D. C., July 1983i.
World Bank, Nepal: Issues and options in the energy sector, 4474-NEP,Washington, D. C., August 1983j.
World Bank, The Gambia: Issues and options in the energy sector, 4743-GM, Washington, D. C., November 1983k.
World Bank, Costa Rica: Issues and options in the energy sector, 4655-CR,Washington, D. C., January 1984a.
World Bank, Lesotho: Issues and options in the energy sector, 4676-LSO,Washington, D. C., January 1984b.
World Bank, Peru: Issues and options in the energy sector, 4677-PE,Washington, D. C., January 1984c.
World Bank, Seychelles: Issues and options in the energy sector, 4693-SEY,Washington, D. C., January 1984d.
World Bank, Morocco: Issues and options in the energy sector, 4157-MOR,Washington, D. C., March 1984e.
World Bank, Niger: Issues and options in the energy sector, 4642-NIR,Washington, D. C., May 1984f.
World Bank, Ethiopia: Issues and options in the energy sector, 4741-ET,Washington, D. C., July 1984g.
World Bank, Cape Verde: Issues and options in the energy sector, 5073-CV,Washington, D. C., August 1984h.
World Bank, Guinea-Bissau: Issues and options in the energy sector, 5083-GUB, Washington, D. C., August 1984i.
World Bank, Botswana: Issues and options in the energy sector, 4998-BT,Washington, D. C., September 1984j.
World Bank, Paraguay: Issues and options in the energy sector, 5145-PA,Washington, D. C., October 1984k.
World Bank, St. Lucia: Issues and options in the energy sector, 5111-SLU,Washington, D. C., September 1984l.
World Bank, St. Vincent and the Grenadines: Issues and options in theenergy sector, 5103-STV, Washington, D. C., September 1984m.
World Bank, Tanzania: Issues and options in the energy sector, 4969-TA,Washington, D. C., November 1984n.
World Bank, Liberia: Issues and options in the energy sector, 5279-LBR,Washington, D. C., December 1984o.
World Bank, Yemen Arab Republic: Issues and options in the energy sector,4892-YAR, Washington, D. C., December 1984p.
World Bank, Ivory Coast: Issues and options in the energy sector, 5250-IVC, Washington, D. C., April 1985a.
World Bank, Jamaica: Issues and options in the energy sector, 5466-JM,Washington, D. C., April 1985b.
World Bank, Islamic Republic of Mauritania: Issues and options in theenergy sector, 5224-MAU, Washington, D. C., April 1985c.
World Bank, Benin: Issues and options in the energy sector, 5222-BEN,Washington, D. C., June 1985d.
World Bank, Sao Tome: Issues and options in the energy sector, 5803-STP,Washington, D. C., October 1985e.
World Bank, Burma: Issues and options in the energy sector, 5416-BA,Washington, D. C., June 1985f.
World Bank, Togo: Issues and options in the energy sector, 5221-TO,Washington, D. C., June 1985g.
World Bank, Vanuatu: Issues and options in the energy sector, 5577-VA,Washington, D. C., June 1985h.
World Bank, Western Samoa: Issues and options in the energy sector, 5497-WSO, Washington, D. C., June 1985i.
World Bank, Thailand: Issues and options in the energy sector, 5793-TH,Washington, D. C., September 1985j.
World Bank, Trinidad and Tobago: Issues and options in the energy sector,5930-TR, Washington, D. C., November 1985k.
World Bank, Somalia: Issues and options in the energy sector, 5796-SO,Washington, D. C., December 1985l.
World Bank, Burkina: Issues and options in the energy sector, 5730-BUR,Washington, D. C., January 1986a.
World Bank, Zaire: Issues and options in the energy sector, 5837-ZR,Washington, D. C., May 1986b.
World Bank, Ghana: Issues and options in the energy sector, 6234-GH,Washington, D. C., November 1986c.
World Bank, Guinea: Issues and options in the energy sector, 6137-GUI,Washington, D. C., November 1986d.
World Bank, Colombia: Basis for formulation of a Colombian energy pol-icy, report, Washington, D. C., December 1986e.
World Bank, Ethiopia: Bagasse Energy Survey, 063/86, Washington, D. C.,December 1986f.
World Bank, Madagascar: Issues and options in the energy sector, 5700-MAG, Washington, D. C., January 1987a.
World Bank, Mozambique: Issues and options in the energy sector, 6128-MOZ, Washington, D. C., January 1987b.
World Bank, Swaziland: Issues and options in the energy sector, 6262-SW,Washington, D. C., February 1987c.
World Bank, Honduras: Issues and options in the energy sector, 6476-HO,Washington, D. C., August 1987d.
World Bank, Sierra Leone: Issues and options in the energy sector, 6597-SL, Washington, D. C., October 1987e.
World Bank, Comoros: Issues and options in the energy sector, 7104-COM,Washington, D. C., January 1988a.
World Bank, Congo: Issues and options in the energy sector, 6420-COB,Washington, D. C., January 1988b.
World Bank, Gabon: Issues and options in the energy sector, 6915-GA,Washington, D. C., July 1988c.
World Bank, Angola: Issues and options in the energy sector, 7408-ANG,Washington, D. C., May 1989.
World Bank, Peru: Guidelines for a short- and medium-term strategy for theenergy sector, report, Washington, D. C., December 1990.
World Bank, Dominican Republic: Issues and options in the energy sector,8234-DO, Washington, D. C., May 1991a.
YEVICH AND LOGAN: BIOFUEL AND WASTE BURNING 6 - 39

World Bank, India: Maharashtra bagasse energy efficiency project, 120/91,Washington, D. C., May 1991b.
World Bank, Mali: Issues and options in the energy sector, 8423,Washington, D. C., November 1991c.
World Bank, Haiti: Household energy strategy, 143/91, Washington, D. C.,December 1991d.
World Bank, Tunisia: Energy management strategy in the residential andtertiary sectors, 146/92, Washington, D. C., April 1992a.
World Bank, Republic of Mali: Household energy strategy, 147-92,Washington, D. C., May 1992b.
World Bank, Solomon Islands: Energy assessment, 979/SOL, Washington,D. C., January 1992c.
World Bank, Namibia: Issues and options in the energy sector, 11320,Washington, D. C., March 1993a.
World Bank, Nigeria: Issues and options in the energy sector, 11672,Washington, D. C., July 1993b.
World Bank, Guatemala: Issues and options in the energy sector, 12160,Washington, D. C., September 1993c.
World Bank, Bolivia: Household rural energy strategy, 62/94, Washington,D. C., January 1994a.
World Bank, Vietnam: Rural and household energy issues and options, 161/94, Washington, D. C., January 1994b.
World Bank, Ecuador: Energy Pricing, Poverty, and Social Mitigation,12831, Washington, D. C., August 1994c.
World Wildlife Fund, Central Africa: Global climate change and develop-ment, technical report, Biodiversity Support Program/Africa, Washing-ton, D. C., 1993.
Yager, J. A., The Energy Balance in Northeast Asia, 249 pp., BrookingsInst., Washington, D. C., 1984.
Yokelson, R. J., I. T. Bertschi, T. J. Christian, P. V. Hobbs, D. E. Ward, andW. M. Hao, Trace gas measurements in nascent, aged, and cloud-pro-
cessed smoke from African Savanna Fires by airborne Fourier transforminfrared spectroscopy (AFTIR), J. Geophys. Res., 108(D13), 8478,doi:10.1029/2002JD002322, 2003.
Yoshida, T., A review report on the situation of agricultural, agro-industrialand municipal wastes in some Asian countries, in Organic Recycling inAsia, Workshop on the use of Organic Materials as Fertilizers in Asia 26October–5 November 1976 in Bangkok, Thailand, Soils Bull. 36, Foodand Agric. Org., Rome, 1978.
Young, W., Seed production, Crop Soil News Notes, 12, July 1998.(Available at http://www.css.orst.edu/seed-ext)
Zhang, J., K. R. Smith, R. Uma, Y. Ma, V. V. N. Kishore, K. Lata, M. A. K.Khalil, R. A. Rasmussen, and S. T. Thornloe, Carbon monoxide fromcookstoves in developing countries: 1. Emissions factors, Chemosphere,1, 353–366, 1999.
Zhang, J., K. R. Smith, Y. Ma, S. Ye, F. Jiang, W. Qi, P. Liu, M. A. K.Khalil, R. A. Rasmussen, and S. T. Thornloe, Greenhouse gases and otherairborne pollutants from household stoves in China: A database for emis-sion factors, Atmos. Environ., 34, 4537–4549, 2000.
Zhuang, Y. H., M. Cao, X. Wang, and H. Yao, Spatial distribution of trace-gas emissions from burning crop residue in China, in Biomass Burningand Global Change, vol. 2, edited by J. S. Levine, pp. 764–770, MITPress, Cambridge, Massachusetts, 1996.
�������������������������J. A. Logan and R. Yevich, Department of Earth and Planetary Sciences,
Harvard University, Cambridge, MA 02138, USA. ( [email protected];[email protected])
6 - 40 YEVICH AND LOGAN: BIOFUEL AND WASTE BURNING

Figure 3. Woodfuel use in the developing world distributed on a grid of 1� latitude by 1� longitude inunits of Tg dry matter. Woodfuel includes fuelwood and charcoal.
6 - 19 and 6 - 20
Figure 4. Crop residue and dung use as biofuels in the developing world distributed on a grid of 1�latitude by 1� longitude in units of Tg dry matter.
YEVICH AND LOGAN: BIOFUEL AND WASTE BURNING

Figure 5. Burning of agricultural residue in the fields in the developing world distributed on a grid of 1�latitude by 1� longitude with units Tg dry matter.
6 - 21
YEVICH AND LOGAN: BIOFUEL AND WASTE BURNING