Embed Size (px)
Citation preview

S t a t e o f W i s c o n s i n
Letter Report
Use Value Assessment of Agricultural LandJuly 2010
Legis lat ive Audit Bureau22 E. Mifflin St., Ste. 500, Madison, Wisconsin 53703-4225 (608) 266-2818
Fax: (608) 267-0410 Web site: www.legis.wisconsin.gov/lab


July 8, 2010 Senator Kathleen Vinehout and Representative Peter Barca, Co-chairpersons Joint Legislative Audit Committee State Capitol Madison, Wisconsin 53702 Dear Senator Vinehout and Representative Barca: At your request, we have completed a limited-scope review of the use value assessment of agricultural land. Wisconsin’s use value law, which was enacted as part of the 1995-97 Biennial Budget Act, is intended both to provide property tax relief for farmers and to reduce urban sprawl. Under use value assessment, property taxes are assessed on land that is used primarily for agricultural purposes based on the land’s agricultural productivity, rather than its full market value. In 2008, approximately 35.0 percent of all acreage in Wisconsin was assessed as agricultural land. In conducting this analysis, we reviewed agricultural land classification and assessments in 14 municipalities statewide. All agricultural land we reviewed met the criteria for agricultural use established in Wisconsin Administrative Code. However, more than 6,300 agricultural acres in the 14 municipalities were zoned for non-agricultural purposes, and more than 3,800 agricultural acres were owned by real estate or property development businesses, which may indicate a greater likelihood for the land to eventually be sold or developed. We worked with assessors in each of the 14 municipalities to estimate the effect of use value assessment on property taxes within their municipalities. If those communities had assessed agricultural land that is zoned for another purpose at market value in 2009, the owners of the land would have owed a total of $4.7 million in additional property taxes, and the tax liability of other property owners in those municipalities would have been reduced by the same amount. On an individual basis, taxes on agricultural land that is zoned for another purpose would have increased by an average of $3,516, while taxes on all other parcels would have decreased, on average, by $38. Recently, the Legislature enacted the Working Lands Initiative to promote local farmland planning and provide income tax credits to eligible landowners. Should the Legislature wish to modify farmland preservation strategies through changes to use value assessment, we have identified programs in other states that may serve as models. We appreciate the courtesy and cooperation extended to us by local assessors in our sample of 14 municipalities and by staff from the departments of Revenue; Agriculture, Trade and Consumer Protection; and Financial Institutions. Sincerely, Janice Mueller State Auditor JM/KW/ss


USE VALUE ASSESSMENT OF AGRICULTURAL LAND
Under Wisconsin’s use value law, property taxes on agricultural land are assessed based on the land’s ability to produce farm income. Before the use value law was enacted as part of 1995 Wisconsin Act 27, the 1995-97 Biennial Budget Act, agricultural land was assessed according to its full market value, which is the estimated sales price. Taxes on most other real and personal property continue to be assessed at full market value. By reducing assessments on agricultural land, the use value law was intended both to improve Wisconsin’s farm economy by providing property tax relief for farmers and to reduce urban sprawl. Section 70.32, Wis. Stats., specifies that to qualify for use value assessment, land must be devoted primarily to agricultural use. All property that meets this definition qualifies, regardless of the owner’s occupation or the purpose for which the land is zoned. For example, a landowner who does not farm may lease qualifying land to a farmer for agricultural use. Recent media reports have alleged that loopholes in the use value assessment law allow non-farmers to benefit inappropriately from owning land that continues to qualify for use value assessment because of temporary cropping, although it has been zoned for residential, commercial, or industrial purposes. It has been argued that in such cases the use value law is not achieving its intended purpose of preserving farmland, even though farming may continue before the land is developed. It has also been argued that the use value assessment of such land inappropriately shifts the property tax burden from real estate developers to other taxpayers. At the request of the co-chairs of the Joint Legislative Audit Committee, we conducted a limited-scope review that focused on agricultural land in 14 municipalities chosen for geographic diversity and variation in population density and development. For each municipality chosen, we reviewed:
the characteristics of its agricultural land, including changes in the number of acres classified and assessed as agricultural, as well as the property taxes assessed on, and ownership of, agricultural land;
the extent to which the agricultural land was zoned for non-agricultural purposes; and
the amount by which property taxes on agricultural land zoned for non-agricultural purposes would likely differ if the land were assessed at its market value.
In addition, we interviewed local assessors in our sample municipalities; officials in the Department of Revenue (DOR) and the Department of Agriculture, Trade and Consumer Protection; and representatives of municipal associations and trade groups. We also analyzed statewide data on agricultural acreage, including sales data maintained by the Wisconsin Agricultural Statistics Service, which is part of the United States Department of Agriculture, as well as data maintained by the Department of Financial Institutions related to ownership of agricultural land.
-2-
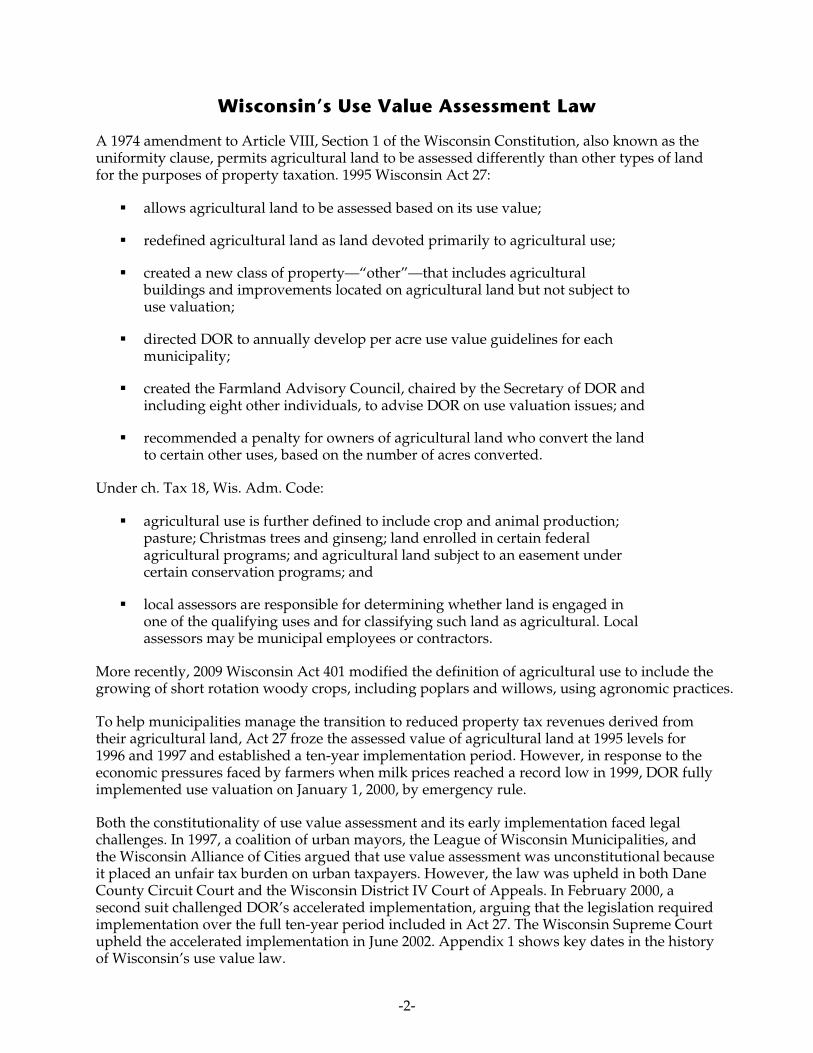
Wisconsin’s Use Value Assessment Law
A 1974 amendment to Article VIII, Section 1 of the Wisconsin Constitution, also known as the uniformity clause, permits agricultural land to be assessed differently than other types of land for the purposes of property taxation. 1995 Wisconsin Act 27:
allows agricultural land to be assessed based on its use value;
redefined agricultural land as land devoted primarily to agricultural use;
created a new class of property—“other”—that includes agricultural buildings and improvements located on agricultural land but not subject to use valuation;
directed DOR to annually develop per acre use value guidelines for each municipality;
created the Farmland Advisory Council, chaired by the Secretary of DOR and including eight other individuals, to advise DOR on use valuation issues; and
recommended a penalty for owners of agricultural land who convert the land to certain other uses, based on the number of acres converted.
Under ch. Tax 18, Wis. Adm. Code:
agricultural use is further defined to include crop and animal production; pasture; Christmas trees and ginseng; land enrolled in certain federal agricultural programs; and agricultural land subject to an easement under certain conservation programs; and
local assessors are responsible for determining whether land is engaged in one of the qualifying uses and for classifying such land as agricultural. Local assessors may be municipal employees or contractors.
More recently, 2009 Wisconsin Act 401 modified the definition of agricultural use to include the growing of short rotation woody crops, including poplars and willows, using agronomic practices. To help municipalities manage the transition to reduced property tax revenues derived from their agricultural land, Act 27 froze the assessed value of agricultural land at 1995 levels for 1996 and 1997 and established a ten-year implementation period. However, in response to the economic pressures faced by farmers when milk prices reached a record low in 1999, DOR fully implemented use valuation on January 1, 2000, by emergency rule. Both the constitutionality of use value assessment and its early implementation faced legal challenges. In 1997, a coalition of urban mayors, the League of Wisconsin Municipalities, and the Wisconsin Alliance of Cities argued that use value assessment was unconstitutional because it placed an unfair tax burden on urban taxpayers. However, the law was upheld in both Dane County Circuit Court and the Wisconsin District IV Court of Appeals. In February 2000, a second suit challenged DOR’s accelerated implementation, arguing that the legislation required implementation over the full ten-year period included in Act 27. The Wisconsin Supreme Court upheld the accelerated implementation in June 2002. Appendix 1 shows key dates in the history of Wisconsin’s use value law.

-3-
Acreage and Location of Agricultural Land
In 2008, 12.2 million acres, or 35.0 percent of all acreage in Wisconsin, was assessed as agricultural land. Figure 1 shows the percentage of agricultural land in each county. Counties in southwestern and east-central Wisconsin have the largest percentage of agricultural land, while northern Wisconsin and Milwaukee County have the smallest. The percentage of agricultural land varies in the more densely populated counties where larger cities are located. For example, 55.2 percent of the acres in Dane County were assessed as agricultural in 2008, compared to 21.2 percent of the acres in Waukesha County.
Figure 1
Percentage of County Acreage Classified and Assessed as Agricultural 2008
Price
Clark
Dane
Polk
Vilas
Grant
Iron
Bayfield
Rusk
Sawyer
Oneida
Marathon
Sauk
Forest
Taylor
Iowa
Dunn
Douglas
Marinette
Rock
Oconto
Wood
Dodge
Barron
Lincoln
Ashland
Jackson
Monroe
Burnett
Vernon
Juneau
Chippewa
PortageBuffalo
Adams
Shawano
Langlade
Green
Pierce
St. Croix
Washburn
Brown
Columbia
Waupaca
Lafayette
Richland
Jefferson
Crawford
Waushara
Walworth
Eau Claire
Fond Du Lac
Outagamie
Florence
Waukesha
Door
Manitowoc
Winnebago
Racine
Calumet
La Crosse
MarquetteSheboygan
Pepin
Kenosha
Menominee
Trempealeau
Washington
Kewaunee
Green Lake
Ozaukee
Milwaukee
Percentage of County Acreagein Agricultural Class
60.0 percent or more
40.0 to 59.9 percent
20.0 to 39.9 percent
Less than 20.0 percent

-4-
As shown in Figure 2, the number of acres assessed as agricultural declined in 63 Wisconsin counties from 2004 through 2008 but increased in nine primarily northern counties. Declines exceeded 15,000 acres in each of two geographically large counties—Marathon and Grant—and exceeded 7,500 acres in five others. Appendix 2 shows the number and percentage of acres assessed as agricultural by county in 2004 and 2008.
Figure 2
Net Change in Agricultural Acreage 2004 through 2008
Price
Clark
Dane
Polk
Vilas
Grant
Iron
Bayfield
Rusk
Sawyer
Oneida
Marathon
Sauk
Forest
Taylor
Iowa
Dunn
Douglas
Marinette
Rock
Oconto
Wood
Dodge
Barron
Lincoln
Ashland
Jackson
Monroe
Burnett
Vernon
Juneau
Chippewa
PortageBuffalo
Adams
Shawano
Langlade
Green
Pierce
St. Croix
Washburn
Brown
Columbia
Waupaca
Lafayette
Richland
Jefferson
Crawford
Waushara
Walworth
Eau Claire
Fond Du Lac
Outagamie
Florence
Waukesha
Door
Manitowoc
Winnebago
Racine
Calumet
La Crosse
MarquetteSheboygan
Pepin
Kenosha
Menominee
Trempealeau
Washington
Kewaunee
Green Lake
Ozaukee
Milwaukee
Net Change in Agricultural Acreage 2004 through 2008
Decline of more than 7,500 acres
-5,000 to -7,500 acres
-2,500 to -5,000 acres
0 to -2,500 acres
Gained acres
Statewide, agricultural acreage declined by 2.2 percent, or 269,374 acres, as shown in Table 1.

-5-
Table 1
Changes in Agricultural Acreage by Assessing Municipality Type1
Assessing Municipality 2004 2005 2006 2007 2008
Percentage Change
2004-2008
Village 157,115 155,892 161,586 162,215 169,077 7.6%
City 95,483 97,283 96,778 95,765 96,183 0.7
Town 12,199,414 12,107,253 12,015,894 11,965,723 11,917,378 (2.3)
Statewide 12,452,012 12,360,428 12,274,258 12,223,703 12,182,638 (2.2) 1 Based on information reported by local assessors to the Department of Revenue. Some changes in agricultural acreage may reflect shifts in acreage between municipalities, while others may reflect changes in land use. For example, one municipality may lose agricultural acreage when a portion of its land is annexed into a neighboring municipality; however, unless the annexed land is no longer used for agricultural purposes, the annexing municipality will then gain the agricultural acreage. In contrast, agricultural acreage will be lost when agricultural land is sold and converted to another use. As shown in Table 2, buyers reported that 125,894 of the 741,157 agricultural acres sold from 2004 though 2008, or 17.0 percent, were purchased with the intent to convert the land to non-agricultural uses, including commercial, residential, or industrial development or use as recreational and forest land.
Table 2
Agricultural Land Sales by Intended Use1 in Acres
Intended Use 2004 2005 2006 2007 2008 Total
Agricultural 153,685 126,377 106,421 103,673 125,107 615,263
Non-Agricultural 44,403 33,808 23,969 15,228 8,486 125,894
Total 198,088 160,185 130,390 118,901 133,593 741,157
1 Source: Wisconsin Agricultural Statistics Service, United States Department of Agriculture.
Property Tax Trends
To analyze the effect of use value assessment on the eight property tax classes specified in s. 70.32(2)(a), Wis. Stats., we reviewed property tax levies. As shown in Table 3, the tax levy net

-6-
of state property tax credits increased by 65.8 percent statewide from 1995 through 2008, when it reached $8.7 billion. In contrast, the levy on the combined agricultural and “other” property classes was reduced by 39.0 percent, from $352.8 million in 1995 to $215.3 million in 2008. Because agricultural buildings and improvements were removed from the agricultural class beginning in 1996 and reclassified as “other,” the agricultural and “other” property classes are combined when comparing values from 1995 through 2008. We note that in 2008, DOR reported that approximately 83 percent of the gross tax levy in the combined classes had been generated by the “other” class, and the remaining 17 percent by the agricultural class. We also note that since 2004, property in the undeveloped and newly created agricultural forest classes has been assessed at 50 percent of its market value, which may also have contributed to changes in agricultural acreage in some communities.
Table 3
Net Tax Levy by Property Class1 (in millions)
Property Class 1995 2000 2005 2008 Percentage
Change
Real Property:
Residential $3,370.5 $4,079.3 $5,465.0 $6,145.3 82.3%
Commercial 1,023.6 1,166.5 1,478.2 1,715.9 67.6
Manufacturing 196.8 227.9 234.9 243.1 23.5
Agricultural/Other 352.8 255.2 208.1 215.3 (39.0)2
Agricultural Forest/ Productive Forest/ Undeveloped 59.3 105.6 150.6 181.8 206.63
Subtotal 5,003.0 5,834.5 7,536.8 8,501.4 69.9
Personal Property 264.6 212.2 203.1 229.7 (13.2)
Total $5,267.6 $6,046.7 $7,739.9 $8,731.1 65.8
1 The net tax levy reflects the gross tax levy minus applicable lottery and school tax credits and, beginning in 2008, the First Dollar tax credit.
2 This decrease reflects the change in valuation of agricultural land from full market value to use value. 3 Some land in the agricultural forest classification may have been classified as agricultural prior to the creation
of the agricultural forest class.
Source: Legislative Fiscal Bureau. Table 4 shows the proportion of the net tax levy paid by each property tax class. Since 1995, the declining proportion of property taxes paid by the agricultural class has been offset by increasing proportions in the remaining classes.

-7-
Table 4
Percentage of Net Tax Levy by Property Class
Property Class 1995 2000 2005 2008
Real Property:
Residential 64.0% 67.5% 70.6% 70.4%
Commercial 19.4 19.3 19.1 19.6
Manufacturing 3.7 3.7 3.0 2.8
Agricultural/Other 6.7 4.2 2.7 2.5
Agricultural Forest/ Productive Forest/ Undeveloped 1.1 1.7 1.9 2.1
Subtotal 94.9 96.4 97.3 97.4
Personal Property 5.1 3.6 2.7 2.6
Total 100.0% 100.0% 100.0% 100.0%
1 The net tax levy reflects the gross tax levy minus applicable lottery and school tax credits and, beginning in 2008, the First Dollar tax credit.
Source: Legislative Fiscal Bureau.
Use Value Assessment in 14 Municipalities
As noted, we focused our analysis on the implementation of use value assessment in 14 municipalities chosen for their geographic diversity and variation in population density and development. As part of our review, we interviewed assessors to determine their procedures for classifying and assessing agricultural land. We also obtained data from each assessor on the number and characteristics of agricultural parcels in their municipalities, including each parcel’s ownership, zoning, and size. Section Tax 18.06(1), Wis. Adm. Code, requires assessors to determine whether land classified as agricultural is devoted primarily to agricultural use. How that determination is made varied among the assessors we interviewed. For example:
10 assessors reported that they regularly conduct on-site inspections of agricultural land to determine its current class, with frequencies ranging from one to four times per year;
9 assessors reported that they regularly use aerial photographs to identify agricultural land, although several assessors noted that the photographs may be outdated and therefore less useful than other methods;
7 assessors reported that they regularly speak with agricultural property owners to obtain information about land use; and

-8-
5 assessors reported that they regularly request documentation from property owners including lease agreements and copies of Internal Revenue Service Form 1040 (Schedule F), which reports profit or loss from farming, or use information from property owners on a form developed by DOR in October 2009 to assist them in making classification decisions.
In 2009, the percentage of acres assessed as agricultural in the 14 municipalities we reviewed ranged from a low of 1.2 percent in the City of Brookfield to a high of 72.3 percent in the Town of Akan, as shown in Table 5. Appendix 3 includes more detailed information for each of the 14 municipalities.
Table 5
Agricultural Acreage in Selected Municipalities 2009
Municipality Type County Agricultural Acres Total
Assessed Acres Percentage
of Total
Akan Town Richland 13,039.1 18,032.0 72.3%
Appleton City Calumet, Outagamie, and Winnebago 1,042.3 10,156.0 10.3
Brookfield1 City Waukesha 208.6 17,655.0 1.2
Eau Claire1 City Chippewa and Eau Claire 387.4 10,197.0 3.8
Germantown Village Washington 6,312.7 17,622.0 35.8
Middleton City Dane 114.7 2,680.0 4.3
Onalaska City La Crosse 282.7 4,114.0 6.9
Perry Town Dane 15,646.0 21,799.0 71.8
Platteville1 City Grant 619.4 2,688.0 23.0
Rice Lake City Barron 452.1 2,772.0 16.3
Sturtevant Village Racine 642.7 1,921.0 33.5
Sun Prairie City Dane 808.8 4,434.0 18.2
Twin Lakes Village Kenosha 2,426.9 4,667.0 52.0
Wausau City Marathon 110.7 7,184.0 1.5
1 Total assessed acres and agricultural acres as a percentage of total assessed acres are estimates based on information we obtained from the local assessor and the municipality’s total land area.
Agricultural Land Ownership In order to review how municipalities are implementing the use value law and whether it is operating as intended, we first obtained information on the parcels that make up the 42,094.1 agricultural acres within our sample municipalities, including the names of their owners. We found:
limited liability partnerships and individuals owned approximately 74 percent of the agricultural acreage;

-9-
corporations, including non-profit and limited liability corporations (LLCs), owned approximately 19 percent of the agricultural acreage; and
the balance of the agricultural acreage, about 7 percent, was held in trusts. Because corporations and LLCs are statutorily required to file annual reports with the Department of Financial Institutions indicating the nature of their business, we asked for the Department’s assistance in obtaining additional ownership information for agricultural acreage. We then determined whether any agricultural acreage in our sample municipalities was owned by corporations or LLCs self-reporting as real estate or property development businesses, which may indicate a greater likelihood for the land to eventually be sold or developed. The percentage of agricultural land owned by real estate or property development businesses varied by municipality but was often higher in urban areas. As shown in Table 6, it ranged from 0.7 percent in the Town of Akan to 55.4 percent in the City of Sun Prairie. However, these percentages are likely understated because they do not include corporations or LLCs that reported the nature of their business as both agriculture and real estate or property development. In addition, the data included only corporations and LLCs, but other entities and individuals could also own agricultural land with the intention of developing or selling it for other uses.
Table 6
Agricultural Land Owned by Real Estate or Property Development Businesses1 Selected Municipalities, 2009
Municipality Agricultural
Acres
Acres Owned by Real Estate or Property Development
Businesses Percentage
of Total
Akan 13,039.1 87.6 0.7%
Appleton 1,042.3 523.0 50.2
Brookfield 208.6 42.1 20.2
Eau Claire 387.4 108.8 28.1
Germantown 6,312.7 973.5 15.4
Middleton 114.7 54.5 47.5
Onalaska 282.7 6.0 2.1
Perry 15,646.0 998.5 6.4
Platteville 619.4 203.5 32.9
Rice Lake 452.1 48.7 10.8
Sturtevant 642.7 10.6 1.6
Sun Prairie 808.8 448.0 55.4
Twin Lakes 2,426.9 244.5 10.1
Wausau 110.7 51.2 46.3
Total 42,094.1 3,800.5 9.0
1 Based on information contained in statutorily required annual reports filed with the Department of Financial Institutions as of March 2010.

-10-
Agricultural Land Zoning
Land classification for assessment purposes is established by state law, but zoning to regulate land use is established by county and municipal ordinances. Because its primary purpose is to reflect local land use preferences, zoning helps to indicate what types of future development are appropriate by local standards. State law does not limit eligibility for use value assessment based on zoning, and all land classified as agricultural is assessed at its use value, as required by s. 70.32, Wis. Stats., regardless of how it is zoned. Zoning ordinances vary widely among Wisconsin counties and municipalities, and in some cases local zoning categories do not correspond directly with the land classes specified in statute for assessment purposes. For example, 3 municipalities in our review had zoning categories that combine or mix commercial and industrial or residential uses; 10 had conservancy zones, which are intended to preserve natural areas; 11 had “planned development” zones; and 4—all cities—had no agricultural zones, although 3 of these cities permit agricultural production in residential zones. Land that is classified as agricultural for assessment purposes may be zoned for non-agricultural purposes for a number of reasons. First, statutes protect the continued use of a property when a new zoning ordinance is passed. For example, if an agricultural parcel located near a new highway bypass is rezoned for commercial use, agricultural production will remain a legally protected non-conforming use, and the land will continue to qualify for use value assessment. Second, agricultural land may be zoned for a non-agricultural purpose if it is annexed by a neighboring municipality. For example, the City of Eau Claire zones all land annexed into its boundaries as non-agricultural, regardless of its previous zoning and use. Finally, individuals, real estate and property developers, and other businesses may own land zoned for future development but may, for example, rent the land to farmers for agricultural production until the development precludes agricultural use. Because zoning for a non-agricultural purpose may indicate that the market value of an agricultural parcel exceeds its use value for tax assessment purposes, we reviewed the zoning of agricultural acres in our 14 selected municipalities. In 9 of these municipalities, more than 50.0 percent of agricultural land was zoned for a purpose other than agriculture, while two rural municipalities had only 1.0 percent zoned in this manner. As shown in Table 7, all 14 municipalities had some agricultural land zoned for non-agricultural purposes.

-11-
Table 7
Zoning of Agricultural Acres Selected Municipalities, 2009
Acres Zoned for
Agriculture Acres Zoned for
Non-Agricultural Purposes
Municipality
Total Agricultural
Acres Number Percentage
of Total
Number Percentage
of Total1
Municipalities with Agricultural Zoning
Akan 13,039.1 12,905.3 99.0% 133.8 1.0%
Appleton 1,042.3 918.7 88.1 123.6 11.9
Germantown 6,312.7 5,810.3 92.0 502.4 8.0
Middleton 114.7 45.1 39.3 69.6 60.7
Onalaska 282.7 53.5 18.9 229.2 81.1
Perry 15,646.0 15,487.0 99.0 159.0 1.0
Rice Lake 452.1 80.4 17.8 371.7 82.2
Sturtevant 642.7 0.0 0.0 642.7 100.0
Sun Prairie 808.8 433.9 53.6 374.9 46.4
Twin Lakes 2,426.9 5.1 0.2 2,421.8 99.8
Municipalities without Agricultural Zoning
Brookfield 208.6 N.A. N.A. 208.6 100.0
Eau Claire 387.4 N.A. N.A. 387.4 100.0
Platteville 619.4 N.A. N.A. 619.4 100.0
Wausau 110.7 N.A. N.A. 110.7 100.0
1 Highlighted municipalities are those in which more than 50.0 percent of agricultural acreage is zoned for a non-agricultural purpose.

-12-
Agricultural Land Platting Platting is another indicator that a property is intended for development. Some believe that owners of agricultural land that has already been platted for development are inappropriately benefitting from use value assessment. Chapter 236, Wis. Stats., defines a plat as the planned subdivision of land into parcels of 1.5 acres or less and specifies the units of government that must approve a plat before land may be legally subdivided and developed. Depending on the location and characteristics of a proposed development, review and approval may be required from the village or town board, the city council, a nearby city, the county, the Department of Administration, the Department of Commerce, the Department of Natural Resources, and the Department of Transportation. Local ordinances may establish more restrictive platting requirements than those set forth in statute. Comprehensive, uniform information regarding agricultural parcels that have been platted was not readily available for all of the municipalities included in our review, but assessors in 9 of the 14 municipalities were able to provide us with limited platting data. In four of those municipalities, no agricultural parcels had been platted; in the remaining five, the percentages ranged from 13.5 percent of all agricultural parcels in Appleton to 91.8 percent of all agricultural parcels in Middleton. Moreover, municipal services such as streets, water, and sewer connections had already been extended to 9 of the platted agricultural parcels in Eau Claire and 222 of the platted agricultural parcels in Twin Lakes. We also analyzed the size of agricultural parcels within each municipality. The average size of agricultural parcels in the 14 municipalities we reviewed ranged from 1.3 acres in Middleton to 29.2 acres in Sturtevant. Based on the statutory definition of platting and information provided by local assessors, agricultural parcels of 1.5 acres or less have generally been platted for development, while parcels 10.0 acres and larger generally have not. As shown in Table 8, more than 80.0 percent of the agricultural parcels in Sun Prairie, Middleton, and Twin Lakes were 1.5 acres or smaller; conversely, in Akan, Perry, and Sturtevant, more than 70.0 percent of the agricultural parcels were 10.0 acres or larger.

-13-
Table 8
Size of Agricultural Parcels Selected Municipalities, 2009
1.5 Acres or Less 10.0 Acres or More
Municipality Total
Parcels Number Percentage
of Total
Number Percentage
of Total
Akan 609 26 4.3% 440 72.2%
Appleton 37 2 5.4 21 56.8
Brookfield 19 3 15.8 8 42.1
Eau Claire 27 13 48.1 6 22.2
Germantown 422 30 7.1 263 62.3
Middleton 85 73 85.9 4 4.7
Onalaska 19 3 15.8 10 52.6
Perry 728 31 4.3 555 76.2
Platteville 79 26 32.9 23 29.1
Rice Lake 26 2 7.7 17 65.4
Sturtevant 22 0 0.0 20 90.9
Sun Prairie 439 393 89.5 25 5.7
Twin Lakes 512 413 80.7 39 7.6
Wausau 9 0 0.0 5 55.6
Total 3,033 1,015 33.5 1,436 47.3 Estimated Effects of Use Value Assessment on Property Taxes
To analyze the effects of use value assessment on the property tax bills of agricultural and other landowners, we estimated the amount by which 2009 assessments and property taxes would have differed in our sample of 14 municipalities if agricultural land zoned for a non-agricultural purpose had been assessed according to its estimated market value. Property tax liability is calculated by multiplying a property’s assessed value by the property tax rate of the municipality in which it is located. A municipality’s property tax rate is determined by dividing the tax levy, which is the total revenue that must be generated to cover budgeted costs, by the total assessed value of all taxable property in the municipality. Assuming all other factors affecting the tax levy remain constant, the property tax rate will decrease as the total value of taxable property within a municipality increases. Conversely, if the taxable value of one class of property is reduced—as occurs under use value assessment for agricultural land— a higher property tax rate will result because the total assessed value of all taxable property in the municipality has been reduced.

-14-
As shown in Table 9, the difference between market and use value for the agricultural land zoned for non-agricultural purposes in the 14 municipalities we reviewed was an estimated $250.2 million in 2009. Differences ranged from $336,300 in rural Akan to $54.3 million in Twin Lakes, a village located near urban areas.
Table 9
Estimated Value of Agricultural Land Zoned for Non-Agricultural Purposes Selected Municipalities, 2009
Municipality
Agricultural Acres Zoned for
Non-Agricultural Purposes
Assessed Use Value
Estimated Market Value1
Difference
Akan 133.8 $ 25,100 $ 361,400 $ 336,300
Appleton 123.6 24,100 5,291,900 5,267,800
Brookfield 208.6 62,800 28,285,300 28,222,500
Eau Claire 387.4 85,800 8,762,800 8,677,000
Germantown 502.4 133,100 42,609,800 42,476,700
Middleton 69.6 20,000 27,427,100 27,407,100
Onalaska 229.2 49,900 2,581,700 2,531,800
Perry 159.0 32,700 1,881,200 1,848,500
Platteville 619.4 178,600 12,952,000 12,773,400
Rice Lake 371.7 76,200 17,989,800 17,913,600
Sturtevant 642.7 133,400 24,102,000 23,968,600
Sun Prairie 374.9 127,800 23,021,200 22,893,400
Twin Lakes 2,421.8 628,600 54,951,300 54,322,700
Wausau 110.7 21,300 1,533,600 1,512,300
Total 6,354.8 $1,599,400 $251,751,100 $250,151,700
1 Estimates were determined with the assistance of the local assessor in each municipality and do not reflect the full assessment process, which may include an appeal before a board of review or a challenge in circuit court.
As shown in Table 10, if agricultural land zoned for non-agricultural purposes had been assessed at market value in 2009, agricultural landowners in the 14 municipalities we selected would have been liable for an additional $4.7 million in property taxes, and the property tax liability of all other property owners would have been reduced by that amount. However, the estimates in Table 10 reflect specific conditions of each of the municipalities in 2009 and assume no change in either the tax levy and its apportionment or in the distribution of school aids. Moreover, they cannot be extrapolated to other municipalities or statewide, nor can they be projected for the future in the 14 municipalities.

-15-
Table 10
Estimated Property Taxes on Agricultural Land Zoned for Non-Agricultural Purposes
Selected Municipalities, 2009
Municipality Total Estimated Taxes—Use Value Assessment
Total Estimated Taxes— Market Value Assessment Difference
Akan $ 500 $ 7,400 $ 6,900
Appleton 500 111,400 110,900
Brookfield 1,100 474,600 473,500
Eau Claire 1,700 176,500 174,800
Germantown 2,300 737,700 735,400
Middleton 400 499,200 498,800
Onalaska 1,000 49,800 48,800
Perry 500 26,900 26,400
Platteville 4,000 286,300 282,300
Rice Lake 1,900 437,400 435,500
Sturtevant 2,600 451,500 448,900
Sun Prairie 2,800 506,700 503,900
Twin Lakes 11,400 923,100 911,700
Wausau 500 36,400 35,900
Total $31,200 $4,724,900 $4,693,700 Keeping these constraints in mind, estimated effects on local property taxes were greater when a larger relative proportion of the property tax base qualified for use value assessment and the market and use values of qualifying land differed significantly, as was common in urbanizing areas. For example, the property tax effects of use value assessment were greater in Germantown, which is an urbanizing municipality near Milwaukee, than in Onalaska, where the difference between the use value and the market value of agricultural land was not as great. As shown in Table 11, we estimated that the average property tax bill for an agricultural parcel zoned for non-agricultural purposes would have been $3,516 higher in 2009 if the land had been assessed at its market value. Conversely, the average property tax bill for all other parcels would have been $38 lower, in part because of the large number of non-agricultural properties.

-16-
Table 11
Estimated Effects of Use Value Assessment on
Average Property Tax Bills in Selected Municipalities 2009
Agricultural Land Zoned for Non-Agricultural Purposes
All Other Land
Municipality
Estimated Taxes—
Use Value Assessment
Estimated Taxes—
Market Value Assessment Difference
Estimated Taxes—
Use Value Assessment
Estimated Taxes—
Market Value Assessment Difference
Akan $37 $ 526 $ 489 $ 443 $ 438 $ (5)
Appleton 37 7,958 7,921 3,966 3,961 (5)
Brookfield 56 24,977 24,921 7,492 7,460 (32)
Eau Claire 64 6,538 6,474 3,883 3,875 (8)
Germantown 29 9,107 9,078 4,873 4,789 (84)
Middleton 5 6,163 6,158 7,642 7,564 (78)
Onalaska 60 2,931 2,871 4,942 4,934 (8)
Perry 25 1,414 1,389 630 616 (14)
Platteville 51 3,624 3,573 4,225 4,131 (94)
Rice Lake 83 19,018 18,935 3,859 3,737 (122)
Sturtevant 119 20,522 20,403 4,564 4,368 (196)
Sun Prairie 7 1,209 1,202 5,300 5,252 (48)
Twin Lakes 22 1,807 1,785 4,133 3,882 (251)
Wausau 57 4,048 3,991 4,357 4,355 (2)
14-Municipality Average $23 $3,539 $3,516 $4,748 $4,710 $(38)
Future Considerations
Our review of 14 municipalities suggests that use value assessment has met its goal of significantly reducing property taxes levied on agricultural land. However, the extent to which it has met other goals is less clear. Recent Wisconsin legislation—known as the Working Lands Initiative—and use value assessment programs in other states may be useful models if the Legislature wishes to consider modifications to Wisconsin’s use value law. Working Lands Initiative The Working Lands Initiative, enacted in 2009 Wisconsin Act 28, the 2009-11 Biennial Budget Act, was designed to provide a framework for state and local units of government and private
-17-
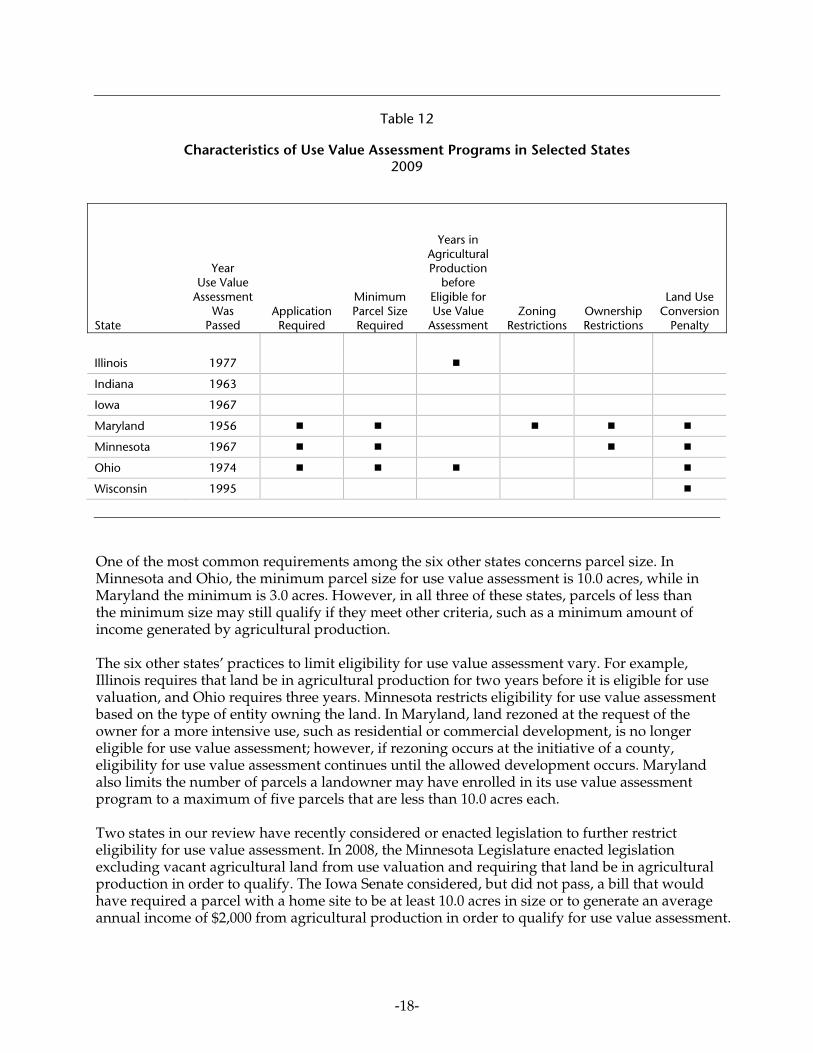
landowners to promote agriculture and minimize land use conflicts. Under the initiative, counties are required to adopt farmland preservation plans that specify areas they plan to preserve for agricultural use. Landowners in those preservation areas who meet other eligibility requirements may qualify for farmland preservation income tax credits, and local entities—such as municipal governments and non-profit organizations—may purchase agricultural easements from willing landowners in order to preserve qualifying land for agricultural use. Purchasers receive reimbursements of up to 50.0 percent of the easement’s fair market value from the State. In adopting the Working Lands Initiative, the Legislature restricted eligibility for farmland preservation income tax credits, which range from $5.00 to $10.00 per acre, to land that is located in either a locally established farmland preservation zoning district or a state-designated agricultural enterprise area. The Legislature also chose to remove a minimum parcel size requirement of 35.0 acres that had previously been in place for farmland preservation tax credits. However, the Working Lands Initiative continues the requirement that eligibility for farmland preservation credits be limited to those who generated—exclusive of receipts from land rental—gross farm revenue in excess of $6,000 in the past year, or $18,000 in the past three years. It is too early to determine what effect the Working Lands Initiative will have on farmland preservation. In the short term, however, the eligibility requirements for farmland preservation tax credits are more restrictive than those for use value assessment, which require only that land be devoted primarily to agricultural use. Other States’ Practices With the exception of Michigan, all 50 states have some form of use value assessment that allows agricultural land to be assessed based on its ability to produce farm income. Michigan allows farmers to claim state income tax credits to offset their property tax bills. Other states have implemented a variety of eligibility requirements for use value assessment, including those related to parcel size, income generated from agricultural production, prior years in agricultural use, and zoning categories. We analyzed the characteristics of use value assessment programs in a sample of six other states, including five midwestern states and Maryland, which was the first state to pass use value legislation in 1956. As shown in Table 12, four of the states in our review—Illinois, Maryland, Minnesota, and Ohio—had more restrictive use value laws than Wisconsin did in 2009, while two—Indiana and Iowa—did not.
-18-
Table 12
Characteristics of Use Value Assessment Programs in Selected States
2009
State
Year Use Value
Assessment Was
Passed Application Required
Minimum Parcel Size Required
Years in
Agricultural Production
before Eligible for Use Value
Assessment Zoning
Restrictions Ownership Restrictions
Land Use Conversion
Penalty
Illinois 1977
Indiana 1963
Iowa 1967
Maryland 1956
Minnesota 1967
Ohio 1974
Wisconsin 1995
One of the most common requirements among the six other states concerns parcel size. In Minnesota and Ohio, the minimum parcel size for use value assessment is 10.0 acres, while in Maryland the minimum is 3.0 acres. However, in all three of these states, parcels of less than the minimum size may still qualify if they meet other criteria, such as a minimum amount of income generated by agricultural production. The six other states’ practices to limit eligibility for use value assessment vary. For example, Illinois requires that land be in agricultural production for two years before it is eligible for use valuation, and Ohio requires three years. Minnesota restricts eligibility for use value assessment based on the type of entity owning the land. In Maryland, land rezoned at the request of the owner for a more intensive use, such as residential or commercial development, is no longer eligible for use value assessment; however, if rezoning occurs at the initiative of a county, eligibility for use value assessment continues until the allowed development occurs. Maryland also limits the number of parcels a landowner may have enrolled in its use value assessment program to a maximum of five parcels that are less than 10.0 acres each. Two states in our review have recently considered or enacted legislation to further restrict eligibility for use value assessment. In 2008, the Minnesota Legislature enacted legislation excluding vacant agricultural land from use valuation and requiring that land be in agricultural production in order to qualify. The Iowa Senate considered, but did not pass, a bill that would have required a parcel with a home site to be at least 10.0 acres in size or to generate an average annual income of $2,000 from agricultural production in order to qualify for use value assessment.

-19-
Wisconsin has considered, but not implemented, use value requirements similar to those of some other states. For example:
in October 1993, as directed by the Legislature, DOR conducted a feasibility study and recommended the Legislature adopt use value assessment with a minimum parcel size requirement of 35.0 acres;
in November 1995, during the administrative rule-making process, DOR proposed a minimum parcel size of 1.0 acre, as well as a rule requiring that a parcel be used for agricultural production for a minimum of three years before it would become eligible for use value assessment;
during the 2001-03 biennium, the Senate approved modifying the definition of agricultural land to include only land from which $3,500 or more in agricultural products were sold or would normally be sold during the year; and
during the two most recent biennia—2007-09 and 2009-11—the Legislature considered requirements related to zoning and platting. An amendment to 2007 Senate Bill 40 would have excluded land platted and zoned for residential, commercial, or industrial use from qualifying for use value assessment, and the Senate approved language in the 2009-11 biennial budget bill that would have excluded land platted or zoned for residential, commercial, or industrial use from qualifying for use value assessment. However, that language was not approved by the Assembly or by the Committee of Conference on Assembly Bill 75.
Although the Working Lands Initiative and the experiences of other states could serve as useful models for discussing use value assessment in Wisconsin, modifying the use value law could present challenges. For example, because zoning categories are not consistent statewide, and some municipalities have mixed zoning districts while others have no zoning, modifying the definition of agricultural use based on locally established zoning categories would likely be difficult to implement and could result in inconsistent application of a modified use value law. Similarly, if the Legislature were to implement a minimum parcel size requirement, the possibility exists that farmers who produce low-volume, high-value crops—such as ginseng—on small acreage farms would be excluded, which has been a concern raised by some interest groups. Finally, some interest groups expressed concern to us that any modifications to the definition of agricultural use could open the door for legal challenges regarding the Wisconsin Constitution’s uniformity clause. As noted, a 1974 amendment permits agricultural land to be treated differently from other types of land for the purposes of property taxation. However, the interest groups argued that the implementation of additional eligibility requirements—such as zoning, minimum parcel size, or minimum farm revenue—could conflict with rulings by the Wisconsin Supreme Court that all land within the agricultural class must be taxed uniformly, as is currently the case. On the other hand, modifications to Wisconsin’s use value law could also address the alleged loopholes. For example, restricting eligibility for use value assessment based on ownership, parcel size, income generated from agricultural production, or other characteristics could help ensure that property tax benefits of the use value assessment are being directed solely to farmers.


Appendix 1
Key Legislative and Judicial Actions Related to Use Value Assessment
Year Action Description
1974 Constitutional Amendment to
Article VIII, Section 1, Uniformity Clause Allowed non-uniform taxation of agricultural and undeveloped
land.
1993 1993 Senate Bill 44 Senate attempted to introduce use value assessment for agricultural land.
1993 1993 Wisconsin Act 16, the 1993-95 Biennial Budget Act
Directed DOR to study use value assessment. DOR recommended the Legislature adopt use value assessment with a minimum parcel size of 35 acres.
1995 1995 Senate Bill 104/ 1995 Assembly Bill 176
Proposed use value assessment for agricultural land, with agricultural land defined through a cross-reference to the farmland preservation statute.
1995 1995 Wisconsin Act 27, the 1995-97 Biennial Budget Act
Redefined the agricultural class of land and created a new class of land, “other,” that includes agricultural buildings and improvements.
Provided for use value assessment of agricultural land, to be implemented over ten years.
Created the Farmland Advisory Council to advise DOR on use value assessment and recommend a penalty for conversion of agricultural land to other uses.
1999 Wisconsin Appellate Court Decision Court of Appeals upheld the constitutionality of use value assessment.
1999 1999 Wisconsin Act 9, the 1999-2001 Biennial Budget Act
Established a conversion penalty, equal to the difference between taxes paid under market valuation and use valuation for the previous two years and payable by owners of converted parcels.
1999 Emergency Rule to amend Chapter Tax 18, Wis. Adm. Code
Suspended the ten-year phase-in process and implemented full use value assessment effective January 1, 2000.
2002 Senate version of the budget adjustment bill, which became 2001 Wisconsin Act 109
Senate approved modifying the definition of agricultural land to include only land from which $3,500 or more in agricultural products were sold or would normally be sold during the year.
2002 2001 Wisconsin Act 109 Changed the conversion penalty to a per acre amount calculated by DOR for each county.
2002 Wisconsin Supreme Court Decision Upheld early implementation of use value assessment.
2003 2003 Wisconsin Act 33, the 2003-05 Biennial Budget Act
Redefined classes of property to include agricultural forest land, which is taxed at 50 percent of market value.
2007 Amendment to 2007 Senate Bill 40 Proposed modifying the definition of agricultural land to exclude land platted and zoned for residential, commercial, or industrial use.
2008 2007 Wisconsin Act 210 Renamed the penalty for converting agricultural land to another use to a “conversion charge.”
2009 Senate version of the 2009-11 biennial budget
Senate approved modifying the definition of agricultural land to exclude land platted or zoned for residential, commercial, or industrial use.
2010 2009 Wisconsin Act 401 Modified the definition of agricultural use to include the growing of short rotation woody crops using agronomic practices.


Appendix 2
Agricultural Acres by County
2004 2008 Change from
2004 through 2008
Counties Acres
Percentage of Total Acres
Percentage of Total Acres Percentage
Adams 100,088 24.1% 100,345 24.2% 257 0.3%
Ashland 34,040 5.1 35,353 5.3 1,313 3.9
Barron 267,239 48.4 260,524 47.2 (6,715) (2.5)
Bayfield 76,562 8.1 78,198 8.3 1,636 2.1
Brown 174,516 51.6 170,056 50.3 (4,460) (2.6)
Buffalo 219,681 50.1 213,357 48.7 (6,324) (2.9)
Burnett 63,518 12.1 62,307 11.9 (1,211) (1.9)
Calumet 137,587 67.2 133,993 65.5 (3,594) (2.6)
Chippewa 293,662 45.4 292,050 45.2 (1,612) (0.5)
Clark 371,869 47.8 362,368 46.6 (9,501) (2.6)
Columbia 271,726 54.9 264,462 53.4 (7,264) (2.7)
Crawford 206,735 56.4 199,073 54.3 (7,662) (3.7)
Dane 426,297 55.4 424,277 55.2 (2,020) (0.5)
Dodge 357,075 63.2 353,300 62.6 (3,775) (1.1)
Door 109,975 35.6 106,454 34.5 (3,521) (3.2)
Douglas 50,838 6.1 55,193 6.6 4,355 8.6
Dunn 297,161 54.5 291,626 53.5 (5,535) (1.9)
Eau Claire 162,420 39.8 158,498 38.8 (3,922) (2.4)
Florence 16,286 5.2 16,529 5.3 243 1.5
Fond du Lac 291,695 63.0 286,329 61.9 (5,366) (1.8)
Forest 19,676 3.0 18,380 2.8 (1,296) (6.6)
Grant 568,694 77.4 553,182 75.3 (15,512) (2.7)
Green 284,541 76.1 281,127 75.2 (3,414) (1.2)
Green Lake 119,604 52.7 115,827 51.1 (3,777) (3.2)
Iowa 326,238 66.8 323,004 66.2 (3,234) (1.0)
Iron 5,718 1.2 6,390 1.3 672 11.8
Jackson 159,249 25.2 151,583 24.0 (7,666) (4.8)
Jefferson 211,402 59.3 206,317 57.9 (5,085) (2.4)
Juneau 134,357 27.3 126,881 25.8 (7,476) (5.6)
Kenosha 80,816 46.3 79,275 45.4 (1,541) (1.9)
Kewaunee 140,840 64.2 135,359 61.7 (5,481) (3.9)
La Crosse 115,044 39.7 111,939 38.6 (3,105) (2.7)
Lafayette 337,102 83.1 336,355 83.0 (747) (0.2)
Langlade 84,744 15.2 83,175 14.9 (1,569) (1.9)
Lincoln 59,173 10.5 57,733 10.2 (1,440) (2.4)

2-2
2004 2008 Change from
2004 through 2008
Counties Acres
Percentage of Total Acres
Percentage of Total Acres Percentage
Manitowoc 219,644 58.0% 215,519 56.9% (4,125) (1.9)%
Marathon 404,377 40.9 388,185 39.3 (16,192) (4.0)
Marinette 100,305 11.2 93,490 10.4 (6,815) (6.8)
Marquette 93,387 32.0 92,168 31.6 (1,219) (1.3)
Menominee 0 0.0 33 0.0 33 –
Milwaukee 7,923 5.1 6,180 4.0 (1,743) (22.0)
Monroe 252,690 43.8 248,138 43.0 (4,552) (1.8)
Oconto 164,699 25.8 162,023 25.4 (2,676) (1.6)
Oneida 16,843 2.3 14,983 2.1 (1,860) (11.0)
Outagamie 219,180 53.5 212,056 51.7 (7,124) (3.3)
Ozaukee 64,358 43.4 62,264 41.9 (2,094) (3.3)
Pepin 80,312 54.0 78,343 52.7 (1,969) (2.5)
Pierce 223,943 60.7 218,211 59.1 (5,732) (2.6)
Polk 212,762 36.2 211,514 36.0 (1,248) (0.6)
Portage 216,570 42.0 210,840 40.9 (5,730) (2.6)
Price 58,305 7.3 57,619 7.2 (686) (1.2)
Racine 108,016 50.7 104,386 49.0 (3,630) (3.4)
Richland 214,606 57.2 210,309 56.1 (4,297) (2.0)
Rock 320,445 69.5 316,107 68.6 (4,338) (1.4)
Rusk 141,967 24.3 137,091 23.5 (4,876) (3.4)
St. Croix 263,377 57.0 257,931 55.8 (5,446) (2.1)
Sauk 265,693 49.6 260,879 48.7 (4,814) (1.8)
Sawyer 38,015 4.7 37,585 4.7 (430) (1.1)
Shawano 212,900 37.3 208,791 36.6 (4,109) (1.9)
Sheboygan 168,098 51.1 165,489 50.3 (2,609) (1.6)
Taylor 160,773 25.8 162,795 26.1 2,022 1.3
Trempealeau 263,607 56.1 256,855 54.7 (6,752) (2.6)
Vernon 285,524 56.1 282,297 55.5 (3,227) (1.1)
Vilas 4,469 0.8 4,397 0.8 (72) (1.6)
Walworth 207,750 58.5 203,320 57.2 (4,430) (2.1)
Washburn 67,226 13.0 68,685 13.3 1,459 2.2
Washington 114,778 41.6 106,682 38.7 (8,096) (7.1)
Waukesha 80,913 22.8 75,405 21.2 (5,508) (6.8)
Waupaca 173,454 36.1 169,585 35.3 (3,869) (2.2)
Waushara 146,294 36.5 142,620 35.6 (3,674) (2.5)
Winnebago 147,005 52.4 139,102 49.6 (7,903) (5.4)
Wood 155,636 30.7 149,942 29.6 (5,694) (3.7)
State Total 12,452,012 35.8% 12,182,638 35.0% (269,374) (2.2)%

Appendix 3
Characteristics of Agricultural Acreage and Parcels in Selected Municipalities

3-2
Town of Akan
Acreage and Value of Taxable Property by Property Class 2009
Property Class Number of Acres
Percentage of Acres
Assessed Value
Percentage of Assessed Value
Agricultural 13,039 72.3% $ 2,006,400 6.5%
Agricultural Forest 1,980 11.0 2,675,900 8.6
Commercial 20 0.1 539,600 1.7
Manufacturing 0 0.0 0 0.0
Other 117 0.6 8,790,800 28.4
Productive Forest 878 4.9 2,370,400 7.7
Residential 157 0.9 12,400,900 40.0
Undeveloped 1,841 10.2 2,136,600 6.9
Subtotal 18,032 100.0 30,920,600 99.8
Personal Property N.A. N.A. 75,800 0.2
Total 18,032 100.0% $30,996,400 100.0%
Change in Agricultural Acres
Year Number of Acres
Change from Prior Year
2004 11,721 –
2005 11,766 45
2006 11,874 108
2007 12,377 503
2008 12,778 401

3-3
Size of Agricultural Parcels—Town of Akan 609 Parcels
10 to 34.9 Acres 278 Parcels
5 to 9.9 Acres 80 Parcels
1.6 to 4.9 Acres 63 Parcels
1.5 Acres or Less 26 Parcels
35 Acres or More162 Parcels
Zoning of Agricultural Parcels—Town of Akan
Agricultural 12,905.3 Acres
Residential 20.9 Acres
Agricultural and Residential 112.8 Acres

3-4
City of Appleton
Acreage and Value of Taxable Property by Property Class 2009
Property Class Number of Acres
Percentage of Acres
Assessed Value
Percentage of Assessed Value
Agricultural 1,042 10.3% $ 189,100 <0.1%
Agricultural Forest 7 0.1 9,500 <0.1
Commercial 2,825 27.8 1,099,706,200 23.1
Manufacturing 513 5.1 151,449,600 3.2
Other 9 0.1 215,500 <0.1
Productive Forest 0 0.0 0 0.0
Residential 5,740 56.5 3,358,972,100 70.7
Undeveloped 20 0.2 2,000 <0.1
Subtotal 10,156 100.0 4,610,544,000 97.0
Personal Property N.A. N.A. 142,907,700 3.0
Total 10,156 100.0% $4,753,451,700 100.0%
Change in Agricultural Acres
Year Number of Acres
Change from Prior Year
2004 688 –
2005 973 285
2006 812 (161)
2007 1,081 269
2008 1,066 (15)
3-5
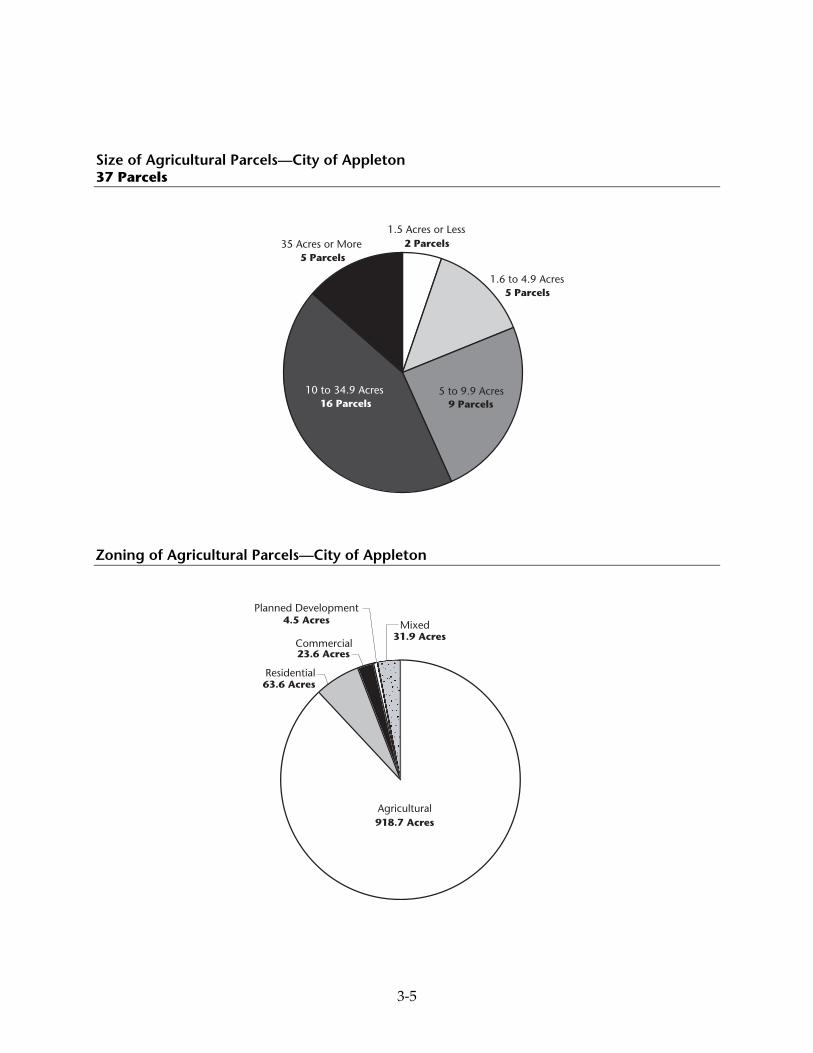
Size of Agricultural Parcels—City of Appleton 37 Parcels
5 to 9.9 Acres 9 Parcels
1.6 to 4.9 Acres5 Parcels
1.5 Acres or Less 2 Parcels35 Acres or More
5 Parcels
10 to 34.9 Acres 16 Parcels
Zoning of Agricultural Parcels—City of Appleton
Agricultural 918.7 Acres
Mixed 31.9 Acres
Residential 63.6 Acres
Commercial 23.6 Acres
Planned Development4.5 Acres

3-6
City of Brookfield
Acreage and Value of Taxable Property by Property Class 2009
Property Class Number of Acres
Percentage of Acres
Assessed Value
Percentage of Assessed Value
Agricultural 209 1.2% $ 62,800 <0.1%
Agricultural Forest 0 0.0 0 0.0
Commercial1 – – 1,808,302,700 27.5
Manufacturing 121 0.7 57,432,400 0.9
Other 0 0.0 0 0.0
Productive Forest 0 0.0 0 0.0
Residential1 – – 4,528,992,000 68.9
Undeveloped 1 – – 583,000 <0.1
Subtotal 17,655 6,395,372,900 97.3
Personal Property N.A. N.A. 174,176,600 2.7
Total 17,655 – $6,569,549,500 100.0%
1 Data on the number of acres in the Commercial, Residential and Undeveloped Classes were not available.
Change in Agricultural Acres
Year Number of Acres
Change from Prior Year
2004 220 –
2005 213 (7)
2006 203 (10)
2007 216 13
2008 – –

3-7
Size of Agricultural Parcels—City of Brookfield 19 Parcels
5 to 9.9 Acres
4
1.6 to 4.9 Acres4
1.5 Acres or Less 3
10 to 34.9 Acres8
Zoning of Agricultural Parcels—City of Brookfield
Residential 91.4 Acres
Office and Limited Residential/Commercial
55.1 Acres
Conservancy17.5 Acres
Light Industrial and CommercialMixed-Use 15.1 Acres
Mixed 29.5 Acres

3-8
City of Eau Claire
Acreage and Value of Taxable Property by Property Class 2009
Property Class Number of Acres
Percentage of Acres
Assessed Value
Percentage of Assessed Value
Agricultural 387 3.8% $ 87,000 <0.1%
Agricultural Forest 0 0.0 0 0.0
Commercial 3,167 31.0 1,459,862,200 32.7
Manufacturing 935 9.2 145,772,600 3.3
Other 1 <0.1 34,900 <0.1
Productive Forest 0 0.0 0 0.0
Residential 5,707 56.0 2,692,285,600 60.3
Undeveloped 0 0.0 0 0.0
Subtotal 10,197 100.0 4,298,042,300 96.3
Personal Property N.A. N.A. 167,056,400 3.7
Total 10,197 100.0% $4,465,098,700 100.0%
Change in Agricultural Acres
Year Number of Acres
Change from Prior Year
2004 128 –
2005 209 81
2006 317 108
2007 275 (42)
2008 241 (34)

3-9
Size of Agricultural Parcels—City of Eau Claire 27 Parcels
1.5 Acres or Less 13 Parcels
1.6 to 4.9 Acres 7 Parcels
5 to 9.9 Acres1 Parcel
10 to 34.9 Acres
3 Parcels
35 Acres or More
3 Parcels
Zoning of Agricultural Parcels—City of Eau Claire
Industrial 203.0 Acres
Commercial 9.2 Acres
Residential 175.2 Acres

3-10
Village of Germantown
Acreage and Value of Taxable Property by Property Class 2009
Property Class Number of Acres
Percentage of Acres
Assessed Value
Percentage of Assessed Value
Agricultural 6,313 35.8% $ 1,571,600 <0.1%
Agricultural Forest 1,006 5.7 1,945,800 <0.1
Commercial 1,933 11.0 523,394,000 21.5
Manufacturing 552 3.1 173,456,700 7.1
Other 105 0.6 8,553,500 0.4
Productive Forest 340 1.9 948,900 <0.1
Residential 5,215 29.6 1,655,733,500 68.1
Undeveloped 2,158 12.3 5,572,000 0.2
Subtotal 17,622 100.0 2,371,176,000 97.5
Personal Property N.A. N.A. 60,984,000 2.5
Total 17,622 100.0% $2,432,160,000 100.0%
Change in Agricultural Acres
Year Number of Acres
Change from Prior Year
2004 6,902 –
2005 6,830 (72)
2006 6,777 (53)
2007 6,660 (117)
2008 6,258 (402)

3-11
Size of Agricultural Parcels—Village of Germantown 422 Parcels
35 Acres or More 23 Parcels
1.5 Acres or Less 30 Parcels
1.6 to 4.9 Acres 59 Parcels
5 to 9.9 Acres 70 Parcels10 to 34.9 Acres
240 Parcels
Zoning of Agricultural Parcels—Village of Germantown
Agricultural 5,810.3 Acres
Residential314.9 Acres
Institutional49.7 Acres
Manufacturing 65.4 Acres
Commercial 72.4 Acres

3-12
City of Middleton
Acreage and Value of Taxable Property by Property Class 2009
Property Class Number of Acres
Percentage of Acres
Assessed Value
Percentage of Assessed Value
Agricultural 115 4.3% $ 30,100 <0.1%
Agricultural Forest 0 0.0 0 0.0
Commercial 1,141 42.6 960,514,800 36.2
Manufacturing 190 7.1 98,299,700 3.7
Other 4 0.1 440,400 <0.1
Productive Forest 0 0.0 0 0.0
Residential 1,230 45.9 1,468,028,100 55.3
Undeveloped 0 0.0 0 0.0
Subtotal 2,680 100.0 2,527,313,100 95.2
Personal Property N.A. N.A. 126,427,900 4.8
Total 2,680 100.0% $2,653,741,000 100.0%
Change in Agricultural Acres
Year Number of Acres
Change from Prior Year
2004 73 –
2005 30 (43)
2006 74 44
2007 105 31
2008 71 (34)

3-13
Size of Agricultural Parcels—City of Middleton 85 Parcels
1.5 Acres or Less 73 Parcels
10 to 34.9 Acres
4 Parcels
1.6 to 4.9 Acres 8 Parcels
Zoning of Agricultural Parcels—City of Middleton
Agricultural45.1 Acres
Planned Development53.8 Acres
Residential 15.8 Acres

3-14
City of Onalaska
Acreage and Value of Taxable Property by Property Class 2009
Property Class Number of Acres
Percentage of Acres
Assessed Value
Percentage of Assessed Value
Agricultural 283 6.9% $ 62,200 <0.1%
Agricultural Forest 0 0.0 0 0.0
Commercial 998 24.3 498,711,000 32.0
Manufacturing 59 1.4 10,482,300 0.7
Other 2 <0.1 120,600 <0.1
Productive Forest 298 7.2 653,800 <0.1
Residential 2,184 53.1 1,000,059,000 64.2
Undeveloped 290 7.0 811,600 0.1
Subtotal 4,114 100.0 1,510,900,500 97.0
Personal Property N.A. N.A. 47,028,700 3.0
Total 4,114 100.0% $1,557,929,200 100.0%
Change in Agricultural Acres
Year Number of Acres
Change from Prior Year
2004 352 –
2005 331 (21)
2006 349 18
2007 317 (32)
2008 284 (33)
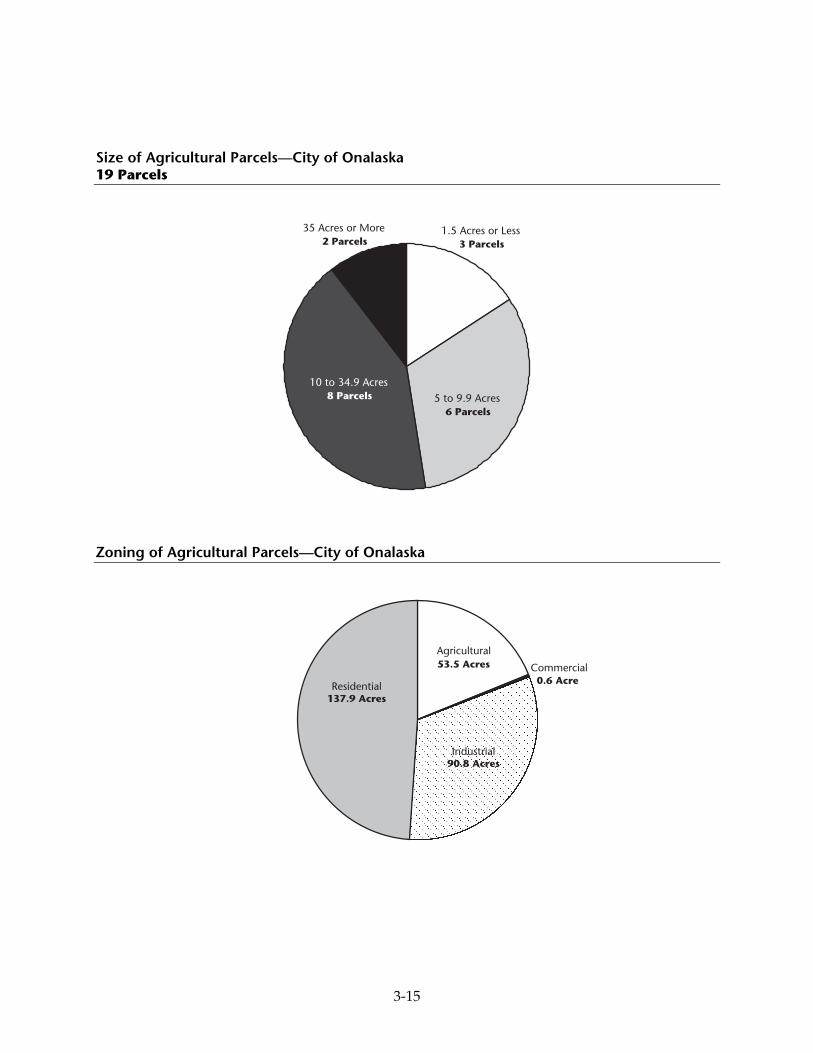
3-15
Size of Agricultural Parcels—City of Onalaska 19 Parcels
35 Acres or More 2 Parcels
1.5 Acres or Less 3 Parcels
5 to 9.9 Acres 6 Parcels
10 to 34.9 Acres 8 Parcels
Zoning of Agricultural Parcels—City of Onalaska
Industrial90.8 Acres
Commercial0.6 Acre
Agricultural 53.5 Acres
Residential137.9 Acres

3-16
Town of Perry
Acreage and Value of Taxable Property by Property Class 2009
Property Class Number of Acres
Percentage of Acres
Assessed Value
Percentage of Assessed Value
Agricultural 15,646 71.8% $ 3,211,800 3.9%
Agricultural Forest 3,346 15.3 8,305,800 10.0
Commercial 15 0.1 267,700 0.3
Manufacturing 0 0.0 0 0.0
Other 192 0.9 20,150,000 24.4
Productive Forest 130 0.6 643,100 0.8
Residential 602 2.7 45,634,500 55.2
Undeveloped 1,868 8.6 4,387,600 5.3
Subtotal 21,799 100.0 82,600,500 99.9
Personal Property N.A. N.A. 120,900 0.1
Total 21,799 100.0% $82,721,400 100.0%
Change in Agricultural Acres
Year Number of Acres
Change from Prior Year
2004 16,701 –
2005 16,583 (118)
2006 16,574 (9)
2007 16,544 (30)
2008 21,642 5,098
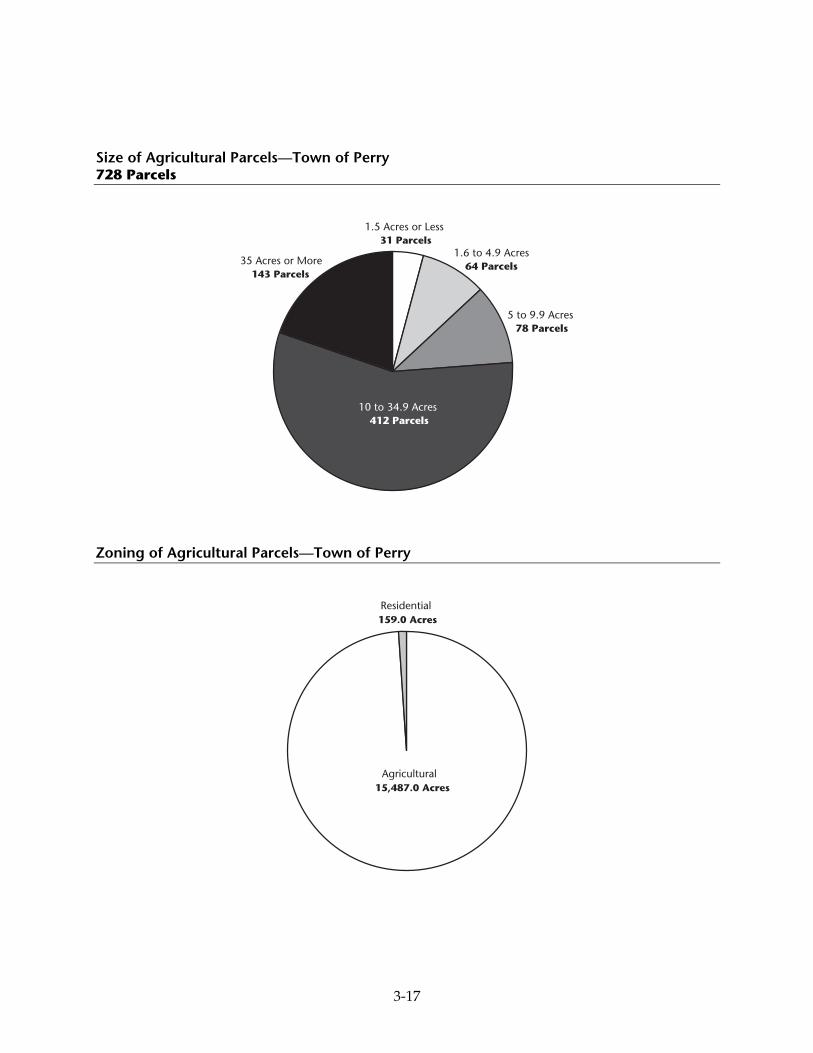
3-17
Size of Agricultural Parcels—Town of Perry 728 Parcels
10 to 34.9 Acres 412 Parcels
5 to 9.9 Acres 78 Parcels
1.6 to 4.9 Acres64 Parcels
1.5 Acres or Less 31 Parcels
35 Acres or More143 Parcels
Zoning of Agricultural Parcels—Town of Perry
Residential 159.0 Acres
Agricultural 15,487.0 Acres

3-18
City of Platteville
Acreage and Value of Taxable Property by Property Class 2009
Property Class Number of Acres
Percentage of Acres
Assessed Value
Percentage of Assessed Value
Agricultural 619 23.0% $ 178,600 <0.1%
Agricultural Forest 0 0.0 0 0.0
Commercial 251 9.3 199,808,800 35.8
Manufacturing 95 3.5 12,182,100 2.2
Other 4 0.2 187,900 <0.1
Productive Forest 10 0.4 39,900 <0.1
Residential 1,636 60.9 325,072,700 58.3
Undeveloped 73 2.7 203,500 <0.1
Subtotal 2,688 100.0 537,673,500 96.5
Personal Property N.A. N.A. 19,704,900 3.5
Total 2,688 100.0% $557,378,400 100.0%
Change in Agricultural Acres
Year Number of Acres
Change from Prior Year
2004 291 –
2005 291 0
2006 682 391
2007 564 (118)
2008 598 34

3-19
Size of Agricultural Parcels—City of Platteville 79 Parcels
10 to 34.9 Acres 21 Parcels
5 to 9.9 Acres 15 Parcels 1.6 to 4.9 Acres
15 Parcels
1.5 Acres or Less26 Parcels
35 Acres or More 2 Parcels
Zoning of Agricultural Parcels—City of Platteville
Residential 430.4 Acres
Manufacturing8.0 Acres
Commercial 181.0 Acres

3-20
City of Rice Lake
Acreage and Value of Taxable Property by Property Class 2009
Property Class Number of Acres
Percentage of Acres
Assessed Value
Percentage of Assessed Value
Agricultural 452 16.3% $ 91,700 <0.1%
Agricultural Forest 0 0.0 0 0.0
Commercial 827 29.8 227,230,300 41.5
Manufacturing 206 7.4 21,853,600 4.0
Other 8 0.3 244,000 <0.1
Productive Forest 57 2.1 96,200 <0.1
Residential 1,178 42.5 273,088,500 49.9
Undeveloped 44 1.6 55,800 <0.1
Subtotal 2,772 100.0 522,660,100 95.5
Personal Property N.A. N.A. 24,846,500 4.5
Total 2,772 100.0% $547,506,600 100.0%
Change in Agricultural Acres
Year Number of Acres
Change from Prior Year
2004 416 –
2005 453 37
2006 453 0
2007 450 (3)
2008 452 2
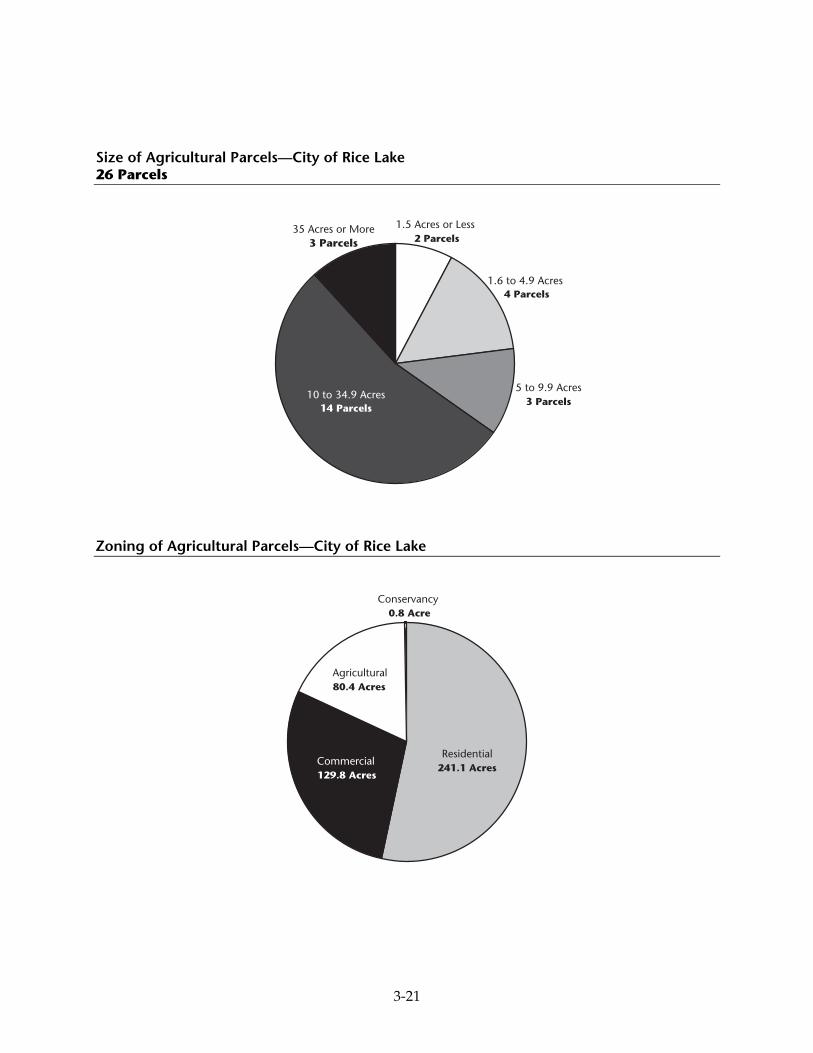
3-21
Size of Agricultural Parcels—City of Rice Lake 26 Parcels
10 to 34.9 Acres14 Parcels
5 to 9.9 Acres 3 Parcels
1.6 to 4.9 Acres 4 Parcels
1.5 Acres or Less 2 Parcels
35 Acres or More3 Parcels
Zoning of Agricultural Parcels—City of Rice Lake
Residential241.1 Acres
Conservancy 0.8 Acre
Agricultural 80.4 Acres
Commercial129.8 Acres

3-22
Village of Sturtevant
Acreage and Value of Taxable Property by Property Class 2009
Property Class Number of Acres
Percentage of Acres
Assessed Value
Percentage of Assessed Value
Agricultural 643 33.5% $ 133,400 <0.1%
Agricultural Forest 0 0.0 0 0.0
Commercial 477 24.8 136,559,800 25.6
Manufacturing 248 12.9 80,925,400 15.2
Other 42 2.2 1,774,600 0.3
Productive Forest 0 0.0 0 0.0
Residential 511 26.6 295,028,100 55.4
Undeveloped 0 0.0 0 0.0
Subtotal 1,921 100.0 514,421,300 96.5
Personal Property N.A. N.A. 18,516,600 3.5
Total 1,921 100.0% $532,937,900 100.0%
Change in Agricultural Acres
Year Number of Acres
Change from Prior Year
2004 133 –
2005 761 628
2006 761 0
2007 667 (94)
2008 666 (1)

3-23
Size of Agricultural Parcels—Village of Sturtevant 22 Parcels
10 to 34.9 Acres 12 Parcels
5 to 9.9 Acres 2 Parcels
35 Acres or More 8 Parcels
Zoning of Agricultural Parcels—Village of Sturtevant
Industrial 251.0 Acres
Commercial 59.2 Acres
Residential 332.5 Acres

3-24
City of Sun Prairie
Acreage and Value of Taxable Property by Property Class 2009
Property Class Number of Acres
Percentage of Acres
Assessed Value
Percentage of Assessed Value
Agricultural 809 18.2% $ 256,100 <0.1%
Agricultural Forest 0 0.0 0 0.0
Commercial 1,009 22.8 617,059,400 24.8
Manufacturing 164 3.7 48,960,400 2.0
Other 2 <0.1 221,600 <0.1
Productive Forest 0 0.0 0 0.0
Residential 2,387 53.8 1,766,738,300 71.1
Undeveloped 63 1.4 402,400 <0.1
Subtotal 4,434 100.0 2,433,638,200 97.9
Personal Property N.A. N.A. 52,701,300 2.1
Total 4,434 100.0% $2,486,339,500 100.0%
Change in Agricultural Acres
Year Number of Acres
Change from Prior Year
2004 1,011 –
2005 1,288 277
2006 818 (470)
2007 816 (2)
2008 664 (154)

3-25
Size of Agricultural Parcels—City of Sun Prairie 439 Parcels
5 to 9.9 Acres 2 Parcels
10 to 34.9 Acres 20 Parcels
35 Acres or More 5 Parcels
1.6 to 4.9 Acres 19 Parcels
1.5 Acres or Less 393 Parcels
Zoning of Agricultural Parcels—City of Sun Prairie
Agricultural 433.9 Acres
Residential 102.5 Acres
Suburban Office 59.5 Acres
Planned Development
181.1 Acres
Commercial 1.6 Acres
Industrial 30.2 Acres

3-26
Village of Twin Lakes
Acreage and Value of Taxable Property by Property Class 2009
Property Class Number of Acres
Percentage of Acres
Assessed Value
Percentage of Assessed Value
Agricultural 2,427 52.0% $ 630,000 <0.1%
Agricultural Forest 130 2.8 955,900 0.1
Commercial 278 6.0 62,370,800 7.4
Manufacturing 12 0.3 3,508,900 0.4
Other 37 0.8 2,362,800 0.3
Productive Forest 0 0.0 0 0.0
Residential 1,415 30.3 766,391,600 91.1
Undeveloped 368 7.9 348,200 <0.1
Subtotal 4,667 100.0 836,568,200 99.5
Personal Property N.A. N.A. 4,298,900 0.5
Total 4,667 100.0% $840,867,100 100.0%
Change in Agricultural Acres
Year Number of Acres
Change from Prior Year
2004 993 –
2005 1,016 23
2006 1,003 (13)
2007 2,419 1,416
2008 2,425 6
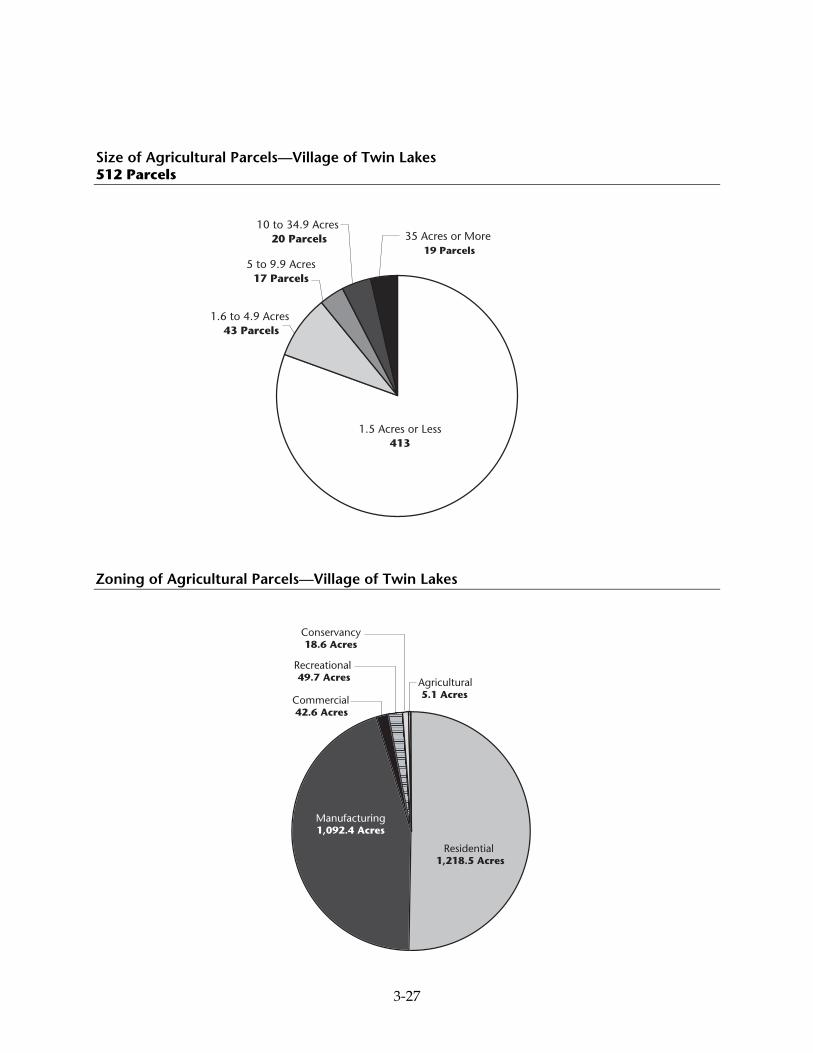
3-27
Size of Agricultural Parcels—Village of Twin Lakes 512 Parcels
1.5 Acres or Less413
1.6 to 4.9 Acres 43 Parcels
35 Acres or More 19 Parcels
10 to 34.9 Acres 20 Parcels
5 to 9.9 Acres17 Parcels
Zoning of Agricultural Parcels—Village of Twin Lakes
Residential 1,218.5 Acres
Conservancy18.6 Acres
Recreational 49.7 Acres
Commercial 42.6 Acres
Agricultural 5.1 Acres
Manufacturing1,092.4 Acres
3-28
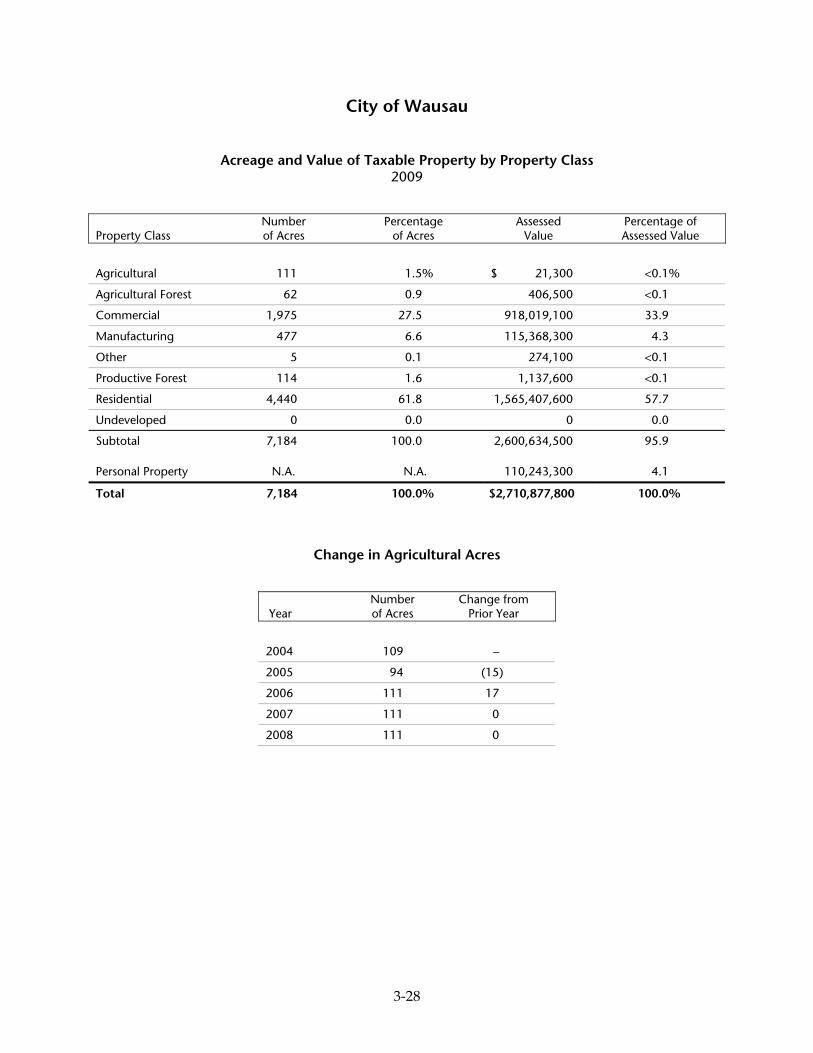
City of Wausau
Acreage and Value of Taxable Property by Property Class 2009
Property Class Number of Acres
Percentage of Acres
Assessed Value
Percentage of Assessed Value
Agricultural 111 1.5% $ 21,300 <0.1%
Agricultural Forest 62 0.9 406,500 <0.1
Commercial 1,975 27.5 918,019,100 33.9
Manufacturing 477 6.6 115,368,300 4.3
Other 5 0.1 274,100 <0.1
Productive Forest 114 1.6 1,137,600 <0.1
Residential 4,440 61.8 1,565,407,600 57.7
Undeveloped 0 0.0 0 0.0
Subtotal 7,184 100.0 2,600,634,500 95.9
Personal Property N.A. N.A. 110,243,300 4.1
Total 7,184 100.0% $2,710,877,800 100.0%
Change in Agricultural Acres
Year Number of Acres
Change from Prior Year
2004 109 –
2005 94 (15)
2006 111 17
2007 111 0
2008 111 0

3-29
Size of Agricultural Parcels—City of Wausau 9 Parcels
1.6 to 4.9 Acres 1 Parcel
5 to 9.9 Acres3 Parcels
10 to 34.9 Acres 5 Parcels
Zoning of Agricultural Parcels—City of Wausau
Residential 108.4 Acres
Commercial 2.3 Acres