Embed Size (px)
Citation preview

An Assessment of
Bilingual Education Programs for a
Large Texas School District
Sharon Leigh Wrobel
Daniel M. O’Brien
Political Economy Program
The University of Texas at Dallas
Prepared for the Association for Public Policy Analysis and Management
October 29-31, 1998
The authors wish to thank the Green Center for the Study of Science and Society which has providedresearch funding, John Kain for his guidance and example, and especially the District’s Research andEvaluation and Student Placement Center Personnel. Any errors and omissions are those of the authors.

2
Abstract
With the recent movements toward English Only and the passage of proposition 227 in
California, bilingual and other language minority programs have once again come to the
attention of policy makers and the public. A striking feature of this debate is the apparent
lack of appropriate and definitive measures of the success of these programs.
This study is the first step in establishing a baseline for assessing the effects of changes to
bilingual programs in a large Texas school district. The study traces the evolution of
programs in the district, and describes student language assessment tools and processes.
Individual student data from the district and from a state wide database are then used to
analyze factors which lead to students being assigned to bilingual, ESL or regular
classrooms in the first three grades. A preliminary assessment of the impact of these
programs on 4th and 5th grade reading scores shows that transition to regular classroom by
the end of third grade, and early native language reading skills make important
contributions to success in reading.
Further analyses using additional data from the district and more information on what
actually happens in bilingual and ESL classrooms are planned.

3
An Assessment of Bilingual Education Programs
for a Large Texas School District
In 1968 congress adopted Title VII of the Elementary and Secondary Education Act
(ESEA) as a response to high drop-out rates among Hispanic students in the southwest
(Donegan, 1996). Thirty years later there are an estimated 3.5 million students who are
identified as Limited English Proficient (LEP) (Rodriguez, 1996). Yet, there is still little
consensus or consistency concerning the goals, design, or effectiveness of programs for
the education of language minority students. Most policymakers do agree, however, that
bilingual education is not meeting expectations (Wildavsky, 1992).
A large Texas school district (District), has recently implemented a number of program
improvements for the education of Limited English Proficient students. One aspect of
this restructuring is to improve the monitoring and evaluation of LEP programs. The
District has partnered with the Texas Schools Project to conduct a comprehensive
evaluation of these program changes. The study has three principle components:
I. Documentation of the District’s past and current policies and practices forproviding educational services to LEP children.
II. An analysis of the operation of the District’s LEP programs from 1990 to1997 and the impact of these programs on the achievement of LEPchildren attending the District’s schools.
III. Development of methodologies and procedures to evaluate theeffectiveness of recent changes in the District’s LEP programs (Kain,1998a).
This paper represents the first steps to provide the baseline assessment necessary for a
meaningful evaluation of program reforms.
This evaluation is a one district-case study which uses historical and content analysis of
language minority programs in addition to a longitudinal cohort study of academic
achievement. We have been fortunate to have access to the Texas Schools Micro-Data
Panel (TSMP), the District’s database of Limited English Proficient students, as well as

4
extensive District program records. This paper will discuss how educational programs
for LEP students evolved in the district, what programs are currently available, and how
students are assigned to these programs. Finally, it will examine how assignment to these
programs in the first three grades affects academic achievement in the fourth and fifth
grades.
The District
The study examines efforts to educate Limited English Proficient (LEP) students in a
large urban school district in Texas (District). Current enrollment exceeds 75,000
students, of which more than twenty percent are identified as LEP. The District has 12
high school campuses, 20 middle school campuses, 61 elementary school campuses, and
seven special schools campuses. The district’s Total Operating Expenditures for the ‘98-
‘99 school year are more than $350,000,000, with an average per pupil expenditure of
about $5,000. There are nearly 4,300 teachers, which account for 50 percent of the total
staff.
The race/ethnic distribution of the district is 33.2% African American, 38.4% Hispanic,
25.9% White, 2.3% Asian/Pacific Islander, and 0.2% Native American. Nearly sixty
percent of the student population is identified as economically disadvantaged. For our
purposes, “economically disadvantaged” is defined as qualifying for free or reduced price
school meals. 11.6 percent of students are in Special Education, 18.4 percent are in
Career and Technology Education, 20.9 percent are in Bilingual/ESL programs and 7.9
percent are in Gifted and Talented Education.
History
The District’s first bilingual program, “Programa en Dos Lenguas,” was implemented in
the 1969 – 1970 school year. This program was a response to a realization of need as
well as the availability of federal funding through Title VII of the ESEA. At that time,
the district had nearly 7,000 Mexican-American students, an estimated 95 percent of
whom spoke Spanish as their primary language. Furthermore, increasing numbers of
non-English speakers were moving into the district to take advantage of job

5
opportunities. The district felt it was important to address the educational needs of these
students as well as preserve and protect the multi-cultural aspects of the community
(District, 1969).
The original program was implemented in seven elementary schools, and served only
students in Kindergarten and the first grade. Schools selected for the program had to
have a student body of fifty percent or more Mexican-Americans. Staffing for the
program varied on the basis of availability of bilingual teachers at the campus. However,
each classroom had at least one bilingual teacher or teacher’s aide. The program was
designed to provide English and Spanish instruction to all students in the classroom. The
specific goals of the original program were:
1) Develop a positive self-concept,
2) To produce an environment which promotes the development of twolanguages: English and Spanish (emphasis added),
3) To improve attendance and academic achievement, and
4) To promote parental involvement (District, 1973).
By 1973 –1974 school year, the program had been extended to eight schools and served
students from Pre-K through fifth grade (District, 1983).
In 1974, the United States Supreme Court unanimously decided in Lau v. Nichols that
placing Non-English speaking students in regular English classrooms was a violation of
section 601 of the Civil Rights Act of 1964. The court ruled that schools must provide
special assistance to language minority children in order to allow them to fully partake in
public education (Lau, 1974). In response to this ruling, the district submitted a “Lau
Plan” to the Office of Civil Rights (OCR). The district wide plan was approved for
implementation in 1978. The key programs in the plan were:
• Bilingual Education – State Program K-5
• English for Speakers of Other Languages (ESOL) K-12
• Modified Bilingual Education 6-12(District, 1983:2).

6
The ESEA Title VII K-3 programs begun in the 69-70 school year ran concurrently with
the programs established under the Lau decision. While the original ESEA grant had
expired in 1975, the programs were continued. The ESEA grant was reissued for 1981
through 1983.
The availability of Federal funds and the requirements under the Lau decision were not
the only factors driving the expansion of LEP programs. Demographic shifts in the
district also required that it focus more attention on language minority students. Between
1971 and 1982, the district experienced a nearly twenty percent drop in overall
enrollment. At the same time, Hispanic enrollment almost doubled, from ten percent to
twenty percent of the student population (District, 1983). To further complicate matters,
these new students were more transient and from lower income families. These students
also tended to score below the norm on standardized tests.
In an attempt to serve this changing population, the District developed new strategies for
their education. First, in 1979, the District started its English as a Second Language
program (ESL) (District, 1984). In 1982, the Language Center program designed
primarily for Middle and High School refugees and migrants, was implemented (District,
1983).
Perhaps more interesting than the addition of new programs in the district are the
dramatic changes in program goals. While the original program focussed on fluency in
both English and their home language, the ultimate goal of the newer programs was
academic achievement in an all English curriculum. While other goals, such as cultural
awareness and pride, are also included, they are clearly secondary to fluency and
achievement in English (District, 1983). Program objectives changed from preserving
and improving “ the child’s self image, his appetite for learning and his joy in school life
by moving very slowly from English to… Spanish” (District, 1969:1), to “implement
programs that meet or exceed state and local requirements (District, 1994:ii).

7
Presently, the District is in the process of implementing a number of policy changes
regarding its LEP programs. The District conducted an evaluation of its LEP programs in
1997 and found that neither the goals for English proficiency nor academic achievement
were being met satisfactorily. The changes are designed to move students from LEP to
non-LEP more quickly than in the past. Students placed in a bilingual program in Pre-K
or Kindergarten will be expected to transition into the regular English program before the
fourth grade. LEP students in other programs or who enter the district later will be
expected to transition to non-LEP within six years. To make this possible, the District is
implementing a number of policy changes. These include changes in curriculum, student
classroom assignment, and assessment, as well as staff development programs and
incentives (District, 1998).
Placement
Twenty-one percent of the student population is identified as Limited English Proficient
(LEP), and 86 percent of these speak Spanish. Students are selected for LEP testing
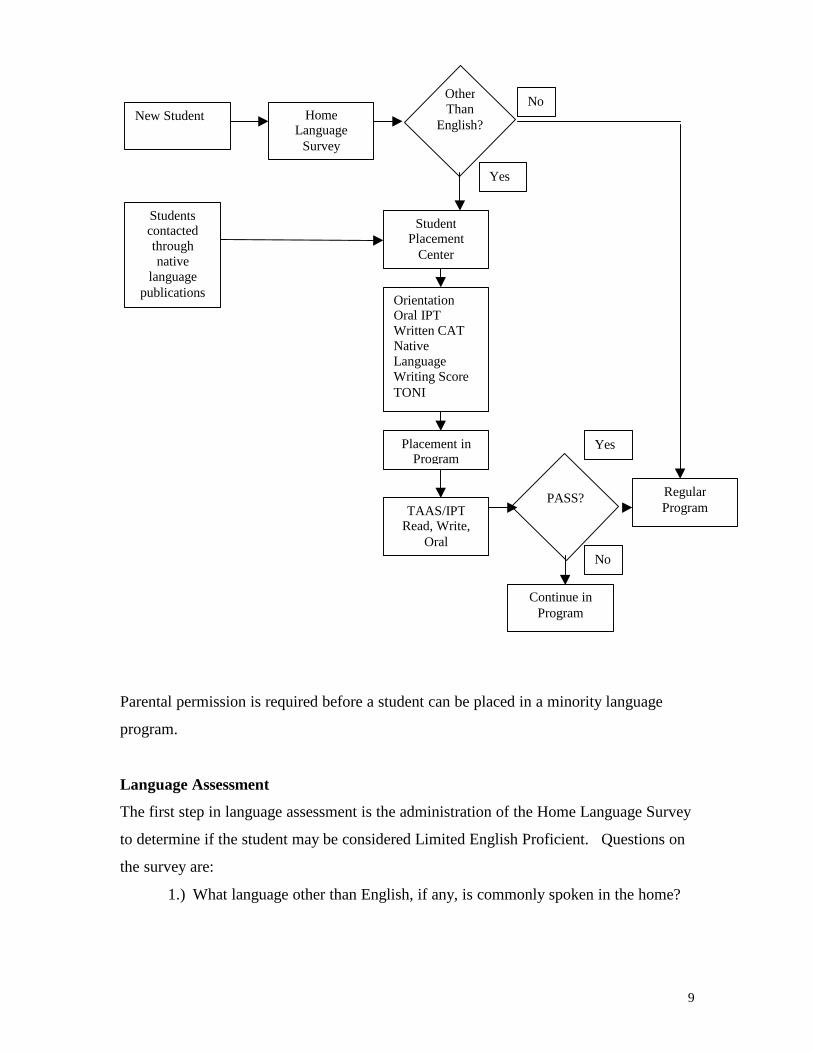
based on their responses to the district’s Home Language Survey. If a language other
than English is indicated in at least one of the six questions, the student is sent to the
Student Placement Center to be tested for English proficiency.
The Placement Center tests about 2,100 new students each year, as well as periodically
re-testing current students. The district administers the Oral IPT test, a written California
Achievement Test (CAT), a native language writing test, and a Test of Non-verbal
Intelligence (TONI) for Special Education. Pre-literate students are also given the
Student Oral Language Observation Matrix (SOLOM) test. Descriptions of the
Language Proficiency tests are given in the next section.
To accommodate these students, the Placement Center employs 11 full time and 25-45
part time employees. In addition, Catholic Charities and World Relief provide volunteers
to administer tests to students who speak languages other than those that the regular staff
can handle. Those students who are determined to be LEP are then considered for special
language instruction. Once parental permission is received, the LEP student is placed in

8
one of the six language programs that the district provides. Program placement is
determined by grade, need, and availability of programs at the student’s assigned campus.
9
Parental permission is required before a student can be placed in a minority language
program.
Language Assessment
The first step in language assessment is the administration of the Home Language Survey
to determine if the student may be considered Limited English Proficient. Questions on
the survey are:
1.) What language other than English, if any, is commonly spoken in the home?
HomeLanguage
Survey
StudentPlacement
Center
OrientationOral IPTWritten CATNativeLanguageWriting ScoreTONI
Placement inProgram
TAAS/IPTRead, Write,
Oral
RegularProgram
Continue inProgram
PASS?
OtherThan
English?New Student
No
Yes
Yes
No
Studentscontactedthroughnative
languagepublications
10
2.) Does the student speak or understand a language other than English? If yes,write the name of the language.
3.) What is the first language the student learned to speak?
4.) Does the student live with someone who commonly speaks a language otherthan English? If yes, write the name of the language.
5.) What language does the student speak most of the time?
6.) If a language other than English is indicated on any one of the abovequestions, does the parent or guardian need to communicate with the school ina language other than English? If yes, write the name of the language.
The survey is printed in English, Spanish, and Vietnamese. If necessary, the survey will
be given orally in the parent’s native language. If any of these questions are answered
with a language other than English, the student will be tested for English Language
Proficiency. Rossell (1998) expresses concern that a survey such as this may potentially
identify a student as LEP, even if English is the primary, or sole, language. However, the
survey merely flags the student for English proficiency assessment. Any assignment
recommendation is based on the results of that assessment.
There are a number of tests utilized to determine language proficiency. These tests are
given to determine student placement, as well as program reclassification. Currently, the
District uses the IDEA Language Proficiency Tests (IPT). These tests are divided by
age/grade level and test syntax, morphological structure, lexical items, phonological
structure, comprehension, and oral production (ERIC, 1998). Children aged three
through five are given the Pre-IPT. The child’s score is then compared to a “level
summary” to determine the child’s language ability. School-aged children are given
either the IPT-1 (Kindergarten through 6), or the IPT-2 (7 – 12). These tests designate
students as Non, Limited, or Fluent English Speakers. In addition to these tests, students
may be given Reading and/or Writing IPT’s, particularly for reclassification purposes.
Spanish versions of these tests (IPTI, IPTII) may be given to Non-English Speakers.
Prior to implementing the IPT tests, the District used the Language Assessment Scales
(LAS). Like the IPT, the LAS has three levels: Level 1(grades 2-3), Level 2 (grades 4-6),

11
and Level 3 ( grades 7-12). The Writing and Reading (LAS R/W)versions of the test use
multiple choice, true/false, and open ended questions to determine if the student is a Non,
Limited, or Competent Writer/Reader. The oral version of the test (LAS-O) classifies
students as Non, Limited, or Fluent English Speakers (ERIC,1998). It is important to
note that both the LAS and the IPT tests have been criticized for overidentifying students
as being LEP. Particularly, the tests cannot differentiate between substantive knowledge
and language skill (Rossell, 1998). However, at least in the case of Spanish speakers, a
native language assessment is also given. This should help us discern between language
skills and general knowledge.
In some cases, the student may be identified as preliterate, and thus given the Student
Oral Language Observation Matrix (SOLOM). This “informal, unstandardized rating
tool” is used to determine the student’s comprehension, fluency, vocabulary,
pronunciation, and grammar. Scores for this test range from 5 – 25 (ERIC, 1998). This
test is highly subject to the test administrator, thus student scores are possibly
incomparable.
The Programs
According to the district’s 1998 Program Manual, there are four elementary and four
secondary English language programs for LEP students. While there is some degree of
progression through these programs, students do not necessarily transition from one
program to the next. Their program assignment is determined by availability of programs
and teachers, individual academic strength, and English proficiency at initial enrollment
as well as previous program assignment. A brief description of the programs currently
offered by the District follows.
Full Bilingual- The full bilingual is a beginning level program designed for students in
grades Pre-K through 3. The students are generally new arrivals and are monolingual
Spanish speakers. Instruction moves from predominantly Spanish language instruction in
the early grades, to predominantly English by the end of the third grade. Art, music, and
physical education classes are take with students in the regular program. Currently, 21

12
elementary schools offer the Full Bilingual Program. Students exit the program at the
end of the third grade, when they transition into an ESL-Only program. Students in the
Full Bilingual program do not take the third grade TAAS, therefore are not eligible for
reclassification to non-LEP. They must wait until they are tested in the fourth grade.
Modified Bilingual - This program is designed to accommodate Pre-K – 3rd grade
students who predominantly speak English, but speak Spanish as well. The students are
instructed almost exclusively in English, but using ESL techniques. They are also
provided with one hour per day of Spanish language enrichment instruction. Modified
Bilingual students are assigned to separate classrooms or clustered in regular program
classrooms. The goal of this program is to achieve Full English Proficiency. Students do
take the third grade TAAS, and are therefore eligible for reclassification at the end of that
year. To exit the program, students must pass the reading and writing portions of the
TAAS test. In addition, the student must achieve a score of “competent writer” on the
IPT-Writing test and either “fluency” or “mastery” on the IPT-Oral test.
Elementary Language Center – Designed for recent immigrants, this program includes
students in grades three through five who are non-English speaking. These centers are
only available in eight schools, but transportation is provided for students originally
assigned to other campuses but who wish to participate in the program. The instruction
for the centers utilizes ESL techniques, but is more sheltered than the Full Bilingual
program. When possible, the students take art, music and physical education with
English speakers. Students generally remain in the program for two to three years.
Students exit the Language Center Program on the recommendation of the teacher and
the Language Proficiency Assessment Committee (LPAC).
ESL-Only Program – this program serves limited English speakers in grades Pre-K
through five who are generally more advanced in English than students in the other
elementary programs. There are three instructional designs: Homeroom, Team
Teaching, and ESL Pull-Out. In the Homeroom design, significant clusters of LEP
students are assigned to a classroom where the teacher utilizes ESL techniques in all
13
subjects. In team Teaching, students are similarly assigned, but there is one regular
teacher and one ESL teacher who collaborate on instruction. Students in the Pull-Out
design are given separate ESL instruction that is comparable in time and content to the
language arts instruction given to students in the Regular Program. To exit the program,
students must pass the reading and writing portions of the TAAS test as well as achieve a
score of “competent writer” on the IPT-Writing test and either “fluency” or “mastery” on
the IPT-Oral test.
Language Center Programs - Language Center programs are beginning to intermediate
ESL for grades six through twelve. They are designed for Non-English Speakers who are
typically literate in their home language and have been in the U.S. for less than three
years. There are 15 campuses that currently offer Language Center Programs. Beginners
are generally enrolled in the “full program,” meaning they take 5 to 6 ESL classes. More
advanced students are enrolled in a “partial program,” where they take only 1 or 2 ESL
classes. Students are assigned to groups based on English proficiency, and take their
core classes (ESL, math, social studies and science) with their group. Art, music,
physical education and electives are taken with mainstream students. The LPAC
determines whether the student will move to Transitional ESL or into the regular
program.
Transitional ESL Programs - Transitional ESL is intended for more advanced immigrant
students who have exited beginning-intermediate programs, as well as U.S. natives who
speak English but have not reached academic standards. These programs are available at
all Middle and High School campuses. Students attend Transitional ESL classes in
addition to regular program classes. The program design of Transitional ESL depends on
student needs and campus resources. Students in grades 6 through 10 may be placed in
an all-LEP group for their ESL and Reading classes, or they may be clustered by grade
level into mainstream classes. Since students can only replace two high school English
course requirements with ESL classes, students who have not reached proficiency by
their junior year must take Transitional ESL as well as regular English. To exit the
program, students must pass the reading and writing portions of the TAAS and/or

14
Pass the Oral-IPT with a score of Fluency or Mastery.
International Newcomer Academy - The International Newcomer Academy is a special
campus for recent immigrants in grades 6 through 12. The program runs year round, and
supplements English language instruction with U.S. culture and native language (Spanish
and Vietnamese) literacy classes. Students attend the INA for one year, then transfer to a
Language Center Program in their home school. Only students living within five
specified attendance zones are eligible to attend. Students must exit the academy after
one year. Students who are in grades 6 through 8 and have been identified as being
preliterate or undereducated may remain for two years.
Newcomer Career Academy - The Newcomer Career Academy is located on the district’s
Technical High School campus and is designed for immigrant students grades 9 through
12 with limited educational backgrounds. The NCA teaches English Language as well as
native language literacy and occupational skills. Any 9th through 12th grade student in
the district may attend NCA upon approval by the Student Placement Center. Students
exit the program through graduation.
The term Regular Program refers to instruction that makes no special accommodation for
language minority students. In the past this may have been referred to as the
“mainstream” program. For the purposes of this study, Full Bilingual and Modified
Bilingual are simply referred to as bilingual, and ESL-Only, and Transition ESL.
Language Center Program refers to the secondary program only.
Data and Sample Selection
Having defined the program availability and assignment, the next step is to determine
how well these programs work. More specifically, how do these programs compare with
one another and with the Regular Program. This will be done by looking at students’
performance on standardized tests. For this study, we will use results on the Texas
Assessment of Academic Skills (TAAS). This test is a state wide, criterion-referenced
test which is based on the state-mandated curriculum. The TAAS, which has been

15
administered since 1990, is used by the Texas Education Agency to measure student
performance and to assess district accountability (TEA, 1996). It is therefore an
appropriate measure for an assessment of the District’s LEP programs.
Data for the analysis comes from two sources. The Texas Schools Microdata Panel
(TSMP) has been assembled by John Kain (Kain 1998) over the past five years. TSMP
includes up to eight years of panel data for more than two million students and more than
350,000 teachers, as well as extensive data for nearly 6,000 campuses and more than
1,000 districts for the same eight year period. Beginning with the 1989-90 school year,
five cohorts of students are included. Following the convention that the 1989-90 school
year is called 1990, the youngest of these cohorts were in pre-K and the oldest in the 3rd
grade in 1990. The data base starts with 1990 because the Texas Education Agency
(TEA) implemented its Public Education Information Management System (PEIMS) in
that year. In all, the TSMP has more than 80,000,000 records, many with more than 100
variables.
TSMP also contains 21 years/grades of standardized test data for the Texas Assessment
of Academic Skills (TAAS) tests administered by TEA during this period. This criterion
referenced test is given to students in grades 3 through 8. An Exit Level TAAS test, first
administered in grade 10, must be passed in order for students to graduate from high
school. Appendix A is a brief description of the Texas Schools Project and the TSMP.
The District is working with the Green Center for the Study of Science and Society at the
University of Texas at Dallas to assess the effects of recent changes to District bilingual
and ESL programs. The District has collected and shared information for students who
qualified to be tested for limited English proficiency (LEP) for the past 8 years. This data
base includes oral English proficiency test date, test type and score, native language
proficiency test type and score, program assignment/participation, home language,
country of origin, and limited demographic information for each LEP student. The
District data has been combined with data for the TSMP, to form an enhanced data base
which is used for the analyses presented in this paper.

16
Table 1 presents the sample which is the result of merging of District data and the TSMP.
Mirroring the structure of the TSMP, there are five grades in each school year, beginning
with Pre-K through 3rd grade in 1989-90. The five cohorts, running diagonally from

17
Grade Pre-K K 1 2 3 4 5 6 7 8 9 10Year
1990 Bilingual 503 765 1,020 852 638ESL 5 24 69 95 64Reg. Classroom 0 0 0 0 0Total LEP 508 789 1,089 947 702Non-LEP 1,519 4,756 4,970 4,392 4,406Total Students 2,027 5,545 6,059 5,339 5,108
1991 Bilingual 113 784 891 686 555ESL 2 27 37 45 28Reg. Classroom 0 0 0 0 0Total LEP 115 811 928 731 583Non-LEP 5,744 5,257 4,781 4,485 4,422Total Students 5,859 6,068 5,709 5,216 5,005
1992 Bilingual 646 526 518 406 278ESL 421 346 234 233 206Reg. Classroom 73 63 91 77 56Total LEP 1,140 935 843 716 540Non-LEP 4963 4,731 4,524 4,406 4,300Total Students 6,103 5,666 5,367 5,122 4,840
1993 Bilingual 630 554 446 377ESL 438 282 295 246 481Reg. Classroom 119 87 85 101 151Total LEP 1,187 923 826 724 632Non-LEP 4,491 4,407 4,280 4,314 4,269Total Students 5,678 5,330 5,106 5,038 4,901
1994 Bilingual 624 467 423 1 0ESL 485 314 314 661 562Reg. Classroom 0 0 0 0 0Total LEP 1,109 781 737 662 562Non-LEP 4,257 4,263 4,182 4,212 4,170Total Students 5,366 5,044 4,919 4,874 4,732
1995 Bilingual 687 491 3 1 0ESL 423 306 780 665 595Reg. Classroom 0 0 0 0 0Total LEP 1,110 797 783 666 595Non-LEP 3,917 4,001 3,955 4,034 3,909Total Students 5,027 4,798 4,738 4,700 4,504
1996 Bilingual 461 12 1 0 1ESL 495 738 717 618 866Reg. Classroom 0 0 0 0 0Total LEP 956 750 718 618 867Non-LEP 3,812 3,904 3,996 3,897 4,969Total Students 4,768 4,654 4,714 4,515 5,836
1997 Bilingual 11 3 2 0 0ESL 938 868 764 956 598Reg. Classroom 0 0 0 0 0Total LEP 949 871 766 956 598Non-LEP 3,689 3,826 3,819 4,849 3,668Total Students 4,638 4,697 4,585 5,805 4,266
Total Bilingual 503 878 2,450 2,899 3,020 2,561 2,030 27 5 2 1 0ESL 5 26 517 916 1,110 1,293 1,567 3,598 2,812 1,977 1,822 598Reg. Classroom 0 0 73 182 178 162 157 151 0 0 0 0Total LEP 508 904 3,040 3,997 4,308 4,016 3,754 3,776 2,817 1,979 1,823 598Non-LEP 1,519 10,500 15,190 18,395 22,079 21,288 20,609 20,029 16,026 11,625 9,818 3,668Total Students 2,027 11,404 18,230 22,392 26,387 25,304 24,363 23,805 18,843 13,604 11,641 4,266
Table 1: Students Attending District, 1990-1997Program Assignment by Grade and Year

18
upper left to lower right, are in grades Pre-K through 6, K through 7, 1 through 8, 2
through 9, and 3 through 10. Looking at the chart vertically, there is only one year/grade
of data for Pre-K and 10th grade, two years for K and 9th grade, three years for 1st and 8th
grade, four years for 2nd and 9th grade, and five years for the 3rd, 4th, 5th and 6th grades.
The table shows the number of students in each grade/year who are identified as LEP,
and whether the student was in a Bilingual, ESL, or Regular Classroom.1 The proportion
of LEP students in a single grade year ranges from 24.6% in Pre-K during 1990 to a low
of 3.0% in Kindergarten during 19912. Considering grades 1 through 9 for the whole
sample, the range is 9.9% to 18.3%. The percent LEP trends downward from 15.3% in
1st grade to 11.7% in 10th grade indicating that some students are reclassified as English
proficient during the elementary grades. Looking at the center cohort (Cohort 3), the
percent of LEP students also trends downward from 16.7% in 1st grade, 1990 to 12.8% in
8th grade, 1997. This may be due to both reclassification and students who drop out of
the sample by moving to other Districts, out of state, or dropping out of school.
Program Assignment
As students progress from 1st through 10th grade, they are increasingly moved from
bilingual to ESL programs. For the students in Cohort 3, 83% of the LEP students are
assigned to bilingual programs in 1st grade. There is a steady switch to ESL instruction
through the 5th grade. From the 6th through the 10th grade, all LEP students are
classified as receiving instruction in ESL or in the Regular Program. There are similar
rates of program assignment for students in each of the five Cohorts. Program
assignment appears to be almost exclusively based on grade level.
1 Table 1 and Figure 1 are based on information reported to the Texas Education Agency by the District andstored on the TEA Public Education Information Management System, PEIMS. More detailed programassignment will be presented later based on the District student information data base.2 Pre-K is a Title I program. As many LEP students are also economically disadvantaged, they tend to beover represented in these programs.

19
Figure 2: District Program Assignment by Grade
0
10
20
30
40
50
60
70
80
90
Transitional ESL 0 0 0 0 0 0 1 50 48 49 48 52
ESL 18 22 25 27 27 28 29 1 0 0 0 0
Lang. Center 0 0 0 0 0 0 0 15 21 21 27 26
Bilingual 66 57 56 54 52 47 40 1 1 0 0 0
PK K 1 2 3 4 5 6 7 8 9 10
Information from the District student data base provides more detailed program
assignment. Figure 1 shows student assignment by grade. For this analysis, the programs
described earlier are grouped into five distinct categories during each year, Bilingual
(includes full and modified), Language Center, ESL, Regular Classroom, and
Transitional Bilingual. These designations help to explain the shift from Bilingual to
ESL between the 5th and 6th grade. Students in both the Bilingual and ESL programs
through grade 5 are assigned to transitional ESL programs in grade 6. LEP students
entering the District in grade 6, and those who require more native language assistance
than is available in the transitional ESL environment, are assigned to one of the 15
language centers.

20
Program assignment depends on several factors; the student’s English language
proficiency, native language proficiency, availability of a Bilingual program at the
campus to which the student is assigned, parental permission denying involvement in a
bilingual program, and student characteristics. In order to estimate the effect of each of
these factors, a series of PROBIT models were estimated.3 In each case, the dependent
variable is whether the student was assigned to Bilingual, ESL or Regular Classroom
during the year. Table 2 displays the coefficients and asymptotic z scores for each
variable included in these estimates for grades 1-3.
The English oral proficiency and native language oral proficiency of each LEP student
are assessed by personnel at the placement center or, occasionally, by a classroom
teacher. A grade of 0, indicating no proficiency through 6, indicating mastery of the
language, is assigned. The tests described earlier, LAS and one of three versions of the
IPT, are used. The native language proficiency test may be seen as an indicator of the
student’s pre-school preparation to learn. The estimates indicate that English and native
language proficiency play a major role in program assignment.
Students with greater English language proficiency and lower native language skills are
more likely to be assigned to a Regular Classroom. Five of the six coefficients are
statistically significant. The sign of the English proficiency variable is positive and that
of the Native Language variable negative for each of the grades.
All six of the oral proficiency test score coefficients are statistically significant for
estimates of assignment to Bilingual programs. For each grade the signs for both tests are
consistent. Higher English proficient students are less likely to be assigned to a Bilingual
program. Students with higher Native Language scores are less likely to be assigned to a
Bilingual program.
3 We also estimated multinomial logit models for program assignment. These reflected similar relativerisks of program assignment and levels of significance as the probabilities in the PROBIT models. Theestimates are available from the authors.

21
Grade 1coef. z score coef. z score coef. z score
English Proficiency -0.19 -8.6 -0.04 -1.5 0.29 11.7Native Language 0.07 4.0 0.00 0.1 -0.09 -3.9# of LEP Students 1.28 18.2 -1.24 -17.7 -0.20 -2.6Parental Permission -0.86 -4.2 1.69 8.5Gender -0.03 -0.5 0.02 0.3 0.04 0.5Age -0.06 -1.2 0.11 1.9 -0.07 -1.2Free/Reduced Lunch 0.35 1.1 -0.02 -0.1 -0.24 -0.8Special Education -0.27 -3.3 0.14 1.7 -0.10 -1.1Constant -0.41 -0.8 -0.68 -1.3 -0.39 -0.7
N 2,016 1,967 2,016Pseudo R2 0.19 0.16 0.14
Grade 2English Proficiency -0.20 -10.1 -0.04 -1.9 0.33 14.9Native Language 0.08 4.8 -0.06 -3.4 -0.01 -0.6# of LEP Students 1.30 21.2 -1.22 -20.4 -0.25 -3.7Parental Permission -1.13 -7.6 -1.51 -6.4 1.92 14.0Gender 0.05 1.0 -0.02 -0.3 -0.04 -0.6Age 0.04 0.9 0.07 1.5 -0.17 -3.2Free/Reduced Lunch 0.15 0.5 0.09 0.3 -0.14 -0.5Special Education -0.29 -4.1 0.04 0.5 0.01 0.2Constant -1.09 -2.3 -0.25 -0.5 0.04 0.1
N 2,770 2,770 2,770Pseudo R2 0.20 0.16 0.21
Grade 3English Proficiency -0.18 -10.0 -0.07 -3.6 0.31 16.0Native Language 0.08 5.3 -0.03 -1.9 -0.06 -3.3# of LEP Students 1.36 25.3 -1.17 -22.4 -0.39 -6.7Parental Permission -1.75 -9.6 -0.94 -4.8 1.91 13.6Gender 0.07 1.4 -0.02 -0.4 -0.05 -0.9Age 0.05 1.3 0.00 0.1 -0.08 -1.7Free/Reduced Lunch -0.12 -0.5 0.12 0.5 0.02 0.1Special Education -0.19 -2.9 0.04 0.5 -0.16 -2.1Constant -1.09 -2.6 0.15 0.3 -0.42 -0.9
N 3,414 3,414 3,414Pseudo R2 0.22 0.15 0.18
Table 2: Probit Estimates of Program AssignmentGrades 1-3
Bilingual ESL Regular Program

22
For ESL programs, the results are less clear. The English Proficiency coefficient is
consistently negative, but statistically significant at the .05 level for only the 3rd grade,
and at the .10 level for the 2nd grade, weak evidence that English proficiency effects
assignment to ESL programs. The Native Language coefficient is negative in 2nd and 3rd
grades, statistically significant at the .05 level in 2nd grade and at the .10 level in 3rd
grade, but insignificant for the 1st grade. Assignment to ESL programs is less dependent
on test scores, although lower English proficiency and native language proficiency appear
to matter more in the higher grades.
Assignment to a Bilingual program may depend on the availability of the program at the
student’s neighborhood school or the ability to transport the student to a school where the
program is available. The number of LEP students at the campus in the student’s grade is
used as an indicator of whether Bilingual instruction is offered at the student’s assigned
campus and grade.4 This variable is statistically significant for assignment to each
program in each grade. Students are much more likely to be assigned to a Bilingual
program if it is available, are much less likely to be assigned to ESL, and are less likely to
be assigned to a Regular Classroom.
Texas law requires that parents of LEP children are given the opportunity to refuse to
allow their children to participate in Bilingual programs. Parental Permission takes on a
value of one if parents refuse such participation and zero otherwise. With the exception
of ESL program assignment for 1st grade students, where no parents refused participation,
the coefficients are significant, and signs consistent for each grade. Parental Permission
has a negative impact on both Bilingual and ESL program assignment and a positive
impact on Regular Classroom assignment.
4 According to District administrative guidelines, Bilingual programs are offered if there are more than 100LEP students attending a school, while ESL classrooms are provided if there are more than 50 LEPstudents. A number of proxies were used to measure program availability including the number ofBilingual students and the number of Bilingual teachers at the campus and grade. Each produces similarresults to those for the proxy used in the regressions.

23
Four variables represent the student’s individual characteristics; age during the school
year, gender, whether the student is eligible for free or reduced rate lunch, and whether
the student requires special education resources. Of the 36 coefficients estimated for the
four variables, three grades and three programs assignments, only four special education
coefficients and one age coefficient are statistically significant. The impact of special
education is negative for all three grades for assignment to Bilingual programs, and in 3rd
grade for assignment to Regular classroom instruction. Although Special Education is
not significant for assignment to ESL programs, it is interesting to note its positive sign.
Combined with the negative and statistically significant values for Bilingual program
assignment, this indicates that special education students are more likely to be assigned to
ESL than Bilingual programs. Age has a negative effect on assignment to Regular
Classroom. Only in the 2nd grade is this coefficient statistically significant.
In summary, these estimates indicate that program assignment is influenced by English
proficiency, Native Language proficiency, program availability, parental permission and
by special education status. It appears that Bilingual programs receive students with
higher native language proficiency and fewer special education students than do ESL
programs or immersion in regular classrooms. Age, gender and economic status do not
exert a consistent or large effect on program assignment.
Results of Program Participation
The legislated goal of Bilingual and ESL programs in Texas is to prepare students for
learning English and participating in regular classroom instruction. There are, of course,
many other goals attributed to these programs, including exposure to historical and
cultural legacies and retention of fluency in the student’s native language while acquiring
English fluency. These and other objectives are difficult to measure. We can, however,
measure success in English language proficiency and progress in cognitive skills by
examining results on the state wide Texas Assessment of Academic Skills (TAAS) tests
administered to students beginning in the 3rd grade.

24
For this analysis we examine how well students who participated in different
combinations of programs in the first three grades perform on TAAS tests in grade 4 and
in grade 5. Because TAAS is used as a measure of school success in the state wide
accountability system, the Texas Education Agency allows school districts to exempt
LEP students from taking the test for up to three consecutive years. Of the 1,637 students
in the 4th grade regression, 1,131 (69.1%) had valid TAAS reading scores. For the 5th
grade regressions, 1,346 of 1,595 (84.3%) had valid TAAS reading scores. This sample
selection means that measures of program success based on regression analysis would be
biased and inconsistent due to the exclusion of lower scoring students. We use a
Heckman correction which first estimates a selection equation then adjusts the regression
results to account for the impact of the missing test scores.5
coef. z score coef. z score coef. z score coef. z scoreGender -0.08 -2.4 -0.07 -2.0 -0.09 -3.4 -0.09 -3.1Age -0.05 -1.7 -0.03 -1.0 -0.06 -2.6 -0.05 -1.7Free/Reduced Lunch -0.28 -2.1 -0.40 -2.3 -0.23 -1.9 -0.30 -1.8Special Education -0.44 -6.6 -0.38 -5.2 -0.23 -4.5 -0.17 -2.9
EEE 0.15 3.4 0.11 2.2 0.13 3.7 0.12 2.9RRR 0.24 4.3 0.25 3.8 0.26 5.3 0.24 4.3BBE 0.22 3.5 0.25 3.6 0.13 2.4 0.16 2.8EEB 0.05 0.5 0.12 1.1 0.01 0.2 0.06 0.6BBR 0.22 2.4 0.20 2.0 0.29 3.3 0.35 3.6EER 0.18 1.5 0.12 0.8 0.26 2.5 0.25 1.9
English Proficiency 0.00 0.1 0.00 0.3Language Proficiency 0.03 2.6 0.02 2.1
Constant 1.01 3.0 0.79 2.1 1.20 4.0 1.02 3.0
N 1,637 1,508 1,595 1,412Chi-squared 194.3 211.3 238.5 225.6
5th Grade4th Grade
Table 3: Effect of Program Assignment in Grades 1-3 on TAAS ScoreWith Heckman Correction
No Early Tests With Early Tests No Early Tests With Early Tests
5 See, for example, the discussion of the selection problem in Greene (1997):978-982. The specific

25
The selection equations are shown in Appendix B, Table B-1. These included factors
which may influence the decision to test individual students including campus/grade
percent LEP, percent special education and percent assigned to Bilingual, ESL and
Regular Classroom as well as an indicator of whether the student took the prior year’s
test.
Estimates of the impact of the most commonly assigned 1st through 3rd grade programs
are shown in Table 3. Two sets of equations are estimated for each grade. The first
includes four individual characteristics and seven program combinations. The second
equation includes the initial assessments of students’ English and native language
proficiency.
Individual characteristics are gender, age, eligibility for free or reduced rate lunch, and
classification as requiring special education resources. The signs of all of the coefficients
are negative. Gender is significant in each equation; boys have lower reading skills than
girls, holding the other variables constant. Age is significant in only the 5th grade, and
becomes insignificant when the early test results are included. Economic disadvantage,
measured by eligibility for free or reduced rate lunch, exerts a negative impact in 4th
grade, but is insignificant for 5th grade. Special education has a large and significant
negative impact in each equation.
Of the two test scores, native language proficiency exerts the only significant impact.
Better preparation for school in the child’s native language is associated with higher 4th
and 5th grade test scores. Higher levels of English language proficiency before starting
school has no impact on 4th or 5th grade reading success. The results, which confirms a
similar finding by Kain and O’Brien (1998), may lend support to the facilitation theory
that cognitive skills in any language are more important than English proficiency in
determining future success in school.
implementation of the Heckman model used here is described in StataCorp (1997):187-195.

26
The impact of seven sequences of program assignment in grades 1-3 are considered. The
programs are identified as B – Bilingual, E – ESL and R – Regular Classroom, in the left
to right sequence of grades 1-3. The missing program against which program impacts are
compared is Bilingual in each year (BBB).
The signs for all 24 program effects are positive, and 17 of the 24 program coefficients
are statistically significant. The largest effects are for three years of Regular Classroom,
and for two years of Bilingual instruction followed by a year of Regular Classroom.
However, three years of Regular classroom and two years of Bilingual instruction
followed by a year of ESL also have large advantages over three years of Bilingual
instruction in each grade. All four of these effects are significant with and without
controlling for early English proficiency and pre-school preparation.
These results must be interpreted with caution due to many potential omitted variables
and lack of information concerning differences in instructional practices in different
classrooms, campuses and by different teachers. There are also potential confounding
effects of the interaction of student success and program assignment to be considered.6
The results do, however, lend support to the District’s current efforts to transition all
students from Bilingual to ESL or Regular Classrooms by the end of the 3rd Grade.
These estimates indicate that this effort may yield higher reading skills and TAAS test
scores for LEP students in the 4th and 5th grades.
Conclusion
This preliminary analysis of Bilingual programs demonstrates that programs for the
education of Limited English Proficient students have become more widely available,
diversified, and more complex over the last thirty years. Due to legislation and funding
requirements, the goals of these programs are now more standardized and academic
6 There is also sample attrition. The regressions include only those students who were in Bilingual, ESL orRegular Classroom settings in the District during the first three years. Many 4th and 5th grade LEP studentsmoved into the District during one of the early grades, other students who were in these programs duringthe first three years moved out of the District.

27
outcome based than the original programs. The emphasis on academic achievement as
the goal of these programs has, in turn, required greater accountability by the District.
The District has therefore developed a data base containing assignment and outcome
measures and has formalized methods for assigning and assessing students in LEP
programs. These changes allow more detailed assessments of program effects than have
been possible in the past.
Our initial findings indicate that program assignment is strongly influenced by program
availability, and parental choice. As we would expect, students with better English skills
are more often assigned to ESL or Regular Classroom programs, while students who have
better native language pre-reading skills are more likely to be assigned to Bilingual
classrooms.
Assignment to Bilingual, ESL or Regular Classrooms during the first three years
contributes to student performance on a standardized English language test in the 4th and
5th grades. The District’s decision to move students out of Bilingual programs by the end
of the 3rd grade is supported. While early English language skills do not appear to
influence 4th and 5th grade reading success, having pre-reading skills in the student’s
native language does have an impact. This lends support to the theory that such skills as
phonetic and alphabetic awareness as well as stronger vocabulary in any language are
more important than English language proficiency for early reading success.
Planned enhancements to this research include obtaining student data for all District
students. This will allow us to control for a number of potentially confounding factors
such as such as teachers, peers, family, and neighborhood that should strengthen the
assessment of program effects. This data will be augmented with information about what
actually occurs in the classroom gathered through teacher and principal surveys and
through classroom observation. The historical analysis will form a baseline for the
assessment of changes in the District’s Bilingual programs during the coming years.

28
References
District .1969. Programa en Dos Lenguas. Bilingual Education Program Proposal
District .1973. Programa en Dos Lenguas. Bilingual Education End-of Year Evaluation.October, 1973.
District .1985. Bilingual Program Evaluation 1984-1985. June, 1985.
District.1985. Transition English as a Second Language Program Evaluation 1984-1985.June, 1985
District.1985. Language Center Program Evaluation 1984-1985. June, 1985.
District.1983. 1982-83 ESEA Title VII Bilingual Education End of Project EvaluationReport. December 16, 1983
District1996. Bilingual/ESL program Manual. PartIV.
District.1998. PLAN for Improving Bilingual/ESL Programs. January, 1998.
Donegan, Craig. 1996. Debate Over Bilingualism. CQResearcher. 6:3, January 19,1996.
ERIC. 1998. Clearinghouse on Assessment and Evaluation. Internet Site.http://ericae.net/eac.
Greene, William H. 1997. Econometric Analysis (3rd Edition), Prentice Hall, UpperSaddle River, New Jersey
Kain, John F. 1998. Using TEA Annual Data to Develop a Multi-Year Panel Data Base:
Lessons Learned and Suggested Additions and Improvements to TEA’s Data Collection.
Texas Assessment Conference, Austin, Texas (Feb. 15-18).
Kain, John F. 1998. Assessment of District’s Bilingual and ESL Programs. June, 1998.
Kain, John F. and Daniel M. O’Brien, “A Longitudnal Assessment of ReadingAchievement: Evidence from the Harvard/UTD Texas Schools Project,” Presented at theGreen Center Conference, “Achieving Universal Literacy,” The University of Texas atDallas, April 2-4, 1998.Lau v. Nichols. Supreme Court Decision. 1974.
Rodriguez, Roberto. 1996. The Politics of Language. Hispanic. April, 1996.
Rossell, Christine.1998. The Educational Effectiveness of Bilingual Education. Presentedat the Green Center Conference. , “Achieving Universal Literacy,” The University ofTexas at Dallas, April 2-4, 1998.
StataCorp. 1997. Stata Statistical Software: Release 5.0. College Station, Texas: StataCorporation (pp. 187-195).
Texas Education Agency. 1997. Snapshot ’96. Winter, 1997.

29
Wildavsky, Aaron. 1992. Finding Universalistic Solutions to Particularistic Problems:Bilingualism Resolved through a Second Language Requirement for Elementary Schools.Journal of Policy Analysis and Management. 11:2. 1992.

30
Attachment A
Description of the UTD Texas Schools Project
The UTD Texas Schools Project is a multiyear research project whose goals are toobtain a better understanding of the determinants of student performance with the long-term objective of providing a knowledge/research base to improve the performance ofpublic schools.
John F. Kain, Cecil and Ida Green Chair for the Study of Science and Society atUTD, initiated the Harvard/UTD Texas Schools Project in 1992 when he was a VisitingProfessor at UTD. Prior to accepting a permanent UTD appointment in spring 1997,Professor Kain was the Henry Lee Professor of Economics and Professor of Afro-American Studies at Harvard, where the project was previously housed. It is now housedat UTD’s Cecil and Ida Green Center for the Study of Science and Society.
The project’s primary focus to date has been the creation of the Texas SchoolsMicrodata Panel (TSMP). This database already includes eight years of linked microdata for more than two million students attending Texas public schools. These data willbe used for research on a large number of important questions that are either poorlyunderstood or for which there has been, heretofore, little or no research or evensystematic information.
TSMP currently includes individual student, teacher, district and campus data forthe eight-year period 1990-1997.7 The student data include enrollment, attendance andstandardized test records for more than two million students belonging to five cohorts.As Table 1 reveals, the members of the youngest cohort were in Pre-K during the 1989-90 school year while members of the oldest were in third grade in the same year. TSMPbegins in the 1990-91 school year because TEA implemented its PEIMS (PublicEducation Information Management System) in that year. In each subsequent year, TEAhas improved the quality and extent of these data. The letter and number designations inthe columns labeled Test/Grade in Table 1 identify particular standardized tests by gradeand type of test NAPT (Norm-referenced Assessment Program for Texas) and TAAS(Texas Assessment of Academic Skills). Thus, N-5 under Cohort 1 refers to the fifthgrade NAPT, while T-7 under Cohort 1 refers to the eighth grade TAAS.
In addition to student data, TSMP includes individual data for all Texas publicschool teachers for the same eight-year period. Currently we are able to link theseteacher data to individual students at the campus, grade and program (bilingual, ESL(English as a Second Language), special education, gifted and talented) level. In thefuture, we hope to obtain data that will permit us to link individual students to theirspecific teachers. 7 PEIMS is a yearly relational data base and TEA makes no effort to link these data across years. Toconstruct TSMP, we had to combine annual PEIMS teacher and student data with TAAS, NAPT, andvarious teacher certification tests that are not part of PEIMS, and link these data across years. As AppendixTable A-1 reveals, to create TSMP we had to combine data from more than 140 individual student files andmore than 110 individual teacher files, as well as campus level data from TEA’s AEIS files, block groupdata from the 1990 Census and district level data from the School District Data Book CD ROMs. Thenumber of individual records included in TSMP exceeds 102 million.

31
Table 1. Total Students and Standardized Tests Included in the TexasSchools Data Base by Cohort, Grade and Test
Cohort 1 Cohort 2 Cohort 3 Cohort 4 Cohort 5
Year Total Students(Enrollment)
Sem Gr Test/Grade
Gr Test/Grade
Gr Test/Grade
Gr Test/Grade
Gr Test/Grade
89-90 F 3 2 1 K PK
89-90 1,161,358 S 3 2 1 K PK
90-91 1,505,551 F 4 3 T-3 2 1 K
90-91 1,391,735 S 4 3 2 1 K
91-92 1,420,295 F 5 4 3 T-3 2 1
91-92 S 5 N-5 4 N-4 3 N-3 2 1
92-93 1,415,593 F 6 5 4 3 T-3 2
92-93 S 6 N-6 5 N-5 4 N-4 &T-4
3 N-3 2
93-94 1,428,908 F 7 6 5 4 3
93-94 S 7 T-7 6 T-6 5 T-5 4 T-4 3 T-3
94-95 1,438,632 F 8 7 6 5 4
94-95 S 8 T-8 7 T-7 6 T-6 5 T-5 4 T-4
95-96 1,459,220 F 9 8 7 6 5
95-96 S 9 8 T-8 7 T-7 6 T-6 5 T-5
96-97 F 10 9 8 7 696-97 S 10 T-10 9 8 T-8 7 T-7 6 T-6
Even without this valuable extension, we are able to complete educational histories forindividual students as long as they attend Texas public schools. Skillful use of these datashould enable us to more accurately and effectively assess the performance of Texasschools than can be done with the fragmentary data that are currently available. Thesedata should also allow us to develop a better understanding of the causes of low studentperformance. If the required funding can be obtained, we will continue to followindividual students belonging to the current five cohorts until they have completed highschool or dropped out, as well as add additional cohorts. The availability of data formore recent cohorts will enable us to assess the effectiveness of various ongoing schoolreform efforts, such as TEA’s accountability system and Governor Bush’s readinginitiative.
While the TEA data are of unprecedented quality and extent, important gapsremain. Therefore, as time and funding permit, we plan to add information obtained fromindividual school districts to TSMP. Among the highest priorities in terms of data base

32
enhancements are: earlier (first and second grade) tests for students already included inour data base, information that will enable us to link individual students to individualteachers, and additional family background variables. We have already held discussionswith officials in 12 districts in the Dallas, Fort Worth and Corpus Christi PMSAs. Threeof them have already provided us with supplementary data and three others have agreedto participate. We are continuing our discussions with the remaining nine districts andplan to meet with others as time allows.
We plan to use TSMP to examine a number of specific educational issues. As weadd years and cohorts to the database and enrich it by adding district specific data, itsanalytical usefulness and power will greatly increase. We are already committed tocompleting research on three important areas, the impact of increased minority access tosuburban schools on the performance of minority children, on special education and onbilingual education.
The Spencer Foundation, which has provided nearly $400,000 of funding for thiswork, supported the collection of data for the first five cohorts and eight years of data, aswell as the difficult and time consuming effort of creating TSMP from TEA’s disparateand unlinked annual data. Spencer also funded the project’s first substantive focus, aninvestigation of the impact of increased minority access to suburban schools on theacademic performance of minority, and especially African-American, children.
In fall 1996 the Smith-Richardson Foundation provided an additional $200,000 infunding for what we anticipate will be the first of several studies that will use data fromthe TSMP for research on a variety of educational policy issues. In this study, Eric A.Hanushek (Rochester University) and Stephen Rivkin (Amherst College) will joinProfessor Kain in an analysis of special education programs in Texas. Special education,which is the most rapidly growing segment of public education, has been subject to verylittle systematic research.
Other high-priority analyses include research on TEA’s accountability system, onalternative instructional strategies for reading and their effects, on the determinants ofteacher supply, on the impact of mobility on student performance, and on the extent ofstudent turnover/flux in Texas schools and its effect on individual student achievement.
Support of Ph D DissertationsTwo UTD graduate students are currently completing Ph.D. dissertations as part
of the Texas Schools Project. They are receiving financial support from the Green Centerand their research combines TSMP data with supplementary data obtained from one ormore school districts.
Daniel M. O’Brien is examining two areas. They are the effects of summerfallback on the achievement of low income and minority students and the effects of earlytests on student achievement. Summer fallback refers to the summer achievementdeclines that appear to occur for low-income children during a period when middle andhigh income children continue to experience gains. O’Brien’s research on the effects ofearly tests will be useful in assessing the biases that arise in the Harvard/UTD Texas

33
School Project from the fact that the earliest tests in the larger data base is given in thethird grade.
Sharon Wrobel, who has just begun her thesis research, is studying bilingualeducation in one of the states largest districts and will help that district assess its efforts tostrengthen its bilingual programs. Like O’Brien, Wrobel has been able to supplementTSMP data with data obtained from the district she is studying. These data include thescores obtained by Limited English Proficient (LEP) students on the English proficiencytests that are used in determining whether they should be assigned to bilingual, ESL orregular programs. A test of this kind is given to all LEP students attending publicschools, but the scores are not supplied to TEA. Thus, they are not included in TSMP.
Publications and Working Papers
John F. Kain and Kraig Singleton. “Equality of Educational Opportunity Revisited.”New England Economic Review. (May/June), 1996.
John F. Kain and Daniel M. O”Brien, “How Much Has Moving to the Suburbs IncreasedAfrican American Educational Opportunities,” Paper prepared for the meetings of theAmerican Economics Association, Chicago, Illinois, January 5, 1998.
Steven G. Rivkin, Eric A. Hanushek and John F. Kain, “Teachers, Schools and AcademicAchievement,” Paper prepared for the meetings of the Econometric Society, Chicago,Illinois, January 4, 1998 (Revised July 1998).
John F. Kain, “Using TEA Annual Data to Develop a Multi-Year Panel Data Base:Lessons Learned and Suggested Additions and Improvements to TEA’s Data Collection,”Prepared for the 12th Annual Texas Assessment Conference, February 15-18, 1998.Renaissance Austin Hotel, Austin, TX.
John F. Kain and Daniel M. O’Brien, “Minority Suburbanization in Texas MetropolitanAreas and Its Implications for Educational Opportunity,” Presented at Conference onSuburban Racial Change, Harvard University, March 28, 1998.
John F. Kain and Daniel M. O’Brien, “A Longitudnal Assessment of ReadingAchievement: Evidence from the Harvard/UTD Texas Schools Project,” Presented at theGreen Center Conference, “Achieving Universal Literacy,” The University of Texas atDallas, April 2-4, 1998.
Eric A. Hanushek, John F. Kain and Steven G. Rivkin, “The Effects of Special EducationPrograms,” Presented at the Green Center Conference, “Achieving Universal Literacy,”The University of Texas at Dallas, April 2-4, 1998.
John F. Kain, “Ethnic and Racial Differences in Graduation, Dropout Rates and CourseCompletions for Students Attending Texas Public High Schools,” Prepared for the TexasCommission on a Representative Student Body, June 4, 1998.

34
Daniel M. O’Brien, “Do Low Income Children Suffer Summer Fallback inAchievement,” Presented at Institute for Research on Poverty Summer Workshop,“Problems of the Low-Income Population,” June 15-18, 1998.
Eric A. Hanushek, John F. Kain and Steven G. Rivkin, “Does Special Education RaiseAcademic Achievement for Students with Disabilities,” June 1998.
Eric A. Hanushek, John F. Kain and Steven G. Rivkin, “The Effects of Differences inTeacher Salaries,” July 1998.

35
Table A-1. Data and Files Included in the Texas Schools Microdata Panel (TSMP)(Data for the 1990-97 School Years, Eight Years of Data)
TotalFile Types Years Files Records
StudentPEIMS Demographic 5 5 7,948,609PEIMS Enrollment 8 8 11,147,832PEIMS Chapter I Enrollment 8 8 5,330,209PEIMS Special Ed Enrollment 8 8 1,465,578PEIMS Voced Enrollment 4 4 986,627PEIMS Gifted Enrollment 6 6 392,462PEIMS Summer Demographic 5 5 7,948,609PEIMS Basic Attendance 4 24 33,017,628PEIMS Special Ed Attendance 4 24 6,984,950PEIMS Voced Attendance 4 24 986,627TAAS 7 22 6,259,435NAPT 2 7 1,683,009TEAMS 1 1 286,982Total Student Files/Records 84,438,557
TeacherPEIMS Staff 8 8 2,421,138PEIMS Employment 8 8 2,421,138PEIMS Payroll 8 8 4,013,119PEIMS Class 8 8 7,788,629PEIMS Nonclass 8 8 366,579PEIMS Permit 8 8 82,021TECAT 5 1 145,711ExCET 5 64 292,696TOPT 5 1 4,894PPST 5 1 54,125TASP 5 1 32,032Total Teacher Files/Records 116 17,622,082

36
coef. z score coef. z score coef. z score coef. z score% LEP -1.34 -1.7 -1.71 -2.2 -0.65 -1.2 -0.60 -1.0% Special Education -2.32 -2.7 -2.47 -2.7 -0.08 -0.1 0.00 0.0% ESL 2.45 2.5 3.14 3.2 1.29 1.6 1.42 1.7% Bilingual 0.59 0.7 1.21 1.4 0.75 1.2 0.82 1.2% Regular Program -2.55 -3.0 -2.26 -2.5 1.62 2.9 1.88 3.0Took English Pre-test 0.98 11.5 1.00 11.0 0.71 8.1 0.80 9.1Constant 0.28 1.5 0.11 0.5 0.41 2.6 0.20 1.1
N 1,637 1,508 1,595 1,412Chi-squared 194.3 211.3 238.5 225.6
4th Grade 5th Grade
Table B-1: Effect of Program Assignment in Grades 1-3 on TAAS ScoreSelection Equations
No Early Tests With Early Tests No Early Tests With Early Tests