Embed Size (px)
Citation preview

University of Wollongong Thesis Collections
University of Wollongong Thesis Collection
University of Wollongong Year
An appropriate manufacturing strategy
model for the Thai food processing
industry
Chaitamlong PongpattanasiliUniversity of Wollongong
Pongpattanasili, Chaitamlong, An appropriate manufacturing strategy model for the Thaifood processing industry, PhD thesis, Faculty of Engineering, University of Wollongong,2004. http://ro.uow.edu.au/theses/576
This paper is posted at Research Online.
http://ro.uow.edu.au/theses/576
NOTE
This online version of the thesis may have different page formatting and pagination from the paper copy held in the University of Wollongong Library.
UNIVERSITY OF WOLLONGONG
COPYRIGHT WARNING
You may print or download ONE copy of this document for the purpose of your own research or study. The University does not authorise you to copy, communicate or otherwise make available electronically to any other person any copyright material contained on this site. You are reminded of the following: Copyright owners are entitled to take legal action against persons who infringe their copyright. A reproduction of material that is protected by copyright may be a copyright infringement. A court may impose penalties and award damages in relation to offences and infringements relating to copyright material. Higher penalties may apply, and higher damages may be awarded, for offences and infringements involving the conversion of material into digital or electronic form.

AN APPROPRIATE MANUFACTURING STRATEGY MODEL FOR THE THAI FOOD PROCESSING
INDUSTRY
A thesis submitted in fulfilment of the requirements for the award of the degree
DOCTOR OF PHILOSOPHY
from
UNIVERSITY OF WOLLONGONG
by
Chaitamlong Pongpattanasili
MEngSC ( UNSW)
Faculty of Engineering
2004

DECLARATION OF ORIGINAL AUTHORSHIP The work contained in this thesis has not been previously submitted for a degree or
diploma at any other University of higher education institution. The thesis contains
no material previously published or written by another person except where due
reference has been made.
Chaitamlong Pongpattanasili 24 August 2004
i
ABSTRACT
Thailand is well recognised for its high potential as an agricultural country and major
food supplier. It provides a major source of agricultural product and agricultural
manufacturing based industries. The most important sector is the food processing
industry. This area is the most important sub-sector in Thai industry. The value in
exports in the year 2002 was approximately 14.4% of the country’s total GDP.
However, a high potential for growth still exists.
Food production in Thailand is based on local agricultural raw materials, comprising
of fruit and vegetables, cereal and oils, fish and livestock and provides employment to
20 million people within the agricultural and food processing sector. This thesis
discusses the characteristics of the Thai food processing industry and suggests an
appropriate manufacturing strategy model is needed in order for it to achieve
manufacturing excellence.
This study presents a classification of the Thai agricultural industry and compares
one of its sectors, the agricultural manufacturing industry with another industrial
sector viz. the electrical/electronic industry. The thesis investigates both industries
contribution and reveals why the food processing industry is important for Thailand.
After an overall analysis of the industry and its importance, the results of a survey of
350 food processing companies are compared, including characteristics of the Thai
food processing industry, the focus of manufacturing strategies and the
implementation of manufacturing practices.
Based on this, and in order to assist the Thai food processing industry to achieve
manufacturing excellence, the thesis then develops an integrated model combining
GMP, HACCP, TPM and TQM, and provides guideline for their implementation.

ii
Acknowledgement I am deeply grateful to my Academic Supervisor, Associate Professor Peter Gibson
and Co-Supervisor Professor Guenter Arndt, for their kind support, guidance and
encouragement at all stages. Without their valuable criticisms, comments, and
suggestions, I would not have been able to complete my thesis.
I am also very grateful to Mr Chatre Limpongsi, Board of Investment, Thailand for
his suggestions and managerial support in Thailand. I am also grateful to all staff of
the Department of Industrial, Naresuan University, for their encouragement. My
appreciation also goes to those who provide valuable information for my mail survey
and case studies, there are too many to mention by name.
Thanks are also due to Joan Phillips for her most efficient and kind proofreading in
this thesis.
I would also like to thank Mr. Sumret Wanthip and Miss Fiona O Beirne for providing
generous support during my study in Australia.
Last but not least, I wish to thank my family (especially to Varintorn) for their
patience and enduring support granted during a seemingly endless decade of tertiary
education full of periods of stress and challenges but also achievement and
satisfaction.
Pongpattansasili C.
iii
TABLE of CONTENTS Abstract i
Acknowledgements ii
List of Contents iii
List of Tables x
List of Figures xiii
List of Abbreviations xvi
Chapter 1: Introduction
1.1 Background of Thai Food Processing Manufacturing Industry 1
1.2 Problem Statement 3
1.3 Objective of the Research 3
1.4 Scope of the Research 4
1.5 Importance of the Research 4
1.6 Research Outline 4
Chapter 2: An Overview of Thai Industry and the Importance of its
Agricultural Manufacturing Industry
2.1 Introduction 6
2.2 General Picture of the Thai Economy 6
2.3 Classification of the Thai industry sector 9
2.4 Industrial Transition 9
2.5 Export and Import patterns 12
2.6 Direct Foreign Investment in Electrical/Electronic Products in Thailand 15
2.7 Thai Agriculture Products 18
2.7.1 Definition of agricultural manufacturing industry 19
2.7.2 Definition of food processing industry 20
2.8 Agricultural Manufacturing Industry 20
2.9 Food Processing in Industry 20
2.10 Non Food Products 22
2.11 Relative Importance of Agricultural Manufacturing Industry and 23
Electrical / Electronic Industry

iv
2.12 Conclusion 24
Chapter 3: Analysis of the Thai Food Processing Industry and the
Importance of SMEs
3.1 Introduction 27
3.2 Moving Towards Industry-Based Agriculture 27
3.3 Thai National Economic Objectives for 28
Agricultural Manufacturing Industry
3.4 Definition of Thai Small and Medium Enterprise (SME) Sector 29
3.5 Definition of Thai Food Processing Industry 30
3.6 Food Processing Industry in Thailand 30
3.7 Profitability of Thai Industry 32
3.8 Government Policies Development Plan: __________________ 34
The Thai Food Processing Industry
3.9 Classification of Thai food processing industry 35
3.10 Common Food Processing Industry in Thailand 35
3.10.1 Fruit and vegetable processing 36
3.10.2 Marine products 36
3.10.3 Edible oils 37
3.10.4 Dairy products and baked goods 37
3.10.5 Animal feed and feed production 37
3.10.6 Meat products 38
3.10.7 Poultry 38
3.10.8 Beverage industry 38
3.10.9 Sugar and confectionery industry 39
3.10.10 Spice and condiment industry 39
3.11 Factories Based on Classification of Thai Food Processing Industry 40
3.11.1 Tobacco curing factories 40
3.11.2 Agricultural product-related factories 40
3.11.3 Dairy product factories 40
3.11.4 Marine-related factories 41
3.11.5 Edible pant oil or animal oil-related factories 41
3.11.6 Vegetable and fruit related factories 41

v
3.11.7 Grain or plant head-related factories 41
3.11.8 Sugar production from came, beet, sweet grass 41
3.11.9 Tea, coffee, chocolate or dessert-related factories 42
3.11.10 Cooking ingredients related factories 42
3.11.11 Spirit boiling, distillation or mixing related factories 42
3.11.12 Malts, beer related factories 42
3.12 Conclusion 43
Chapter 4: Present Thai Food Processing Industry Manufacturing Strategies
4.1 Introduction 44
4.2 Good Manufacturing Practice (GMP) 45
4.2.1 Requirements of Good Manufacturing Practices for Thai food 47
processing industry
4.3 Hazard Analysis Critical Control Point (HACCP) 50
4.4 Total Productive Maintenance (TPM) 54
4.5 Just- In-Time (JIT) Manufacturing 58
4.6 Total Quality Management (TQM) 60
4.6.1 A note on the ISO 9000 concepts for Thai food processing industry 64
4.6.1.1 The important of ISO 9000 for Thai food processing industry___65
4.6.2 A note on Six Sigma Concept for the Thai food processing industry 66
4.7 A Flow Chart of the Development Appropriate to the Manufacturing 68
Strategy Model for Thai Food Processing Industry
4.8 Practices of an Appropriate Integrated Model of TQM, JIT, GMP and 69
HACCP
4.9 Linking Infrastructures Practices of the Integrated Model 74
(HACCP, JIT, TPM and TQM)
4.10 Suggested Implantation Step Combined Model of GMP, HACCP, JIT, 81
TPM, and TQM
4.11 Appropriate Manufacturing Strategies output Model (AMS output) 85
4.12 Conclusion 88 Chapter 5: Research Method and Hypotheses
5.1 Introduction 89
5.2 Research Method 90

vi
5.3 Research Plan 91
5.4 Hypotheses 92
5.5 Survey Instrument 93
5.6 Data Collection 94
5.7 Data Analysis 95
5.8 Conclusion 96
Chapter 6: Pilot Survey of Thai Food Processing Industry
6.1 Introduction 98
6.2 Analysis of Thai Food Processing Industry from Pilot Survey 98
6.2.1 Company characteristics 98
6.2.2 Focus of manufacturing strategies 99
6.2.3 Implementation of factory practice 100
6.2.4 Machinery and equipment problems 101
6.3 Comparison of Industry Manufacturing Practices 104
6.4 Conclusion 104
Chapter 7: Main Survey of Thai Food Processing Companies
7.1 Introduction 105
7.2 General Characteristics of Thai Food Processing Companies 105
7.3 Problems in Thai food Processing Companies 108
7.3.1 Human Resource Problems 108
7.3.2 Quality Problems 110
7.3.3 Basic Infrastructure Problems 112
7.3.4 Competition Problems 114
7.4 Problem Solving Potential 116
7.4.1 Human resource problems 116
7.5 Business Performance 119
7.6 Basic Company Characteristics Relating Tools and Techniques Best 121
Practices
7.7 Manufacturing Practices for Thai Food Processing Companies: 127
GMP, HACCP, JIT, TPM and TQM
7.8 Best Manufacturing Practice for Thai food Processing companies 132
7.9 Conclusion 137

vii
Chapter 8: Hypotheses Test and Analysis
8.1 Introduction 138
8.2 Need for the Development of Integrated Model of Best Practice 138
and Market Requirements
8.3 Implementation of Integrated model 142
8.4 Relationship between Industrial Characteristics and Product and 148
Process Strategies
8.5 Training 154
8.5.1 GMP training 156
8.5.2 HACCP training 158
8.5.3 TPM training 160
8.5.4 TQM training 161
8.5.5 JIT training 162
8.6 Conclusion 162
Chapter 9: Data Analysis Supporting the implementation of an
Appropriate Thai Food Processing Manufacturing Strategy Model
9.1 Introduction 163
9.2 Elements or Basic Infrastructure of Organisation 163
9.2.1 Organisational structure 164
9.2.2 Management systems 165
9.2.3 Management activities 166
9.2.4 Potential of problem solving 166
9.2.5 The relationship between Organisational Characteristics 168
9.3 Manufacturing Practices 173
9.4 Application of Tools and Techniques 174
9.4.1 Tools and Techniques related to GMP and HACCP 174
9.4.2 Basic Tools and Techniques 176
9.4.3 Tools and Techniques related to supplier management 178
9.4.4 Management Tools and Techniques 189
9.5 Conclusion 180
viii
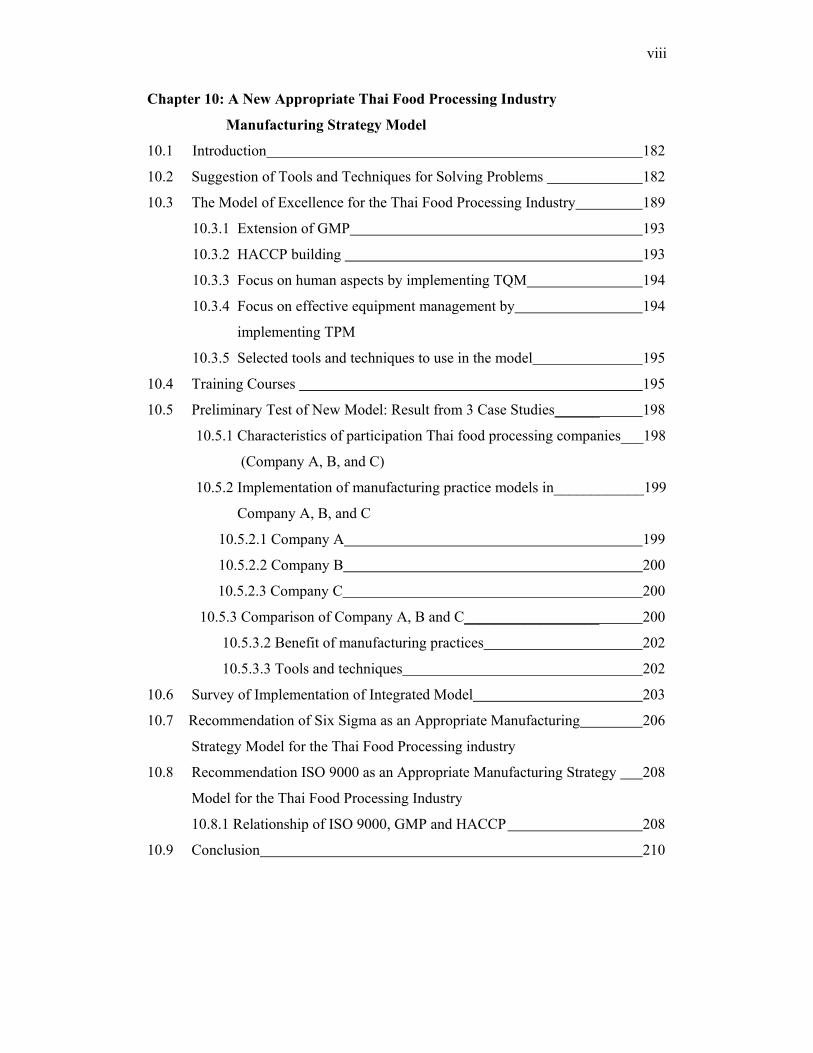
Chapter 10: A New Appropriate Thai Food Processing Industry
Manufacturing Strategy Model
10.1 Introduction 182
10.2 Suggestion of Tools and Techniques for Solving Problems 182
10.3 The Model of Excellence for the Thai Food Processing Industry 189
10.3.1 Extension of GMP 193
10.3.2 HACCP building 193
10.3.3 Focus on human aspects by implementing TQM 194
10.3.4 Focus on effective equipment management by 194
implementing TPM
10.3.5 Selected tools and techniques to use in the model 195
10.4 Training Courses 195
10.5 Preliminary Test of New Model: Result from 3 Case Studies______ 198
10.5.1 Characteristics of participation Thai food processing companies___198
(Company A, B, and C)
10.5.2 Implementation of manufacturing practice models in____________199
Company A, B, and C
10.5.2.1 Company A 199
10.5.2.2 Company B 200
10.5.2.3 Company C 200
10.5.3 Comparison of Company A, B and C__________________ 200
10.5.3.2 Benefit of manufacturing practices 202
10.5.3.3 Tools and techniques 202
10.6 Survey of Implementation of Integrated Model 203
10.7 Recommendation of Six Sigma as an Appropriate Manufacturing 206
Strategy Model for the Thai Food Processing industry
10.8 Recommendation ISO 9000 as an Appropriate Manufacturing Strategy 208
Model for the Thai Food Processing Industry
10.8.1 Relationship of ISO 9000, GMP and HACCP 208
10.9 Conclusion 210

ix
Chapter 11: Conclusion 212
References 216
Appendix A Thai Industry Classification and Main Statistic 246
Appendix B Output and Value Added by Thai Manufacturing industry 251
Appendix C Pilot Questionnaire 252
Appendix D Main Survey Questionnaire 257
Appendix E Statistical Analysis 269
- E1 Main survey 269
- E2 Hypotheses test 281
Appendix F Tools and Techniques 291

x
List of Tables Table 2.3.1 Specific Industries in the Primary, Secondary, and Tertiary
Categories, Based on the International Standard Industrial
Classification (ISIC)
9
Table 2.4.1 Share of Gross Domestics Product by Industrial Origin and
Growth at 1980 Prices
10
Table 2.5.1 Structure of Thailand’s Export Products 13
Table 2.6.1 Structure of Thai Electrical/Electronic Industries 17
Table 2.12 Comparison of the Thai Agricultural Manufacturing Industry and
Electrical/Electronic Industry
26
Table 3.4.1 Definition of SMEs by Total Assets Value 29
Table 3.6.1 Number of Factories, Capital Investment, and Employment of
Registered Factories in Thailand, 1998
31
Table 3.6.2 Proportion of SMEs by Factory, Investment, and Employment
1998
31
Table 3.6.3 Thailand’s Top Ten food Exports in 1998 31
Table 4.3.1 Principles of HACCP 52
Table 4.5.1 Definitions of JIT Manufacturing 59
Table 4.6.1 Requirements for Effective Quality Management 63
Table 4.9.1 Relationship between Element Practices of GMP, HACCP, JIT,
TPM and TQM
74
Table 4.11 Factors Necessary for Success of Integrated System of TQM,
TPM, JIT, GMP and HACCP
87
Table 6.3.1 Thai Food Processing Industry Manufacturing Practices 104
Table 8.3.1 Manufacturing Practices and Business Performance 147
Table 9.1 Competitive Business Performance 164
Table 9.2.1 Organisation Structure 165
Table 9.2.2 Management Systems 165
Table 9.2.3 Management Activities 166
Table 9.2.4a Potential of Solving Human Resource Problems 167
Table9.2.4 b Potential of Solving Quality Problems 167
Table 9.2.4c Potential of Solving Basic Infrastructure Problems 167

xi
List of Tables Table 9.2.4d Potential of Solving Problems Regarding Competitors 168
Table 9.2.5a Group (a)- Safety elements 169
Table 9.2.5b Group (b)- Maintenance Elements 169
Table 9.2.5c Group I – Production Elements 169
Table 9.2.5d Group (d) – Supplier Elements 169
Table 9.2.4e Group (e) – Strategic Management Elements 169
Table 9.2.5f Group (f) – Financial Management Elements 169
Table 9.2.5g Group (g) – Development of New Product Elements 170
Table 9.2.5h Group (h) – Sales and Marketing Elements 170
Table 9.2.5i Group (i) – Performance Management Elements 170
Table 9.2.5j Group (j) – Education and Training Elements 170
Table 9.2.5k Group (k) – Co-operation Elements 170
Table 9.2.5l Group (l) – Quality Management Elements 171
Table 9.2.5m Group (m) – Continuous Improvement Activities 171
Table 9.2.5n Group (n) – Organisation Aspects 171
Table 9.4.1 Degree of Importance of Tools and Techniques related to GMP
and HACCP
176
Table 9.4.2 Degree of Importance of Basic Tools and Techniques 177
Table 9.4.3 Degree of Importance of Tools and Techniques related with
Supplier Management
178
Table 9.4.4 Degree of Importance of Management Tools and Techniques 180
Table 10.2 Relationship between Problems and Manufacturing Practices and
suggested Tools and Techniques
182
Table 10.2a Tools and Techniques which are used by Top Management 187
Table 10.2b Tools and Techniques which are used by Middle Management 187
Table 10.2c Tools and Techniques which are used by Engineer 188
Table 10.2d Tools and Techniques which are used by Supervisor 188
Table 10.2e Tools and Techniques which are used by Front-Line Operator 189
Table 10.4.1 Training Courses for Particular Job Positions 197
Table 10.4.2a Basic Training for each Particular Job Levels 197
Table 10.4.2b Management Training for each Particular Job Levels 198
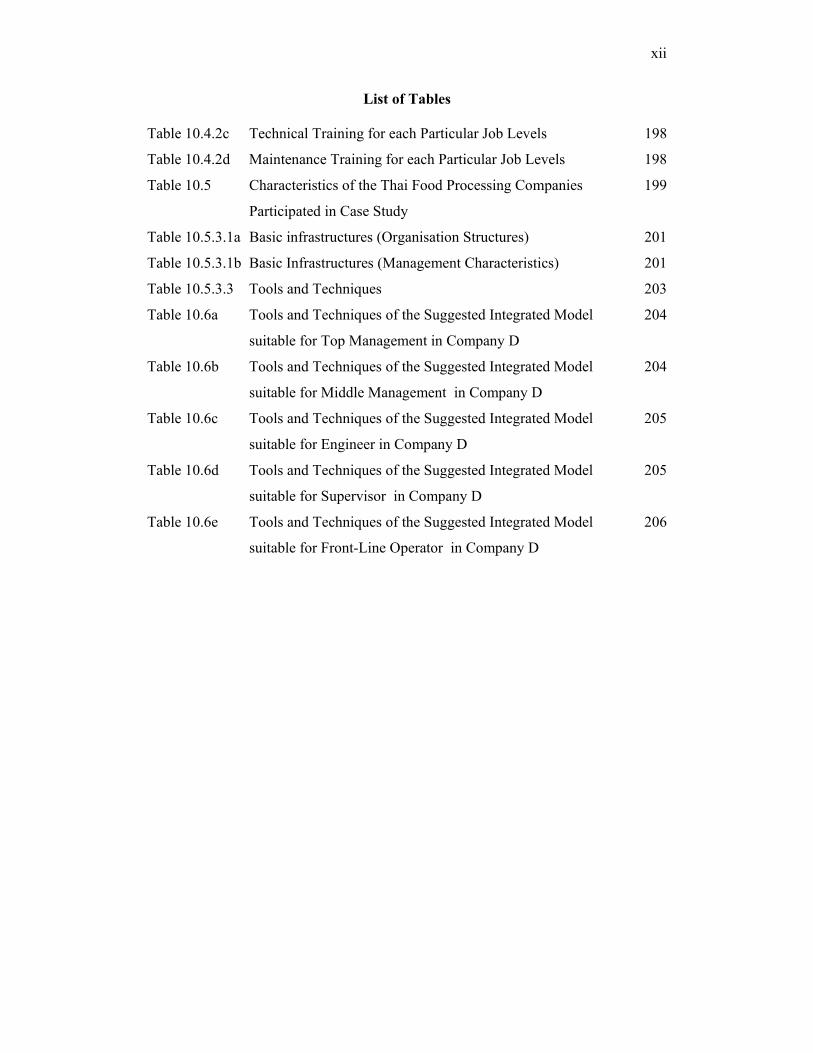
xii
List of Tables Table 10.4.2c Technical Training for each Particular Job Levels 198
Table 10.4.2d Maintenance Training for each Particular Job Levels 198
Table 10.5 Characteristics of the Thai Food Processing Companies
Participated in Case Study
199
Table 10.5.3.1a Basic infrastructures (Organisation Structures) 201
Table 10.5.3.1b Basic Infrastructures (Management Characteristics) 201
Table 10.5.3.3 Tools and Techniques 203
Table 10.6a Tools and Techniques of the Suggested Integrated Model
suitable for Top Management in Company D
204
Table 10.6b Tools and Techniques of the Suggested Integrated Model
suitable for Middle Management in Company D
204
Table 10.6c Tools and Techniques of the Suggested Integrated Model
suitable for Engineer in Company D
205
Table 10.6d Tools and Techniques of the Suggested Integrated Model
suitable for Supervisor in Company D
205
Table 10.6e Tools and Techniques of the Suggested Integrated Model
suitable for Front-Line Operator in Company D
206

xiii
List of Tables Figure 2.2.1 Number of Factory Closures in Thailand in 1998 8
Figure 2.5.1 Thailand’s Import Product 14
Figure 2.6.1 Net Foreign Investment Flow in the Thai Electrical/Electronic
Sector Classified according to Country
16
Figure 2.7.1 Sector Classification for Thai Agricultural Manufacturing
Industry
18
Figure 2.11 Comparison of Trade Balance Figure for Thai Export Products 24
Figure 3.7.1 Gross Output by Division of Industry 33
Figure 3.7.2 Value added by Industry Sector 33
Figure 4.2.1 GMP for the Thai Food Industry Components of Good
Manufacturing Practices
49
Figure 4.7.1 Flow Chart of Develop Appropriate Thai Food Processing
Manufacturing Strategy Model
67
Figure 4.8.1 Elements of infrastructure practice among GMP 70
Figure 4.8.2 Food Safety Assurance 71
Figure 4.8.3 Relationship between HACCP and TQM 72
Figure 4.8.4 Revised Model for Quality Systems in the UK Food and Drinks
Industry
73
Figure 4.10.1 Integrated Model of GMP, HACCP, JIT, TPM and TQM 82
Figure 4.11 Appropriate Manufacturing Strategy Model Output 88
Figure 6.2.1 Type of Thai Food Processing Industry 99
Figure 6.2.2 Focus of Manufacturing Strategies 100
Figure 6.2.3 Manufacturing Practice 100
Figure 6.2.4 Machine Problem 101
Figure 6.2.5 Cause of Production delay in Thai Food Processing Companies 102
Figure 6.2.6 Future plan to improve business Performance 102
Figure 7.2.1 Type of Production 106
Figure 7.2.2 The Company Main Market 106
Figure 7.2.3 Focus of Manufacturing Strategies 107
Figure 7.2.4 Ratio of Technology used for Value-adding Operation 107
Figure 7.3.1a Human Resource Problem and Frequency of Problems 109

xiv
List of Tables
Figure 7.3.1b Frequency of Human Resource Problems 109
Figure7.3.1c Human Resource Problem and Urgency of Problem 110
Figure 7.3.2a Quality Problem and Frequency of Quality Problems 111
Figure 7.3.2b Frequency of Quality Problems 111
Figure 7.3.2c Urgency of Quality Problems 112
Figure 7.3.3a Basic Infrastructure and Frequency of Problems 113
Figure 7.3.3b Basic Infrastructure Problems and Urgency of Problem 112
Figure 7.3.4a Problems with Competitions and Frequency of problems 115
Figure 7.3.4b Problems with Competitions and Urgency of Problems 115
Figure 7.4.1 Potential of Solving Human Resource Problems 116
Figure 7.4.2a Potential of Solving Quality Problems 117
Figure 7.4.2b Difficulty of Solving Quality Problems 117
Figure 7.4.3a Potential of Solving Basic Infrastructure Problems 118
Figure 7.4.3b Difficulty of Solving Basic Infrastructure Problems 118
Figure 7.4.4 Potential of Solving Competition Problems 119
Figure 7.5.1 Current Quality Status and Degree of Important 120
Figure 7.5.2 Business Performance needed to outperform Competitors 121
Figure 7.6.1a Organisation Structure and Implementation 122
Figure 7.6.1b Full Implementation of Organisation Structure 122
Figure 7.6.2a Management Characteristics and Implementation 123
Figure 7.6.2b Management Characteristics to be improved 124
Figure 7.6.3a Management Activities and Implementation 125
Figure 7.6.3b Management Activities to be improved 125
Figure 7.6.4 Quality Aspects used to develop the Manufacturing Strategies 126
Figure 7.7.1 Familiarity with manufacturing practices 128
Figure 7.7.2 Introduction of manufacturing practices 128
Figure 7.7.3 Current implementation of practices 129
Figure 7.7.4 Implementation status of GMP, HACCP, TQM, and TPM 130
Figure 7.7.5 Main Motivation for Implementation of GMP, HACCP, TPM,
JIT and TQM
131
Figure 7.7.6 Benefits of Company Performance from Manufacturing
Practices
131

xv
List of Tables Figure 7.8.1 Adaptation of Best Practices in Thai Food Processing
Companies
132
Figure 7.8.2 Barriers to Achieve the Best Practice Manufacturing for Thai
Food Processing Industry
133
Figure 7.8.3 The limitation of JIT Practice implementing for Thai Food
Processing Industry
134
Figure 7.8.4 The limitation of TPM practices implementation for Thai Food
Processing Industry
135
Figure 7.8.5 Company Expect from TPM Practice 137
Figure 8.2.1 Manufacturing Practices and Motivation 140
Figure 8.2.2 Manufacturing Strategies and Manufacturing Practices 142
Figure 8.3.1 Manufacturing Practices and Benefits 145
Figure 8.4.1 Company Size and Manufacturing Practices 149
Figure 8.4.2 Manufacturing Practices and Turnover 150
Figure 8.4.3 Manufacturing Process and Manufacturing Practices 151
Figure 8.5 Training Program in GMP, HACCP, TPM and TQM that are
necessary for Achieving Thai Food Processing Industry
Excellence
153
Figure 8.5.1 GMP Training 155
Figure 8.5.2 HACCP Training 157
Figure 8.5.3 TPM Training 159
Figure 8.5.4 TQM Training 161
Figure 9.4.1 Tools and Techniques Related to GMP and HACCP and Degree
of Importance
175
Figure 9.4.2 Basic Tools and Techniques and their Degree of Importance 177
Figure 9.4.3 Tools and Techniques related to Supplier Management and
Degree of Importance
178
Figure 9.44 Management Tools and Techniques and the Degree of
Importance
179
Figure 10.3 New Manufacturing Strategy Model for Thai Food Processing
Industry
190
Figure 10.3.5 Tools and Techniques for the Appropriate Thai Food Processing
Industry Manufacturing Strategy Model
196
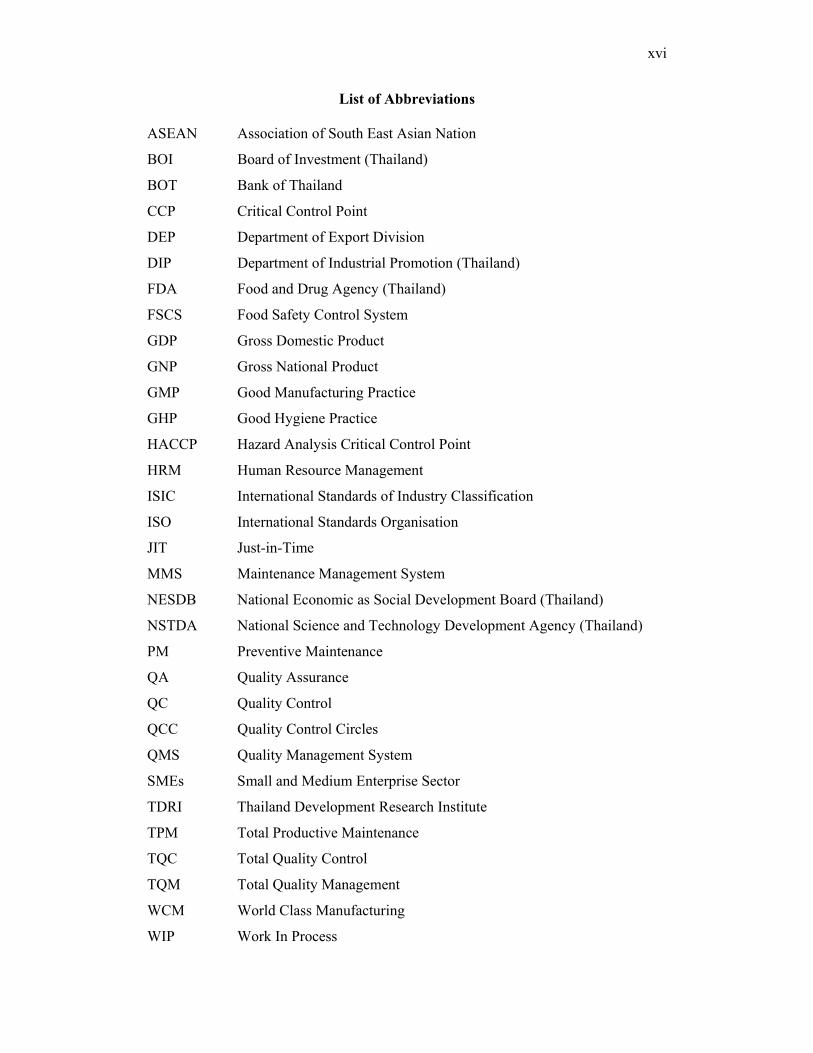
xvi
List of Abbreviations ASEAN Association of South East Asian Nation
BOI Board of Investment (Thailand)
BOT Bank of Thailand
CCP Critical Control Point
DEP Department of Export Division
DIP Department of Industrial Promotion (Thailand)
FDA Food and Drug Agency (Thailand)
FSCS Food Safety Control System
GDP Gross Domestic Product
GNP Gross National Product
GMP Good Manufacturing Practice
GHP Good Hygiene Practice
HACCP Hazard Analysis Critical Control Point
HRM Human Resource Management
ISIC International Standards of Industry Classification
ISO International Standards Organisation
JIT Just-in-Time
MMS Maintenance Management System
NESDB National Economic as Social Development Board (Thailand)
NSTDA National Science and Technology Development Agency (Thailand)
PM Preventive Maintenance
QA Quality Assurance
QC Quality Control
QCC Quality Control Circles
QMS Quality Management System
SMEs Small and Medium Enterprise Sector
TDRI Thailand Development Research Institute
TPM Total Productive Maintenance
TQC Total Quality Control
TQM Total Quality Management
WCM World Class Manufacturing
WIP Work In Process

xvii
WM Workplace Management
WHO World Health Organisation
WTO World Trade Organisation
1
Chapter 1
Introduction
1.1 Background of Thai Food Processing Manufacturing Industry Thailand’s share of the huge agricultural market in Asia is already large and still
growing. This is due to several factors. Firstly, there has been an improvement in the
economic conditions in some Asian countries including Thailand. This has led to the
desire for better quality and greater variety of foods by consumers who show increasing
awareness of the value of nutrition and the importance of hygiene and food safety, and
desire convenience. Food distribution methods are changing rapidly with the advent of
modern transportation. An increase in the number of supermarkets, together with
changes in eating habits have created substantial changes in food consumption patterns.
The Thai economy reflects the trends.
Secondly, modern farming methods in Thailand have improved, giving higher yields
and better quality products. This in turn, has led to the establishment of a small but
growing, food processing manufacturing industry, which utilises the surplus agricultural
products and adds value to them. This is a current shift in most Asian countries
including Thailand, where retail food distribution is changing rapidly as the economy
grows.
According to some observers, opportunities in the Thai food processing industry are as
high as in other high technology industries. Both domestic and international food
companies are expanding their presence and strengthening their positions in Asia. Those
which succeed are generally based with regional headquarters in Thailand and have a
local manufacturing strategy. This growth and increasing competition have created the
need for a new manufacturing strategy model for the Thai food processing industry, as
well as exerted pressure on existing Thai food processing companies to modernise. The
need for continuous improvement at the product and process levels has become
essential.
2
The term, agricultural manufacturing industry, encompasses both the food processing
and the agricultural product industries. The food processing industry is considered to be
among the most important industries in Thailand, with a high growth potential. It also
adds value to the agricultural production industry. The agricultural manufacturing
industry represented 50.3% of all manufacturing industries in Thailand in 2000, while
food and beverage processing accounted for more than a quarter of the total agricultural
manufacturing industries (Food and Agriculture Organisation and Ministry of
Agriculture, report 2000). Moreover, Jatupitak (2004) expressed the opinion that the
food industry is particularly important for Thailand for the following reasons: it links
the rural with the industrialised sectors, it uses a high percentage of local content, it
links Thailand to international markets, and it offers opportunities for increasing value
added through branding.
The Thai food processing industry is usually considered to be of a high standard.
However, this did not assist the industry to maintain its volume of export during the
economic crisis in 1997. Many Thai food processing companies lost their markets to
other countries such as Indonesia, Vietnam, the Philippines, and China. Thailand faced
export problems due to competition, supply shortages, and inefficient financial and
production management. To regain the competitive edge, Thailand will need to focus
more on the value-added food processing industries and concentrate on efficient
manufacturing strategies.
The Thai food processing industry has become the focus of the government’s attention,
which views it as an important opportunity to increase revenue for the Thai economy.
“Thailand can really become a giant in food “Kitchen for the World” (Shinawat, 2004).
The government’s attempts to support the Thai food processing industry have increased
the use of technological and advanced systems to meet or exceed international standards
including safety and hygiene. Jewaranon (2004) suggested that the private sectors
should work closely with the government to improve Thailand’s ability to distribute
food quickly and efficiently, both domestically and internationally.

3
This research concentrates on finding an appropriate manufacturing strategy for the
Thai food processing manufacturing industry and improving the competitiveness of its
products in the domestic and international markets, particularly by producing high
quality value-added products for the middle to luxury markets. This can be achieved by
upgrading technologies and machinery as well as the skills needed in such areas as
quality management, knowledge, production skills, technical education, and
maintenance of industrial equipment. This chapter provides an overview of the research
by describing its aim, background, targets, benefits, and the research plan.
1.2 Problem Statement This research examines the current manufacturing strategies in a representative group of
Thai food processing companies and, based on those findings, offers recommendations
for appropriate manufacturing improvement. The Thai food processing industry needs
to upgrade its manufacturing through the use of strategies more appropriate to it. The
aim of this research is to find a new model for such strategies.
1.3 Objectives of the Research
The objectives of this research are as follows:
1. To investigate the characteristics of the Thai food processing industry (SMEs);
2. To identify and analyse the main problems in the Thai food processing industry;
3. *To develop a manufacturing strategy model for the Thai food processing industry
combining Good Manufacturing Practices (GMP), Hazard Critical Control Point
(HACCP), Total Productive Maintenance (TPM), Just In Time (JIT) and Total
Quality Management (TQM), as a guide for implementation in companies trying to
achieve manufacturing excellence;
4. To test this model;
5. To suggest that the model is appropriate as a manufacturing strategy for the Thai
food processing industry in general.
* These above objectives are discussed fully in chapter 4.

4
1.4 Scope of the Research
The scope of the study is limited to small and medium sized food processing companies
that have a focus on manufacturing strategies such as GMP, HACCP, TPM, JIT and
TQM. The use of these strategies enables these companies to be successful by
manufacturing products that fit market and consumer requirements respectively.
1.5 Importance of the Research
This research aims at developing an integrated manufacturing strategy model combining
Good Manufacturing Practices (GMP), Hazard Analysis Critical Control Point
(HACCP), Just-in-Time (JIT) Manufacturing, Total Productive Maintenance (TPM) and
Total Quality Management TQM), used to guide manufacturing organisations in
implementing them and measuring their performance towards achieving manufacturing
excellence. Japanese manufacturers that gain a significant competitive edge in the world
market often use these strategies. In reality, the Thai food processing companies have
never used HACCP without GMP. JIT, HACCP, and TQM are complementary and
TPM supports effective implementation of GMP.
1.6 Research Outline
To accomplish the above aim, a pilot survey is used in order to identify the areas to be
explored. This is presented in Chapter 2, which also contains a review of the Thai
agricultural manufacturing industry. Chapter 3 investigates the characteristics by which
the various Thai food processing industries are classified. Chapter 4 discusses the
theoretical justification of the proposed model and clarifies the manufacturing practices
being proposed in the research question. Chapter 5 discusses the development of a
hypothesis and details the research methodology of this thesis. Chapters 6 and 7 present
and analyse data collection from both the pilot survey and main survey of Thai food
processing companies. The pilot survey presents general information about the industry
and gives indications of problems in Thai food processing manufacturing practices
while the main survey focuses on manufacturing techniques and tools. Chapter 8
analyses and tests the hypothesis.

5
In Chapter 9 and Chapter 10 an appropriate Thai food processing industry
manufacturing strategy model is developed for the industry. Chapter 11 presents a
summary of the present study, its contribution to existing knowledge, its limitations, and
recommendations for further research.

6
Chapter 2
An Overview of Thai Industry and the Importance of its
Agricultural Manufacturing Industry
2.1 Introduction The two major industries in Thailand are agricultural manufacturing and
electrical/electronic manufacturing. Both are key industrial sectors, which have had
exports of about 63.4% of GDP or 731,651.7 million baht in 1997 (Bank of Thailand,
1998). In order to understand their importance it is necessary to examine the Thai
economic condition and government policies towards industrial growth.
Because of the Thai economic crisis in 1997, the government focused on the private
manufacturing sector products in order to counteract the negative economic changes in
general living conditions caused by this downturn as well as improved the agricultural
manufacturing industry sector as a means of increasing the overall revenue for Thailand.
In this chapter, the first section reviews the general economic conditions in Thailand,
from the 1970s to the present. The next section discusses the two major industrial
sectors: the electrical/electronic industry and the agricultural manufacturing industry.
These are compared in order to assess their relative importance in the Thai economy.
2.2 General Picture of the Thai Economy The structure of the Thai economy changed considerably during the 1970s and 1980s,
because the Thai government pursued an intense industrialisation strategy. It focused
upon import-substitution and export-promotion policies, in conjunction with low wages
and low-price commodities, with particular reference to agricultural products.
Thailand’s efforts were directed at diversifying the agricultural/industrial economy as a
means of economic growth, and with the aim of increasing the gross national product. It
was thought that this would obtain a more balanced development of agriculture and the
industry sectors, but mainly centering interest on the industrial sector.
7
In accordance with this policy, Thai firms increased their investment with short-term
borrowing from foreign financial institutions, and increased their cooperation with
foreign firms.
This became a major disadvantage for the Thai industrial sectors because it increased
their dependence on imported technologies, mainly from Japan, Western Europe and the
United States (Herderschee, 1996). However, the Thai industry could not increase its
capacity for the absorption of new technologies or make further use of technology
transferred from foreign firms because of misplaced Thai investment: primarily in the
finance and real estate sectors. At this stage industry, in general, was not prepared to
develop its own technology. This attitude caused a serious problem for the economy.
From the beginning of 1971 until 1995, the growth rate in the Thai economy was, on
average, in excess of 7%, with moderate inflation at a stable exchange rate. The strong
growth rate was accompanied by high savings rates (Dollar, 2000). This factor
contributed to the success of the Thai economy. A buoyant export performance,
dynamic investment, and private sector development strategies propelled this extended
period of growth.
In the early 1990s, Thailand embarked on a course of deregulation and financial
liberalisation starting with the acceptance of the International Monetary Fund (IMF).
This phase of capital liberalisation and capital flows caused deregulation in the
operation of financial institutions, and the partial entry of foreign competitors in the
domestic financial system. The liberalisation and globalisation of the financial system
without adequate safeguards against ineffective management of resources resulted in an
economic crisis in 1997. This affected Thai society by increasing unemployment, and
the closing and restructuring of businesses.

8
The Thai economic crisis was caused by both external and domestic factors, which in
many instances were interrelated. One of them was the exceptionally high rate of
growth, driven for many years by foreign investment and exports. Part of the foreign
capital was allocated to investments in non-tradeable sectors such as Property,
Construction, and Real Estate, which consequently generated an asset price bubble and
misallocation of economic resources. This shows a greater need for investment in the
industrial sector and improvement in technologies and services to avoid further crisis.
Figure 2.2.1 Number of Factory Closures in Thailand in 1998
Sources: Industrial statistics: annual report 1998, Department of Industry Promotion
The Thai economic crisis during January-March 1998 had the effect of closing down
factories as shown in Figure 2.2.1: of this total 59.6% were agricultural manufacturing
factories. A number of factories in the agricultural, construction, timber, furniture and
textile sectors laid off a total of 23,891 employees (Appendix A). To improve this state
of affairs, Thai Industry has to develop appropriate technologies in the agricultural
manufacturing industrial sector, which is the basic premise of this thesis.

9
2.3 Classification of Thai Industry Sectors
Industry is an important factor in the Thai economy. It can be classified into the
standard ISIC categories (Appendix A):
(1) Primary industries concerned with natural resources including agriculture (farming)
and mining;
(2) Industries converting the output of the primary industries into products;
(3) Tertiary industries including the service sector of the economy (Table 2.3.1).
Table 2.3.1 Specific Industries in the Primary, Secondary, and Tertiary Categories, based on the International Standard Industrial Classification (ISIC)
Source : Manufacturing Operations, Groover ,2001
2.4 Industrial Transition
Since the Thai government launched its industrial strategies in 1960, including import
substitution and export promotion, the structure of the Thai economy has changed. In
1985, for the first time, the industrial sector performed better than the agricultural
sector, a condition necessary for becoming an NIC (Newly Industrialising Country).

10
Herderschee (1995) shows that the proportion of agriculture in the real GDP had fallen
continuously since 1985. In fact, the decline had started as soon as the Thai government
launched its first economic development plan in 1961, when the agricultural sector
made up 40% of the GDP. In 1997, the proportion of agriculture in the total GDP was
9.5%, which is much smaller than the 42.8% of the industrial sector. It also shows that
the rising proportion of industry matched the falling proportion of agriculture (20% in
1999).
It will be shown below that industry exports also exceeded those of agriculture as early
as 1985, thus fulfilling another condition necessary for becoming an NIC. However, the
GDP per capita income of Thailand was still too low, even in 1990, to qualify as an
NIC. Since then the growth rates of industry in general as well as other related
agriculture and manufacturing have been increasing rapidly. If these trends continue, the
NIC status will become obtainable in the near future. It can be seen from Table 2.4.1
that the growth rate of the agricultural sector between 1977-1987 was 3.5%, which is
quite high compared with the period between 1988-1998, when the corresponding rate
of growth was 2.6% (Bank of Thailand, 2000).
Table 2.4.1 Share of Gross Domestic Product by Industrial Origin and Growth at
1980 Prices
Source: Bank of Thailand, 2000 (Manufacturing is included under “Industry”)
The industrial sector has been the largest sector since 1985, its growth rate having
increased from 6.9% between 1977-1987 to 8.8% between 1988-1997. At the same
time, Thai manufacturing exports expanded their markets to the USA, EU, Japan and
now included new markets (Bank of Thailand, 2000).
11
In 1997, during the economic crisis, the percentage growth rate of the industrial and
manufacturing sectors in the composition of the GDP fell to –0.6% and 2.5%
respectively. Thailand was undergoing its economic crisis. The manufacturing sector
increased to 6.2% between 1977 and the end of 1987, and started to increase again in
1998 (Bank of Thailand, 2000).
As mentioned above, Thailand adopted an import substitution policy in the early stages
of its industrialisation. In the early 1960s, the authorities adopted an industrial strategy
based on the private sector. The Board of Investment (BOI) was created to administer a
package of investment both from within and outside the country (Kohta,1990). Local
and foreign investments were actively promoted through investment promotion
packages (import-substitution strategy), which included guarantees against
nationalisation and competition from state enterprises; tariff and business tax
exemptions on imports of capital goods and raw materials, two-year corporate tax
holiday, and the possibility of import surcharges on competing imports.
However, the growth in the industrial sector was limited by the demand in the domestic
market and the role of the public sector was limited to providing a basic infrastructure.
In addition, there was the need for intermediate and capital goods to be domestically
produced in order to reduce the demand for imported finished consumer goods. In 1972,
the government improved its incentives for export of industrial products and because of
the skills adopted and low domestic labour cost, Thai exports enjoyed a comparative
advantage over many competitors, resulting in a sharp growth in export goods. Many
manufactured products such as garment, footwear, jewellery and processed food were
exported from the 1970s.
In the mid-1980s, the industrial development strategy was, in turn supported by changes
in financial policies. The value of the exchange rate with the US dollar was fixed in
1963. In addition, the economy was very open with current account transactions
generally free, and capital control was limited to outflow. As a result of these policies,
investment soared during the 1980s. Industrial output grew rapidly, initially in
agricultural industries such as food processing, textiles, and then in heavy industries
such as petroleum refining and transport equipment.

12
Although agriculture remained the prime industry in the economy, its share in the GDP
fell sharply. Added to this, the dominance of rice and other traditional crops began to be
challenged by new export goods such as sugarcane and cassava. This development was
greatly facilitated by substantial improvements in the infrastructure, especially
irrigation, electricity supply, transportation and the expansion of the commercial
banking system.
However, the development of the industrial sector has been limited due to major
obstacles not only in terms of infrastructure, but also due to shortages of skilled and
qualified staff in the fields of high technology and science required for advanced
manufacturing processes (Bhumiratana, 1990). The infrastructure bottleneck arising
from the rapid growth of the industrial sector is an increasingly serious problem. At the
same time, there have been grave shortages of qualified staff, in particular skilled
engineers and technicians. Consequently, environmental problems and a deterioration of
income distribution were also becoming major issues.
2.5 Export-Import Patterns
Since domestic production and the import and export of Thai industrial products are all
related, it is appropriate at this point to examine the structural changes in the Thai
economy. The expansion of the Thai economy from the late 1980s onwards depended
on rapid growth in exports and direct foreign investment, especially in 1995. There
were, however, a number of obstacles to continuous growth, relating to both trade and
investment. As mentioned above, political unrest was a major factor. In addition, the
prolonged recession in the US and European economies, as well as the deterioration of
the Japanese economy, influenced Thailand’s economic growth (Wilson, 2000).
The substantial increase in Thailand’s total exports in 1988 was seen as an important
factor contributing to the size of economic growth. As shown in Table 2.5.1, in 1989,
exports brought an income of 516,315 million baht, an increase of 21% over the export
values of 1987. The growth rates of total exports in 1991 and 1994 were about 18% and
12%, respectively (Department of Customer, 1998). Between 1991 and 1994, the export
growth rate had declined in response to external and internal developments.

13
The total growth rate of export in 1996 (0.33%) was less than in 1995 (19.0%), 1994
(18%), and 1997(11.2%). The growth rate declined continuously from 1991 until the
end of 1993. However, a better performance in 1994 led to a slight improvement by the
end of the year and the growth rate of total exports slowly rose during 1995 and 1996.
Table 2.5.1 also shows that industrial exports constituted the highest portion of
Thailand’s total exports in 1996 (about 73.0%).
Table 2.5.1 Structure of Thailand’s Export Products (Unit: Million Baht)
Source: Department of Customs, Year 1998
The major industrial exports that enjoyed high growth rates included plastic products,
computer components, electronic circuits, and processed food. However, the US was
still the major market exporter, followed by Japan, Singapore, the Netherlands and
Germany. Apart from exports, imports are a major factor that need to be considered.
Figure 2.5.1 shows that the rapidly growing economy of 1991 gave rise to a greater
demand for imported goods, intermediate products and raw materials. Total imports in
1991 amounted to 959,408 million baht, an increase of 11.49% over the value in 1990
(Department of Custom, 1998)
14
Figure 2.5.1 Thailand’s Import Product Source: Department of Business Economic, 2000 and Bank of Thailand 2000
In 1997, 1998 and 1999, the growth rates of total imports were similar to those of
exports: the growth rates of total imports were about 4.7%, -8% and 6% respectively.
These growth rates were less than those of 1991, 1992 and 1993. In 1997, Thailand was
hit by an economic crisis; hence, the above outcomes were affected by the demand for
imported goods, in particular, arising from decreased investment and production of
manufactured goods.

15
2.6 Direct Foreign Investment Electrical/Electronic Products
in Thailand
Investment in the Thai electrical/electronic industry mostly comes from abroad or as
joint ventures under the control of overseas companies. This sector of the industry is
quite small and almost all Thai producers operate either small or medium scale
businesses. Their production lacks transfer technology and is limited to assembling
parts. However, there are opportunities for these industries to expand their exports and
create linkages if transfer technology is utilised.
Direct foreign investment in Thailand had a particularly strong effect on the Thai
economy. These were not necessarily beneficial in the long term. The example of the
Thai electrical/electronic industry is an example of the effect of foreign investment on
the Thai economy. Thailand’s strategy for export promotion has maintained the growth
of direct foreign investment in Thailand, which had been growing since industrialisation
began in the early 1970s. During that time, investments averaged 18,000-19,000 million
baht but between 1994-1995, it increased sharply (Dollar, 2000). As shown in Figure
2.6.1, the total amount of foreign investment increased from 31,368.047 million baht in
1994 to 247,192 million baht in 1995.
As shown in Figure 2.6.1, more than half of the additional investment in 1995 came
from Japan (26.39%), followed by Hong Kong with a share of 13.44% and then by the
USA and Taiwan at 13.41% and 5.5% respectively (Bank of Thailand, 1996). The main
reason foreign firms invested in Thailand was because they could get greater benefits
from the Thai export policies. Recipients of the Thai export promotion were classified
into two groups: A and B.
Group A consisted mostly of capital-intensive industries such as the chemical industry,
electrical/electronic appliances, automobile, and shipbuilding industries which were
exempted from import duties, business, and sales tax on raw materials for five years
(Kohata, 1988). However, electrical/electronic assembly is classified under Group B
and was exempted from 50% of import duties, business and sales tax for five years.
16
Group A normally received the higher level of promotion. The majority of Thai
companies were categorised in this group. Small-scale entrepreneurs who were not
given promotional privileges faced problems of tax structure, resulting in disadvantages
in investment costs. This investment promotion is still provided by the Board of
Investment (BOI). However, this policy was not useful when applied to the promotion
of investment in Thailand to foreign firms (Krongkaew, 1995).
The substantial increase in Thailand’s total electrical/electronic exports in 1997 was an
important factor determining the size of economic growth. The export structure of
electrical/electronic products increased every year. As shown in Table 2.6.1, exports of
Thai electrical/electronic products were 601,151.4 million baht, an increase of
791,462.1 million baht, or 6.67% over the value of imports in 1998. Export data from
various sources shows good correlation (Appendix A). The majority of Thai
electrical/electronic products export were made up of integrated circuits, computers,
components, and televisions. The highest value exported item was PC Packaging
(about 58,538.6 million baht), and hard disks gained the greatest net profit for this
period (Bank of Thailand, 1996). Figure 2.6.1 Net foreign Investment Flow in the Thai Electrical/Electronic Sector
Classified according to Country
Source: Bank of Thailand, 1996
17
Table 2.6.1 Structure of Thai Electrical/Electronic Industries (Unit: Million Baht)
Source: Department of Business Economics, 2000
The majority of Thai industrial exports were electrical/electronic products destined for
industrial markets such as the US, Japan, Singapore, China, Malaysia, Taiwan, South
Korea and Germany (Department of customs, 1998). As a result, it can be seen that
foreign firms still have total control in the Thai electrical/electronic industry, including
imported raw materials, design and assembly products, manufacturing processes,
production of brand name goods, and export products. The only benefit for Thailand is
the creation of employment. For example, production costs for one computer monitor is
76.8% for imported raw materials, 13.6% for Thai domestic raw material, 2.5% for
labour costs, and 5.5% for overhead costs.
The current problem relating to foreign trade and investment in Thailand is the
competition with labour costs in other Asian countries, especially China. The Thai
government needs to put more emphasis on making this industry competitive in the
international markets. This industry must consider using more advanced technology if higher quality is its main objective rather than relying on the present low wage rates to
create its advantage. To solve this problem, this industry has to focus on employment
and labour training, company taxation, and transfer of technology to Thai firms and the
creation of Thai brands for export. This will make the Thai industry more competitive in
the international market.

18
2.7 Thai Agricultural Products
Thai agriculture helps the budding industrial sector by supplying food, labour, market
outlets, saving foreign exchange, which is necessary for industrialisation. In doing so,
the agricultural sector has been subjected to government taxation and various other
restrictions that have benefited the industrial sector. The structure of Thai agricultural
products is shown in Figure 2.7.1.
Figure 2.7.1 Sector Classification for Thai Agricultural Manufacturing Industry
Agriculture
Farming Agricultural Manufacturing Industry
Food processing Canning and preservation of meat, fruit and vegetable Canning and preservation of fish and other sea products Noodle and similar products Sugar products Coffee and tea processing Soft drink and carbonated beverages
Non- food processing Leather products Footwear, except rubber Wooden furniture and fixtures Pulp, paper and paperboard product Rubber sheet and block rubber Other rubber product Wood production Textiles
Rural industry

19
For the purpose of this thesis, the traditional crops of Thailand ‘s agricultural products
will be classified into two categories. The first is extended farming, for growing maize,
rubber, cassava, upland rice, sugar cane, sorghum and other crops outside the existing
farm holding and using common land. The second is intensive or rotation crops, grown
as a supplement income, including tobacco, mung beans, groundnuts, cotton and
soybeans mainly within the farm holding. These products are the important raw
materials used to supply Thai industries.
The volume of agricultural output, which has been generally forecasted to grow, is
expected to lead to a continued fall in agricultural prices. Even though there is a rising
trend in inflation, it is expected to still remain at a low level. Agriculture is important to
the Thai economy in five areas: (1) the increase of food supplies for domestic
consumption; (2) the release of labour for industrial employment; (3) the increase of the
size of the market for industrial output; (4) the increase of the raw material supplied for
agricultural industries, and (5) the earnings of foreign exchange capital.
Agriculture has contributed decisively to the significant industrialisation process in
Thailand. It has provided cheap raw material and supplied labour to various industries.
Agricultural exports, as a source of foreign exchange, have helped the country to earn
much needed income.
2.7.1 Definition of the agricultural manufacturing industry
The classification within agricultural manufacturing industry is arranged by size of
company, for example category D International Standard Industrial Classification of All
Economic Activities, ISIC: REV3, (Appendix A). This covers all manufacturing
establishments in Thailand employing 10 or more persons. Manufacturing is defined as
the mechanical or chemical transformation of substances into new products whether the
work is performed by power-driven machines or by hand, whether it is done in a
factory, a workshop or a household.

20
2.7.2 Definition of food processing industry
The food processing industry processes agricultural products for public consumption or
to be used as ingredients for further processing for human consumption. This industry
encompasses the preservation of agricultural products as semi-dried products after
initial or intermediate processing or as finished products.
2.8 Agricultural Manufacturing Industry
The agricultural manufacturing industry is very important to the Thai economy, because
it is the link which forms a relationship between domestic agriculture and the industrial
sector. This means that the agricultural manufacturing industry has given added value
to agricultural products in the form of manufactured products. These include processed
food, textiles and garments. This sector also made up about 17.34% of the export
products of the GDP in 1998 (Bank of Thailand, 2000). During the Thai economic
crisis, the agricultural manufacturing industry was not affected by such factors as
currency exchange rate and decreased exports because this sector mostly used domestic
raw material in its products, and it benefited from the currency exchange rate of exports
in the world market. The Thai agricultural manufacturing industry was more highly
competitive in the world market because Thai expertise in this field helped to develop
new technologies, better quality and low-cost products.
However, the Thai agricultural manufacturing industry now faces a problem in
increasing exports to the world market, due to bottlenecks in raw material supply, poor
infrastructure, promotion by tax breaks, poor labour skills and business management.
The agricultural manufacturing industry can be classified into two groups of products:
(1) food processing and (2) non food products.
2.9 Food Processing Industry
Exports from the food processing industry can be classified into 5 main sectors: fishery
products, livestock, canned food (fish, crustaceans, vegetable, fruit and other), rice and
cereals. In 1988, about 6,000 factories were involved in food processing employed
330,000 workers and raised revenue of 111,117 million baht, 8% of GDP. (Department
of Industry Promotion, 2000). In 1998, the export value was about 233,001 million baht.

21
The important markets were Japan, USA and the EU, with good opportunities for future
expansion into Canada, Australia and Asia. The Efficiency of Productivity Rate (ERR)
of production has been affected by tariff barriers and free trade agreements (World
Bank, 2000). This is because it no longer has a cheap labour force and Thai producers
get lower benefits from free trade.
Producers, when applying the Domestic Resource Cost (DRC), have the capability of
increasing production for export because the unit cost of domestic raw material is
cheaper than the imported (World Bank, 2000). Moreover, Thai export products were
competitive, according to the Revealed Comparative Advantage (RAC) index, and
compared to other products whose competitiveness decreased due to shortage of raw
materials and increased processing costs.
This type of food processing was aimed at reducing imported products used in the
domestic market. Domestic products such as animal food had an added value in the
market place of about 9,717 million baht: vegetable oil, 6,164 million baht and mill
products, 6,146 million baht. The local agricultural manufacturing industry sector had
added value to the raw material products from farming (Department of Industry
Promotion, 2000). For the food processing industry, cassava is the most important
product in Thailand. Cassava has several advantages: it can be grown almost anywhere,
even in very poor soil, is highly tolerant to drought and pests, and yields are high. The
cassava product industry has created employment for about 3 million people (TDRI,
1983). Cassava food products, along with non-food cassava products have an annual
export value of more than 20,000 million baht each year. Fifty-five percent of cassava
products used for Thai domestic industry are processed and exported to the EU. The
rest is made into cassava starch, which is exported to foreign markets and used as raw
material in domestic industries e.g. food, drink, candy, medicine, dental and seasoning
powder.
At present, Thailand has developed several uses for cassava starch. Nevertheless, to
maintain its past competitiveness, Thailand has to develop better technologies for
production that will increase the quality of products and reduce cost to compete in the
world market.

22
2.10 Non food products
There are about 8,110 factories in the non-food processing sector. This sector has a
total investment of about 74,200 million baht and 281,829 employees. In 1998, the
value of the export industry was about 136,808 million baht (Ketnin, 2000). Its exports
were rubber sheets, rubber blocks and rubber products (67%), with wood, furniture,
tanneries and leather finishing (12%). The main markets were Japan, US, EU and other
Asian countries. Considerations about competitiveness using the RCA index shows that
Thailand was highly competitive with regard to rubber sheets. The paper and paper
board industry produced approximately 626,000 tons according to an annual report that
was done in order to reduce imports during the last ten years.
The agricultural manufacturing industry is related to the rural industry the most
important sector in Thailand. The Thailand Development Research Institute (TDRI)
(1985) suggested that the rural industry represents an increasingly important concept in
the context of the Thai economy. There are many reasons for this; one of the more
important concerns is the emergence and dominance of a large city or a few highly
industrialised cities. This phenomenon has serious implications on the pattern of income
distribution and social activities between big industrialised cities in the rest of the
country. Large numbers of rural people are attracted to big cities and this creates
numerous social and economic problems. Another important aspect of the rural industry
is that it represents a process that can contribute positively to better distribution of
development benefits. The rural industry can also be looked on as a means of reducing
employment problems in less developed areas. This decentralisation can contribute to
better utilisation of existing labour particularly in the agricultural sector, the dominant
sector in Thailand.
For example, cottage industries creates jobs for more than 900,000 households or
1,700,000 people and make up 87% of agricultural manufacturing industry producers.
Production is still mostly carried out by small firms, which use simple equipment, with
a product value of about 300,000 baht per year. Therefore, it can be said that rural
producers are important in producing raw materials for the industrial sector.
23
2.11 Relative Importance of the Agricultural Manufacturing
Industry and the Electrical/Electronic Industry
In 1996, the agricultural manufacturing industry export decreased 0.01% of GDP and
increased to 17.27% in 1997, and 18.26% in 1998. The average export output ratio for
the electrical/electronic sector was twice that of the agricultural manufacturing industry,
increasing from 28.28% in 1997 to 65.57% in 1998 (Bank of Thailand, 2000). This
represented a drastic change in the Thai export structure. As recently as 1995-1999, the
export value of the agricultural industry was higher than that of the electrical/electronic
industry. Figure 2.11 shows that since 1997 the Thai electrical/electronic exports began
to match the agricultural manufacturing industrial exports (Bank of Thailand, 2000). At
present, Thailand's export industries are especially vulnerable to increases in labour
costs for two basic reasons. Firstly, many of Thailand's most successful export
industries are highly labour-intensive, so that an increase in wages has a large effect on
their costs (Tabucanon, 1993). Secondly, these export industries have little bargaining
power to counter the highly competitive international markets for their products. This
means that cost increases cannot be passed on in the form of increases in the
electrical/electronic products. The profit margin is small.
Figure 2.11 shows that the trade balance for Thai export products in the agricultural
manufacturing industrial sector exceeded that of the electrical/electronic sector. Also,
the agriculture manufacturing industry benefits the Thai economy by using more
domestic raw material compared to the electrical/electronic sector which imports more
than 60 % of its raw materials from overseas. Because labour in Thailand is no longer
cheap, it means that Thailand only gets the benefit of increased employment from the
electrical/electronic industry. However, the situation is changing and there are some
problems in export products because of an increase in price due to the increased labour
cost, lack of technically skilled workers and high risk of withdrawal of foreign
investment firms. The agricultural manufacturing industry is supplied with raw
materials from the agriculture sector, providing employment to the Thai agricultural
manufacturing industry. However, to increase competitiveness, the Thai agricultural
manufacturing industry needs appropriate technologies to improve quality and cost of
product, delivery, packaging, marketing, and organisation management.

24
Figure 2.11 Comparison of Trade Balance Figures for Thai Export Products Source: Comparison of trade balance figures for Thai export products
Based on Bank of Thailand 2000
2.12 Conclusion During 1978-1997, Thailand used a strategy focusing on export promotion. Like other
technologically underdeveloped counties, emphasis was placed on the importance of its
cheap labour costs that could be used for labour-intensive, low- technology export
goods. Such goods were cheaper than the same goods from industrialised countries, and
they could be sold both in the Thai domestic and international markets. These goods
are produced by both the domestic manufacturers and foreign firms (wholly owned or
joint ventures) that have their production base in Thailand. Thailand’s abundant labour
force had been seen as an attraction to foreign investors, and had formed the basis of an
export-led growth. In the short term, cheap and unskilled labour helped to promote
Thai industry, but in the long term, such labour could not support modern technologies
due to lack of proficiency. It is commonly accepted that this is what eventually led to
the Thai economic crisis of 1997.
At that time, Thai electrical/electronic producers relied heavily on the exploitation of
volume and low labour costs against foreign competition. In the future, such value-
based competition can no longer be maintained. It was found after the Thai economic
crisis, that electrical/electronic products could not compete in the market because these

25
products used imported raw materials, the cost of which increased more than 50%
because of the exchange rate. This caused foreign investors to lose interest in Thailand
and move their businesses to other countries with cheaper labour cost. The Thai
electrical/electronic industry’s profits have been declining due to labour cost
competition from other countries, such as China.
The other reason for the decline is that Thai firms had to import technologies at high
cost, increasing product price. Foreign firms are also reluctant to transfer technologies
to the local ones. This is an ongoing problem which seriously limits the growth of the
electrical/electronic industry in Thailand. In the Thai agricultural manufacturing
industry however, exports have increased dramatically. The fact that raw materials are
obtained from domestic agriculture allows products to be manufactured at low cost.
Low production cost and low exchange rate make agricultural industrial products
extremely competitive in the international market. The agricultural manufacturing
industry supports products from the agriculture sector, providing employment for 13
million in the agriculture sector, improving the quality of rural life and discouraging
migration into cities. One of the strong points of agricultural manufacturing is the
experience in developing technologies (R&D) and experienced workers. This should
lead to Thai-brand export products that are accepted by the international markets.
However, the Thai food processing industry sector needs new technologies for efficient
production of quality goods at prices that are competitive in the international market.
This thesis attempts to find appropriate technologies for the Thai agricultural
manufacturing industry to improve competitiveness of its products in the domestic and
international markets. New technologies are needed to make high value-added products
for the middle to luxury markets. This can be achieved by upgrading technologies and
machinery as well as the skill base, such as quality management, knowledge, production
skills and maintenance of skill industrial personnel. Table 2.12 presents the advantages
of the Thai agricultural manufacturing industry and disadvantages of Thai
electrical/electronic industry. There is the possibility of expansion into in the Middle
East and the EU.

26
Table 2.12 Comparison of the Thai Agricultural Manufacturing Industry and Electrical/Electronic Industry
The agricultural manufacturing industry The electrical/electronic industry - Income generated goes back into Thailand - Most of the raw material used comes from the
domestic market - 1,778,300 people were employed in the
agricultural manufacturing industry, 800,000 people in rural industry and there is a relationship with13 million farmers.
- The world market has accepted Thai brand industry.
- There are Thai firms with experience in R&D and skilled labour in this sector.
- It supports the quality of life that is created by employment opportunities for local society, and halts the exodus from country labour to Bangkok.
1. Most of the raw material is imported from overseas.
2. Business depends on foreign firms: - There is a high risk of foreign investment moving out because of highly competitive labor - intensive services of other countries such as China, Vietnam , Indonesia, and the Philippines. - Used foreign brand names to export. - Problems in transferring technologies
between local and foreign firms. - High cost of investment in new technologies,
because almost all Thai firms have had to import technologies.
- Foreign firm control nearly everything in this business, i.e. investment, importation of raw materials and export products.
- Increased employment opportunities. The income generated is salary.
3. Payment to local employees: - low skill of labour force - lack in engineering knowledge to support
industry - Ineffective organisational management. 4. Most of the raw material is imported from
overseas.
27
Chapter 3
Analysis of Thai Food Processing Industry and
the Importance of SMEs
3.1 Introduction Thai agricultural manufacturing-based industries, especially the food processing sector,
are considered to have the most potential for high growth. This growth is able to add
more value to agricultural products, and hence increase their price, reduce price
fluctuations, stimulate increased production, and foster distribution efficiency in the
agricultural sector. Food processing is the most important sub-sector industry in
Thailand. Food production in Thailand is based on local raw material, comprising fruit
and vegetables, cereals and oilseed, fish and livestock (Asia Pacific Food Industry,
1991), and accounts for approximately 30% of the total industrial sector production.
Food processing product exports were valued approximately 402,070 million baht in
1998 (Bank of Thailand, 1999). The major export items are chilled and frozen prawns,
fish and canned pineapple.
This chapter provides contextual information regarding the role of the food processing
sector in the agricultural manufacturing industry. Starting with an overview of key
development objectives identified within the national planning process, the discussion
shifts to the key characteristics of the Thai agricultural manufacturing industry, focusing
on the food processing sector.
.
3.2 Moving Towards Industry-Based Agriculture
As agricultural production techniques advance, surplus production increases. To benefit
from the surplus, technologies have been developed for handling and processing the raw
material by drying, freezing, milling, or manufacturing processing, and strengthening
the commodity’s value. These are advances in the industry that are largely responsible
for the transformation of an agriculture manufacturing based industry. Linkages with
farmers and farmers’ organisations either through contract farming or other types of
business operations were also established (Chayowan, 1997).

28
As Thailand adopted the 5-year National Economic and Social Development Plan to
promote the country’s development, the share of the agricultural sector in the country’s
GDP declined significantly from 24.9% in 1980 to 11.1% in 1995. However, the
manufacturing sector share increased from 21.7% to 28.2% during the same period
(Department of Custom, 1998). Such a change is common to a country in transition
from an agricultural to an industrial economy.
3.3 Thai National Economic Objectives for the Agricultural
Manufacturing Industry
Since 1961, the government has been using a national development plan to establish the
framework and guidelines for national development. The plan includes the allocation
and management of economic, natural, human, and financial resources, and government
administration machinery in order to improve the quality of life and safety. National
economic development work has expanded to encompass various development sectors.
This has led to an increase in production capacity, job creation, national revenue and
economic growth (TDRI, 1989). One of the target industries in this plan is the
agricultural manufacturing industry for which the guidelines are as follows:
1. Develop and support agricultural manufacturing industry that has a high
potential for export or import substitution in accordance with the needs of
markets and buyers, production inputs of each region and the potential of each
locality.
2. Expand the production base into new agricultural manufacturing industry with
high market potential from surpluses of such raw materials as rice, cassava and
rubber, and foods with developmental potential such as food processing from
fruit and vegetables and health foods from medicinal plants.
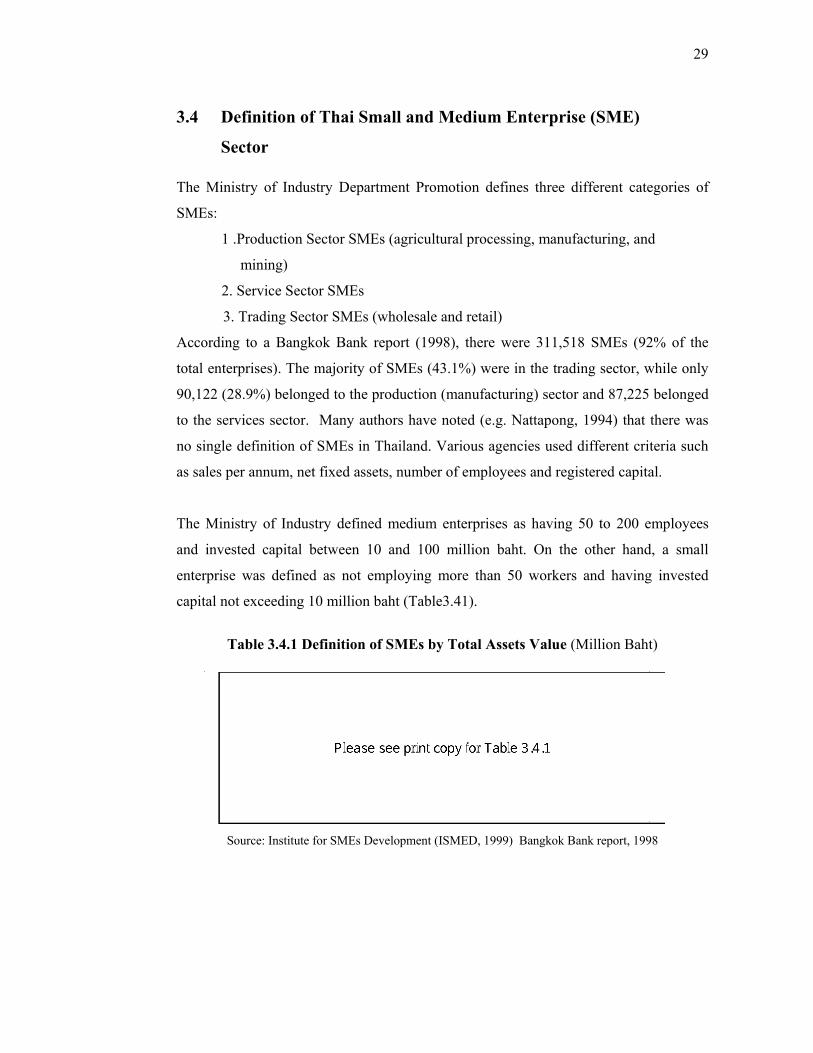
29
3.4 Definition of Thai Small and Medium Enterprise (SME)
Sector The Ministry of Industry Department Promotion defines three different categories of
SMEs:
1 .Production Sector SMEs (agricultural processing, manufacturing, and
mining)
2. Service Sector SMEs
3. Trading Sector SMEs (wholesale and retail)
According to a Bangkok Bank report (1998), there were 311,518 SMEs (92% of the
total enterprises). The majority of SMEs (43.1%) were in the trading sector, while only
90,122 (28.9%) belonged to the production (manufacturing) sector and 87,225 belonged
to the services sector. Many authors have noted (e.g. Nattapong, 1994) that there was
no single definition of SMEs in Thailand. Various agencies used different criteria such
as sales per annum, net fixed assets, number of employees and registered capital.
The Ministry of Industry defined medium enterprises as having 50 to 200 employees
and invested capital between 10 and 100 million baht. On the other hand, a small
enterprise was defined as not employing more than 50 workers and having invested
capital not exceeding 10 million baht (Table3.41).
Table 3.4.1 Definition of SMEs by Total Assets Value (Million Baht)
Source: Institute for SMEs Development (ISMED, 1999) Bangkok Bank report, 1998

30
3.5 Definition of Thai Food Processing Industry A food processing industry is based on using agricultural products as ingredients for
further processing. This includes the preservation of agricultural products e.g. semi-
dried after the initial or intermediate processing, tinned or finished packaged products.
3.6 Food Processing Industry in Thailand Development of the food industry was associated with the country’s entry into
international trade. A highlight of the industrial development of the food processing
industry during the years 1990-2002 was its realignment with greater emphasis on
quality and food safety. Thailand responds to competition in terms of a cheaper
production basis and an improving quality of products (Suwannaporn, 2000).
Responding to customer needs, greater emphasis is placed on hygiene and sanitation
during production, food safety, wholesomeness, lower production costs, value-adding,
and adherence to environmental regulations.
The Thai government is trying to encourage the upgrading of the food processing
industry by greater recognition and the need to conform to international standards and
practices (HACCP and GMP). There is a need for automation of processes for improved
throughput and reduced contamination, process technology upgrading, new methods of
preservation of cooked, prepared and ready-to-cook products, and production R&D
(Sinnawat, 2004). An important characteristic of the manufacturing sector in Thailand
is the predominance of SMEs. At the end of 1998, the Factory Control Division of the
Ministry of Industry announced that approximately 98% of the total registered factories
in Thailand were SMEs. Therefore, the trade data will be used to analyse trends in the
food processed industry for SMEs in Thailand (Table 3.6.1). Table 3.6.2 shows the
proportion by factory, investment and employment.
Thailand is amongst Asia’s largest trading countries in agricultural products. More than
60% of the total labour force involved is in the agricultural sector. It is the major
exporter of agricultural products such as tapioca, rice, kenaf, castor bean, rubber, corn
and sugar. Thailand also produces and exports large quantities of wood, livestock and
fish products.
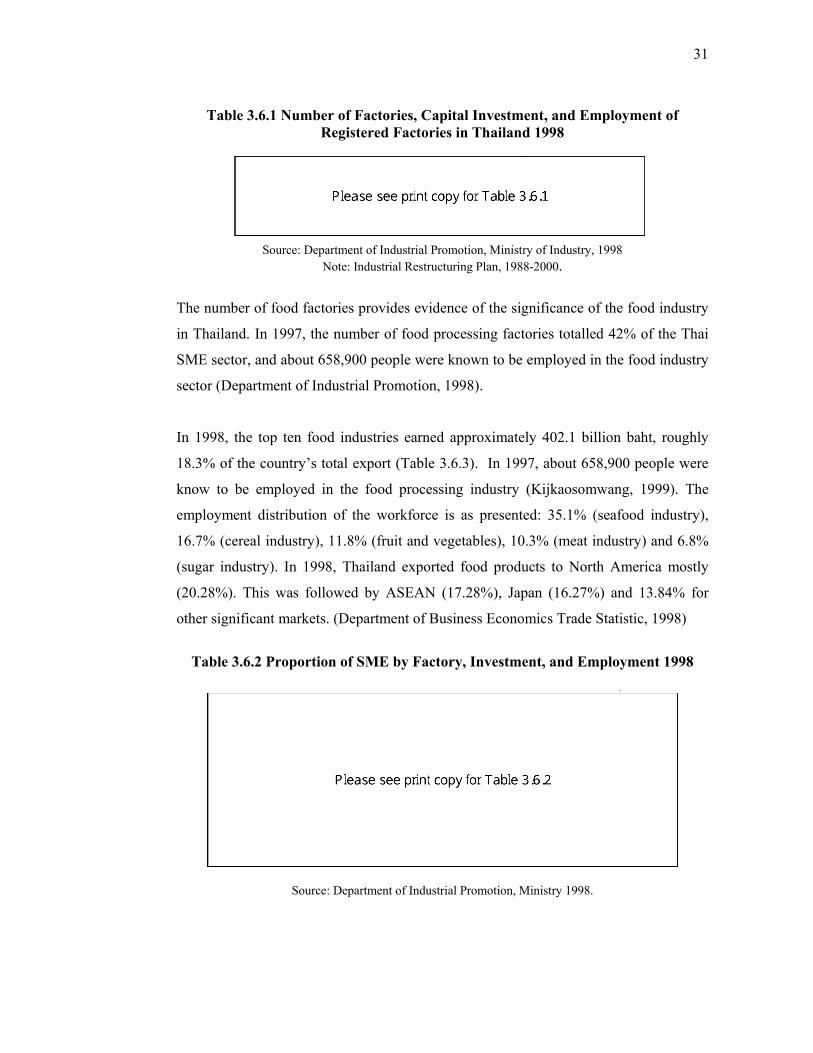
31
Table 3.6.1 Number of Factories, Capital Investment, and Employment of Registered Factories in Thailand 1998
Source: Department of Industrial Promotion, Ministry of Industry, 1998
Note: Industrial Restructuring Plan, 1988-2000.
The number of food factories provides evidence of the significance of the food industry
in Thailand. In 1997, the number of food processing factories totalled 42% of the Thai
SME sector, and about 658,900 people were known to be employed in the food industry
sector (Department of Industrial Promotion, 1998).
In 1998, the top ten food industries earned approximately 402.1 billion baht, roughly
18.3% of the country’s total export (Table 3.6.3). In 1997, about 658,900 people were
know to be employed in the food processing industry (Kijkaosomwang, 1999). The
employment distribution of the workforce is as presented: 35.1% (seafood industry),
16.7% (cereal industry), 11.8% (fruit and vegetables), 10.3% (meat industry) and 6.8%
(sugar industry). In 1998, Thailand exported food products to North America mostly
(20.28%). This was followed by ASEAN (17.28%), Japan (16.27%) and 13.84% for
other significant markets. (Department of Business Economics Trade Statistic, 1998)
Table 3.6.2 Proportion of SME by Factory, Investment, and Employment 1998
Source: Department of Industrial Promotion, Ministry 1998.
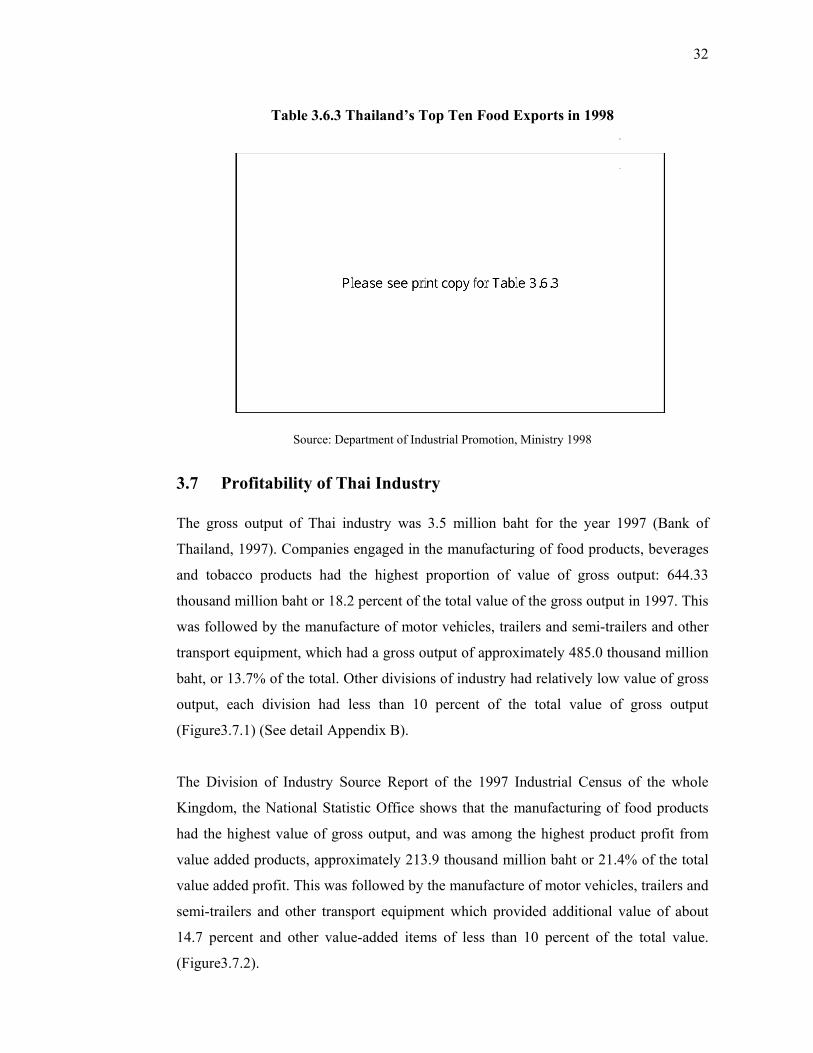
32
Table 3.6.3 Thailand’s Top Ten Food Exports in 1998
Source: Department of Industrial Promotion, Ministry 1998
3.7 Profitability of Thai Industry The gross output of Thai industry was 3.5 million baht for the year 1997 (Bank of
Thailand, 1997). Companies engaged in the manufacturing of food products, beverages
and tobacco products had the highest proportion of value of gross output: 644.33
thousand million baht or 18.2 percent of the total value of the gross output in 1997. This
was followed by the manufacture of motor vehicles, trailers and semi-trailers and other
transport equipment, which had a gross output of approximately 485.0 thousand million
baht, or 13.7% of the total. Other divisions of industry had relatively low value of gross
output, each division had less than 10 percent of the total value of gross output
(Figure3.7.1) (See detail Appendix B).
The Division of Industry Source Report of the 1997 Industrial Census of the whole
Kingdom, the National Statistic Office shows that the manufacturing of food products
had the highest value of gross output, and was among the highest product profit from
value added products, approximately 213.9 thousand million baht or 21.4% of the total
value added profit. This was followed by the manufacture of motor vehicles, trailers and
semi-trailers and other transport equipment which provided additional value of about
14.7 percent and other value-added items of less than 10 percent of the total value.
(Figure3.7.2).

33
Figure 3.7.1 Gross Output by Division of Industry Source: Report of The 1997 industrial census of the whole Kingdom, National statistical office
Figure 3.7.2 Value added by Industry Sector Source: Report of The 1997 industrial census of the whole Kingdom, National statistical office

34
3.8 Government Policies Development Plan: The Thai Food
Processing Industry
The Thai Government policies development plan places:
1. An emphasis on the manufacturing of high value-added product from
local raw materials aimed at the export market.
2. The protection of honest manufacturers.
3. Promotion of the health and welfare of consumers by supervised
hygienic production.
4. Development of quality control for production and distribution of food,
both domestic and international market in order to ensure that quality and
safe foods are supplied to consumers.
The government has not only provided agribusiness with promotional privilege
packages, but has also encouraged foreign investment, enabling many industries to
develop rapidly. For example the Korat plateau was developed using Dutch and Danish
capital and expertise. Capital and technology from Taiwan were brought in to initiate
modern fish and prawn farming (Ongsritrakul and Hubbard, 1996). European capital has
contributed to feed-mill ventures. The USA has played a leading role in fruit canning
causing the price of the country’s agricultural products to fall drastically while the price
of imported processed food soared.
This was the major push factor that drove Thai entrepreneurs to venture in to agro-
processing. The government, in its attempt to maintain a healthy trade balance, has
strongly supported the agricultural food processing effort, marking the beginning of the
agricultural manufacturing industry.
The implementation of the National Economic and Social Development Plans (NSDP)
boosted economic development because natural and human resources were abundant
enough to provide occupational opportunities for the vast majority (The Eight Nation
Economic and Social Development Plan, 1997). Thailand’s economic success, however,
did not come without a price, as many social and environmental problems emerged,
which decreased the quality of life of the people.

35
A competitive country greatly depends on the capacity of its industry to innovate and
improve existing technology (Olarikovit, 1996). Recognising the weaknesses of the
food export industry, the government has supported the establishment of agencies with
the mandate of assisting and promoting development of food technology, which is
aimed towards increasing food processing and production efficiency.
3.9 Classification of Food Processing Industry The food processing industry is one of the most important development strategies for
Thailand. It is able to use local raw materials and provides employment and income
distribution in the countryside. It also stimulates the expanding economy because it has
strong links with other sectors. Food processing accounts for the majority of all
manufactured exports. It can be broadly classified into Food Processing, Animal Feed
and Meat Production (Bunrong,1984). The food processing industry could be classified
in various ways, one of the simplest is according to functions of raw material
acquisition, manufacturing and distribution.
1. Raw materials acquisition includes maintenance of raw material, flow at
optimum level, quality control and proper storage prior to conveyance to the
production line.
2. Manufacture includes maintenance of adequate manufacturing pace, quality
control and proper future production schedules.
3. Distribution includes maintenance of steady, timely distribution to consumer
centres. Quality control is gained through proper storage, shipping, and
market conditions.
3.10 Common Food Processing Industry in Thailand
Thailand’s processed food exports comprise frozen and canned food, roughly in equal
quantities. Shrimp, cattle and fish are the most popular frozen foods, while pineapple
juice and seafood make up the major part of canned products. Other exports include
many varieties of fresh, and dried fruits and vegetables.

36
3.10.1 Fruit and vegetable processing Fruit and vegetables are mostly processed by canning, dehydrating, chilling, freezing
and traditional processes. Canned fruit and vegetables have become an important source
for the Thai economy. This industry provides a great number of job opportunities and
has brought about a broad spectrum of advantages including the growing number of
value added items for the farm produce concerned. The major products are canned
pineapple and pineaple juice, lychee, rambutan, long an, corn, mushrooms, bamboo
shoots and tomato products (Gerasotikun, 1997). Canned pineapples and pineapple juice
account for over 90 % of canned fruit and vegetable export.
There are several problems besetting the canned fruit and vegetable industry such as
quality and the irregular supply of raw materials, inefficient manufacturing processes,
and quality control, etc. The dehydrated fruit and vegetable market has undergone rapid
growth in recent years, with products such as dried pineapple, papaya, banana, long an,
etc. These are produced on a small scale or in village-type industries and mostly
consumed locally. But the demand for exported dehydrated fruit has increased over the
last few years.
Traditional and fermented fruit and vegetables are mostly made in the form of sun-dried
fruit, fruit jam or brine-picked fruit (Fonkegchai, 1998). The present production of
traditional and fermented fruit and vegetables is for local demand and mostly produced
in household or cottage-type industries. The destinations of Thailand’s fruits and
vegetables are EU23%, US 22% Hong Kong 8%, Asean 7%, China 4%, Taiwan 4%
Australia 2% and Others 30% (National Food Institute, 2001). To ensure food safety,
the government of Thailand is promoting Good Agricultural Practices in agricultural
production and GMP and HACCP in the processing sector.
3.10.2 Marine products The fish meat industry in Thailand has recently gained economic importance as is
evident from the amount of annual fish meat production, and its contribution to related
industries such as the animal feed industry and livestock production. In term of export,
Thailand has ranked as one of the most important exporting countries over the past few
years.

37
The fish meat industry is considered as primary in the sense that it produces a primary
processed product, which will be utilized by secondary and tertiary industries. This
helps to increase the value added of small fish which are caught along with larger fish.
Thailand is one of the leading countries in fish production. Since 1961, after the first
National Economic and Social Development Plan was initiated, commercial fisheries
have developed at an explosive rate. In 1997, the value of fish exports was about
288,332 tons valued at 19,847 million baht.
The major processed fish and seafood products are:
1. Canned fish
2. Frozen fish
3. Traditional fish processing
3.10.3 Edible oils
The major raw materials are rice, soybeans, copra, cottonseed and castor beans.
Thailand’s edible oil industries operate as joint ventures with foreign companies with
modern technology.
3.10.4 Dairy products and baked goods Large portions of all household sectors use sweetened condensed milk, while the
government tries to promote dairy production in order to be less dependent on imported
milk. There is a large domestic demand for flour mills that supply manufacturers of
noodles, breads, cakes, buns and rolls, cookies, crackers and biscuits, but large
quantities of these products still have to be imported. Thai milk products are mostly
exported to Asean countries. Many multi-national companies have invested in dairy
processing in Thailand. As such, dairy factories are mostly equipped with modern
facilities ensuring safe production. Most dairy companies are also HACCP certified.
3.10.5 Animal feed and feed production Food for animal feeding is considered as raw material as is animal products such as
meat, milk and egg. Thailand’s important animal feed products for exports include

38
cassava pellets, bran oil cake, wastes from vegetable oil production, fish and aqua-
culture fish meals and animal pet foods (Bunrong,1984). Thailand has for many years
ranked third in the world for cassava production following Nigeria and Brazil: 60% of
cassava is exported to the EU (National Food Institute, 2001).
Because of the new hygiene requirement imposed by the EU, all Thai cassava exporters
have either GMP or HACCP quality system in place. Pet food is Thailand’s second
major animal food export; approximately 10 million baht in 2001 (National Food
Institute, 2001). Major markets for Thai pet foods are Japan, Australia, USA, Malaysia
and Vietnam. Pet food production, like human food production is covered by the same
hygiene and manufacturing regulations.
3.10.6 Meat products As meat is a vital protein food of high nutritional value, meat/animal production in
Thailand has become more important in the past decades. Meat/animal product numbers
are expected to grow in the future, and total meat supplies should keep pace with the
country’s increasing population along with increasing income and general national
education growth.
3.10.7 Poultry Poultry production is now heading towards large-scale operations, with an integrated,
export-oriented industry. The feed companies and allied operations perform all the
processing, including slaughtering, dressing, chilling or freezing, packaging and sale of
final products on the export and domestic market.
3.10.8 Beverage industry The beverage industry can be divided into four main groups namely:
1. Non-alcoholic non-carbonated. This includes bottled water, mineral drink,
syrup concentrates, and fruit flavoured syrup and other powdered drinks such
as ginger, chrysanthemum juice, bale fruit juice and orange-flavoured juice.
2. Non-alcoholic carbonated beverage. This includes soda and other carbonated
drinks.
39
3. Alcoholic non-carbonated beverage. This includes wine, vodka, rum and
other liquors.
4. Alcoholic carbonated beverage. This is exemplified by beer and champagne.
The increasing popularity of beverages combined with their good taste and attractive
packaging has made the industry highly competitive. Most beverages cater for local
consumption although there are some that are produced for export.
3.10.9 Sugar and confectionery industry Thailand is the third among leading sugar exporters, behind Brazil and France. The Thai
sugar industry is not competitive because of its generally high production cost and
inherently low sugar cane productivity. To survive foreign competition, the government
often has to intervene by providing monetary support to farmers and factories.
3.10.10 Spice and condiment industry Thai foods are often hot and spicy. Hence, about 70-80% of the country’s spice and
condiment production is destined for domestic consumption. However, Thailand’s main
export markets for ginger, black pepper, dried red pepper, cinnamon, mace, nutmeg,
turmeric, curry, saffron and cardamom are Japan (26%), EU (24%), Pakistan (10%) and
the US (10%) (National Food Institute, 2001). Thailand also exports a number of
condiments including fish sauce, soy sauce, sweet black soy sauce, oyster sauce, chilli
sauce, and a condiment pack that goes with instant noodles.

40
3.11 Factories Based on Classification of Thai Food Processing
Industry The Department of Factories has classified the Thai food processing industry according
to the raw material based on The Thai Factory Act of 1992. Each raw material is
divided into subgroups based on unit operations or the combination of operations as
follows:
3.11.1 Tobacco curing factories
3.11.2 Agricultural product-related factories 1. Steaming, boiling or drying of vegetables, seeds, grains or kernels.
2. Grain or grain shelling.
3. Tobacco or hemp pressing.
4. Cotton milling or pressing, kapok spinning or pressing.
5. Warehouse or transportation of vegetables or grains.
6. Grinding of plant components excluding grain or plant head.
7. Charcoal from coconut kernels, charcoal grinding.
8. Plantation of orchids, bean sprouts and mushrooms.
9. Cleaning, separation, sieving by size or quality of agricultural products.
10. Protection of agricultural products by x-rays.
11. Egg hatching by heat ovens.
3.11.3 Dairy products factories 1. Bactericidal processing e.g. pasteurization.
2. Fresh milk from powdered milk.
3. Concentrated milk, powdered milk or evaporated milk production.
4. Cream produced from milk.
5. Cheese or butter production from milk.
6. Yogurt or sour cream production.

41
3.11.4 Marine-related factories 1. Packing of seafood for export
2. Seafood protection by heating, drying, chilling and cool storage
3. Finished seafood, skinned or waxed products
4. Oil or wax extraction purification from seafood
5. Cleaning, dissection, boiling, carving, frying or grinding of seafood
3.11.5 Edible plant oil or animal oil-related factories 1. Plant or animal oil extraction
2. Pressing or mixing with the remains of plant or animal after oil extraction
3. Plant oil from hydrogenation
4. Purification of plant or animal oil
5. Cream of mixed oil for cooking
3.11.6 Vegetable and fruit related factories 1. Packaged products of food or drink from vegetables or fruits
2. Vegetable or fruit preservation by vaporization, drying, stirring, pickling
and chilling
3.11.7 Grain or plant head-related factories 1. Rice milling
2. Starch production
3. Grinding or mixing of grain or plant head
4. Finished food production from grain or plant head
5. Plant head peeling or cutting to required shape
3.11.8 Sugar production from cane, beet, sweat grass 1. Syrup production
2. Red sugar production
3. Raw sugar or sugar production
4. Raw sugar or purge sugar purification
42
5. Sugar lump or powdered sugar production
6. Glucose, dextrose, fructose or related product processing
7. Sugar from other plants (excluding sugar cane)
3.11.9 Tea, coffee, chocolate or dessert related factories 1. Tea drying or powdering
2. Roasting, grinding or mixing coffee or powdered coffee production
3. Powdered cocoa or desserts from cocoa production
4. Chocolate or powdered chocolate or dessert from chocolate production
5. Ginger or other plant powdering
6. Tamarind, lemon or others fruit palletizing
7. Syrup steeping or coating of fruit and peel
8. Drying and frying of nut or coating of the nuts with sugar, coffee, cocoa or
chocolate
3.11.10 Cooking ingredients related factories 1. Baking flour for bread production
2. Flavour enhancer and food colour production
3. Leavening agent starch production
4. Vinegar production
5. Mustard production
6. Sludge oil production
7. Grinding or mixing of spices
8. Chilli pepper grinding
3.11.11 Spirit boiling, distillation or mixing related factories
3.11.12 Malts, beer related factories
1. Malt grinding
2. Beer production

43
3.12 Conclusion The Food processing industry is one of strategic importance for the Thai economy. This
industry uses local raw materials and provides 42.2% employment. The Thai Food
processing industry can be broadly classified into food processing based on common
raw materials and unit operation that divides processes into subgroups. The Thai
economy depends to a great extent on the success of many small SMEs. Although a
number of large-scale companies, equipped with modern facilities and with GMP and
HACCP quality systems in place, are currently exporting, the industry is still largely
dominated by small and medium scale enterprise that cater to local markets. To upgrade
their production to international standard, they need to increase investments to improve
their food quality assurance system as well as their processing and packaging
technology. Many Thai SME are active in the international market, and export
significant quantities of goods all over the world.

44
Chapter 4
Present Thai Food Processing Industry Manufacturing
Strategies
4.1 Introduction
Manufacturing strategies are used in particular to maximise product quality and reduce
production costs. Manufacturing technology is identified as the most important area of
manufacturing process decision making, followed by quality assurance and control. It
was also found that quality is the most important competitive priority followed by
product cost. The competitive priority of the rate of innovation, despite being likely to
be influenced by manufacturing technology, was found to be much less important.
Integration of manufacturing technology was also identified as being a very important
decision area. McCalman (1998) suggested that the right manufacturing technologies
can provide an organisation with considerable operational and competitive benefits.
According to Adam (2001) these include improvements in quality, inventory control,
customer lead times, machinery use and efficiency, staff efficiency and morale, and
company image. The nature of the technological strategy will vary across industries as
well as economic regions although the important elements and practices of a
manufacturing strategy for manufacturing companies around the world are similar,
regardless of the economic region (Ettlie, 1996).
Manufacturing strategies provide a strategic link between the manufacturing process
and the business strategy. Camp (1989) observed that the capabilities of manufacturing
were not considered when formulating or implementing business strategies and
identified a number of elements of manufacturing strategies which included technology
and its management. Bicheno (1994) and Fareman (1999) argued that manufacturing
management practice is a key element in manufacturing strategies, but is rarely
evaluated by internal performance measures.

45
Gelder (1994) defined manufacturing strategies as supporting corporate objectives by
providing manufacturing objectives including costs, quality, dependability and
flexibility in order to offer a competitive advantage and focus on a consistent pattern of
decision making within key manufacturing resource categories. The objective of
manufacturing strategies is to create “operationally significant performance measures”
(Forker,1997) in which the competitive dimensions comprise of cost, quality,
dependability and flexibility. The need for some type of performance measure was also
identified by Minor. Swink (1995) defined manufacturing strategies “as the decisions
and plans affecting resources and policies directly related to the sourcing, production
and delivery of tangible products”. The elements of manufacturing strategies, such as
technological management, are most effective when their performance and function are
relative to the business-level strategy measured. Manufacturing strategies are also
important factors in determining the dependability of a supplier since supply
dependability is an important operational issue.
In this chapter, the approaches applicable to various technological practices in the Thai
food processing industry are fully described. These are GMP, HACCP, TPM, JIT and
TQM. Over the years, they have received considerable attention by researchers due to
the increasing need of companies to not only survive but also compete successfully in
the world markets.
4.2 Good Manufacturing Practice (GMP) The food processing industry is one of the most important industries in Thailand. It
covers everything from food-processing plants to its relationship with the consumer.
It is not generally known how basic this industry is to most peoples’ lives. This is why it
is so critical that the products of this industry are of the highest quality, and free from
harmful bacteria and that there are safeguards for the consumer against any ill health
consequences from the products and the company is not sued for faulty products
(Willbur 1992, Zemanovic 1992 and Goode, 1999). GMP plays a role in promising
these results.

46
GMP practice is widely used by Thai food processing producers for the control of the
manufacturing process, especially in the areas of the type of premises, equipment,
sanitation, documentation and handling. The control starts with the selection of good
quality raw material and continues through all steps of the manufacturing process.
Using GMP practices as a guideline for the Thai food processing industry would,
therefore, help build quality standards for the product from start to finish. This would
also ensure that the product is of good quality and reliability. It would also assist the
product to keep up with international market standards so that local manufacturing will
be of a high export value. Thai food processing producers operate mostly in the low
price range.
Samatha (2003) has described GMP as a part of quality assurance which ensures that
the product is consistently produced and controlled to achieve the quality of standards
appropriate to their intended use. GMP rules are directed primarily at diminishing the
risks inherent in any food production but that cannot be prevented completely through
the testing of final products (Matthew, 2003). It is essential that proper process control
is exercised and that it is adequately documented to provide reliable evidence that the
correct procedures have been followed.
Mayes (2001) observed that GMP regulations in the US which were developed by the
Food and Drug Administration and issued in the US Code of Federal Regulations,
present the minimum requirements to be met by the industry for the manufacturing,
processing, packaging and storage of human and veterinary drugs. Every aspect of food
manufacturing should be controlled according to defined managerial and technical
standards. GMP standards document management’s responsibility for the production of
foods that meet quality and safety requirements (Semanochang,2000). GMP integrates
with HACCP systems and provides a framework for the development and
implementation of quality management systems, with subsequent registration to ISO
9000 (Mangelsdorf, 1999; Payne, 1999; Rohitratanan, 2001). GMP standards define
requirements for the management and control of activities and operations involved in
the manufacture, storage and distribution of foods.
47
4.2.1 Requirements of Good Manufacturing Practices for the Thai food
processing industry
It was observed that in present practices in Thailand, that in addition to being an
essential component of quality assurance, GMP is concerned with both production and
quality control. Figure 4.2.1 presents the principal requirements of GMP as being the
following:
1. Personnel
The establishment and maintenance of competent systems of quality assurance and the
correct manufacture of the Thai food processing industrial product relies upon expert
personnel. GMP contains specific requirements for employee training that must form
the foundation of a training program (Sumner,2000). Special emphasis should be given
to the assignment of responsibility, and to written records and documentation; each of
which is helpful in improving the overall quality of any training program. Hathaway
(1993) suggested that the training must continually be updated and must focus more on
quality rather than quantity.
2. Equipment
Equipment must be located, designed, constructed, adapted, and maintained to suit the
operations that are to be carried out. The layout and design of the equipment should
minimize risks of errors, permit effective cleaning and maintenance in order to avoid
cross-contamination and any adverse effects on product quality (Ketpibun, 2000 and
Suwanpatikorn, 2000).
3. Production
Production operations must follow clearly defined procedures. Operations must comply
with the principles of GMP in order to achieve a stipulated product quality (Sirisaong,
2000)

48
4. Quality Control
WHO (1992) described quality control as that part of GMP that is concerned with
sampling, specification, testing, organisation, and documentation. Quality control is not
confined to laboratory operations but is involved in all decisions concerning the quality
of the product. The difference between quality assurance and quality control is that
quality assurance concerns itself with quality audit, batch records, reviewing, process
validations, product design, and compliance with regulations. Quality assurance
programs even include audits of the quality control department. However, the function
of the quality control department is limited to inspection and testing (Sirsaong,
Semanochang and Busaywaong, 2000).
5. Documentation
A quality system needs to be documented with records kept to ensure that everyone in
the organisation is implementing the procedures. GMP is an essential part of the quality
assurance and should relate to all aspects of it (FAO/WHO, 1997). It aims at the
specification for material and manufacturing methods and control, to ensure that all
employees concerned with manufacture know what to do and when to do it.
6. Self -Inspection
Self-inspection should be conducted at regular intervals in order to monitor the
implementation of GMP and to propose necessary corrective measures. Competent
persons from the company should be made responsible for self-inspection. A quality
audit is a formal review of products, manufacturing processes, equipment facilities or
system conformity with quality standards (Ratnatunga,1995). It is the responsibility of
the management to provide the department with the tools they need to perform the
functions properly and produce a high quality product. Mossel (1995) proposed that
quality is dependent on the tools employed in managing. The quality audit plays an
important role in evaluating conformity with defined procedures, especially the
procedures specified by GMP. Quality audits may be of varying types and performed in
various ways.
However, the ultimate objective is to provide valuable information about the operation
within the company that affects the quality and items being manufactured. This need is
critical in the Thai food processing industry as the implications of unsatisfactory quality

49
production can lead to ill health. These audits are intended primarily to evaluate the
validity of the procedures and to monitor compliance.
Figure 4.2.1 GMP for the Thai Food Industry Components of Good
Manufacturing Practices Sources: Technology Promotion Association (Thailand –Japan, 2000)
and Thai Industrial Standards Institute, Ministry of Industry, 2002)
The purpose of the GMP regulations is to assure that all Thai food processing products
meet the requirements for food safety. The concept of quality assurance management in
the Thai food processing industry is not limited in scope to instruction manuals, control
charts, product inspections made during the manufacturing process and prior to
distribution, or statistical techniques utilised in these discrete operations. The concept
includes all control measures contributing to the completed market requirements
necessary to guarantee the quality of products.
50
4.3 Hazard Analysis Critical Control Point (HACCP) Consumer expectations about food quality and safety have grown, prompting food
processors to seek systems and programs that will both bolster consumer confidence
and improve food safety. Formerly traditional quality assurance programs and facility
inspections focused primarily on finished product testing. The HACCP system is very
important in countries such as Australia, EU, US, Canada, South Korea, and Japan and
is now used for the Thai food processing industry because of customer expectations
(Kongton, 2001). The main goal of the HACCP performance measure is to monitor food
production and assure food safety (Soliman, 2000).
The HACCP system of food product control is a prevention system. The focus for
control is transferred from the final product testing to the manufacturing process, where
monitoring and control methods are applied to reduce or eliminate the possibility of
contamination (Ketpibun, 2002). These systems are logical and structured methods of
assessing the hazards and risks associated with the manufacture of food products,
enabling the identification of Critical Control Points (CCPs) in the manufacturing
process and the application of monitoring, control and verification requirements. CCPs
are set to measure these steps, such as temperature, time, PH levels, the monitoring and
constant adjustment of water activity. This principle identification of whether the
system is working uses CCP as a performance measure of the internal workings of
HACCP (Table4.3.1). Riswadkar (2000) suggested that HACCP augments and refines
the codes of GMP in that it concentrates efforts and priorities for control on those
requirements that are essential for safety. HACCP was previously concerned only with
the hazards of microbiological origin, but its scope has been acceptably expanded by
many proponents to include chemical and foreign body contaminants.
Hence, the HACCP system has emerged as a means to protect the Thai food processing
industry. This system has been widely implemented during the last five years to ensure
the control and safety of products and processes. It is a systematic means of controlling
microbiological, chemical or physical hazards, which may arise in any food processing
or handling operations and aims to identify and prevent problems before they occur.

51
Moreover, Mayes and Mortimore (2001) advised that HACCP should reflect the
maintenance and food production incremental needs of the company. The system as
explained by Bryan (1993) is rational because it is based on historical data about
contamination and spoilage. It is comprehensive because it takes into consideration
ingredients, processes, and subsequent uses of products and is applicable to all links in
the food chain.
It is continuous because problems are detected when they occur and action is then taken
for correction, and it is systematic because it is a thorough plan covering step-by-step
operations and procedures. Like most quality systems, HACCP is based on being
proactive rather than reactive i.e. “doing it right the first time” (Amankwa, 1999 and
Soliman, 2000). It has also gained strong acceptance in the food industry, and its
performance measures have become powerful tools in the management of modern food
manufacturing.
Successful implementation of the HACCP system must have the full support of top
management, with implementation driven from within the company (Koku,1998). The
whole process, including raw materials and the suppliers, should be considered and the
staff should be made aware of the importance of quality and safety as a component of
quality.
An effective HACCP program provides a systematic approach to food safety. Because
of the dramatic increases in the variety of prepared foods, an effective food safety
program is an important element of public health protection (Ketpibun, 2002). HACCP
follows a basic risk management philosophy with an emphasis on reducing the potential
hazards inherent in food safety (Reilly, 2003). By identifying critical risk factors, a firm
can direct its risk prevention strategies and utilise its resources to maximise its risk
management efforts. HACCP principles are not limited to food safety; they can be
applied to other products and processes as well. Successful food processors understand
the importance of their reputation and "brand value" in the marketplace. This status can
be best protected through a well-implemented "total quality" system focused on
customer satisfaction.

52
It can also be applied throughout the food chain from the primary producer to the final
consumer. Besides enhancing food safety, other benefits in applying HACCP include
more effective use of resources and more timely response to food safety problems.
Table 4.3.1 Principles of HACCP
Principal Subject Action
1. Hazard Analysis Identify potential hazards associated with food
production at all stages. Assess the likelihood of
occurrence of the hazards and identify preventive
measures for their control.
2. Identification of critical control point (CCP) Identify point/procedures/operation; steps that can
be controlled to eliminate the hazards or minimize
the likelihood of its occurrence.
3. Establishing critical limits Establish target values and critical limits which
must be met to ensure that CCP is under control.
4. Monitoring Establish a system to monitor control of the CCP
by scheduled testing or observations.
5. Correction Establish corrective action to be taken when
monitoring indicates that a particular CCP is out
of control.
6. Verification Establish procedures for verification to confirm
that the HACCP system is working effectively.
7. Documentation Establish documentation concerning all
procedures and records appropriate to these
principles and their applications.
Source: Based on Codex, 1993
In addition, the application of the HACCP system can aid inspection by food control
regulatory authorities and promote international trade by increasing buyer confidence in
food safety. The HACCP plan is specific to a particular food and processing application
and is capable of accommodating change, such as advances in equipment design,
processing procedures or technological developments.
The successful application of HACCP requires the full commitment and involvement of
management and the workforce. It also requires a team approach (Rayne, 1999). The
application of the HACCP system is compatible with the implementation of quality

53
management systems. The potential barriers to the implementation of HACCP need to
be identified and examined as an initial step in the development of any HACCP
implementation strategy. The barriers may include lack of top management
commitment, lack of customer and business demand, absence of legal requirements,
financial constraints, human resource constraints, lack of expertise and/or technical
support, inadequate infrastructure and facilities, and inadequate communication.
Ehiri and Morris (1995) reported that food organisations have not embraced the
HACCP strategy with the enthusiasm originally anticipated. Difficulties, the authors
claim, are due to the voluntary status of the approach, coupled with a limited
understanding of the strategy itself among operators. Kirby (1994) stated that small and
medium sized enterprises may also have inefficient technique resources.
Achievement of successful HACCP implementation has several benefits. HACCP
implementation has allowed factories to achieve better product safety and quality,
reduced costs, design better products and processes, increase quality awareness among
suppliers, and improve team spirit. The benefits of HACCP for the Thai food processing
industry are as follows:
1. Benefits to consumers:
- Reduced risk of food-borne diseases,
- Increased awareness of basic hygiene,
- Increased confidence in the food supply,
- Improved quality of life (health and socio-economic).
2. Benefits to industry:
- Increased consumer and/or government confidence,
- Reduced legal and insurance costs,
- Increased market access,
- Reduction in production costs (reduced recall / wastage of food),
- Improved product consistency,
- Improved staff-management commitment to food safety, and
- Decreased business risk.

54
3. Benefits to governments:
- Improved public health,
- More efficient and targeted food control,
- Reduced public health costs,
- Trade facilitation,
- Increased confidence of the community in the food supply.
HACCP implementation has led to an overall increase in productivity and production
efficiency, increased product safety and continuous manufacturing for extended periods,
without any stoppages due to process breakdown.
4.4 Total Productive Maintenance (TPM) Maintenance philosophy and technology have been changing rapidly during recent
years against a background of strong bottom-line profit orientation and escalating
maintenance costs in absolute terms, in part, due to sophisticated integration of the
machines and tightening of safety legislation (Dunn, 1987; Gharibi and Kenne, 2000;
Lofsten, 2000 and Cooke, 2003). TPM is an extremely effective strategy for increasing
industrial effectiveness. The development of TPM began in Japan and it proved to be
very successful in enhancing the effectiveness and profitability of companies. Nakajima
(1988) defined TPM as productive maintenance involving total participation that
includes the following elements:
1. Maximisation of equipment effectiveness,
2. Establishment of a thorough system of Preventive Maintenance (PM) for the
entire life span of the equipment,
3. Implementation by various departments (engineering, operations and
maintenance),
4. Involvement of every single employee, from top management to the worker
on the factory floor,
5. Promotion of PM through motivation and management of autonomous small
group activities.
55
The implementation of TPM in non-Japanese companies shifts the attention from the
total involvement of every employee to the effectiveness of equipment. Hartmann
(1992) defined TPM as a practice that permanently and continuously improves the
overall effectiveness of equipment, with the active involvement of operators. From
these definitions, it is seen that there are basically two features that characterize TPM:
Equipment Management and Empowerment of Employees. The organisational link
between maintenance, production, and engineering is often a source of inefficiency,
higher cost, and lower productivity. With TPM, the operators and mechanics must
realize that they both strive for the same goal and consequently must co-operate and
share teamwork spirit.
The goals of TPM include, but are not limited to, the following:
1. Improving product quality,
2. Reducing waste,
3. Improving maintenance, and
4. Empowering employees.
Arndt (1995) suggested that responsibility for equipment maintenance should be
extended to everyone in the company, not just the maintenance specialists. The goals
are achieved through a careful implementation of the concept of employee
empowerment and sound management of equipment. Equipment is the focus of TPM.
TPM starts by identifying the major losses with regard to equipment. The following six
losses limit equipment effectiveness (Nakajima, 1988):
1. Equipment failure (breakdown losses, including time losses and quantity
losses),
2. Set-up and adjustment losses when the production of one item end,
3. Minor stoppage losses through temporary malfunction,
4. Reduced speed losses, possibly through mechanical or quality problems,
5. Quality defects and revisions caused by malfunctioning production
equipment,
6. Start-up losses during the early stages of production.
56
In terms of implementing the TPM program, Hartmann (1992) suggested that non-
Japanese plants should take three distinct steps: planning and preparation, pilot projects,
and plant wide implementation. This author also advises the following sequence of
implementation steps that works best in most existing western plants:
1. Equipment management and improvement by teams,
2. Preventive maintenance,
3. Autonomous maintenance.
Equipment management and improvement by teams involve improving equipment
performance quickly and getting operators initially involved in TPM. PM involves
keeping the equipment at a high level of overall effectiveness. This includes both
preventive and predictive maintenance - it is a total system of TPM for the entire life
cycle of the equipment (Nakajima, 1988).
In order to accomplish the goals of production, a company must synchronise its
production plan with its maintenance plan because the PM activities are carried out on
equipment during the plant stoppage periods (Cavalier 1996 and Shabbir, 2002).
Companies should accommodate changes in characteristics of products and equipment,
production modality, geographical conditions, plant size, worker background, extent of
subcontracting, and equipment management. Autonomous Maintenance (AM) is a key
component of TPM. It emphasises the operator’s involvement in the care and
maintenance of their equipment. There is a transfer of tasks and responsibilities from
maintenance specialists to production operators. Every company should develop its own
approach to AM.
TPM is a concept for corporate change, and also includes a way of defining Overall
Equipment Effectiveness (OEE) (Bamber,2002). The definition of OEE includes
downtime and other production losses which reduce throughput. Three dimensions of
effectiveness are considered: availability, performance rate, and quality rate. Nakajima
(1989) suggested that OEE does not take into account all factors that reduce the
capacity utilisation, e.g. planned downtime, lack of material input, lack of labour etc.
Blake (1992) suggested that equipment efficiency for the food processing industry is
related to quality in terms of bacterial contamination. Accordingly, successful
implementation of TPM requires top management support and commitment, a great
sense of ownership and responsibility from the operators, co-operation and involvement
57
of both the operators and the maintenance workers, and most importantly, an attitude
change from everybody from “that's not my job” to “this is what I can do to help”. This
objective is stressed as important by following authors Nakajima, 1988, Yamashina
1995, Raouf 1995, Bamber 1998 and Chand 2000.
The 15 steps of TPM implementation for the Thai food processing industry, as they
appear currently in the literature, are:
1. Announcement of top management's decision to introduce TPM,
2. Creation of an organisational structure to promote TPM,
3. Education and training of TPM,
4. Establishment of basic policies and goals of TPM,
5. Formulation of master plan for developing TPM,
6. TPM kick-off,
7. Improvement of effectiveness of each piece of equipment and development of
early equipment management,
8. Creation of a set-up for autonomous maintenance which include:
a. Initial clean-up,
b. Measures against sources of outbreaks,
c. Formulation of clean-up and lubrication standards,
d. Overall check-up,
e. Autonomous check-up,
f. Orderliness and tidiness (standardisation),
g. All-out autonomous management.
9. Creation of a set-up for planned maintenance in the maintenance department.
10. Training in improved operational and maintenance skills.
11. Creation of a set-up for initial management of equipment.
12. Quality maintenance
13. Safety hygiene and working environment
14. Clean factory
15. Perfect implementation and a higher level of TPM.

58
TPM is useful for the food-processing industry to improve the product and reduce the
cost. Hipkin (2000) presented TPM recommendations for reducing maintenance in food
industry and these were countered by managers quoting hygiene standards which
required that many existing maintenance tasks be retained. TPM is considered to be one
method of improving quality and as such, a supplementary method to other quality
techniques. Sasananan (2000) suggests that TPM can be an effective approach to
performance improvement for Thai manufacturing which suffers from reduced
efficiency and problems in manufacturing and product quality (Kasachol,1998). For
example, a tomato sauce plant can run more efficiently if there are fewer breakdowns.
The product must be completed within a certain time frame. The plant has to run when
chillies and tomatoes are available. A plant break down will lead to a poor quality
product. Antero (1999) advised that in the food industry, the main cause for quality
deficiency is a lack of adequate maintenance in the highly automated food processing
plant equipment.
4.5 Just- In-Time (JIT) Manufacturing The JIT concept and its main technique, the Kanban system, used for production
planning and inventory control for multi-stage production inventory systems, were
developed by the Japanese automobile manufacturer, Toyota. The JIT system consists
of the right-on-time approach and automation. (Takahashi 1998). The JIT system is the
approach in which production is pulled through the system as and when it is needed.
Automation refers to a system with built-in functions to prevent the production of
defective parts and to automatically check on damage to machinery.
Although the early concept of the JIT system focused on the production line, it has been
expanded to become the current approach called the just-in-time system, which still
suffers from a lack of consensus about its meaning, at least on the part of manufacturing
organisations. While some managers view it as a near total system of continuous
improvement, others simply regard it as only the Kanban system (Bukchin 1998 and
Hemamalini 2000).

59
Among the many authors favoring the larger scope of the meaning of JIT, some regard
it as a complicated philosophy comprising of various techniques to improve
productivity, reduce waste, and achieve continuous improvement. According to Voss C
and Robinson (1988), the JIT methodology is that which aims to improve overall
productivity through the elimination of waste and that leads to improved quality. Other
opinions about JIT are listed in Table 4.5.1.
Golhar (1991) suggested that the benefits of JIT include reduced inventory, increased
productivity and higher quality of products. It should be noted that JIT has been
included in many other competitive practices such as World Class Manufacturing
(WCM) (Schonberger, 1986), lean production (Womack,1990), and Kaizen
(Imai,1986). However, JIT implementation involves additional costs due to the
required provision of new equipment and employee training programmes (Golhar,
1991).
Table 4.5.1 Definitions of JIT Manufacturing
Author Definition
Finch (198 6) A management philosophy or toolbox of techniques based on making
a significant improvement in operating efficiency through reduced
inventory level, lead time and overheads.
Lee (1989) JIT system is a concept or philosophy which employs, as tools,
production management practices such as setup time reduction level
production planning, preventive maintenance, multifunctional
workers, quality circle, kanban, etc.
Golhar & Stamm (1991) The success of JIT depends on the application of elimination waste,
employee involvement, supplier participation and total quality
management.
Ahmed (1991) JIT can be viewed from a number of different angles including people
(attitudes, motivation, education in philosophy of JIT, training in
procedures) and engineering (layout, production design for
manufacturing, setup time reduction).
Sohal (1993) JIT is essentially a philosophy more than a series of techniques, the
basic tenet of which is minimising cost by restricting the commitment
to expenditure in any form, including manufacturing, components, etc.
until the last possible moment.

60
The application of JIT concepts can be advantageous for the food-processing industry:
Quality (taste), reduction of production costs and market advantage. Food quality is
measured by three factors: quality of raw materials, production process quality, and
freshness of the final product. For example, in mass-produced ice cream, milk powder
and concentrate essences are usually used. The use of these products is necessary
because the raw materials have to be stored long periods of time. Using natural
ingredients will improve the quality.
Fresh milk tastes better than preserved milk and fresh fruit tastes better than fruit
essences. Minimising the storage period of the raw materials and using fresh materials
is possible only by a switch to the JIT system, preparing the equipment for the raw
materials for a short period of time ahead and buying fruit just before their use in
production. The quality of the finished product will certainly be enhanced. Xin (2002)
presented a study that showed the effects of long storage periods of raw materials in
relation to the quality of the finished product.
4.6 Total Quality Management (TQM)
Many Thai food processing industries are active in the international market, and export
significant quantities of goods all over the world. Success in both domestic and
international markets will, in the future, increasingly be based on quality as well as cost.
Globally, increasing competition has caused standards in quality management to be
improved. The adoption of formal quality management systems and TQM are two
approaches that have been demonstrated to provide competitive levels of quality
performance. Some larger Thai manufacturers have successfully implemented TQM
(Tannock and Krasachol, 2000). Continuous quality improvement will increasingly
become important in Thailand, as companies compete in the export international
market.
TQM is a management philosophy aimed at continuously improving the quality of the
product and the process through a holistic approach that integrates the technical system
with the cultural system within an organisation to achieve customer satisfaction (Joseph.
1999). It emphasises the understanding of variation, the importance of measurement, the
role of the customer and the involvement of employees at all levels of an organisation in
61
pursuit of such improvement. Terminology can be confusing with a number of
organisations adapting the acronym TQM to suit their needs or not using it at all.
Nevertheless, most have a common element. TQM is also based on the premise that the
customer is the focus of all the activities of an organisation, and all improvement in
quality must be directed toward customer satisfaction.
Shapiro (1997) stated that the main features of TQM are: customer satisfaction (both
internal and external) continuous process and product improvement, employee
involvement (usually through teamwork), and management by checking data. It is
essential to have an organisational culture, which promotes these. TQM feature also
incorporates a number of tools and techniques which are designed to permit problem
solving by groups of employees and to use data for decision making instead of
guesswork, and to utilise quality improvement teams.
The application of these tools will vary according to the type of organisation. Wilkinson
(1991) described TQM in terms of hard and soft components, where the former refers to
statistical and other quantitative based techniques of quality control, and the latter,
employee participation and teamwork. They suggest that, too often, managers focus on
the hard aspects, such as measurable outcomes in terms of cost reductions, while
neglecting the people empowerment aspect. TQM offers a variety of tangible and
intangible benefits which amount to cost savings for the employer and greater job
satisfaction for the employee including improved product quality, better service,
increased job knowledge, improved productivity, reduced waste, errors and product
recalls, and improved communication.
In order to identify the common elements of the emerging TQM Deming (1986)
reviewed them. He suggested a statistical technique and control chart for controlling the
quality, and then expanding it to his 14 principles of quality control aimed at creating an
environment in which statistical methods would be effective. Juran (1989) was
concerned in the quality planning, quality system, supplier management, teamwork
training and measuring quality costs. Crosby (1989) suggested the concepts of “doing
things right the first time” and “zero defect”. Ishikawa (1985) was concerned about
quality control circles and employee participation. Oakland (1989) proposed that the

62
customer and supplier have an active relationship in the production chain, from raw
material producers to end user.
Forker (1991) stressed the economic value of reducing variation. His approach
measures quality as the variation from the target value of a design specification, and
failure to reduce this variation may cause an economic loss to the society company.
The common elements of TQM, including employee involvement, human resource
development, continuous improvement, application of statistical quality control
techniques, and focus on customers and suppliers, are critical contributors to its success.
TQM is a way of managing organisations to improve their performance, efficiency and
motivation in the long term. TQM provides a framework for systematically improving
quality operations through an organisation (Joseph,1999). This approach strives to
prevent errors and reduce costs through analysis, work and co-operation with others,
rather than identifying the errors and correcting them later.
Crosby, Deming, Juran and Ishikawa triggered an explosion in the amount of literature
related to TQM. While the literature is replete with practitioner-oriented “do everything
right first time” articles, suggestions have been made to examine TQM implementation
through empirical studies and also that a conducive organisational environment would
be essential for the effective practice of TQM. Apart from analysing the dimensions of
TQM and the effectiveness of implementation of TQM in an organisation, there have
been attempts to study the interaction of some organisational factors, organisation
performance and Human Resource Management (HRM), and TQM. Krasachol (1998)
showed associations between the quality measure of customer satisfaction, employee
satisfaction and employee service quality and organisation performance measured in
terms of short-term performance, long-term performance, productivity, cost
performance, profitability, competitiveness, sale growth, and increasing market share.
TQM implementation is based on teamwork and the philosophy of continuous
improvement. Statistics need to be used extensively to analyse and reduce the variations
in the process. In the food-processing industry, continuous improvement is vital to the
survival of a specific company or consumer (Ridge, 2000). The customer is constantly

63
purchasing the products of competitors and any decline in quality will lead to a decrease
in gross profits.
There are several areas that a company may focus on for quality improvement such as
food safety, hospitality, service, cleanliness, and overall food quality. In any food-
processing industry, the employee is the single most important asset. Employees make
all the difference in the world and it is how they show their enthusiasm about what they
do and how they do it, and when they do it that makes all the difference (Willbur,
1992). Employees operate plants and employees make food products acceptable to the
customer. The employee is the most important and what is done together makes all the
difference between success and failure.
Employees need guidance, and in most cases training, to move toward (Tollinson,1992).
All employees want to do better, however the management must provide the right
environment, guide them through appropriate training and help them succeed in the
growth of the company, if the company wishes to become more successful.
Communication is very important in making employee understand the company’s
requirements. Every employee in a food processing industry needs the support of
management in the form of office administrative personnel, purchasing personnel,
production lines, warehouse personnel, marketing managers and supervisors to make
his/her job easier and more reliable.
TQM is the only answer to guiding a company through the processes of improving its
productivity and service to the level that the customer expects. The TQM programme
will result in meaningful accomplishments today and for the future. It is the right way to
achieve excellence and customer satisfaction. It will help the company to more than
meet its competition and build its own bottom line. Moreover, TQM results in
significant productivity gains, unit cost reduction, elimination of much absenteeism,
lowering of worker compensation rates, reduction of accidents, elimination of most
consumer complaints and winning the consumer over by always giving him/her what
he/she expects.

64
After reviewing the elements of TQM, JIT, GMP and HACCP, the next important issue
is how these elements are integrated in such a way that they establish the basis for
achieving manufacturing excellence. The next section attempts to address this
relationship.
4.6.1 A note on the ISO 9000 concepts for Thai food processing industry The ISO 9000 quality management systems standard have become a major element in
supplier management strategy because many multinational manufacturers implement
the ISO 9000 standards with the intention of reaping the benefits. Customers, perceive
ISO 9000 registered companies as being more capable of delivering products of
consistent quality (Lamprecht, 1993 and Mehata and Wilcock, 1996). Both
manufacturers and customers have indicated that companies using quality systems such
as the ISO 9000 standards have several advantages over competitors that have not
implemented such systems. These advantages include improved product quality and
reliability, increased customer satisfaction, reduced scrap and rework, increased
manufacturing efficiency, superior delivery times, rapid systematic response to change,
and increased interdepartmental communication leading to increased teamwork (Surakn
and Simpson, 1994 and Bennet and Steed, 1999). ISO 9000 refers to a group of
standards containing clauses directed at the quality management process of an
organisation. The standards define a quality framework within which a registered
company must operate by using 20 clauses as a guideline for implementing a quality
management. ISO 9000 registration describe only the minimum criteria for a quality
management system (Oakland, 1989). ISO 9000 series standards have now been widely
accepted by the Thai industry as part of an effective strategy for competitive advantage
in the International market (Rohiratana and Sakun, 2001).
The Contents of the ISO 9000 systems have four applications as follows:
ISO 9001: This is applicable in contractual situations whereby the supplier
is capable of demonstrating its ability in design, development, production,
installation and servicing.

65
ISO 9002: This is applicable for contractual usage, and product conformance
can be achieved through production and installation.
ISO 9003: This is applicable for quality assurance in final inspections and
tests with the aim of detecting and controlling the disposition of any product
nonconformity.
ISO 9004: This serves as a guideline in developing and implementing a quality
management system.
For application within Thai Food processing industry, ISO 9000 is used by companies
wishing to develop a quality management system covering product development, as
well as production, delivery, customer service and customer requirements.
4.6.1.1 The importance of ISO 9000 for Thai food processing industry
The ISO 9000 series sets out the methods that can be implemented in an organisation to
ensure customers' requirements are fully met (both internally and externally and at an
optimum cost). This is the result of efficient utilisation of the available resources both
human and technological. Accordingly, the reasons companies implement ISO 9000
are: to reduce first time failure, to reduce the costs of customer claims, to get things
right the first time, to improve service to the customer, and to increase competitiveness
(Rohiratana and Sakun, 2001).
Companies chose ISO 9000 as part of the TQM system because they wanted to move
away from the traditional role of chasing failure and move towards an attitude of
prevention and for every individual to be responsible for producing good quality
products and services. Benefits to implementing ISO 9000 are:
1. To improve awareness of quality and have the standard of Thai food
processing products.
2. To reduce the need for customer-supplier demonstrations of quality
assurance procedures by introducing a third-party quality assurance
certificate.
3. To open markets by ensuring that ISO 9000 is compatible with
International Standard (Krasachol,1998).
66
Most Thai food processing companies are implementing ISO 9000 series standards,
because of their significance to export market penetration. With the advent of the ISO
9000 standards, concepts such as process orientation and improvement, which were
previously considered as part of a TQM approach, have become requirements of the
standard.
4.6.2 A note on the Six Sigma concepts for Thai food processing industry
The Six Sigma concept is a manufacturing practice and aim developed by the Motorola
company but now adopted by many others. Motorola defined Six Sigma as “a measure
of goodness- the capability of a process to produce perfect work” (Blakeslee, 1999).
The Six Sigma concept is about ideal of making all the processes in a chain of
production highly capable, that is, achieving a capability index of at least two. Greg’s
(2002) Six Sigma concept refers to the number of standard deviations from the average
setting of a process to the tolerance limit. In statistical terms, this translates as 3.4
defects per million opportunities for error (Breyfogle, 2001). This concept has been
extended to every function in the company, where everyone is considered to be both a
supplier and a customer. For such levels of quality, both design and manufacturing must
play a role.
Besides TQM implementation, the Six Sigma implementation has also been suggested
in this research as the alternative to effective manufacturing practice for every
organisation to excel in the aggressive competitive marketplace of today. It is a leading
management practice in instigating significant improvements in customer satisfaction
and bottom-line benefits. It is viewed as a strategic business initiative rather than a
quality management program. It can achieve WCM performance by using the most
powerful “soft” and “hard” skills in the organisation. Many company leaders such as
Motorola, General Electric and Kodak use it as a business strategy to compete in the
market arena.
Six Sigma can be seen as a disciplined extension of TQM because the latter approach
focuses on the organisation as a system with an emphasis on teams, processes, statistics,
continuous improvement, and delivering products and services that meet and exceed
customer demand. TQM is an excellent foundation from which to build toward the next

67
level of quality management, represented by Six Sigma. In addition to this, Breyfogle
(2001) stated that it is more than just a practice based on other TQM programs. There
are five factors necessary for successful implementation of Six Sigma. These are as
follows:
1. Management support
2. Quality of the work environment
3. Quality of the Six Sigma and Quality Improvement Facilitator (QIF)
candidates
4. Consistency across quality programs
5. Effectiveness of the program instructors
These factors are the same as for TQM implementation. However, there are different
implementation methods which contain the five phases of implementation specific to
Six Sigma. They are as follows:
Phase 0: The deployment strategy phase
Phase 1: Measurement phase
Phase 2: Analysis phase
Phase 3: Improvement phase
Phase 4: Control phase
The successful implementation of Six Sigma can be obtained by a management program
rather than by a technical program and there is focus on achieving substantial goals
(Amabile, 1998; Aviation, 1998 and Blakeslee, 1999). Therefore, this manufacturing
practice may also be useful for successful implementation of the TQM program. The
Six Sigma practice for Thai food processing industry is improving various aspects of the
operational performance. The aims generate financial benefits while also increasing
awareness of variability as an issue for the organisation and enhancing the ability of
employees to improve the processes with which they work.

68
4.7 A Flow Chart of the Development Appropriate to the
Manufacturing Strategy Model for the Thai Food Processing
Industry Figure 4.7.1 is a flowchart showing the development of an appropriate Thai food
processing industry model for the Thai food processing Industry. Firstly, the industry
needs to fully understand the organisation’s characteristics and the infrastructure
elements in its manufacturing practices in order to determine whether they are
implemented or not implemented. Secondly, the manufacturing practices aim to group
these elements and establish an efficient management system for developing
organisational performance. This management system is the required tools and
techniques to support its development.
Figure 4.7.1 Flow Chart of Development Appropriate to Thai Food Processing
Manufacturing Strategy Model
Elements (Infrastructure) of the organisation
Manufacturing practices
Tools and Techniques
Model of Excellence for Thai food
processing industry
Education and training

69
Finally, the model of excellence for the Thai food processing industry originates from
the combination of a number of manufacturing practices including GMP, HACCP, TPM
and TQM, in order to solve various problems that arise. After the establishment of this
model, education and training should be provided to facilitate implementation of it.
4.8 Practices of an Appropriate Integrated Model of TQM, JIT,
GMP and HACCP
The appropriate model to achieve Thai food processing industry excellence must
investigate the relationship of TQM, JIT, GMP and HACCP. Hall (1987) suggested that
the new approach to manufacturing is basically a pragmatic philosophy distilled from
worldwide experience through the investigation of the best and simplest practices,
invention and given detail. The integrated model in this study is the combination of a set
of principles belonging to GMP, HACCP, JIT, TPM, and TQM and their
accompanying set of tools and technical practices for achieving it. Thai food processing
industry excellence implies continuous improvement in performance and capabilities.
The integrated model brings together the principle and practices pertaining to GMP,
HACCP, JIT, TPM and TQM. The methods of an integrated model share basic
principles, historical settings, and goal achievement in terms of a framework of
satisfying ever changing customer demand and environment objectives (see Chapter 6).
GMP, HACCP, JIT, TPM and TQM aim respectively at improving quality (Q),
delivering products (D), reducing costs through elimination of ineffective equipment
(C), and empowering employees (E).
The principle of GMP is comprised of the many general activities that are in place to
control food safety and pre-requisite programmes. There are pest control, cleaning and
disinfecting procedures, building and equipment maintenance and induction training for
personal hygiene practices. This general level of control, applicable across all areas of
the food industry, can be considered under the generic term ‘Good Hygiene Practice’
(GHP). HACCP is directed at individual product/process lines and examines specific
and significant hazards above and beyond those general hazards dealt with by GHP.

70
It can be concluded here that the best outcome for safety issue is to adhere to GMP
practices with the additional safeguard to HACCP plan. Mayes (2000) advised that
GMP is the foundation of the food safety assurance system (Figure 4.8.1). HACCP is
related to GMP because its application ensures that all potential hazards have been
systematically analysed and those that are significant for the food product or process
have been identified and controlled.
Accordingly, the Thai food processing industry, in order to achieve successful
implementation of HACCP, will need to take the advice of Kongton (2001) who
maintained that a food manufacturing company has to succeed in its implementation of
GMP before going on to implement the HACCP system. These include such GMP
practices as plant layout of the factory, the meeting of essential building standards,
equipment and personal training in food hygiene (David, 1991; Norton, 2002).
Figure 4.8.1 Elements of Infrastructure Practice among GMP (Mayes, 2000)
WHO (1999) suggested that to achieve food safety assurance, three levels of hygienic
measures should be implemented (Figure4.8.2). These follow the general principles of
food hygiene, food-related hygienic requirements (GMP) and HACCP. HACCP can be
applied to achieve a greater assurance in regard to the safety of the produced, processed
or manufactured food. GMP is the foundation of HACCP system.
71
Figure 4.8.2 Food Safety Assurance (WHO, 1999)
The food processing industry uses HACCP as a foundation for its quality system. It is
appropriate to incorporate the relationship between HACCP and TQM in the knowledge
based on HACCP performance methods. TQM and business excellence in the food
industry are the components of the basic legal compliance system, e.g. good
manufacturing /hygiene practice, HACCP and weight and measures control activities
(Orgden, 2003).
TQM does not just deal with product quality, but all round total quality. Another area
where quality needs to be continuously improved is health and safety. The TQM
program can help solve these problems. This system was developed to ensure zero
defects during food handling by monitoring the whole preparation process. Its purpose
is to identify and correct errors before they happen. The old method of quality assurance
was to test the final product (TechniCAL, 1996). If the product quality was not up to
the mark, it was either held and reprocessed, or ultimately destroyed (TechniCAL,
1996). This method was costly both financially and time wise.
The HACCP system monitors the food from the delivery point through storage and
preparation, then finally consumption. It analyses critical control points where extra
precautions may be needed with potentially hazardous foods. A flow chart is
established to determine which foods need to be analysed at which times. Management
and employees alike must take this system very seriously and follow all steps which
include assessing hazards, identifying critical control points, setting up procedures for
them, monitoring them, taking corrective action, setting up a record-keeping system,

72
and verifying that the system is working. This system is necessary to maintain food
product quality and is a part of TQM.
According to Chaudhry (1997), an industry expert on HACCP, the foundation of TQM
and HACCP is the same: “Do it right the first time and every time, and you get a good
final product”. He also goes on to state that it is necessary to check each step along the
process to make sure the product is safe and the process is in control, instead of relying
on the end product when it is too late to correct the problem.
The food industry is one in which it is a necessity for health and safety to be given
number one priority, and with a TQM system in place, it becomes much easier to
facilitate these needs. If any food product becomes contaminated, it could mean illness
for any consumer of this product. This in turn, could bring about lawsuits resulting in
the closure of the business. The most important factors in the food-processing industry
business are safety and service. A TQM program implemented properly involves
everyone in the program. Figure 4.8.3 shows that HACCP should be considered as part
of food hygiene and a method of food safety assurance which complements the general
aspects of a TQM culture as well as specific principles of food hygiene.
Figure 4.8.3 Relationship between HACCP and TQM (WHO, 1999)

73
Furthermore, it ensures that essential safety measures are implemented. Grigg (2001)
suggested a model for the quality system in the UK food and drink industry in which
GMP and HACCP form the base line compliance activities followed by ISO 9002:2000
and TQM (Business Excellence/ CI activities) (Figure 4.8.4).
Figure 4.8.4 Revised Model for Quality Systems in the UK Food and Drinks Industry
Accordingly, TPM reflects many of the ideals of TQM and has been proven to be an
effective means of encouraging personnel at all levels to be aware of their role in
monitoring equipment to remain effective and reliable (Gipson, Greenhalgh and Kerr,
1995). Moreover, TPM is the manufacturing arm of total quality management (TQM)
and is based on the following five key principles:
1. Improvement of manufacturing efficiency by the elimination of six big losses:
Breakdowns, Setup and Adjustments, Small Stops, Reduced Speed, Startup
Rejects, and Production Rejects.
2. Establishment of a system of autonomous maintenance by operators working
in small groups.
3. An effective planned maintenance system by expert engineers.
4. A Training system of increasing the skill and knowledge levels of all
permanent employees.
5. A system of maintenance prevention where engineers work closely with
suppliers to specify and design equipment which requires less maintenance.
Also TPM has previously been involved in principle 2 of GMP in regard to
equipment.
Baseline compliance activities (/GMHGMP, comprising HACCP & Weight and Measure
Industry third-party accredited standards (e.g. BRC, EFSIS)
TQM (Business Excellence/ CI activities)
Basic
Quality M
aturity
ISO 9000: 2000
Advance
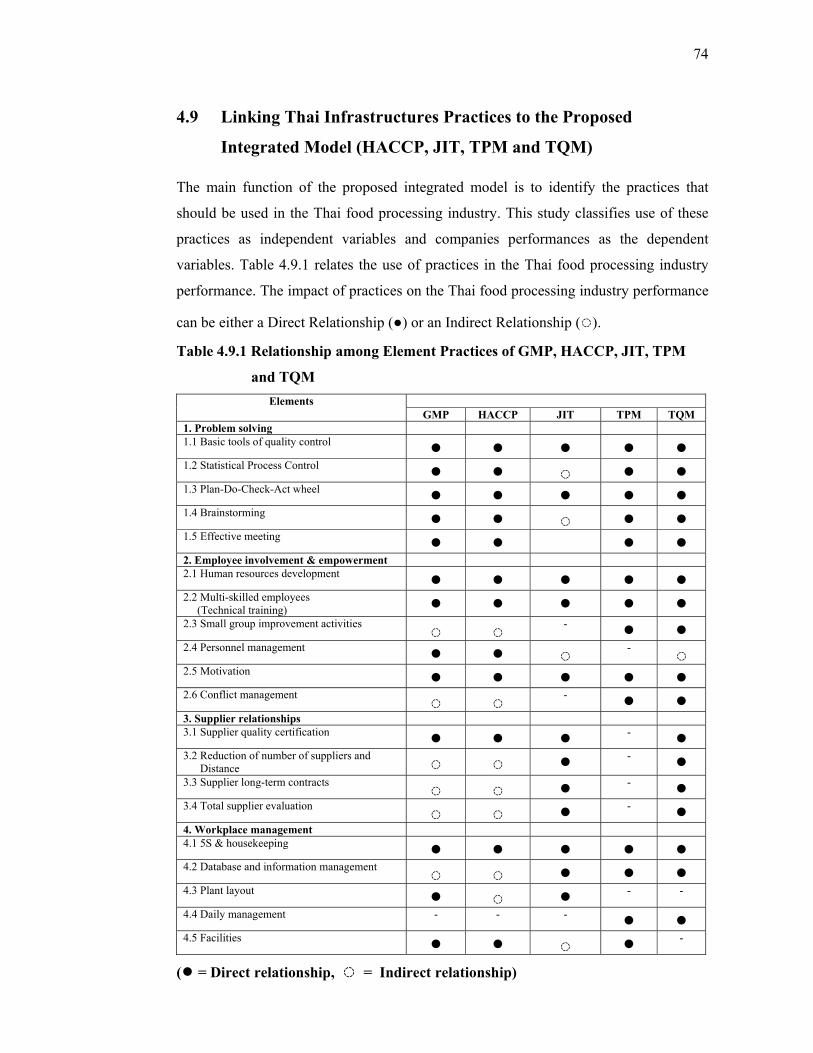
74
4.9 Linking Thai Infrastructures Practices to the Proposed
Integrated Model (HACCP, JIT, TPM and TQM) The main function of the proposed integrated model is to identify the practices that
should be used in the Thai food processing industry. This study classifies use of these
practices as independent variables and companies performances as the dependent
variables. Table 4.9.1 relates the use of practices in the Thai food processing industry
performance. The impact of practices on the Thai food processing industry performance
can be either a Direct Relationship (●) or an Indirect Relationship (◌).
Table 4.9.1 Relationship among Element Practices of GMP, HACCP, JIT, TPM
and TQM Elements
GMP HACCP JIT TPM TQM 1. Problem solving 1.1 Basic tools of quality control ● ● ● ● ● 1.2 Statistical Process Control ● ● ◌ ● ● 1.3 Plan-Do-Check-Act wheel ● ● ● ● ● 1.4 Brainstorming ● ● ◌ ● ● 1.5 Effective meeting ● ●
● ● 2. Employee involvement & empowerment 2.1 Human resources development ● ● ● ● ● 2.2 Multi-skilled employees (Technical training) ● ● ● ● ● 2.3 Small group improvement activities ◌ ◌
- ● ● 2.4 Personnel management ● ● ◌
- ◌ 2.5 Motivation ● ● ● ● ● 2.6 Conflict management ◌ ◌
- ● ● 3. Supplier relationships 3.1 Supplier quality certification ● ● ●
- ● 3.2 Reduction of number of suppliers and Distance ◌ ◌ ●
- ● 3.3 Supplier long-term contracts ◌ ◌ ●
- ● 3.4 Total supplier evaluation ◌ ◌ ●
- ● 4. Workplace management 4.1 5S & housekeeping ● ● ● ● ● 4.2 Database and information management ◌ ◌ ● ● ● 4.3 Plant layout ● ◌ ●
- -
4.4 Daily management - - - ● ● 4.5 Facilities ● ● ◌ ●
-
(● = Direct relationship, ◌ = Indirect relationship)

75
Table 4.9.1 Relationship among Element Practices of GMP, HACCP, JIT, TPM
and TQM Elements
GMP HACCP JIT TPM TQM 5. Other continuous improvement Practices
5.1 Project management ● ● - - -
5.2 Standardisation of parts, products and Processes
- ● ● - ◌
5.3 Cross functional management ◌ ◌ - ● ●
5.4 Policy deployment - - - - ● 5.5 Visible improvement management ● ● ● ●
-
5.6 Benchmarking - - - - ● 5.7 Suggestion system ● ● ● ● ● 6. Measurement 6.1 Calibration ● ●
- ◌ ◌ 6.2 Measurement equipment control ● ●
- ◌ ◌ 7. Production control 7.1 Equipment control ● ● ● ● ◌ 7.2 Preventive maintenance ◌ ◌ ● ●
-
7.3 Material control ● ● ● - ◌
7.4 Process control ● ● ● - ●
7.5 Packaging and storage ● ● ◌ - ●
7.6 Waste management ● ● - - -
7.7 Pest control ● ● - - -
7.8 Transport control ● ● ● - -
7.9 Document control ● ● - - ◌
7.10. Quality Records ● ● - - ◌
7.11. Quality audits ● ● - ● ●
7.12 Inspection and testing product ● ● ● ◌ ● 7.13 Product recall ● ● ◌
- -
7.14 Product instruction to consumer ◌ ● ◌ - -
8. Safety - - - - - 8.1 Hazard analysis ● ●
- - -
8.2 Loss control and safety management ● ● - - -
8.3 Environmental control ● ● - - -
8.4 legal requirements ● ● - - -
8.5 Poka-yoke (fail safe) ◌ - ◌ ◌ ●
8.6 Personnel Hygiene ● ● - - -
(● = Direct relationship, ◌ = Indirect relationship)
76
As seen in Table 4.9.1, most of the infrastructure practices directly influence all
manufacturing performances. Common infrastructure practices are tools and techniques
which an organisation must apply in order to achieve standard performance in
manufacturing and to enable it to support the core approaches, and hence attain
improved company performance. Based on this framework, the present study identifies
49 practices based on GMP and their interaction with the other practices. They are
classified into the following common infrastructure: GMP, HACCP, TPM, JIT and
TQM. However, GMP practices are central for realising the improved Thai food
processing industry performance. The integrated model can also be classified into
problem solving, employee involvement and empowerment, supplier relationships,
workplace management and other continuous improvement measurement, production
control, document control, quality records, quality audits, safety, and products.
Therefore, the success of the integrated system model involves the following six areas:
personal, educational, systemic, structural, operational, and managerial activities.
1. Problem Solving
Problem solving is an activity associated with changing the state of what is actually
happening to what should be happening (Scheuermann,1997). The effectiveness of this
activity in the food industry depends on the number of appropriate tools and techniques
used to motivate the continuous improvement.
This is the key to a successful continuous improvement program (Evans, 1999).
Problem solving for the food industry includes seven basic tools of quality control (B7),
statistical process control (SPC), Plan-Do-Check Act wheel (PDCA), Brainstorming,
and effective meetings. Statistical Process Control (SPC) is the core of process
improvement for the food processing industry (Bower,1997). It is aimed at monitoring a
process to identify special causes and to signal the need to take corrective action, if
appropriate.
The Basic seven tools include check-sheets, cause and effect diagrams, histograms,
pareto analysis scatter diagrams, control chart, graphs and flow chart. They are very
powerful tools which enable operators to practice process improvement (Arndt 1989a
and 1989b). SPC is a common feature of quality control in most high volume

77
manufacturing process, the food processing manufacturing industry is also involved in
high volume production and is one in which production quality control is paramount,
owing to the delicate and perishable nature of the product and the potentially severe
consequence of a lapse in process control (Grigg, 1998). Brainstorming is one method
for generating ideas. Participants focus on a problem or an opportunity and come up
with as many ideas as possible and push the ideas as far as possible.
2. Employee Involvement and Empowerment
The future of the Thai food processing industry excellence status will not be dependent
on technology, but will be determined more by the talent of the employees who
implement the technology. In dealing with the competitive and ever changing
environment, manufacturing has to aim at human resource policies to ensure that
employees can perform multiple tasks, improvise when necessary, and direct
themselves toward the continuous improvement of products and processes. Thus
employee involvement and empowerment are required to attain manufacturing
excellence (Giffi, 1990).
For example, these practices include training employees in specific skills required by
the products, manufacturing processes, customer expectations, training in employee
multi-skilling and the establishment of small group improvement activities (Saraph,
1989). The importance of employee involvement and empowerment for the Thai food
processing industry includes human resource development, multi-skilled employees,
small group activities, personnel management, motivation and conflict management.
3. The Supplier Relationship
In order to create a good supplier relationship it is necessary to recognise the role the
suppliers to the food processing industry have in supporting quality manufacturing
products. The quality of the supplies is a critical factor affecting the quality of food
safety. By encouraging manufacturers to promote HACCP throughout the supply chain,
suppliers can be made to implement practices based on supplier quality management
and performance (Ongsritrakyul, 1996). The importance of the manufacturer supplier
relationship in actualising JIT modes of production should lead to reduced costs,

78
improved quality, and shortened lead time (Inman,1990). The above suggests that Thai
food manufacturers have to involve their suppliers in the attainment of the
organisational goals in order to be competitive in the domestic and international market.
These include supplier quality certification, a reduction in the number of suppliers and
distances suppliers must send goods, suppliers long term contracts and total evaluation
of each supplier. Suppliers should be required to provide proof that they conform to the
terms of the registration (Hathaway, 1993). Where appropriate, suppliers of raw
materials should be assessed by a direct audit.
4. Workplace management Doing the simple and right thing is often a good starting point to achieve excellent
performance (Murata, 1991). In order to do the right thing in the food processing
industry, manufacturers have to organise the workplace effectively. Suzaki (1987)
observed the existence of a positive correlation between standards of housekeeping and
workplace organisation and general management attitudes. The 5S and Housekeeping
concept is a powerful method of managing the workplace (Milbur,1992). Workplace
management consists of 5S and Housekeeping, database information management
system, plant layout, daily management and facilities that are common infrastructure
practices for the food processing industry (GMP and HACCP).
5. Other continuous improvement There are other continuous improvement practices basic to infrastructure practices that
are not included in the above categories. These are project management, standardisation
of parts, products and processes, cross functional management, policy deployment,
visible improvement management, benchmarking and suggestion systems. As
mentioned above, Benchmarking is the process by which a company assesses its
performance either in the same aspects or in totality against that of its competitiveness
(Labib,1999). Other businesses can be also looked at for good performance practices.
Camp (1989) suggested benchmarking is not only a tool for measuring and comparing
performance with external standards of excellence, but it is also used for motivating a
firm to perform a self continuous improvement on its products and process.

79
Cross-function management is an effective tool in realising the organisational goals of
quality, cost, delivery, and flexibility. In this concept, communication barriers are
abolished and all departments involved in the attainment of an organisational goal, must
collaborate in cross-functional activities (Pike,1994). Standardisation of parts is a
method of ensuring high reliability by acquiring components with proven track records
of reliability over years of actual use.
6. Measurement The control of inspection, measuring and testing of equipment is critical to the food
manufacturer’s ability to make products which comply consistently with given
specifications. This control covers the multitude of instruments found in food factories
on the production floor and in quality control (Ralph, 1995). Each item of equipment
which measures or depends on a physical parameter should have a record indicating that
it has been calibrated and/or checked regularly according to documented procedures.
7. Production control Equipment which is technically suitable, well-sited, easy to clean and well-maintained
has a major role in ensuring the maintenance of good standards for food production.
Such standards will ensure that contamination is minimal. Cleaning equipment that
generates contamination such as particles, dust or aerosols should be avoided where and
when possible (Adams, 2001). Buildings should be located, designed, constructed and
utilised so as to ensure protection from any contamination product, to permit efficient
cleaning and maintenance, and to minimize the risk of manufacturing error.
Preventive Maintenance (PM) is absolutely vital in maintaining equipment in top
condition and includes preventive and predictive maintenance. PM is a total system for
the entire life cycle of equipment; hence it is the second meaning of TPM (Nakajima,
1988). Thus, PM decreases the number of breakdowns and inevitably increases the
equipment’s life span. In organising PM advancements, Cavalier,1996 suggested that
companies should accommodate changes in characteristics of the product and
equipment, production modality, geographical conditions, plant size, worker
backgrounds and equipment management.
80
Process control is an aspect of quality assurance that aims to minimise variations in the
manufacturing process. The system should ensure that any deviation from normal
processing procedures is assessed, corrected and where necessary, documented
(Stevenson, 1995). It should include preventive action taken and any additional controls
introduced to ensure that the corrective action is effective.
Pest control is integral to the maintenance of hygiene, the achievement of quality and
the preservation of food safety. Wilbur (1990) suggested a comprehensive account of
pest control and disinfection along with other requirements for hygiene and
housekeeping in the interest of safety in the processing of food.
Document control is a requirement of GMP and HACCP systems that all documents and
data which relate to the standard are controlled (Kirby, 1996). To achieve this, food
manufacture should develop a document control system which is implemented primarily
through procedures.
Quality record is purpose designed for the recording of information and data resulting
from the manufacturing of the product and the operation of the quality management
system (Wattanasin, 2000).
Quality audits are an internal assessment to see whether a company has implemented
the procedure according to its quality manual and whether those procedures are suitable
for maintaining registration in an external quality system. Dale (1994) suggested
opportunities for improvement by pinpointing areas within the document quality
system. A significant quality audit is necessary to verify the suitability and effectiveness
of the TQM process and to highlight requirements for modification (Ralph, 1995).
Quality management is that aspect of the overall management function which
determines and implements quality policy. It requires an involvement in the aspect of
manufacturing that assures that the enterprise will always meet the stated quality
standards. Every staff member is responsible for the quality of his/her work.
81
Product recall is the process of control retrieval of products from within the
manufacturing organisation from customers and depends on the extent of the error.
Production recall usually results from a non-conformance being detected in production
or a hazard being detected or suspected in the product.
8. Safety Hazard Analysis is a process by which the hazards and risks associated with the
manufacture, storage and distribution of foods are identified and assessed and
appropriate controls which either eliminate or reduce the hazard are implemented at
specific points. All staff should receive education in the rationale of GMP, HACCP,
TPM, JIT and TQM although not everyone will be actively involved in these tools and
techniques for quality management. The techniques for quality cost measurement and
analysis and corrective action should be taught to those who will be involved in their
implementation. Other tools and techniques such as SPC, problem-solving and defect
prevention methods related to routine work functions should be taught to those who use
them, as with education training methods that should be documented to ensure
consistency. It is more usual for problems to arise from the cleaning of food production
plants and equipment than from the operation of processes during production. Failures
in the food processing industry are due to inadequate adherence to the 5S and
Housekeeping systems. Criteria for the management of 5S and housekeeping should be
defined, possibly within a company’s GMP standard. Key aspects that should be
considered are cleaning and disinfecting, waste control, pest control and staff health and
hygienic conduct.
4.10 Suggested Implementation Steps for a Combined Model of GMP,
HACCP, JIT, TPM, and TQM Figure 4.10.1 shows the model which is based on the central starting point of GMP
(now compulsory in all Thai industries), with HACCP, JIT, TPM and TQM elements
being added to it. The various steps shown in (1-8) contain those techniques, and also
represent their typical implementation sequence, where the individual Technique and
Tool entries are those logically applicable in implementing the eight-step model.
Obviously, there are many overlapping areas with common tools belonging to more

82
than one technique, i.e. step 2, 3, 6, 7 and 8, after which the “pure” or technique-
specific tools are introduced (step 4 and 5). The eight steps are describe as follows;
Step 1: Infrastructure practices to build up the culture for the new management approach:
1. Human resources development; education and training about leadership,
scientific methods, problem solving, teamwork, communication skill,
PDCA wheel, etc.
2. Multi-skilled employees technical training in specific jobs such as the
knowledge of hazards control, technology, machine operation, material
handling, etc.
3. Basic tools or techniques necessary to improve work: The 5S activities and
housekeeping systems, statistical process control, basic QC tools,
Poka-yoke techniques, waste elimination (muda, mura and muri),
personnel hygiene, safety, cost reduction, IE techniques, computer
programmes, statistical techniques, etc.
Figure 4.10.1 Integrated Model of GMP, HACCP, JIT, TPM and TQM
Step 1 Infrastructure practices
Step 2 GMP
Step 3 HACCP
Step 8 TQM
Step 7 JIT Step 6 TPM
Step 5 TPM &GMP Equipment
management
Thai food processing excellence
Step 4 JIT & GMP Supplier
relationship

83
Step 2: Implementation of GMP to ensure the quality system (quality assurance), control
in general hazards
1. Building, environment control and equipment management
2. Pest control
3. Personnel hygiene
4. Process control and waste elimination system
5. Packaging and storage control: chemical/ physical/ biological hazard
control
6. Transport control
7. Material control: water/ ice/ stream control
8. Personnel and training
9. Product recall
10. Inspection and testing
11. Identification and traceability of product: labeling
12. Document and record control
13. Internal audit
Step 3: Extension to HACCP system, specific control of hazards
1. Hazards analysis
2. Critical Control Point (CCP)
3. Managing of CCPs
Step 4: Setting up elements of GMP related to JIT practice, supplier relationship:
1. Suppliers evaluation
2. Material inspection and control
3 Improvement of purchasing procedure
4. Suppliers have certification of GMP
Step 5: Setting up elements of GMP related to TPM practice, equipment relationship.
1. Preventive maintenance
2. Self-maintenance
3. Breakdown maintenance
4. Maintenance scheduling
5. Cleaning and sanitizing equipment
6. Equipment design; Poka-yoke
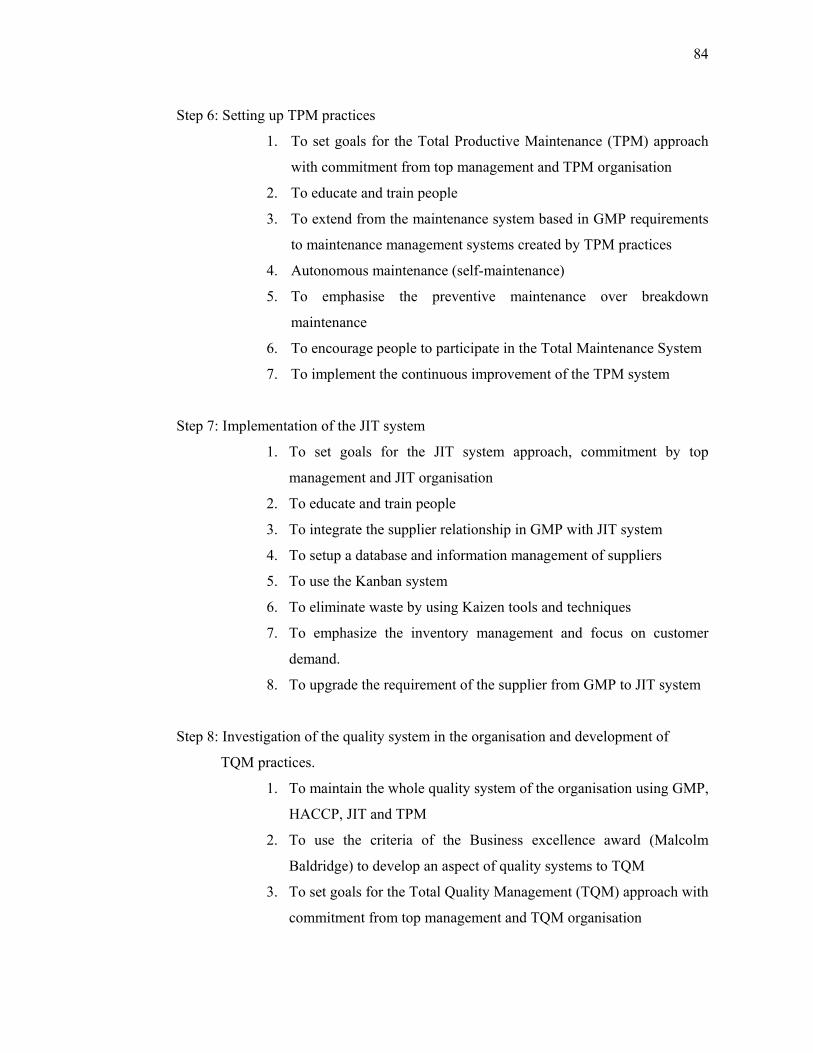
84
Step 6: Setting up TPM practices
1. To set goals for the Total Productive Maintenance (TPM) approach
with commitment from top management and TPM organisation
2. To educate and train people
3. To extend from the maintenance system based in GMP requirements
to maintenance management systems created by TPM practices
4. Autonomous maintenance (self-maintenance)
5. To emphasise the preventive maintenance over breakdown
maintenance
6. To encourage people to participate in the Total Maintenance System
7. To implement the continuous improvement of the TPM system
Step 7: Implementation of the JIT system
1. To set goals for the JIT system approach, commitment by top
management and JIT organisation
2. To educate and train people
3. To integrate the supplier relationship in GMP with JIT system
4. To setup a database and information management of suppliers
5. To use the Kanban system
6. To eliminate waste by using Kaizen tools and techniques
7. To emphasize the inventory management and focus on customer
demand.
8. To upgrade the requirement of the supplier from GMP to JIT system
Step 8: Investigation of the quality system in the organisation and development of
TQM practices.
1. To maintain the whole quality system of the organisation using GMP,
HACCP, JIT and TPM
2. To use the criteria of the Business excellence award (Malcolm
Baldridge) to develop an aspect of quality systems to TQM
3. To set goals for the Total Quality Management (TQM) approach with
commitment from top management and TQM organisation

85
4. To educate and train the people into the new culture and new
concepts of management and to encourage people to be involved in
the system
5. To investigate the lack of criteria in the TQM quality system in an
organisation in order to improve the new system
6. To extend quality programmes in the organisation such as quality,
attitude, process intent (the next step is customer), continuous
improvement, product design (QFD), customer focus (internal and
external), etc.
7. To implement the TQM system and take action to correct it.
8. To benchmark the excellence of business in the world with regard to
setting up the way to improve quality of the organisational systems
into WCM standards.
4.11 Appropriate Manufacturing Strategies Output Model (AMS output)
In this section an appropriate manufacturing strategies model is developed as a guide for
the Thai food processing industry to be effective in the implementation of the combined
basic principles of GMP, HACCP, TPM, JIT and TQM (Table 4.9.1), and adopt the
methods of performance (Figure 4.11) for achieving manufacturing excellence. AMS
output will reduce the time needed to achieve manufacturing excellence.
The development of the model in the following paragraphs follows a logic similar to
that developed by Arndt (1985) in constructing a generalized technological
improvement theory. The implementation of the integrated model can be viewed as
similar to a technology transfer. The basic premise is that the use of the practices will
lead to improved organisational performance. This integrated model can be described
by Equation (1):
Appropriate Manufacturing Strategies Output
AMS output = f (P+E+Sy+St+O+M) (1)
where
P = Person factor
E = Education factor
Sy = System

86
St = Structure
O = Operational activities
M = Management activities
Table 4.11 below shows details of the six factors which are necessary for success of the
integrated system of TQM, TPM, JIT, GMP and HACCP.
Table 4.11 Factors Necessary for Success of the Integrated System of TQM, TPM, JIT, GMP and HACCP
Person
1. Top management 1.1 Commitment 1.2 Vision 1.3 Leadership 1.4 Motivation
2. Employee 2.1 Involvement 2.2 Empowerment 2.3 Relation 3. Personnel requirement
Education
1. Management skills 1.1 Trust 1.2 Leadership 1.3 Ethics
2. Human skills 2.1 Cooperation & teamwork 2.2 Communication 2.3 Creativity thinking 2.4 Responsibility 3. Technical skills 3.1 Job qualification 3.2 Multidiscipline skill 3.3 quality-related training 3.4 equipment maintenance tasks 3.5 Personnel hygiene 3.6 Healthcare 3.7 Hazard & Safety
System
1. Quality assurance 2. Supplier relationship 3. Customer focus 4. Scientific methods 5. Continuous improvement 6. Daily management 7. Open communication 8. Performance measurement 9. Focused factory 10. Uniform workload 11. Kanban system 12. Legal requirement 13. Process control system 13.1 Material control 13.2 Equipment control 13.3 Process control 13.4 Package & storage 13.5 Pest control 13.6 Transport control 14. Measurement system 14.1 Measured equipment control 14.2 Calibration 15. Inspection and Testing 16. Product recall and instruction
Structure
1. Management structure 1.1 Organisational structure (Matrix)
- Top – Down (Vertical) - Bottom – Up (Horizontal)
1.2 Cross-functional management 1.3 Project management
2. Basic infrastructure 2.1 Technology support 2.2 Workplace environment 3. Communication structure 3.1 Formal communication
- Quality data & Reporting - Document control - Quality record - Information technology
3.2 Informal communication 4. Manufacturing structure 4.1 Flexible manufacturing 4.2 Product & Service design 4.3 Group Technology 4.4 Pull production system
Operational activities
1. Problem solving 2. PDCA cycle 3. SPC technique 4. Quality function deployment (QFD) 5. Set up time reduction 6. Visual control 7. Waste elimination 8. Reducing inventory 9. Preventive maintenance (PM) 10. Maintenance prevention (MP) 11. Maintainability improvement (MI) 12. Scheduled maintenance system 13. Autonomous maintenance 14. Small group activities 15. Suggestion 16. Reducing the six big losses 17. 5S and housekeeping 18. Poka-yoke 19. Brainstorming 20. Effective meeting 21. Value analysis and Value engineering
Management activities
1. Policy deployment (Hoshin planning) 2. Benchmarking 3. Measuring quality costs 4. Process management 5. Quality management 6. JIT scheduling 7. Strategic management 7.1 Production strategy 7.2 Vendor Strategy 7.3 Educational strategy (Educational campaign) 8. Logistic management 9. Forecasting demand patterns 10. Plant management 11. Equipment management 12. Maintenance management 13. Database and Information management 14. Waste management 15. Hazard analysis 16. Loss control and safety management 17. Environmental control 18. Facilities management

87
There is time dependence which means that the functions of improvement are
formulated from each factor. This is shown in equation (2) as follows;
AMS output = f(P)+f(E)+f(Sy)+f(St)+f(O)+f(M)
= (a1+a2)∆I1+ (b1+b2+b3)∆I2 + (c1+c2+c3+c4)∆I3+ (d)∆I4+ (e)∆I5
+ (f)∆I6 (2)
With the “effort factors”
Person factor (P)
a1 = Top management role, cultural change “acceleration factor”= α
a2 = Employee role
Education factor (E)
b1 = Management skill, acceleration factor = β
b2 = Human skill
b3 = Technical skill
System (Sy)
c1 = System for GMP and HACCP, QA (regulation), acceleration factor γ
c2 = System for TQM, based on every system, acceleration factor
c3 = System for JIT
c4 = System factor for TPM
Structure (St)
d = Structure
Operational activities (O)
e = Operation activities
Management activities (M)
f = Management activities
This model suggests that the speed of successful implementation depends on the top
management role, employee role, and management skill for driving the organisation to
WCM performance level. This can be adjusted by “acceleration factors” as in Equation
(3):
AMS output = α(a1+a2)∆I1 + β (b1+b2+b3)∆I2 + γ (c1+c2+c3+c4)∆I3 + (d)∆I4 +
(E)∆I5 + (F)∆I6 (3)

88
This equation is represented by Figure 4.11.
Figure 4.11 Appropriate Manufacturing Strategy Model Output
Based on Arndt (1985)
Figure 4.11 shows that efficiency is varied by time. However, there are three factors
which can be used to accelerate efficiency in order to increase organizational
performance. These are Person, Education, and System.
4.12 Conclusion
It can be concluded that all the manufacturing practices examined in this chapter are
necessary and very useful for factories to improve their organisation. However, lasting
improvement requires that all practices be used in an integrated way. This integrated
model formulated for the Thai food processing industry is designed to allow the
industry to upgrade to a WCM performance level. In order to develop this model, the
factors of successful implementation must be clear. There are six factors: the personal
factor, educational factor, systemic factor, structural factors, operational activities, and
management activities. This chapter also included suggestions for implementing steps
for the integrated model (GMP, HACCP, JIT, TPM and TQM).
89
Chapter 5
Research Method and Hypotheses
5.1 Introduction The purpose of this chapter is to discuss the proposed research method and development
of a hypotheses. The methodologies adopted consist of both quantitative (Balnaves and
Caputi, 2001) and qualitative (Maykut, 1994). Kirk (1986) advanced a strong case to
show that although qualitative methods are very useful for many social science
problems, quantitative methods, are probably less useful, especially when exploring an
unfamiliar situation. Moreover, quantitative studies mainly use empirical surveys while
qualitative methods deal with in-depth interviews (Mason, 1996). In fact, the prevalence
of quantitative methods may be attributed to the strong focus on theory-testing and lack
of attention to many types of problems where theory testing is not possible. However, to
test theories, the situation must be understood before formulating new theories or
applying existing theories. Hence, qualitative research is more appropriate in some
specific situations in the early stages of knowledge development.
Qualitative research provides a powerful tool for research in management and business
administration. It also has its uses in many industrial marketing research situations
where the target population is relatively small and reliable statistical analysis would
therefore be difficult. Holbert (1993) suggested that for understanding the industry, an
understanding of the major players is much more useful than the relatively shallow
quantitative measures, since a broader understanding from a widespread survey is
unlikely. This is certainly an argument for initial qualitative and quantitative research
applied to the Thai food processing industry.
Qualitative research is more often inductive, applied to exploratory work and most of
the important information is concentrated among a relatively small number of players,
reliability and validity are certainly attainable in qualitative research. Kirk (1986)
maintained that achieving good result requires a little care in, mainly, what and how
things are asked, as well as careful recording of fieldwork. Fielding (1986) pointed out
that reliability and validity depends also on what is gathered and how data are analysed.

90
The quantitative study aims to:
1. Find the pattern of manufacturing strategies,
2. Test a number of hypotheses concerning manufacturing strategies, with particular
emphasis on GMP, HACCP, TPM, JIT and TQM,
3. Recommend a new model of appropriate manufacturing strategy practices.
The qualitative study involves a case study of the Thai food-processing industry. The
aim is to verify the issues first by conducting a detailed investigation on the dimensions
of an organisation, technology and management. The study also explains why and how
every manufacturing strategy is related to techniques and tools. This study should be
very useful because the results suggest a new manufacturing strategy appropriate for
the Thai food-processing industry to ensure its successful performance.
5.2 Research Method The importance of empirical research in the field of manufacturing strategies is being
increasingly recognised as a means of helping to narrow the gap between theory and
practice. In this survey, a collection of data, information and opinions of a large group
of units, is referred to as a “population” (Filippini, 1997).
An empirical theory is one that could be and must be subjected to tests using empirical
observations. In contrast, theory- building efforts should result in the development of
knowledge and general theories which could be utilised to improve the practices of
operation management across the board (Filippini, 1997). Many researchers have
highlighted the need to develop empirical research, with particular emphasis on that
which utilises a survey, in order to support theory building in the field of management.
The survey is by far the most widely utilised method of empirical data collection used
by operation management research (Trace, 1992). Survey research can have three aims:
investigation, confirmation, or description of events.
The investigation purpose refers to the determination of concepts, which are related to a
phenomenon. The confirmatory purpose involves testing the theory and establishing
relationships between variables. The description of events, opinions, and their
distribution.

91
In this study, survey research is used for the purpose of investigation in order to
determine which manufacturing strategy concepts are related to the pattern of
organisation in the Thai food processing industry. It is also used to test a set of
hypotheses concerning manufacturing strategies.
The methods used here consist of formulation of hypotheses development of the survey
instrument, collection of data and analysis of variance (ANOVA).
5.3 Research Plan
Research plan Period
1. Pilot Survey June 2001 – July 2001
2. Main Survey October 2002 – December 2002
3. Case Study (Model Testing) November 2003
1. Pilot survey In the pilot survey, various types of data were collected for use in this
study. The data was selected from Thailand Diversity & Refinement Food and
Beverage, Department of Industry Promotion, 2000. Questionnaires were sent by mail
to 120 companies. The information from this pilot survey is discussed in chapter 6 and
is used as a guide for the scope necessary for creating a manufacturing strategy model
for the Thai food processing industry.
2. Main Survey The main survey differed from the pilot study by using companies
from the Thailand Diversity & Refinement Food and Beverage, Department of Industry
Promotion, 2001. Before formulating the survey, it was necessary to develop the
hypotheses in order to answer research inquiry questions and formulate an appropriate
model for the Thai food processing industry. The survey questionnaire was designed
and administered for obtaining useful data and information and included interviews
with 3 companies, A, B and C.
3. Analysis, This section analyses the results of the main survey and examines the
hypotheses.
4. Model, This section outlines the building of an appropriate Thai food processing
industry manufacturing strategy model.

92
5. Case Study (Model Testing) This process selects one company from the main
survey to comment on the effectiveness of the Thai food processing industry model and
suggests alternatives. The company chosen uses GMP and HACCP and is beginning to
implement TQM and TPM.
5.4 Hypotheses Competitive advantage can be achieved through combining manufacturing strategies
such as GMP (Willbur 1992 and Zemanovic 1992), HACCP (Mayes and Mortimore,
2001), TPM (Bates, Visser and Bates, 2000), JIT (Inman, 1990) and TQM (Krasachol,
1998). The best combination is to have a balance between tools and techniques. The
purpose of this research is to identify the most suitable tools and techniques for the Thai
food processing industry. Most are provided from quality tools and techniques
introduced by famous experts (Bicheno,1994). The manufacturing strategies concerning
tools and techniques aim for continuous improvement in the product and processes. It
should provide an effective link between tools and techniques for each manufacturing
strategy. Therefore, the following hypotheses are proposed:
Hypothesis 1:
The Thai food processing industry needs elements of TQM, JIT, HACCP, GMP or TPM
practices in order to increase the efficiency of the implementation of factory practice.
Hypothesis 2:
Market requirements influence the decisions to apply TQM, JIT, HACCP, GMP and
TPM.
Hypothesis 3:
Thai food processing companies that implement at least one of TQM, JIT, HACCP,
GMP or TPM practices perform better than those without any of these technologies.

93
Hypothesis 4:
Thai food processing companies that implement a combination of TQM, JIT, HACCP,
GMP and TPM or all the 5 practices perform better than those that implement only one
of them.
Hypothesis 5:
Thai food processing companies that implement a combination of HACCP, GMP, TQM
and TPM perform better than those that implement a combination of HACCP, GMP,
and TQM without TPM.
Hypothesis 6:
The limitation of HACCP and GMP practice can be overcome by putting them in the
context of TPM.
Hypothesis 7:
Various characteristics of the Thai food processing industry (size, registered capacity,
product, process strategy) influence the decision to apply TQM, HACCP, GMP and TPM.
Hypothesis 8:
The Thai food processing industry needs an infrastructure of (general ) training to
achieve GMA, HACCP, TPM, JIT, TQM and standards of World Class
Hypotheses explaining performance differentials, providing guidelines for
implementing the integrated production system, and investigating the existence of
synergy in the application of practices of the integrated system were established in
Chapter 4. These hypotheses will be investigated empirically using data collection
from the Thai food processing industry.
5.5 Survey Instrument This survey will be conducted by using the results of questionnaires sent to responsible
persons in the Thai food-processing industries and some requested interviews. The
questionnaire is designed in such a way that makes it easy to understand and provide
answers.
94
The questions are open-ended, closed-ended or scaled-response questions (Frazer and
Lawley, 2000). There are six parts (Main survey): general information, manufacturing
strategies, manufacturing practices, benefits, training and education, and interest in
research findings adapted from theoretical concept to survey question (Lyberg, 1997l).
It is also translated into the Thai language to make it easy for Thai respondents to
answer any questions.
Before the main survey questionnaire was administrated five selected companies were
used in a pilot survey. Any problems resulting from the use of unclear words was
consequently resolved before the main survey was sent out. The data for the five
companies in the pilot survey are not included in the analyses.
For the selection of the sampling, Zikmund (1997) suggested to use a sampling frame of
a list of elements from which the sample may be drawn. Although the unit of analysis
was the companies, it was impossible to send a questionnaire to all companies, so those
listed on the Thailand Diversity & Refinement Food and Beverage, Department of
Industry promotion, Thailand, 2001 were used.
For the determination of the sampling method, a questionnaire was sent to each
manufacturing company in the list, based on the probability of the willingness of the
representative of the company to fill out the questionnaire and return it to the researcher.
A sampling unit is one of the total responding companies. It was possible that a
company with subsidiaries returned more than one questionnaire. These were counted
as individual companies. There was no specifically determined sample size for this
study. Hair (1995) suggested the researcher should only use samples with at least 50
observations, and preferably the sample size should be 100 or larger. The larger the
sample, the more accurate the finding of the study.
5.6 Data Collection In this study, the companies were selected randomly but all followed GMP, HACCP,
TPM and TQM practices. As the number of such available companies was 350, data
collection was conducted by purposive sampling, a form of non-probabilistic sampling
where typical cases of interest are selected by the researcher.

95
This technique is appropriate when sampling frames are unavailable or when the
population is widely dispersed (Salant and Dillman, 1994). To obtain the necessary
information by purposive sampling, questionnaires were sent by mail to both domestic
and foreign owned Thai food processing companies. From the 120 questionnaires sent
for the pilot survey and 350 for the main survey, 50% responded to the pilot survey and
35.14% responded to the main survey. The distribution of response is shown later in
Chapters 6 and 7.
5.7 Data Analysis This section presents a brief outline about the data analysis which will be carried out
using statistical methods, descriptive methods, Chi-Square test, and analysis of
variance (ANOVA). Statistical analysis in this type of research study can be carried
out easily by software programmes such as Excel (Merchant, 1999) and SPSS (Corston,
2000). Graphs, charts and tables describe the characteristics of data and information
(Kumar, 1996).
Analysis of Variance (ANOVA) is a statistical procedure for testing the significance of
the differences among several independent groups by partitioning the total variance in
the dependent variable into effects due to different levels of the independent variable
for which ANOVA tests the hypothesis that group means of the dependent variable are
equal (Bower 1998, Corston, 2000 and Hutchison 2000) . One way analysis of variance
as a generalisation of the independent samples t-test designed to determine the
significance of the difference among three or more (rather than two) group means.
The performance of companies adopting different manufacturing practices can be
analysed in various stages. ANOVA tables (Norusis, 1990) are useful for studying the
relationship between a dependent variable and one or more independent variables. The
data analysis is assisted by using the SPSS program and then interpreted. This
experimental design permits the randomisation of all factors. When a process has two or
more factors affecting its capability, the relative contribution of each of these
independent factors to the total variability can be interpreted making the total statistical
variance of the process equal to the sum of the component variances.
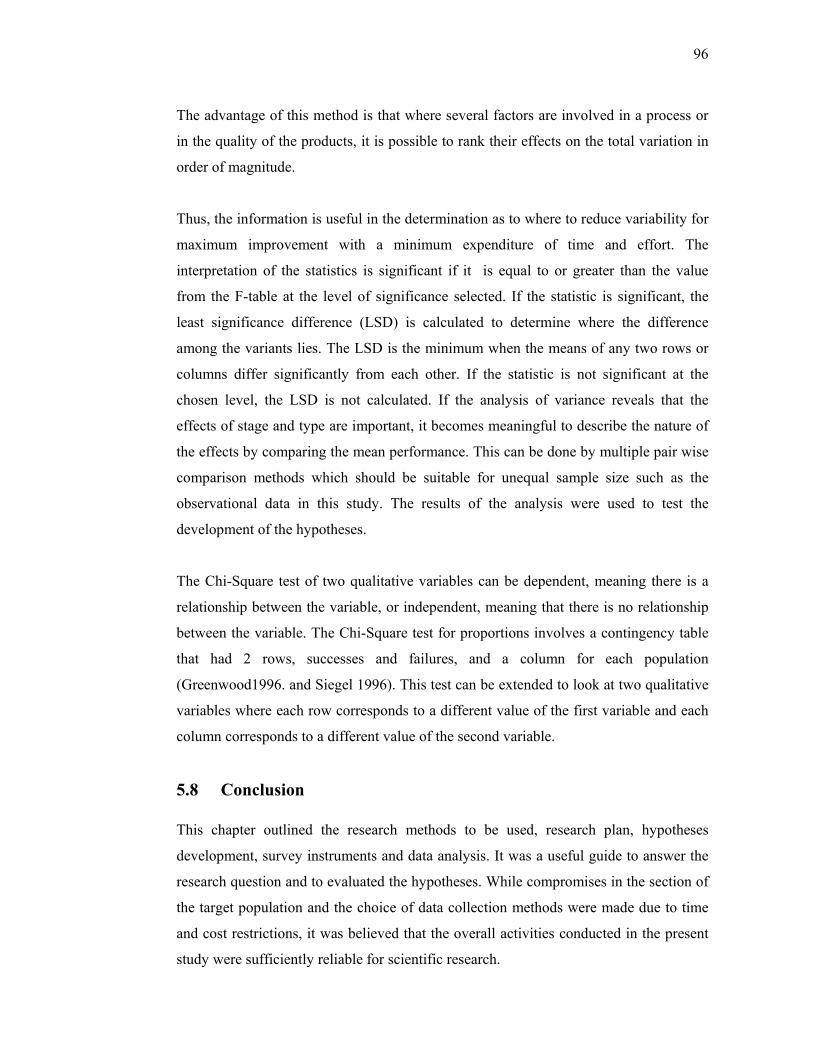
96
The advantage of this method is that where several factors are involved in a process or
in the quality of the products, it is possible to rank their effects on the total variation in
order of magnitude.
Thus, the information is useful in the determination as to where to reduce variability for
maximum improvement with a minimum expenditure of time and effort. The
interpretation of the statistics is significant if it is equal to or greater than the value
from the F-table at the level of significance selected. If the statistic is significant, the
least significance difference (LSD) is calculated to determine where the difference
among the variants lies. The LSD is the minimum when the means of any two rows or
columns differ significantly from each other. If the statistic is not significant at the
chosen level, the LSD is not calculated. If the analysis of variance reveals that the
effects of stage and type are important, it becomes meaningful to describe the nature of
the effects by comparing the mean performance. This can be done by multiple pair wise
comparison methods which should be suitable for unequal sample size such as the
observational data in this study. The results of the analysis were used to test the
development of the hypotheses.
The Chi-Square test of two qualitative variables can be dependent, meaning there is a
relationship between the variable, or independent, meaning that there is no relationship
between the variable. The Chi-Square test for proportions involves a contingency table
that had 2 rows, successes and failures, and a column for each population
(Greenwood1996. and Siegel 1996). This test can be extended to look at two qualitative
variables where each row corresponds to a different value of the first variable and each
column corresponds to a different value of the second variable.
5.8 Conclusion This chapter outlined the research methods to be used, research plan, hypotheses
development, survey instruments and data analysis. It was a useful guide to answer the
research question and to evaluated the hypotheses. While compromises in the section of
the target population and the choice of data collection methods were made due to time
and cost restrictions, it was believed that the overall activities conducted in the present
study were sufficiently reliable for scientific research.

97
In Chapters 6, 7 and 8, data analysis and results of the company survey will be
discussed. The findings of this study will be presented in Chapters 9 and 10.
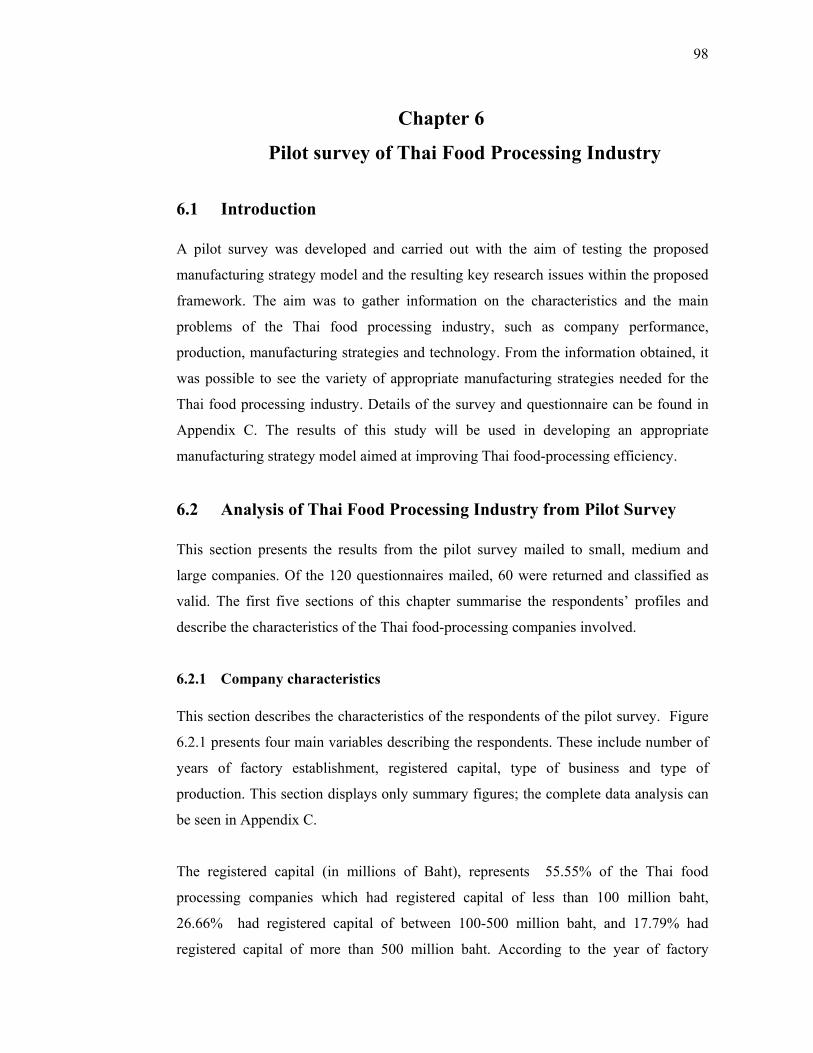
98
Chapter 6
Pilot survey of Thai Food Processing Industry
6.1 Introduction A pilot survey was developed and carried out with the aim of testing the proposed
manufacturing strategy model and the resulting key research issues within the proposed
framework. The aim was to gather information on the characteristics and the main
problems of the Thai food processing industry, such as company performance,
production, manufacturing strategies and technology. From the information obtained, it
was possible to see the variety of appropriate manufacturing strategies needed for the
Thai food processing industry. Details of the survey and questionnaire can be found in
Appendix C. The results of this study will be used in developing an appropriate
manufacturing strategy model aimed at improving Thai food-processing efficiency.
6.2 Analysis of Thai Food Processing Industry from Pilot Survey This section presents the results from the pilot survey mailed to small, medium and
large companies. Of the 120 questionnaires mailed, 60 were returned and classified as
valid. The first five sections of this chapter summarise the respondents’ profiles and
describe the characteristics of the Thai food-processing companies involved.
6.2.1 Company characteristics This section describes the characteristics of the respondents of the pilot survey. Figure
6.2.1 presents four main variables describing the respondents. These include number of
years of factory establishment, registered capital, type of business and type of
production. This section displays only summary figures; the complete data analysis can
be seen in Appendix C.
The registered capital (in millions of Baht), represents 55.55% of the Thai food
processing companies which had registered capital of less than 100 million baht,
26.66% had registered capital of between 100-500 million baht, and 17.79% had
registered capital of more than 500 million baht. According to the year of factory

99
establishment, the sample is spread uniformly among the categories. The companies
were established between the years 1960 to 1969 (approximately 3.36%), 1970 to 1979
(approximately 16.36%), 1980 to 1989 (approximately 50.09%) and 1990 to 1999
(approximately 30.19%). Based on type of business, the majority of the sample can be
classified into three categories: limited companies, partnership, and others. About 79%
of factories in the sample were limited companies.
In Figure 6.2.1, it is clear that the majority of 60 respondents were from the vegetable
and fruit processing industry (36%), marine-related industries (16%), and cooking
ingredients and edible plant oil industries (13%).
0
5
10
15
20
25
30
35
40
45
Frui
t/veg
etab
lepr
oces
sed
Mar
ine
Coo
king
ingr
edie
nts
Edib
le p
lant
oil
Suga
r ind
ustry
Dai
rypr
oduc
tion
Gra
inpr
oduc
tion
Perc
enta
ge o
f com
pani
es b
y in
dust
ry
Figure 6.2.1 Type of Thai Food Processing Industry
6.2.2 The Focus of manufacturing strategies It is shown in Figure 6.2.2 that 80% of companies focus on production. Approximately
66%, 41% and 21% of the sample focused on process, marketing, and service
respectively. A significant proportion of companies concentrate on manufacturing
certain products to serve a particular customer or marketing segment. Emphases on
service and other strategies can be viewed as complementary, supporting the focus on
the product.
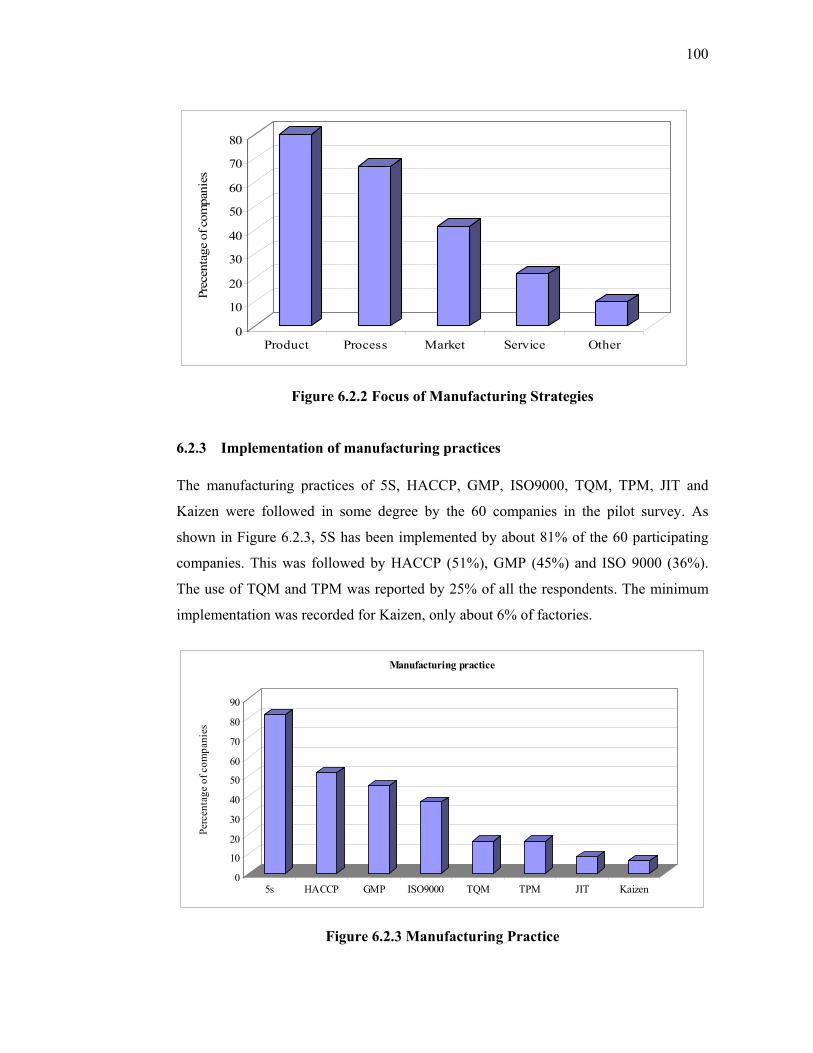
100
0
10
20
30
40
50
60
70
80
Prec
enta
ge o
f com
pani
es
Product Process Market Service Other
Figure 6.2.2 Focus of Manufacturing Strategies
6.2.3 Implementation of manufacturing practices The manufacturing practices of 5S, HACCP, GMP, ISO9000, TQM, TPM, JIT and
Kaizen were followed in some degree by the 60 companies in the pilot survey. As
shown in Figure 6.2.3, 5S has been implemented by about 81% of the 60 participating
companies. This was followed by HACCP (51%), GMP (45%) and ISO 9000 (36%).
The use of TQM and TPM was reported by 25% of all the respondents. The minimum
implementation was recorded for Kaizen, only about 6% of factories.
0
10
20
30
40
50
60
70
80
90
Perc
enta
ge o
f com
pani
es
5s HACCP GMP ISO9000 TQM TPM JIT Kaizen
Manufacturing practice
Figure 6.2.3 Manufacturing Practice
101
6.2.4 Machinery and equipment problems It is generally accepted that most of the equipment used within the Thai food-
processing industry is old, outmoded, and sometimes obsolete. The machines are
mostly imported secondhand from abroad since Thai entrepreneurs do not have
sufficient investment funds to purchase new equipment. This secondhand machinery is
not efficient, causes problems in manufacturing, including higher production costs, and
affects quality. Most Thai food processing machines in use are between 6-10 years old
(35.58%), between 11-15 years (27.88%) and more than 15 years old (approximately
14.42%). More than 50% of Thai food processing companies do not have systematic
maintenance. Figure 6.2.4 shows that most of the Thai food processing industry
experienced problems with machines. (approximately 80%).
Machine problem in Thai food processing companies
0%
20%
40%
60%
80%
100%
Small Medium Large
Type of Company
Perc
enta
ge o
f com
pani
es
NoYes
Figure 6.2.4 Machine Problem in Thai food Processing Companies
From the pilot survey, it was seen that lack of good maintenance management systems
increases the possibility of breakdown and adversely affects the manufacturing process.
Among the various maintenance problems in the Thai food processing industry, about
93% are caused by a problem with machinery (Figure 6.2.5), causing delays in about
80% of companies. This problem has an adverse effect on the quality of raw material,
because raw material loses its freshness and the customer is dissatisfied with the
product. As a result, the company has to replace the raw material for manufacturing.
In addition, the maintenance personnel get few opportunities to acquire technical
knowledge, but are nevertheless responsible for repairs. There is a lack of financial

102
support for maintenance activities and no effective system of maintenance management
because of the supposedly high costs involved. However, no thought is given to
machine effectiveness and operations costs, causing a serious problem in the Thai food-
processing industry.
Figure 6.2.6 shows that a very high percentage more than 80%, of the Thai food
processing industry must improve productivity, open new markets, improve production
processes, create new product development and invest in new machinery.
Cause of production delay in Thai food processing companies
0102030405060708090
Machine breakdown
Delay of rawmaterial
Insufficient work Bad production Other
Perc
enta
ge o
f com
pani
es
Figure 6.2.5 Cause of Production delay in Thai food Processing Companies
Future plan to improve business perormance
0%10%20%30%40%50%60%70%80%90%
100%
Impr
ovin
gpr
oduc
tivity
Ope
ning
new
mar
kets
Impr
ovin
gpr
oduc
tion
proc
esse
s
New
prod
ucts
Inve
stm
ent
in n
ewm
achi
nes
Perc
enta
ge o
f com
pani
es
NoYes
Figure 6.2.6 Future Plan to Improve Business Performance

103
Summary : Thai Food Processing Industry
Based on the pilot survey, the following strengths and weaknesses of the companies
representative of small and medium-sized food processing enterprises in Thailand can
be identified:
Strengths
1. Low cost of production - Companies can benefit from lowering their cost of
production for the following reasons:
- Major raw materials are available in Thailand including medium
technology and machines that are used in the food processing industry
- Efficiency of staff utilisation, the companies do not employ too many or
over skilled staff
2. Quality control awareness - All of the selected companies are in the process
of quality assurance implementation of HACCP certificates.
3. Good leadership-Good personal characteristics of entrepreneurs such as
their skills, education and previous jobs, that strongly influence technical
efficiency and profitability of their companies.
4. High quality of product.
5. Good relationship with employees - Due to the small size of the company,
communication between the owner and the employees is good.
6. Promotion campaign strategies - Promotion campaigns give the company’s
agents extra selling points about the product and by doing so, companies
benefit from
- Building up good relationship with their agents
- Promoting new products
7. Good background in marketing
Weaknesses
1. Centralised management style- Decision-making monopolised by the owner
2. Lack of professional administrative and management systems - Most SMEs
are faced with the need to bring their efficiency up to international
standards.
3. Lack of attention to human resource management - Besides technical
training, the companies did not pay attention to human resource activities.

104
For example, lack of incentive policies or reward system that can motivate
their employees.
4. Lack of personnel with engineering skills
5. Lack of maintenance
6.3 Comparison of Industry Manufacturing Practices Table 6.3.1 shows the possible manufacturing technology performance improvement in
the Thai food processing industry that may be achieved when a manufacturer follows
the principles pertaining to TPM to reduce the main problem of machine breakdown and
reduce cost of product (Pongpattanasili and Andt, 2002).
Table 6.3.1 Thai Food Processing Industry Manufacturing Practices
Principle Quality Cost Delivery Empower employment
JIT ○ ● ● ● TQM ● ● ○ ● TPM ○ ● ○ ● GMP ● ○ ○ ● HACCP ● ○ ○ ●
Note : Direct = ● Indirect = ○
6.4 Conclusion The results of this pilot survey of the Thai food-processing industry in 2001 based on 60
companies are presented. It was found that the main problem areas concern
management, human resources, quality, safety, cost and equipment. Based on the
modern engineering practices and successful manufacturing strategies, it is suggested
that these problems can be reduced by integrating the combined techniques and
practices of GMP, HACCP, TPM and TQM into one approach suitable for application
in the Thai food processing industry. Accordingly, an appropriate manufacturing
strategy based on implementation of a new model for this industry is suggested with a
view to increasing Thailand’s competitive position in the world market. Ongoing work
involves a second survey which investigates appropriate techniques and tools to develop
this model.

105
Chapter 7
Main Survey of Thai Food Processing Companies
7.1 Introduction This chapter presents the results of the main survey. The detail of the questionnaire can
be found in Appendix D. The general characteristics of respondents from the Thai food
processing companies are described. The respondents were randomly selected from 350
Thai food processing companies and of these, 123 companies provided valid answers. It
was found that 50.43% of these were in the fruit and vegetable industries, 17.88%
frozen food, 10.2% beverage, 8.13% meat processing, 6.5% dairy, 2.43% tea and coffee
and 4.43% others industries. The questionnaire focuses on the development of an
integrated model for the Thai food processing companies as a strategy for achieving
WCM performance in the competitive international market. This model combines the
best aspects of five manufacturing practices: GMP, HACCP, TPM, JIT, and TQM.
7.2 General Characteristics of Thai Food Processing Companies This section describes the general characteristics of the main survey in terms of six
given attributes of the sample. This information gives an overview of the companies.
These include the number of employees, annual turnover, product manufacturing
strategy, and proportion of technology used for value-added operation. The information
of Thai food processing companies is then summarised in Appendix E. The majority of
Thai food-processing companies (approximately 75.86%) are small to medium-sized
enterprises (SMEs), with less than 200 employees, and form the driving mechanism for
the Thai economy (Chapter 3). The distribution of the sample according to annual
turnover is quite different from employees’ categories. In terms of ranking from
smallest to largest annual turnover, it is interesting to note that the first, 13.82% have an
annual turnover of less than 50 million baht, the next, 17.88% have an annual turnover
between 50 and 100 million baht, followed by 32.52% with a turnover of between 100
and 500 million baht and the last, 35.78% have an annual turnover of over 500 million
baht. This implies that the sample by annual turnover follows approximately a normal
distribution. In terms of number of products, 17.88 % have less than 3, and 69% have
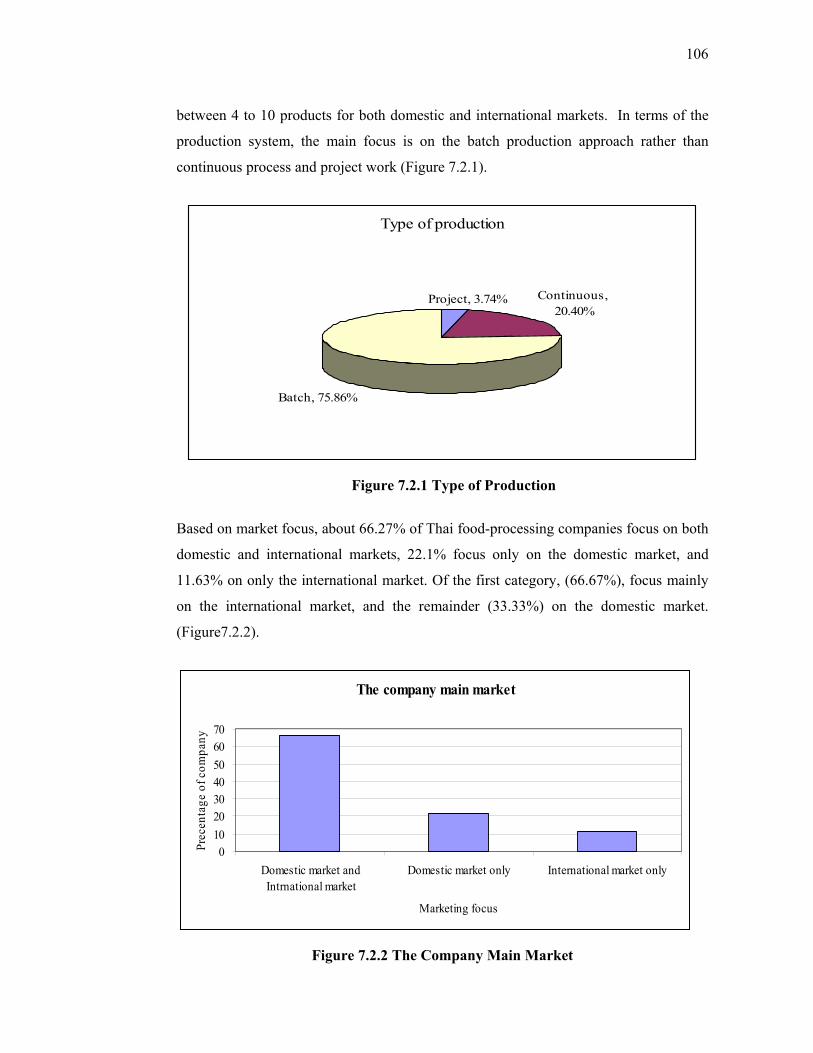
106
between 4 to 10 products for both domestic and international markets. In terms of the
production system, the main focus is on the batch production approach rather than
continuous process and project work (Figure 7.2.1).
Type of production
Project, 3.74% Continuous, 20.40%
Batch, 75.86%
Figure 7.2.1 Type of Production
Based on market focus, about 66.27% of Thai food-processing companies focus on both
domestic and international markets, 22.1% focus only on the domestic market, and
11.63% on only the international market. Of the first category, (66.67%), focus mainly
on the international market, and the remainder (33.33%) on the domestic market.
(Figure7.2.2).
The company main market
010203040506070
Domestic market andIntrnational market
Domestic market only International market only
Marketing focus
Prec
enta
ge o
f com
pany
Figure 7.2.2 The Company Main Market

107
In terms of manufacturing strategies, Figure 7.2.3 indicates that most Thai food
processing companies focus on process to increase their product quality (87.93%). The
second priority is to focus on the market and to satisfy customers (70.68%), followed by
company focus on production (15.51%) and service (1.72%). A significant proportion
of factories in the sample concentrate on certain manufacturing processes to serve a
particular type of customer or market segment. In about 49% of firms, the ratio of
manual operations-to-automation is 1:1; in about 38.7% the ratio is 1:3, and in the
remaining 12.3%, 3:1. (Figure7.2.4).
Manufacturing stategies
0102030405060708090
100
Process Market Prduction Service
Perc
etag
e of
Com
pani
es
Figure 7.2.3 Focus of Manufacturing Strategies
The ratio of technology that is used for value-adding operation in Thai food processing industries
Manual:Automation 50:50, 49%
Manual:Automation 25:75, 12.3%
Manual:Automation 75:25, 38.7%
Figure 7.2.4 Ratio of Technology used for Value-adding Operation
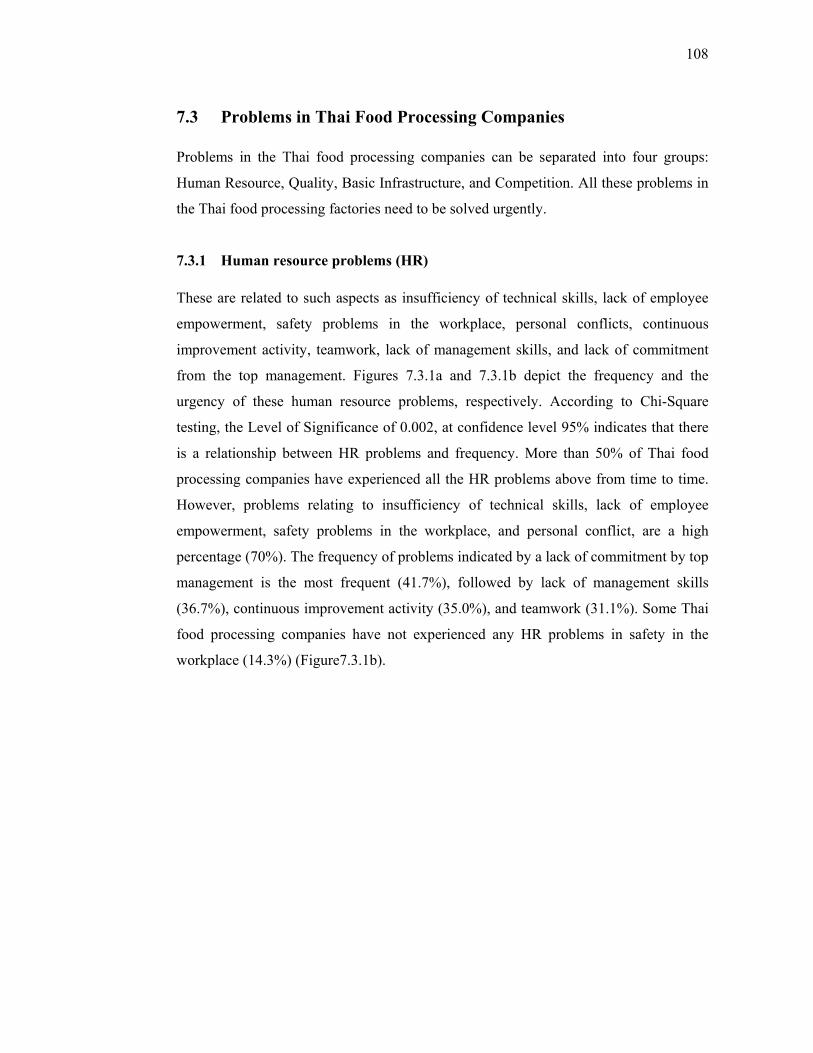
108
7.3 Problems in Thai Food Processing Companies Problems in the Thai food processing companies can be separated into four groups:
Human Resource, Quality, Basic Infrastructure, and Competition. All these problems in
the Thai food processing factories need to be solved urgently.
7.3.1 Human resource problems (HR) These are related to such aspects as insufficiency of technical skills, lack of employee
empowerment, safety problems in the workplace, personal conflicts, continuous
improvement activity, teamwork, lack of management skills, and lack of commitment
from the top management. Figures 7.3.1a and 7.3.1b depict the frequency and the
urgency of these human resource problems, respectively. According to Chi-Square
testing, the Level of Significance of 0.002, at confidence level 95% indicates that there
is a relationship between HR problems and frequency. More than 50% of Thai food
processing companies have experienced all the HR problems above from time to time.
However, problems relating to insufficiency of technical skills, lack of employee
empowerment, safety problems in the workplace, and personal conflict, are a high
percentage (70%). The frequency of problems indicated by a lack of commitment by top
management is the most frequent (41.7%), followed by lack of management skills
(36.7%), continuous improvement activity (35.0%), and teamwork (31.1%). Some Thai
food processing companies have not experienced any HR problems in safety in the
workplace (14.3%) (Figure7.3.1b).

109
HR problems and Frequency of problems
0102030405060708090
100
Insu
ffic
ienc
y of
tech
nica
l ski
ll
Lack
of e
mpl
oyee
empo
wer
men
t
Safe
ty p
robl
ems
in w
orkp
lace
Pers
onal
con
flict
Con
tinuo
us im
prov
emen
tac
tivity Te
amw
ork
Lack
of m
anag
emen
t ski
ll
Lack
of c
omm
itmen
t of t
opm
anag
emen
t
HR problems
Perc
enta
ge o
f res
pond
ent
No occurrence
Frequently
Infrequently
Figure 7.3.1a Human Resource Problem and Frequency of Problems
Occurrence frequent problems
0
5
10
15
20
25
30
35
40
45
Lack
of
com
mitm
ent
of to
pm
anag
emen
t
Lack
of
man
agem
ent
skill
Con
tinuo
usim
prov
emen
tac
tivity
Team
wor
k
Pers
onal
conf
lict
Insu
ffici
ency
of te
chni
cal
skill
Lack
of
empl
oyee
empo
wer
men
t
Safe
typr
oble
ms i
nw
orkp
lace
HR problems
Perc
enta
ge o
f res
pond
ent
Figure 7.3.1b Frequency of Human Resource Problems

110
From Chi-Square testing, Level of Significance of 0.001 at confidence level 95% shows
that there is a relationship between HR problems and the urgency of problems. Figure
7.3.1c shows that all Thai food processing companies have had more than 60% of
urgency problems. The highest percentage is in personal conflict (94.6%), lack of
commitment of top management (94.1%), safety problems in the workplace (90.9%),
teamwork (86.7%), and human error (80%). Continuous improvement activity and lack
of management skills in average and not critical problems account for (30-40%).
HR problems and Urgency of problems
0102030405060708090
100
Pers
onal
con
flict
Lack
of c
omm
itmen
t of t
opm
anag
emen
t
Safe
ty p
robl
ems i
n w
orkp
lace
Team
wor
k
Hum
an e
rror
Lack
of e
mpl
oyee
em
pow
erm
ent
Insu
ffici
ency
of t
echn
ical
skill
Con
tinuo
us im
prov
emen
t act
ivity
Lack
of m
anag
emen
t ski
ll
Perc
enta
ge o
f res
pond
ent
Not criticalAverageUrgency
Figure7.3.1c Human Resource Problem and Urgency of Problem
7.3.2 Quality problems These problems are related to waste of time, meeting customer deadline, defects,
machine breakdown, availability of material, and lack of production performance. They
are shown in Figure 7.3.2a (Frequency), and Figure 7.3.2c (Urgency) of quality
problems.
From Chi-Square testing of Level of Significance of 0.00, there is a relationship
between Quality problems and the Frequency of problems. Figure 7.3.2a shows that the
most common problems of the Thai food processing companies are waste time (76.2%),
not meeting customer deadline (73.7%), defects (72.5%), machine breakdown (68.9%),

111
and availability of material (58.2%), respectively. Frequency of problems, Figure 3.2b
indicates Non-availability of material (41.8%) and Machine breakdowns (29.5%) are
the most frequent problems in the Thai food processing companies. Moderately frequent
problems are defects (19.6%), waste time (19%), lack of production performance
(16%), and not meeting customer deadline (15.8%). However, most of these can be
improved, as will be shown in Chapters 9 and 10.
Quality problems and Frequency of problems
0
10
20
30
40
50
60
70
80
90
100
Waste time Meetingcustomerdeadline
Defects Machinebreakdown
Availability ofmaterial
Lack ofproduction
performance(productivity)
Quality problems
Perc
enta
ge o
f res
pond
ent
No occurrenceFrequentlyInfrequently
Figure 7.3.2a Quality Problem and Frequency of Quality Problems
Quality problems and Frequency problem
0
5
10
15
20
25
30
35
40
45
Availability ofmaterial
Machinebreakdown
Defects Waste time Lack ofproduction
performance(productivity)
Meetingcustomerdeadline
Quality problems
Perc
enta
ge o
f res
pond
ent
Figure 7.3.2b Frequency of Quality Problems

112
From the Chi-Square testing at level of significance of 0.774, there is no relationship
between quality problems and urgency of problems. Figure 7.3.2C shows that all quality
problems are a very high percentage of urgency (more than 80%). The less critical
quality problems in some Thai food processing companies are waste time (4.8%),
defects (4.5%), and machine breakdown (1.6%).
Quality problems and. Urgency of problems
0
10
20
30
40
50
60
70
80
90
100
Availability ofmaterial
Machinebreakdown
Lack ofproduction
performance(productivity)
Defects Meetingcustomerdeadline
Waste time
Quality problems
Perc
enta
ge o
f res
pond
ent
Not critical
Average
Urgency
Figure 7.3.2c Urgency of quality problems
7.3.3 Basic infrastructure problems These problems are related to the basic organisation infrastructure, such as overstock
and inventory, measurement of control systems, information management, budget
planning, unclear organisation structure, cost controlling and evaluating, work
standards, and production schedule. They are shown in Figures 7.3.3a, and 7.3.3b, in
terms of frequency, and urgency, respectively.

113
The correlation between basic infrastructure problems and frequency of problems is
estimated at a confidence level of 95% (Sig.= 0.0007). Figure 7.3.3a indicates that most
basic infrastructure problems occurred sometimes in a high percentage of companies
(>70%), excepted for work standard (45.5%) and production schedule (34.5%). Basic
infrastructure problems that are the most frequently occurring are production schedule
(30%), work standard (41.4%) and unclear organisation structure (40.9%). Moderately
frequent problems of basic infrastructures are cost controlling and evaluating (30%),
and measurement control system (22.2%). Most Thai food processing companies do not
experience frequent basic infrastructure problems of budget planning (13.2%),
information for management (10.5%), and overstock and inventory (4.2%).
Basic infrastructure problems and Frequency of problems
0
10
20
30
40
50
60
70
80
90
100
Ove
rsto
ck &
inve
ntor
y
Mea
sure
men
tco
ntro
l sys
tem
Info
rmat
ion
for
man
agem
ent
Bud
get
plan
ning
Unc
lear
orga
niza
tion
stru
ctur
e
Cos
tco
ntro
lling
&ev
alua
ting
Wor
k st
anda
rd
Prod
uctio
nsc
hedu
le
Basic infrasturcture problems
Perc
enta
ge o
f res
pond
ent No occurrence
Frequently
Some
Figure 7.3.3a Basic Infrastructure and Frequency of Problems
The result of the Chi-Square test shows that there is a relationship between quality
problems and urgency of problems at confident level 95% (Sig. = 0.00). Figure 7.3.3b
shows that more than 60% of Thai food processing companies have urgent problems in
all basic infrastructures, with the information for management which shows a low
percentage (10.53%). In terms of respondent selected urgent problems from Production

114
schedule, Budget planning and Overstock & Inventory have a very high percentage
(more than 80%) of urgency.
Figure 7.3.3b Urgency of Basic Infrastructure Problems
7.3.4 Competition problems These problems relate to winning in the competitive market: community relationships,
marketing plans, resource planning, setting manufacturing strategies, lack of developing
product ideas, supplier relationships, and understanding customer demands. They are
shown in Figure 7.3.4a (Frequency), and Figure 7.3.4b (Urgency). From the result of
Chi-Square testing, Level of Significance of 0.0002 shows that there is a relationship
between problems with competitors and frequency of problems. Figure 7.3.4 shows that
most competition problems are encountered occasionally, except understanding
customer demand which is the most frequent. Competition problems, which should be
resolved (>30%) are not understanding customer demands (50%), supplier relationship
(37%), and lack of developing product ideas (35%). A little less frequent are problems
relating to marketing plans (5.3%).
Basic infrastructure problems and Urgency of problems
0
10
20
30
40
50
60
70
80
90
100
Prod
uctio
nsc
hedu
le
Bud
get
plan
ning
Ove
rsto
ck &
inve
ntor
y
Cos
t con
trolli
ng&
eva
luat
ing
Wor
k st
anda
rd
Unc
lear
orga
niza
tion
stru
ctur
e
Mea
sure
men
tco
ntro
l sys
tem
Info
rmat
ion
for
man
agem
ent
Basic infrastructure problems
Pere
ntag
e of
resp
onde
nt
Not criticalAverageUrgency

115
Problems to against competitors and Frequency of problems
0
10
20
30
40
50
60
70
80
90
100
Com
mun
ityre
latio
nshi
p
Mar
ketin
g pl
an
Res
ourc
epl
anni
ng
Setti
ngm
anuf
actu
ring
stra
tegi
es
Lack
of
deve
lopi
ngpr
oduc
t ide
as
Supp
lier
rela
tions
hip
Und
erst
andi
ngcu
stom
erde
man
ds
Problems to against competitors
Perc
enta
ge o
f res
pond
ent
No occurrence
Frequently
Some
Figure 7.3.4a Problems with competitors and Frequency of Problems
The Ch-Square testing result demonstrates that there is no relationship between
problems with competitors and the urgency of problems at confident level 95%
(Chi-Square test, insignificance, Sig. = 0.3607). Figure 7.3.4b shows that all problems
against competitors are a very high percentage in urgent problems, particular to supplier
relationship (93.3%), setting manufacturing strategies (86.1%), understanding customer
demands (77.3%), and community relationship (76.9%).
Problems to against competitors vs. Urgency of problems
0
10
20
30
40
50
60
70
80
90
100
Supp
lier
rela
tions
hip
Setti
ngm
anuf
actu
ring
stra
tegi
es
Und
erst
andi
ngcu
stom
erde
man
ds
Com
mun
ityre
latio
nshi
p
Res
ourc
epl
anni
ng
Und
erst
andi
ngco
mpe
titor
s'bu
sine
ss
Mar
ketin
g pl
an
Lack
of
deve
lopi
ngpr
oduc
t ide
as
Problems to against compeitors
Perc
enta
ge o
f res
pond
ent not critical
averageurgency
Figure 7.3.4b Problems with Competitors and Urgency of Problems
Problems with competitors and Frequency of Problems
Problems with competitors vs. Urgency of Problems

116
7.4 Problem Solving Potential There are two levels of problems: easy and difficult. The easily solved problems are
lack of production performance, supplier relationship, waste time, work standards,
teamwork, marketing plans, defects, lack of commitment of top management, and
unclear organisation structures. They are shown in Figure 7.4.1 (human resource
problems), Figure 7.4.2 (quality problems), Figure 7.4.3 (basic infrastructure problems),
and Figure 7.4.4 (competition problems).
7.4.1 Human resource problems The HR problems in Thai food processing companies indicate that there is a relationship
between HR problems and the Potential of solving (Chi-Square testing Significance,
Sig.= 0.0002). Figure 7.4.1 shows that 85% of HR problems can be solved (Easy and
Average). All HR problems have difficulties in some Thai food processing companies
in particular to problems Continuous improvement activities (11.1%), and Lack of
management skill (10%) are difficult to solve.
Human resource problems and Poential of solving
0
10
20
30
40
50
60
70
80
90
100
Safe
ty p
robl
ems
in w
orkp
lace
Insu
ffici
ency
of
tech
nica
l ski
ll
Pers
onal
con
flict
Lack
of e
mpl
oyee
empo
wer
men
t
Con
tinuo
usim
prov
emen
tac
tivity
Lack
of
man
agem
ent s
kill
Lack
of
com
mitm
ent o
fto
p m
anag
emen
t
Team
wor
k
HR problems
Perc
enta
ge o
f res
pond
ent
Difficult
Easy
Average
Figure 7.4.1 Potential of Solving Human Resource Problems
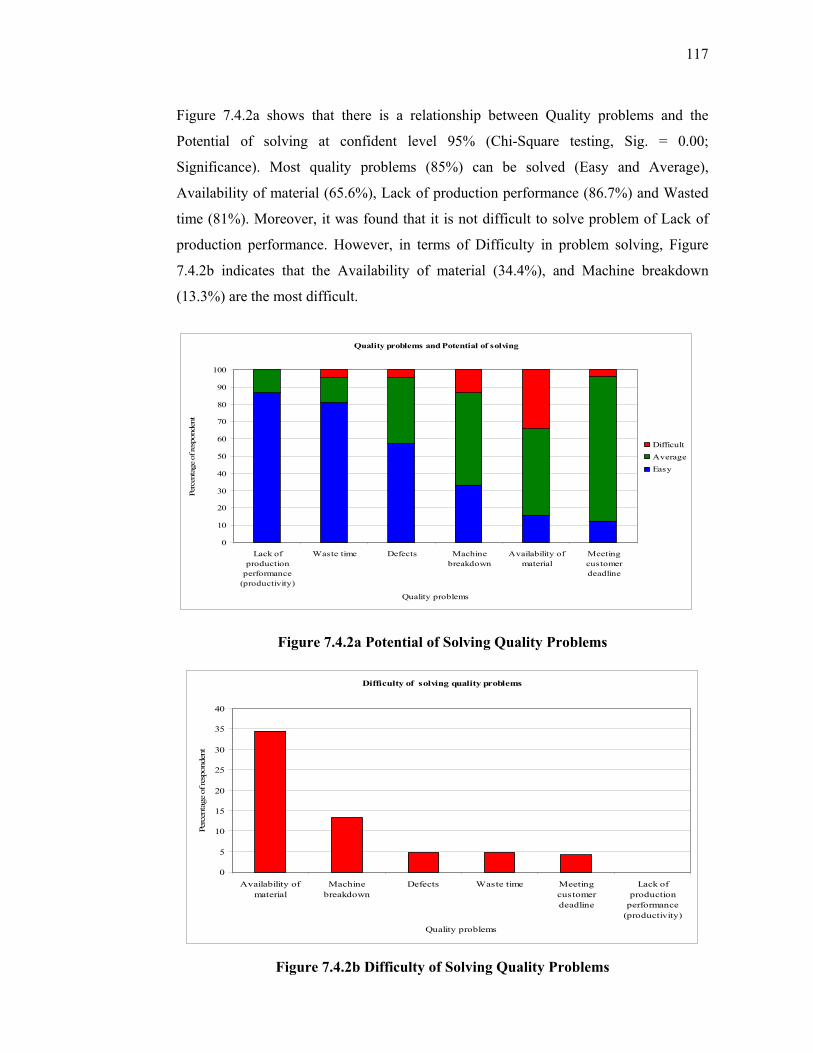
117
Figure 7.4.2a shows that there is a relationship between Quality problems and the
Potential of solving at confident level 95% (Chi-Square testing, Sig. = 0.00;
Significance). Most quality problems (85%) can be solved (Easy and Average),
Availability of material (65.6%), Lack of production performance (86.7%) and Wasted
time (81%). Moreover, it was found that it is not difficult to solve problem of Lack of
production performance. However, in terms of Difficulty in problem solving, Figure
7.4.2b indicates that the Availability of material (34.4%), and Machine breakdown
(13.3%) are the most difficult.
Quality problems and Potential of solving
0
10
20
30
40
50
60
70
80
90
100
Lack ofproduction
performance(productivity)
Waste time Defects Machinebreakdown
Availability ofmaterial
Meetingcustomerdeadline
Quality problems
Perc
enta
ge o
f res
pond
ent
DifficultAverageEasy
Figure 7.4.2a Potential of Solving Quality Problems
Difficulty of solving quality problems
0
5
10
15
20
25
30
35
40
Availability ofmaterial
Machinebreakdown
Defects Waste time Meetingcustomerdeadline
Lack ofproduction
performance(productivity)
Quality problems
Perc
enta
ge o
f res
pond
ent
Figure 7.4.2b Difficulty of Solving Quality Problems
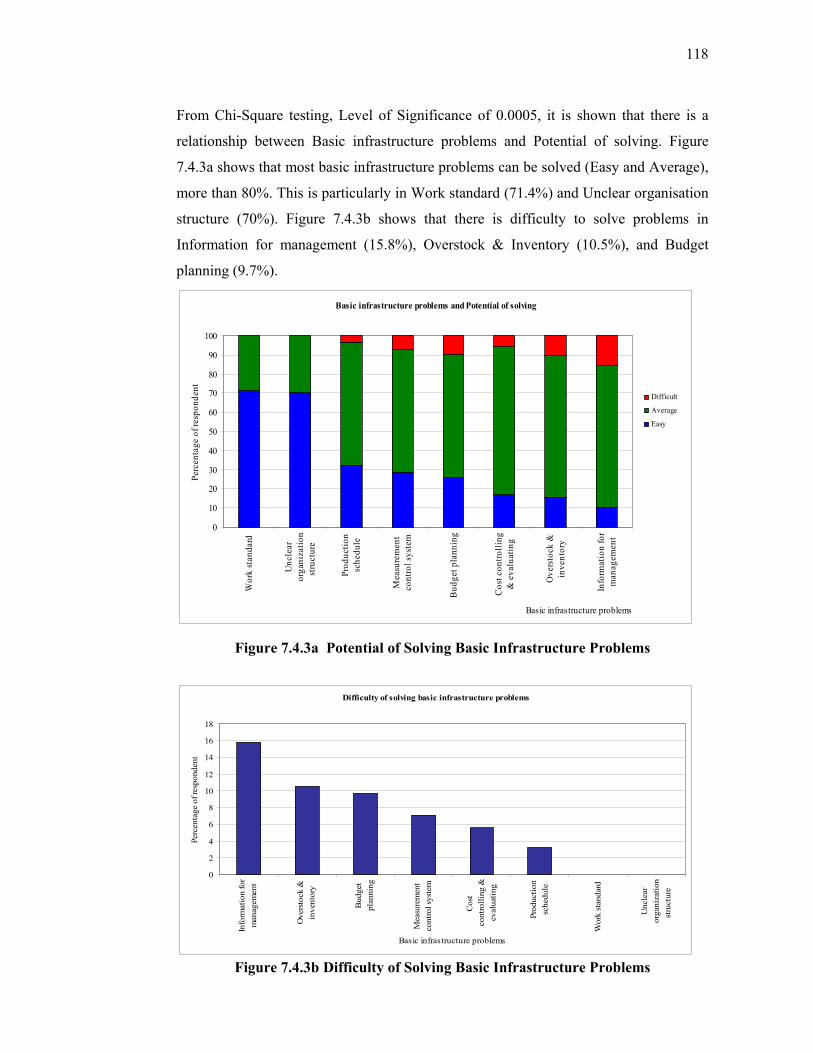
118
From Chi-Square testing, Level of Significance of 0.0005, it is shown that there is a
relationship between Basic infrastructure problems and Potential of solving. Figure
7.4.3a shows that most basic infrastructure problems can be solved (Easy and Average),
more than 80%. This is particularly in Work standard (71.4%) and Unclear organisation
structure (70%). Figure 7.4.3b shows that there is difficulty to solve problems in
Information for management (15.8%), Overstock & Inventory (10.5%), and Budget
planning (9.7%).
Basic infrastructure problems and Potential of solving
0
10
20
30
40
50
60
70
80
90
100
Wor
k st
anda
rd
Unc
lear
orga
niza
tion
stru
ctur
e
Prod
uctio
nsc
hedu
le
Mea
sure
men
tco
ntro
l sys
tem
Bud
get p
lann
ing
Cos
t con
trolli
ng&
eva
luat
ing
Ove
rsto
ck &
inve
ntor
y
Info
rmat
ion
for
man
agem
ent
Basic infrastructure problems
Perc
enta
ge o
f res
pond
ent
Difficult
Average
Easy
Figure 7.4.3a Potential of Solving Basic Infrastructure Problems
Difficulty of solving basic infrastructure problems
0
2
4
6
8
10
12
14
16
18
Info
rmat
ion
for
man
agem
ent
Ove
rsto
ck &
inve
ntor
y
Bud
get
plan
ning
Mea
sure
men
tco
ntro
l sys
tem
Cos
tco
ntro
lling
&ev
alua
ting
Prod
uctio
nsc
hedu
le
Wor
k st
anda
rd
Unc
lear
orga
niza
tion
stru
ctur
e
Basic infrastructure problems
Perc
enta
ge o
f res
pond
ent
Figure 7.4.3b Difficulty of Solving Basic Infrastructure Problems

119
Chi-Square testing, Level of Significance of 0.00 shows that there is a relationship
between problems with Competitors and the Potential of solving these. Figure7.4.4
shows that most problems with competitors can be solved (Easy and Average), more
than 85% of the time. Particularly to supplier relationships (78.6%) and marketing plans
(66.7%), most Thai food processing companies can solve these easily. However, some
cannot solve problems easily; Some problems are difficult, such as Understanding
customer demands (13.6%) and Marketing plans (13.3%). There is only one problem
easy to solve and that is Supplier relationships.
Problems to against competitors and potential of solving
0
10
20
30
40
50
60
70
80
90
100
Supp
lier
rela
tions
hip
Mar
ketin
g pl
an
Lack
of
deve
lopi
ngpr
oduc
t ide
as
Und
erst
andi
ngcu
stom
erde
man
ds
Com
mun
ityre
latio
nshi
p
Res
ourc
epl
anni
ng
Und
erst
andi
ngco
mpe
titor
s'bu
sine
ss
Setti
ngm
anuf
actu
ring
stra
tegi
es
Problems to against competitors
Perc
enta
ge o
f res
pond
ent Difficult
Average
Easy
Figure 7.4.4 Potential of Solving Competition Problems
7.5 Business Performance Two approaches to business performance originate from market and company
expectations. Figure 7.5.1 shows the focus of quality that the market expects, and Figure
7.5.2 shows Business Performance and Companies and the response needed by
companies to outperform competitors. The priority of the quality focus that the market
expects is related to the current quality status in three aspects: (1) Reducing costs, (2)
Decreasing defects, and (3) Quality of worker satisfaction, respectively. But some
aspects are unrelated to current quality status, particular in speeding delivery.

120
From Chi-Square testing, Level of Significance of 0.00 it is presented that there is a
relationship between Current quality status and degree of importance. Figure 7.5.1
shows that most Thai food processing companies (more than 50%) agreed that all
current quality status issues are very important. The most important issues are Reducing
cost and Decreasing defects; they are very high percentages (more than 75%). Only a
small percentage of the degree of importance from all the current quality status
categories is unimportant.
Current quality status and degree of importance
0
10
20
30
40
50
60
70
80
90
100
Reducing cost Decreasingdefects
Quality of worklife of
employees
Research anddevelopment ofproduct quality
Improvingcustomer after
service
Speedingdelivery
Current quality status
Perc
enta
ge o
f res
pond
ent
Unimportant
Important
Very important
Figure 7.5.1 Current Quality Status and Degree of Important
Thai food processing companies need to outperform their competitors, To do this, most
use a business performance measure in the area of market share, product image, overall
quality, delivery performance, productivity and manufacturing cost. Figure 7.5.2 shows
there is relationship between business performance and comparison with competitors
(Chi-Square testing Significance, Sig. = 0.00). The comparison with competitors in all
aspects of business performance show that most Thai food processing companies are
better than average (Average and Among the best). Approximately 50% of the Thai
food processing industry is among the best. The business performance in aspects of
Level of flexibility (13.6%), Level of delivery performance (8.3%), Level of company
reputation (8.0%), Level of overall quality (6.2%), Level of manufacturing cost (6.2%),

121
Level of advanced technology (2.6%), and Level of productivity (1.1%) in some Thai
food processing industry should be improved. The Level of overall quality in some Thai
food processing companies should be improved immediately (Chapters 9 and 10).
Business performance and comparison with competitors
0102030405060708090
100
Leve
l of p
rodu
ct im
age
Leve
l of d
eliv
ery
perfo
rman
ce
Leve
l of p
rodu
ctiv
ity
Leve
l of h
uman
reso
urce
deve
lopm
ent
Leve
l of m
arke
t sha
re
Leve
l of c
ontin
uous
impr
ovem
ent
activ
ities
Leve
l of a
dvan
ced
tech
nolo
gy
Leve
l of o
vera
ll qu
ality
Leve
l of m
anuf
actu
ring
cost
Leve
l of f
lexi
bilit
y
Leve
l of o
vera
ll co
mpa
ny re
puta
tion
Leve
l of r
esea
rch
& d
evel
opm
ent o
fpr
oduc
ts
Business performance
Perc
enta
ge o
f com
paris
on w
ith c
ompe
titor
s
Among the worst
Below average
Average
Among the best
Figure 7.5.2 Business Performance needed to Outperform Competitors
7.6 Basic Company Characteristics Tools, Techniques and Best
Practices Chi-Square testing shows that Thai food organisational structure had a relationship with
implementation (Chi-Square test, Sig. 0.00047). Figure 7.6.1a shows that although more
than 57% of Thai food processing companies partially implement all these
organisational structures, they should be improved to full implementation. Most
emphasise the Matrix structure including sales, marketing, design, and production of
new product (42.9%) rather than Cross functional groups for problem solving (34.7%),
Self controlling groups in the production area (22.4%), Matrix structure including
production and maintenance in problem solving (18.4%), compared with other
implementation Figure 7.6.1b.

122
Organisation Structure and Implementation
0102030405060708090
100
Matrix structureinc. production
and maintenancein problem
solving
Self controllinggroups in the
production area
Cross functionalgroups
Matrix structureinc. sales,marketing,design, and
production innew production
Organisation structure
Perc
enta
ge o
f res
pond
ent
Very much
Some
Figure 7.6.1a Organisation Structure and Implementation
Full (very much) implementation of organization structure
05
1015202530354045
Matrix structure inc.sales, marketing, design,and production in new
production
Cross functional groups Self controlling groups inthe production area
Matrix structure inc.production and
maintenance in problemsolving
organization structure
Perc
enta
ge o
f res
pond
ent
Figure 7.6.1b Full Implementation of Organisation Structure

123
Chi-Square testing, Level of Significance of 0.00 shows that there is a relationship
between management characteristics and implementation. Figure 7.6.2a shows that most
Thai food processing companies used management characteristics by focusing on
Formal, responsibility of group (more than 50%) rather than Formal, depending on
person, and Informal category. Only a small percentage of Thai food processing
companies (less than 6%), which are focused on an informal system, have implemented
all management characteristics. The trend of Thai food processing companies which
intend implementing a Project planning system, Cost accounting, and Sales forecasting
40-50% are focused by Formal, depending on person. All of Thai food processing
industry has implemented quality assurance system by Formal, responsibility of group.
High percentage of Informal and Formal depending on person (30 - 50%) in
management characteristics, such as sales forecasting systems (49.12%), Cost
accounting (44.44%) and Project planning (41.82%), Education and training systems
(31.58%), and Strategy development (30%) should be improved Figure 7.6.2b.
Management characteristics and implementation
0102030405060708090
100
Qua
lity
assu
ranc
e sy
stem
Stra
tegi
c pl
anni
ng sy
stem
Perfo
rman
ce e
valu
atio
n sy
stem
Mai
nten
ance
syst
em
Stra
tegy
dev
elop
men
t
Educ
atio
n an
d tra
inin
g sy
stem
Proj
ect p
lann
ing
syst
em
Cos
t acc
ount
ing
syst
em
Sale
s for
ecas
ting
syst
em
Management characteristics
Perc
enta
ge o
f im
plem
enta
tion
Informal
Formal, dependingon person
Formal,responsibility ofgroup
Figure 7.6.2a Management Characteristics and Implementation

124
Management characteristics should be improved (focusing on Informal and Formal, depending on person)
0
10
20
30
40
50
60
Sale
sfo
reca
stin
gsy
stem
Cos
tac
coun
ting
syst
em
Proj
ect
plan
ning
syst
em
Educ
atio
nan
d tra
inin
gsy
stem
Stra
tegy
deve
lopm
ent
Mai
nten
ance
syst
em
Perfo
rman
ceev
alua
tion
syst
em
Stra
tegi
cpl
anni
ngsy
stem
Qua
lity
assu
ranc
esy
stem
Management characteristics
Perc
enta
ge o
f res
pond
ent
Figure 7.6.2b Management Characteristics to be Improved
The Chi-Square test indicates that there is a relationship between management activities
and implementation at Chi-Square testing, Level of Significance of 0.00. Figure 7.6.3a
shows that most Thai food processing companies have implemented these management
activities fully, but there are only two management activities which most Thai food
processing companies have implemented partially (more than 50%) such as
Encouraging the internal customer concept and Encouraging job rotation. A high
percentage of implementation of management activities (more than 70%) which Thai
food processing industry has implemented fully is Improving work environment and
safety (82.6%), Training and education of employees (81.3%), Instilling quality
consciousness in employees (78.3%), Establishing individual performance (78.3%),
Providing assistance to suppliers in problem solving (75.5%), and Communicating
common organisational goals across functions (74.7%), respectively. A small
percentage of Thai food companies has not implemented these management activities
(less than 10%).
Figure 7.6.3b shows a very high percentage of None and Some (> 50%) in management
activities, such as Encouraging job rotation (63.8%) and Encouraging the internal
customer concept (56.5%) should be improved immediately. A High percentage of
None and Some (30 - 50%) in management activities, such as Empowering of

125
employees' participation (38%), Empowering employees' decision making (36.1%), and
Development of individual performance (33.3%) needs to be improve.
Management activities and implementation
0102030405060708090
100
Impr
ovin
g w
ork
envi
ronm
ent a
ndsa
fety
Trai
ning
and
edu
catio
n of
empl
oyee
s
Inst
illin
g qu
ality
con
scio
usne
ss in
empl
oyee
s
Esta
blis
hing
indi
vidu
al p
erfo
rman
ce
Prov
idin
g as
sist
ance
to su
pplie
rs in
prob
lem
solv
ing
Com
mun
icat
ing
com
mon
orga
niza
tiona
l goa
ls a
cros
sfu
nctio
ns
Dev
elop
men
t of i
ndiv
idua
lin
itiat
ives
Empo
wer
ing
empl
oyee
s' de
cisi
onm
akin
g
Empo
wer
ing
of e
mpl
oyee
s'pa
rtici
patio
n
Enco
urag
ing
the
inte
rnal
cus
tom
erco
ncep
t
Enco
urag
ing
job
rota
tion
Perc
enta
ge o
f res
pond
ent
None
Some
A lot
Figure 7.6.3a Management Activities and Implementation
Management activities should be improved
0
10
20
30
40
50
60
70
Enco
urag
ing
job
rota
tion
Enco
urag
ing
the
inte
rnal
cust
omer
con
cept
Empo
wer
ing
of e
mpl
oyee
s'pa
rtici
patio
n
Empo
wer
ing
empl
oyee
s'de
cisi
on m
akin
g
Dev
elop
men
t of i
ndiv
idua
lin
itiat
ives
Com
mun
icat
ing
com
mon
orga
niza
tiona
l goa
ls a
cros
sfu
nctio
ns
Prov
idin
g as
sist
ance
tosu
pplie
rs in
pro
blem
sol
ving
Esta
blis
hing
indi
vidu
alpe
rfor
man
ce
Inst
illin
g qu
ality
con
scio
usne
ssin
em
ploy
ees
Trai
ning
and
edu
catio
n of
empl
oyee
s
Impr
ovin
g w
ork
envi
ronm
ent
and
safe
ty
Perc
enta
ge o
f res
pond
ent
Figure 7.6.3b Management Activities to be Improved
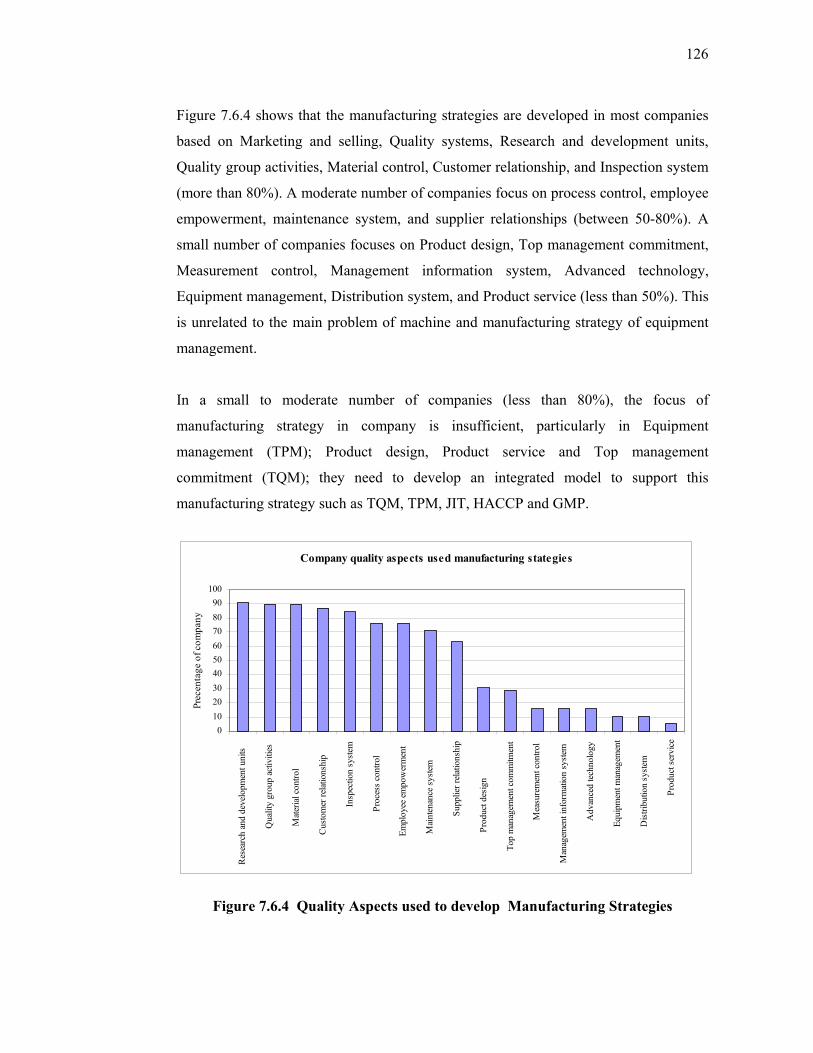
126
Figure 7.6.4 shows that the manufacturing strategies are developed in most companies
based on Marketing and selling, Quality systems, Research and development units,
Quality group activities, Material control, Customer relationship, and Inspection system
(more than 80%). A moderate number of companies focus on process control, employee
empowerment, maintenance system, and supplier relationships (between 50-80%). A
small number of companies focuses on Product design, Top management commitment,
Measurement control, Management information system, Advanced technology,
Equipment management, Distribution system, and Product service (less than 50%). This
is unrelated to the main problem of machine and manufacturing strategy of equipment
management.
In a small to moderate number of companies (less than 80%), the focus of
manufacturing strategy in company is insufficient, particularly in Equipment
management (TPM); Product design, Product service and Top management
commitment (TQM); they need to develop an integrated model to support this
manufacturing strategy such as TQM, TPM, JIT, HACCP and GMP.
Company quality aspects used manufacturing stategies
0102030405060708090
100
Res
earc
h an
d de
velo
pmen
t uni
ts
Qua
lity
grou
p ac
tiviti
es
Mat
eria
l con
trol
Cus
tom
er re
latio
nshi
p
Insp
ectio
n sy
stem
Proc
ess
cont
rol
Empl
oyee
em
pow
erm
ent
Mai
nten
ance
sys
tem
Supp
lier r
elat
ions
hip
Prod
uct d
esig
n
Top
man
agem
ent c
omm
itmen
t
Mea
sure
men
t con
trol
Man
agem
ent i
nfor
mat
ion
syst
em
Adv
ance
d te
chno
logy
Equi
pmen
t man
agem
ent
Dis
tribu
tion
syst
em
Prod
uct s
ervi
ce
Prec
enta
ge o
f com
pany
Figure 7.6.4 Quality Aspects used to develop Manufacturing Strategies

127
7.7 Manufacturing Practices for Thai Food Processing Companies:
GMP, HACCP, JIT, TPM and TQM This section discusses the implementation of GMP, HACCP, JIT, TPM and TQM by
Thai food processing companies. The level of implementation of any manufacturing
practice is indicated below:
1. Number of respondents who are unfamiliar with manufacturing practices.
2. Number of respondents who are familiar with manufacturing practices.
3. Number of respondents who are familiar with and understand the manufacturing
practices.
4. Number of the companies that apply manufacturing practices.
The two practices most familiar to all Thai food processing companies are GMP and
HACCP, of the other practices, TQM is used rather than TPM and JIT (Figure 7.5.2).
According to food safety law in Thailand, every company had to obtain a certificate of
GMP practices before 31 July 2003 (Dewongpasart, 2003)
The above findings are in accordance with the introduction of GMP and HACCP in the
Thai food processing industry, implemented before the year 2000 (about 20 and 18
companies, respectively). The implementation of these two practices is increasing
dramatically every year. TQM was started before the year 2000 with about 6 companies
and 2 companies implemented TPM in the year 2000. These groups are growing every
year. However, the implementation of JIT has decreased from 5 to 3 companies from
2000 to 2001.
The Chi-Square testing indicates that there is a relationship between manufacturing
practices and familiarity of manufacturing practices (Chi-Square testing; significance,
Sig. = 0.00). Figure 7.7.1 shows that all Thai food processing companies are familiar
with GMP and HACCP. Most companies (55-70%) have only heard about JIT, TPM,
and TQM. Only 28.1%, 18.8%, and 13.2% of Thai food-processing companies have an
understanding of TQM, JIT and TPM respectively.
A very high percentage (80%) of Thai food processing companies are just familiar with
TQM, JIT, and TPM practices, but 7.5% have never heard of TPM .

128
Familiarity with manufacturing practices
0
10
20
30
40
50
60
70
80
90
100
GMP HACCP TQM JIT TPMManufacturing practices
Perc
enta
ge o
f res
pond
ent
Never heard
Heard
Familiar understand
Applying it now
Figure 7.7.1 Familiarity with Manufacturing Practices
Figure 7.7.2 shows the introduction of manufacturing practices in Thai food processing
companies. There is an increase in all manufacturing practices every year, particularly
GMP, HACCP, and TQM. Most companies have introduced GMP and HACCP. TPM
and JIT have been implemented to a lesser extent than the others.
First introduce manfacturing practices
2023
33
40
18
22
30
42
532 3
768
12
28
0
5
10
15
20
25
30
35
40
45
Earlier (state) 2000 2001 2002
Year
Num
ber o
f com
pany GMP
HACCPJITTPMTQM
Figure 7.7.2 Introduction of Manufacturing Practices

129
The result of Chi-Square testing is significant in that it shows there is a relationship
between manufacturing practices and implementation (Chi-Square test, Sig. = 0.00).
Figure 7.7.3 shows all of Thai food processing companies had implemented GMP and
HACCP by 2002. The percentages of implementation of TQM (22.7%), TPM (16.4%),
and JIT (11.8%) are very low. However, the companies plan to implement TQM and
TPM after implementing GMP and HACCP. The results indicated 70.73% of Thai food
processing companies have future plans to implement TQM and TPM. However, 70.6%
said they do not have any plans for implementing these strategies.
In terms of future plans to implement manufacturing practices, the Chi-Square testing
found there is no relationship between manufacturing practices and years of
implementation (Chi-Square testing; Significance, Sig.= 0.89). About 50% of Thai food
processing companies had plans to implement TQM by the year 2003 and plan to
implement TPM practice by the year 2005 or later depending on the capability of the
company.
Manufacturing practices and Implementation
0
10
20
30
40
50
60
70
80
90
100
GMP HACCP TQM TPM JITManufacturing practices
Perc
enta
ge o
f res
pond
ent
No, without future plan
No, but have future plan
Yes, implementing
Figure 7.7.3 Current Implementation of Practices

130
Figure 7.7.4 shows that the Thai food processing manufacturing practices implemented
GMP, HACCP and TQM (46.55%) concurrently, implements GMP and HACCP
(32.76%), implements GMP, HACCP, TPM and TQM (10,34 %), GMP, HACCP, TQM
and JIT (6.90%) and implements GMP (3.45 %). The classification of plants into four
groups will be used to examine the hypothesis in the next section.
Implementation GMP, HACCP, TPM, JIT and TQM practices
05
101520253035404550
GMP,HACCPand TQM
GMP and HACCP
GMP HACCP TPM and TQM
GMP HACCPJITand TQM
GMP
Manufacturing practices
Perc
enta
ge o
f com
pany
Figure 7.7.4 Implementation Status of GMP, HACCP, TQM, and TPM
As shown in Figure 7.7.5, Thai food processing companies recognise all aspects of
Customer requirements, Government requirements, the Competitive market, and
Company policy as motivation to implement these practices (more than 90%). Figure
7.7.6 shows there is a relationship between Company performance and Percentage of
benefits (Chi-Square testing; Significance; Sig. =0.00). Most Thai food processing
companies obtain benefits of more than 75% from all company performances, excepted
Staff. The highest benefit from Staff (59.5%) is in the 50 to 75% category. There is
some benefits at 25 to 50% category (11.9%). Thai food processing companies focus
very much on benefits of Safety (90.5%) and Marketing (89%).

131
Mian motivatio to implementing GMP, HACCP, TPM, JIT and TQM
0
20
40
60
80
100
120
Customerrequirement
Govermentrequirement
Competitivemarket
Company policy other
Prec
enta
ge o
f com
pany
Figure 7.7.5 Main Motivation for Implementation of GMP, HACCP, TPM, JIT and TQM
Benefits of company performance
0
10
20
30
40
50
60
70
80
90
100
Safety Marketing Production Financial Staff
Company performance
perc
enta
ge o
f ben
efits
25-50%50-75%75-100%
Figure 7.7.6 Benefits of Company Performance from Manufacturing Practices

132
7.8 Best Manufacturing Practice for Thai Food Processing
Companies Figure 7.8.1 shows that few Thai food companies (12%) implement the combined
practices of GMP, HACCP, TPM, JIT and TQM. Most (62%) do not implement JIT
practices in the integrated model, 26% of companies do not combine practices, they just
implement them individually. It can be concluded that the implementation of individual
practice is not enough in order to achieve best practice. Companies should develop the
integrated models of GMP, HACCP, TPM and TQM but not necessarily JIT.
Figure 7.8.1 Adaptation of Best Practices in Thai Food Processing Companies
In figure 7.8.2, it is shown that many companies believe that money and employees are
the main barriers to achieve Thai food processing manufacturing excellence. These are
Quality system (69%), Management system (66%), Organisation characteristics (58%),
Management levels (57%), Production systems, Supplier managements (53%),
Maintenance systems (51%), and Customer contracts (49%). A small number of
companies criticise the utilisation of production and information technologies, in house
communication, product research and development and external factors (less than 45%)
as the obstacles to achieve WCM status.
Implement each practice individually 26%
Combination of GMP, HACCP, TQM and TPM without JIT
62%
Combination all of these practice GMP,
HACCP, TPM, JIT and TQM 12%
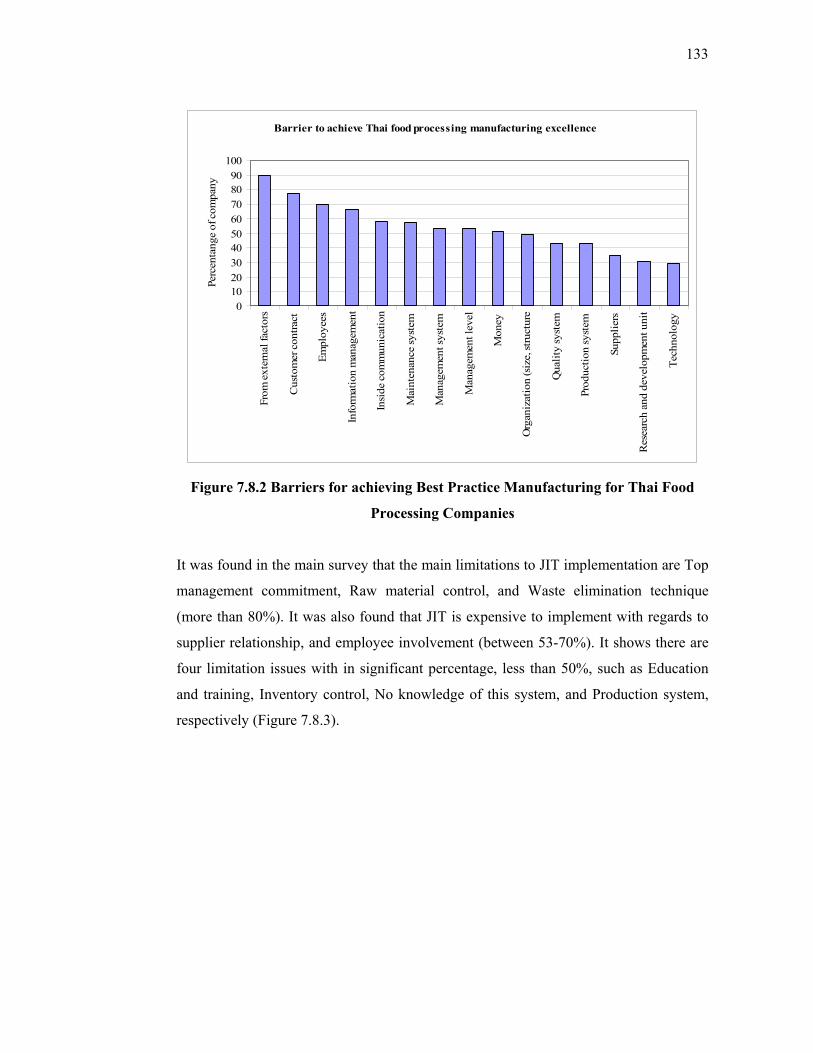
133
Barrier to achieve Thai food processing manufacturing excellence
0102030405060708090
100
Fro
m e
xter
nal f
acto
rs
Cus
tom
er c
ontra
ct
Empl
oyee
s
Info
rmat
ion
man
agem
ent
Insi
de c
omm
unic
atio
n
Mai
nten
ance
syst
em
Man
agem
ent s
yste
m
Man
agem
ent l
evel
Mon
ey
Org
aniz
atio
n (s
ize,
stru
ctur
e
Qua
lity
syst
em
Prod
uctio
n sy
stem
Supp
liers
Res
earc
h an
d de
velo
pmen
t uni
t
Tech
nolo
gy
Perc
enta
nge
of c
ompa
ny
Figure 7.8.2 Barriers for achieving Best Practice Manufacturing for Thai Food
Processing Companies
It was found in the main survey that the main limitations to JIT implementation are Top
management commitment, Raw material control, and Waste elimination technique
(more than 80%). It was also found that JIT is expensive to implement with regards to
supplier relationship, and employee involvement (between 53-70%). It shows there are
four limitation issues with in significant percentage, less than 50%, such as Education
and training, Inventory control, No knowledge of this system, and Production system,
respectively (Figure 7.8.3).
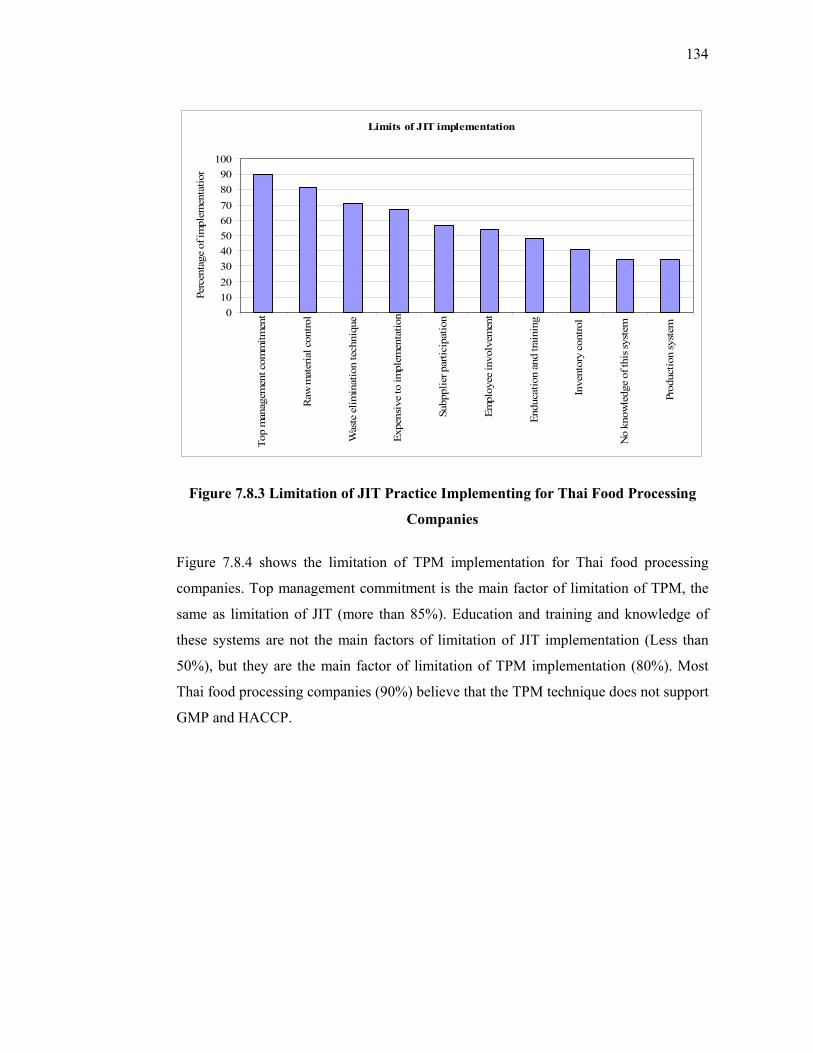
134
Limits of JIT implementation
0102030405060708090
100
Top
man
agem
ent c
omm
itmen
t
Raw
mat
eria
l con
trol
Was
te e
limin
atio
n te
chni
que
Expe
nsiv
e to
impl
emen
tatio
n
Subp
plie
r par
ticip
atio
n
Empl
oyee
invo
lvem
ent
Endu
catio
n an
d tra
inin
g
Inve
ntor
y co
ntro
l
No
know
ledg
e of
this
syst
em
Prod
uctio
n sy
stem
Perc
enta
ge o
f im
plem
enta
tion
Figure 7.8.3 Limitation of JIT Practice Implementing for Thai Food Processing
Companies
Figure 7.8.4 shows the limitation of TPM implementation for Thai food processing
companies. Top management commitment is the main factor of limitation of TPM, the
same as limitation of JIT (more than 85%). Education and training and knowledge of
these systems are not the main factors of limitation of JIT implementation (Less than
50%), but they are the main factor of limitation of TPM implementation (80%). Most
Thai food processing companies (90%) believe that the TPM technique does not support
GMP and HACCP.
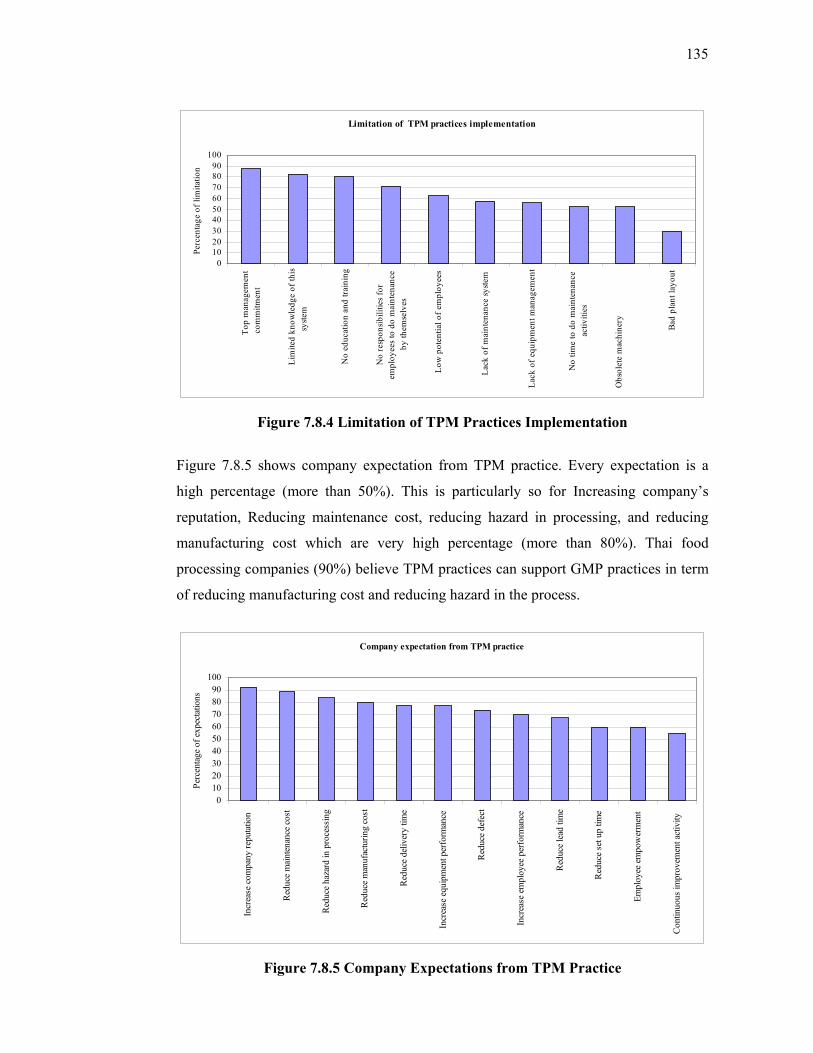
135
Limitation of TPM practices implementation
0102030405060708090
100
Top
man
agem
ent
com
mitm
ent
Lim
ited
know
ledg
e of
this
syste
m
No
educ
atio
n an
d tra
inin
g
No
resp
onsib
ilitie
s for
empl
oyee
s to
do m
aint
enan
ceby
them
selv
es
Low
pot
entia
l of e
mpl
oyee
s
Lac
k of
mai
nten
ance
syste
m
Lack
of e
quip
men
t man
agem
ent
No
time
to d
o m
aint
enan
ceac
tiviti
es
Obs
olet
e m
achi
nery
Bad
plan
t lay
out
Perc
enta
ge o
f lim
itatio
n
Figure 7.8.4 Limitation of TPM Practices Implementation
Figure 7.8.5 shows company expectation from TPM practice. Every expectation is a
high percentage (more than 50%). This is particularly so for Increasing company’s
reputation, Reducing maintenance cost, reducing hazard in processing, and reducing
manufacturing cost which are very high percentage (more than 80%). Thai food
processing companies (90%) believe TPM practices can support GMP practices in term
of reducing manufacturing cost and reducing hazard in the process.
Company expectation from TPM practice
0102030405060708090
100
Incr
ease
com
pany
repu
tatio
n
Red
uce
mai
nten
ance
cos
t
Red
uce
haza
rd in
pro
cess
ing
Red
uce
man
ufac
turin
g co
st
Red
uce
deliv
ery
time
Incr
ease
equ
ipm
ent p
erfo
rman
ce
Red
uce
defe
ct
Incr
ease
em
ploy
ee p
erfo
rman
ce
Red
uce
lead
tim
e
Red
uce
set u
p tim
e
Empl
oyee
em
pow
erm
ent
Con
tinuo
us im
prov
emen
t act
ivity
Perc
enta
ge o
f exp
ecta
tions
Figure 7.8.5 Company Expectations from TPM Practice
136
7.9 Conclusion
Thai food processing companies have various characteristics of organisation structure
and typical management, and each depends on the degree of implementation. Not all
companies select any organisational structure to implement fully, but select ideas from
each one. The outstanding organisation structure is focused on the matrix structure of
department in new production as well as cross functional groups for problem solving.
However, the self control groups in production areas and the establishment of an
organisation structure which cooperated between production and maintenance should be
recognised in order to improve productivity and manage equipment effectively. The
focal characteristics of typical management are different in each firm and also vary at
the implementation level. Most companies implement them formally and with the
responsibility of the group rather than depending on a person or informally. The quality
of food is very important for the safety and health of consumers, thus the quality
assurance system is settled on as basic management in every company, in order to
respond to the government’s regulations and to develop quality management systems
for the acceptance by the international market. Furthermore, this can be seen as the first
priority of a typical management group which is composed of strategic planning
systems, performance evaluations, and maintenance systems, respectively. However, of
the education and training system and strategy development, approximately 70% of
companies also considered them as key management issues.
In order to support the development of quality management systems in the organisation,
the following effective activities are carried out. The level of implementation is related
to the basic activities in every company. There are nine activities which are most
important as follows: (1) improving work environment and safety, (2) instilling quality
consciousness in employees, (3) establishing individual performance, (4) training and
education of employees, (5) providing assistance to suppliers in problem solving, (6)
communicating common organisational goals across functions, (7) development of
individual initiatives, (8) empowering employee decision making, and (9) empowering
of employee participation in problem solving, respectively.

137
The manufacturing strategies of Thai food processing companies are focused on market
rather than production, process or service. The market is both domestic and
international. Most manufacturing strategies are of an average standard when compared
with the competitive companies. It seems that the external benchmark is not used to
develop their manufacturing strategies companies. The current quality status of
companies emphasise reducing cost, decreasing defects, quality of worker satisfaction,
and research and development of product quality rather than improving customer after
sales service or speeding delivery. Some issue of quality status are unrelated to market
expectation, particularly to speeding delivery, which should be recognised as a means of
improving response to market demands. Due to setting manufacturing strategies, the
three groups of quality aspect are divided by percentage of company focused. The first
group is more than 80% of most companies which are based on marketing and selling,
quality system, research and development units, quality group activities, material
control, customer relationship, and inspection system. Most of these activities are
related to highlighting the marketing strategies of companies. The second group is
between 50-80%, and are as follows: process control, employee empowerment,
maintenance system, and supplier relationship. The last group, less than 50%,
emphasies product design, top management commitment, measurement control,
management information system, advanced technology, equipment management,
distribution system and product service. The key quality aspect is the equipment
management which is related to the main problems of machines in the Thai food
processing industries. It should be improved as well as other aspects, for example,
product design, product service, top management commitment, employee focus, and
supplier relationship, in order to develop the integrated model of world class
manufacturing.
Many of the levels of business performance in these companies when compared with
competitors, are between the best and average performance, particularly as to product
image, human resource development, market share, productivity, and continuous
improvement activities. In addition, when compared with other competitors, companies
should consider upgrading delivery performance and manufacturing cost. The fact is
that most companies believe that the level of flexibility is not useful to outperform
competitors.

138
Chapter 8
Hypotheses Test and Analysis
8.1 Introduction The purpose of this chapter is to examine the eight hypotheses developed in Chapter 4.
Section 8.2 explains how two hypotheses influence the way companies implement
GMP, HACCP, JIT, TPM and TQM. Section 8.3 investigates four hypotheses relating
to differences in performance among companies implementing GMP, HACCP, JIT and
TQM, and those that have no implementation at all. Section 8.4 and Section 8.5
investigate guidelines for implementing the integrated model.
8.2 Need for Development of an Integrated Model of Best Practice and Market Requirements The primary hypotheses that investigates the manufacturing practices necessary for
supporting an integrated model, as stated earlier Chapter 5, is examined in this section.
Hypothesis: 1
The Thai food processing industry needs to adapt elements of TQM, JIT, HACCP, GMP
or TPM practices in order to increase the efficiency of the implementation of factory
practice.
Item 1: The need for companies to develop the integrated model for best practice
Expected Result: The adoption of practices by companies that facilitate development
according to this integrated model.
Hypothesis : 2
Market requirements influence the decisions to apply TQM, JIT, HACCP, GMP and
TPM.

139
Item 2: The importance of market requirements in developing this best practice
Expected Result: Adoption due to dynamic market requirements. The traditional
concept of the market is inappropriate for solving this problem. It is necessary to
develop an integrated model to support rapid market change at any one time.
Due to aggressive competition, food processing companies need to upgrade their
organisational performance to outperform competitors. The main target is the
international rather than domestic market (Figure 7.2.2), therefore, products need to be
upgraded to a higher quality in order to satisfy higher customer expectations (Porter,
1985). Furthermore, most companies try to set manufacturing strategies by focusing on
process and marketing strategies rather than on production or service strategies ( Figure
7.2.3). It seems that companies need other manufacturing strategies that are aimed at
improving processing capacity as well as penetrating the market. However, companies
should adjust themselves and improve their business performance by developing the
proposed integrated model of excellence for Thai food processing companies. The
implementation of selected individual practices can not cope with all manufacturing
strategies.
The new integrated model must contain manufacturing strategies which respond to a
dynamic market and lead to realising the high potential of organisational
performance. Hence, this model is an installation of all manufacturing strategies
such as process, marketing, production, and service strategies as a mean of
responding to market change. The need for the development of this model is not
only enforced by government regulations, but it is also a response to customer
requirements, the competitive market and individual company policy (Figure 7.7.5).
[Thai food processing companies have been required inevitably to implement GMP
and HACCP for food safety and hygiene (Pongpattanasili and Arndt, 2002)].
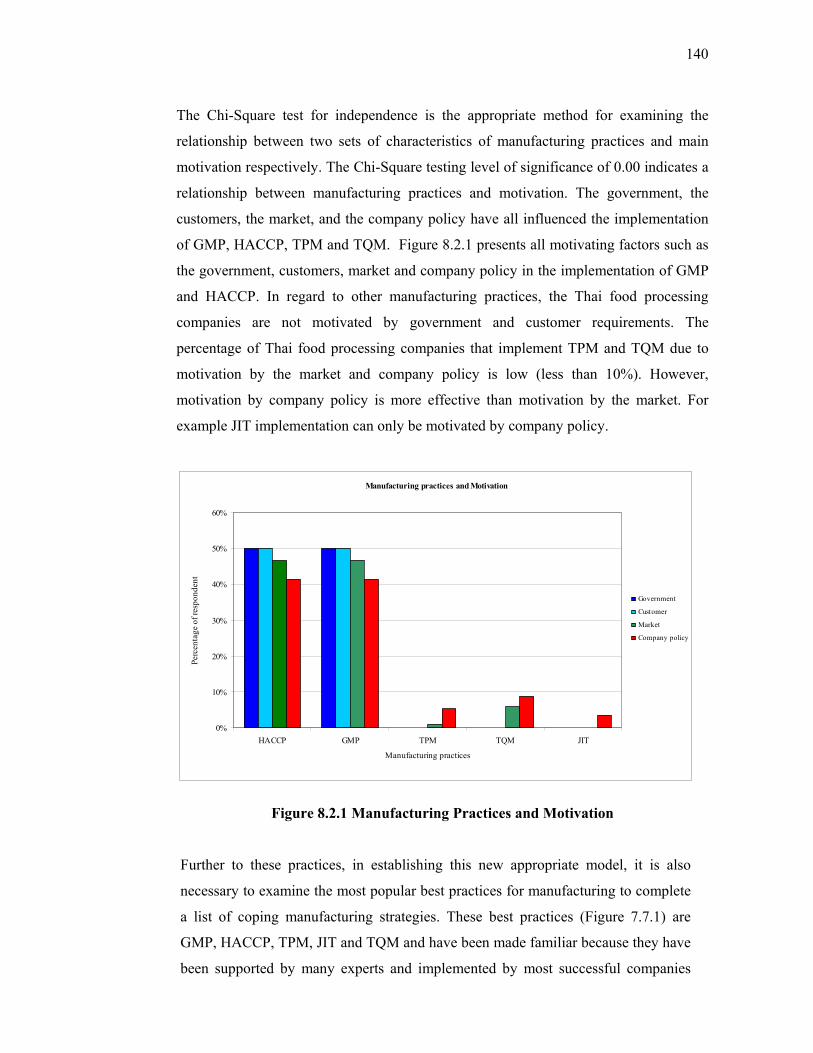
140
The Chi-Square test for independence is the appropriate method for examining the
relationship between two sets of characteristics of manufacturing practices and main
motivation respectively. The Chi-Square testing level of significance of 0.00 indicates a
relationship between manufacturing practices and motivation. The government, the
customers, the market, and the company policy have all influenced the implementation
of GMP, HACCP, TPM and TQM. Figure 8.2.1 presents all motivating factors such as
the government, customers, market and company policy in the implementation of GMP
and HACCP. In regard to other manufacturing practices, the Thai food processing
companies are not motivated by government and customer requirements. The
percentage of Thai food processing companies that implement TPM and TQM due to
motivation by the market and company policy is low (less than 10%). However,
motivation by company policy is more effective than motivation by the market. For
example JIT implementation can only be motivated by company policy.
Manufacturing practices and Motivation
0%
10%
20%
30%
40%
50%
60%
HACCP GMP TPM TQM JIT
Manufacturing practices
Perc
enta
ge o
f res
pond
ent
Government
Customer
Market
Company policy
Figure 8.2.1 Manufacturing Practices and Motivation
Further to these practices, in establishing this new appropriate model, it is also
necessary to examine the most popular best practices for manufacturing to complete
a list of coping manufacturing strategies. These best practices (Figure 7.7.1) are
GMP, HACCP, TPM, JIT and TQM and have been made familiar because they have
been supported by many experts and implemented by most successful companies
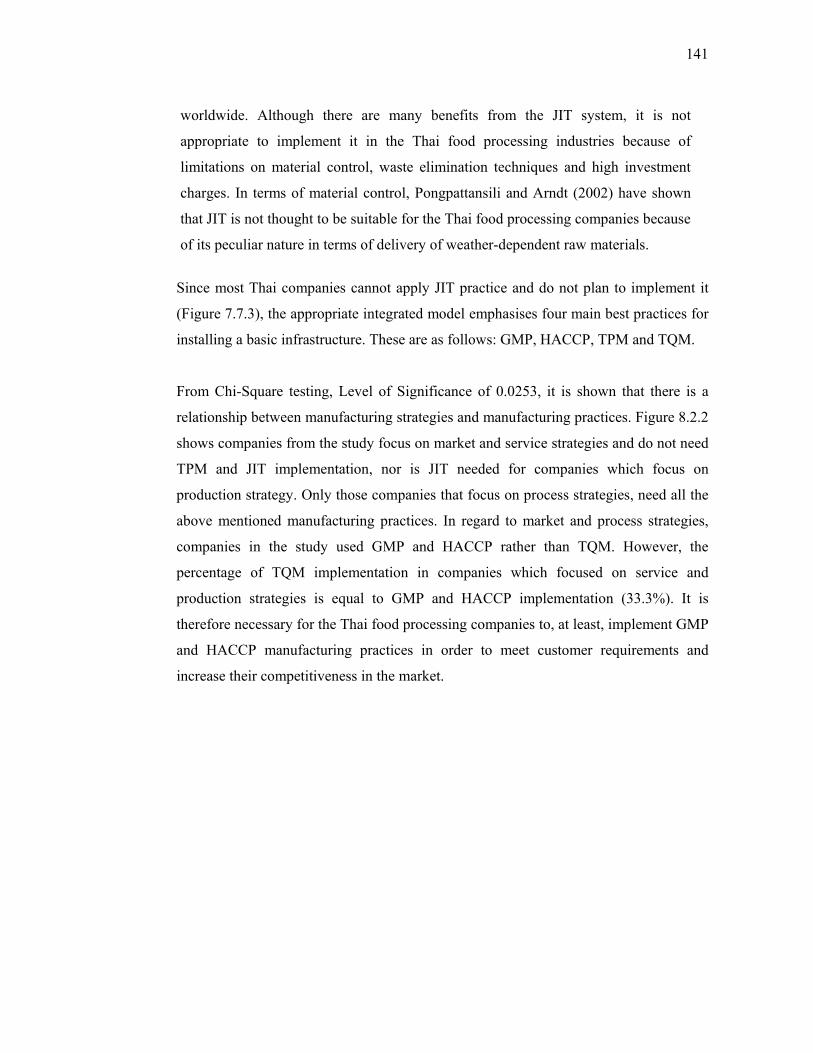
141
worldwide. Although there are many benefits from the JIT system, it is not
appropriate to implement it in the Thai food processing industries because of
limitations on material control, waste elimination techniques and high investment
charges. In terms of material control, Pongpattansili and Arndt (2002) have shown
that JIT is not thought to be suitable for the Thai food processing companies because
of its peculiar nature in terms of delivery of weather-dependent raw materials.
Since most Thai companies cannot apply JIT practice and do not plan to implement it
(Figure 7.7.3), the appropriate integrated model emphasises four main best practices for
installing a basic infrastructure. These are as follows: GMP, HACCP, TPM and TQM.
From Chi-Square testing, Level of Significance of 0.0253, it is shown that there is a
relationship between manufacturing strategies and manufacturing practices. Figure 8.2.2
shows companies from the study focus on market and service strategies and do not need
TPM and JIT implementation, nor is JIT needed for companies which focus on
production strategy. Only those companies that focus on process strategies, need all the
above mentioned manufacturing practices. In regard to market and process strategies,
companies in the study used GMP and HACCP rather than TQM. However, the
percentage of TQM implementation in companies which focused on service and
production strategies is equal to GMP and HACCP implementation (33.3%). It is
therefore necessary for the Thai food processing companies to, at least, implement GMP
and HACCP manufacturing practices in order to meet customer requirements and
increase their competitiveness in the market.

142
Manufacturing strategies and. Manufacturing practices
0%
5%
10%
15%
20%
25%
30%
35%
40%
45%
Market Process Service Production
Manufacturing strategies
Perc
enta
ge o
f res
pond
ent
HACCP
GMP
TQM
TPM
JIT
Figure 8.2.2 Manufacturing Strategies and Manufacturing Practices
8.3 Implementation of Integrated Model of Best Practice Hypothesis : 3
That those Thai food processing companies, that implement at least one of TQM, JIT,
HACCP, GMP or TPM practices, perform better than those without any of these
technologies.
Hypothesis :4
That those Thai food processing companies, that implement a combination of TQM,
JIT, HACCP, GMP and TPM or all of the 5 practices, perform better than those that
implement only one of them.
Hypothesis : 5
That those Thai food processing companies that implement a combination of HACCP,
GMP, TQM and TPM perform better than those that implement a combination of
HACCP, GMP, TQM without TPM.

143
Expected Result: The adoption of a combination of practices will reap the benefits for
the company of advantages given by the adoption of these combinations i.e. TQM
(Framework of effective QM: focus on customer satisfaction, continuous improvement,
tools and techniques of QM, and HR management & development, etc.), HACCP and
GMP (basic quality assurance for food industry), TPM (effective equipment & facility
management) and JIT (supplier management and waste elimination). In item 4, TPM is
a very important practice because the main problem of food processing is a machinery
problem, so TPM is very likely to be a real solution.
Hypothesis : 6
The limitation of HACCP and GMP practice can be overcome by putting them in the
context of TPM.
Item 6: The limitation of HACPP and GMP in context of TPM
Expected Answer: There is no limitation because there is the requirement of effective
equipment and facility management in HACCP and GMP; TPM can be implemented to
achieve this requirement reasonably well. Accordingly, the Thai food processing companies’ current quality status ( Figure 7.5.2)
is not related to the quality focus that the market expects (Figure 7.5.1), especially in
relation to speeding up deliveries. The integrated model can improve all quality aspects
and increase business performance to outperform competitors and gain more profit for
all stakeholders. These include the company, employees, the government, customers
and society in general. Hence, it can increase the market share for the company,
provide a good quality of work life for employees, comply with government
regulations, provide products of high quality for the customer, and care for the
environment (Figure 7.5.1). To the achievement of a WCM performance, the company
must get rid of all barriers.
The dominant obstacles that need to be solved are as follows: money, type of
employees, the quality and management system (Figure 7.9.2). The benefits of current
company performance are mainly in marketing and safety, but there is still a need to
take better advantage of production, financial, and human resource development

144
(See Figure 8.3.1). This integrated model can assist in achieving these benefits. Firstly,
it is necessary to build up three fundamental practices (Final inspection, GMP, and
HACCP) before extending to other best practices (TPM and TQM).
The integrated model should be utilised by companies in their efforts to achieve best
practices. These efforts are prioritised in the following order: improving work
environment and safety, instilling the need for quality consciousness to employees,
establishing individual performance goals, training and education, providing assistance
to suppliers, communicating common organisational goals across functions, developing
individual initiatives, empowering employee decision making and their participating in
problem solving, encouraging the internal customer concept, and encouraging job
rotation ( Figure 7.9.2 ).
The many frequent and urgent problems that occur in Thai food processing companies
are represented in Figure 7.3.1a, Figure 7.3.1b, Figure 7.3.2a, Figure 7.3.2b, Figure
7.3.3a, Figure 7.3.3b, Figure 7.3.4a and Figure 7.3.4b. Without any best practice, most
of them would be difficult to solve even with advanced technology or outside specialist
technical knowledge. They need to develop an appropriate model of best practices is
aimed at eliminating these problems. Just having government legislation requiring the
installation of GMP and HACCP is insufficient to gain any advantage. There are also
limitations to implementing GMP and HACCP. There needs to be a focus on quality
assurance rather than quality improvement which would result in the protection of
consumer’s health from poor quality foods. Therefore, a new integrated model should
be included in continuous quality improvement, and solving the dominant problem of
machinery breakdown (Figure 7.9.6). The four best practices (GMP, HACCP, TPM, and
TQM) are necessary to obtain WCM performance (Figure 7.9.1). However, some best
practices have the same basic infrastructure, so it is a simple matter of combining them
in order to reduce the implementation period and erase the complexity of some of the
best practices.
Figure 8.3.1 shows the relationship between manufacturing practices and their benefits
when the Chi-Square testing result has a significance of 0.00. Thai food processing
companies that focus on GMP and HACCP can gain higher profits than those that use

145
TPM, TQM and JIT. Hence, GMP and HACCP implementation brings benefits to all
areas.
Manufacturing practices and Benefits
0%
5%
10%
15%
20%
25%
30%
35%
40%
45%
50%
GMP HACCP TPM TQM JIT
Manufacturing practices
Perc
enta
ge o
f res
pond
ent
Financial
safety
staff
market
product
Figure 8.3.1 Manufacturing Practices and Benefits
In regard to implementing TQM, 18.5% of respondents in the study felt that they gained
benefits from the market, 18.3% felt the same about the product and 13.5% felt the
same staff while only 9% felt this way about safety and 8.1% felt this way about
financial benefits. TPM implementation has assisted companies to gain benefits from
the product (9.2%) rather than other areas (< 6.1%). Only benefits to the product could
be achieved by implementing JIT.

146
Looking at all aspects of business performance, according to the Chi-square testing
(Table 8.3.1), the significant level of every aspect of business performance is less than
0.05; this means that there are relationships between the manufacturing practices and
the business performance levels. The highest percentages among the best performing
companies are also shown to have implemented GMP, HACCP, TQM and TPM. In
relation to performance in aspects of quality and production, the companies that
implemented GMP, HACCP and TQM were more likely to be better performers than
those that implemented GMP, HACCP, TQM and JIT. It can be concluded that adding
JIT to the combination of GMP, HACCP and TQM had no effect in increasing the
business performance of the high achievers.
Accordingly, Hypotheses 2, 3, 6 and 4 can be considered in the light of the relationship
among manufacturing practices. A company’s implementation of a combination of
manufacturing practices gives rise to better performance (70% for all levels of business
performance, except for marketing 50-60%) than those that implement only one
manufacturing practice. In terms of Thai food processing, the combination of HACCP,
GMP, TQM and TPM practices produce a better performance than the implementation
of a combination of HACCP, GMP, TQM without TPM in regard to reducing
manufacturing cost, increasing company reputation and reducing hazards in processing.
It can therefore be concluded that business performance in Thai food processing
companies can be increased by the implementation of a combination of GMP,
HACCP, TPM and TQM strategies.
147
Table 8.3.1 Manufacturing Practices and Business Performance
Among the best (%)
Average (%)
Below average
(%)
Among the worst
(%)
Chi-Square test
level of quality 0 0 0 0 0.00 (sig.) GMP HACCP TQM TPM 91.67 8.33 0 0 GMP HACCP TQM JIT 87.5 2.5 0 0 GMP HACCP TQM 90.74 9.26 0 0 GMP HACCP 13.16 73.68 13.16 0 GMP 50 25 25
level of production 0.00 (sig.) GMP HACCP TQM TPM 83.33 16.67 0 0 GMP HACCP TQM JIT 75.00 25 0 0 GMP HACCP TQM 83.33 16.67 0 0 GMP HACCP 42.11 55.26 2.63 0 GMP 0 75 25 0 level of manufacturing cost 0.00 (Sig.) GMP HACCP TQM TPM 91.67 9.09 0 0 GMP HACCP TQM JIT 75 25 0 0 GMP HACCP TQM 70.37 29.63 0 0 GMP HACCP 31.58 71.43 15.79 0 GMP 50 50 0 Level of production image
0.03699 (Sig.)
GMP HACCP TQM TPM
91.67
8.33
0
0
GMP HACCP TQM JIT 75.00 25 0 0 GMP HACCP TQM 70.37 37.03 0 0 GMP HACCP 52.63 47.37 0 0 GMP 25.00 75.00 0 0 Level of marketing 0.00001 (Sig) GMP HACCP TQM TPM 58.33 41.67 0 0 GMP HACCP TQM JIT 51.85 48.15 0 0 GMP HACCP TQM 50 50 0 0 GMP HACCP 39.47 60.53 0 0 GMP 0 100 0 0
Manufacturing practices
Business performance

148
8.4 Relationship between Industrial Characteristics and
Product and Process Strategies Hypothesis : 7
Various characteristics of the Thai food processing industry (size, registered capacity,
product, process strategy) influence the decision to apply TQM, HACCP, GMP and
TPM.
Item 7: Is the integrated model related to (1) physical characteristics of the industry
(size, registered capacity) and (2) product and process strategy?
Expected Result: (1) Maybe not. Every company can apply this integrated model, and
(2) Yes, because if companies want to respond to radical market changes, they are
looking for an appropriate integrated model to use such as that which relies on process
and product strategies to succeed in competitive situations. This model can help them to
achieve this goal.
It is necessary for any Thai food processing company that is aiming for high business
performance to aim for WCM performance. Most large companies are ready to establish
this integrated model, but small and medium sized companies need to develop the basic
infrastructure aimed at achieving best practice. At the moment, there are only a few
small companies that are implementing TPM and TQM. This is because they need to
develop organisational structures to support this best practice such as cross functional
groups, self control groups and matrix structures, and typical management
characteristics. Moreover, the manufacturing strategies should focus beyond process
and marketing strategies. Production, product and service strategies are necessary to
establish the improvement of organisational performance and building up of the basic
infrastructure for an integrated model.

149
Figure 8.4.1 shows the relationship between manufacturing practices and firm size at a
confidence, (Chi-Square testing; Sig = 0.00). Thai food processing companies, of every
firm size, have focused on GMP, HACCP, and TQM, although there is a variance of
manufacturing practices according to company size. Hence GMP and HACCP are
implemented in small companies rather than medium and large companies. However,
TQM implementation is different from GMP and HACCP because it is implemented in
large rather than medium and small companies, respectively. TPM and JIT are not
implemented in small companies and JIT is not implemented in small and medium
companies. All the large firms have implemented all the manufacturing practices
because large firms are more willing to spend, for instance, on the cost of training.
Company size and Manufacturing practices
0%
10%
20%
30%
40%
50%
60%
GMP HACCP TQM TPM JIT
Manufacturing practices
Perc
enta
ge o
f res
pond
ent
Small
Medium
Large
Figure 8.4.1 Company Size and Manufacturing Practices
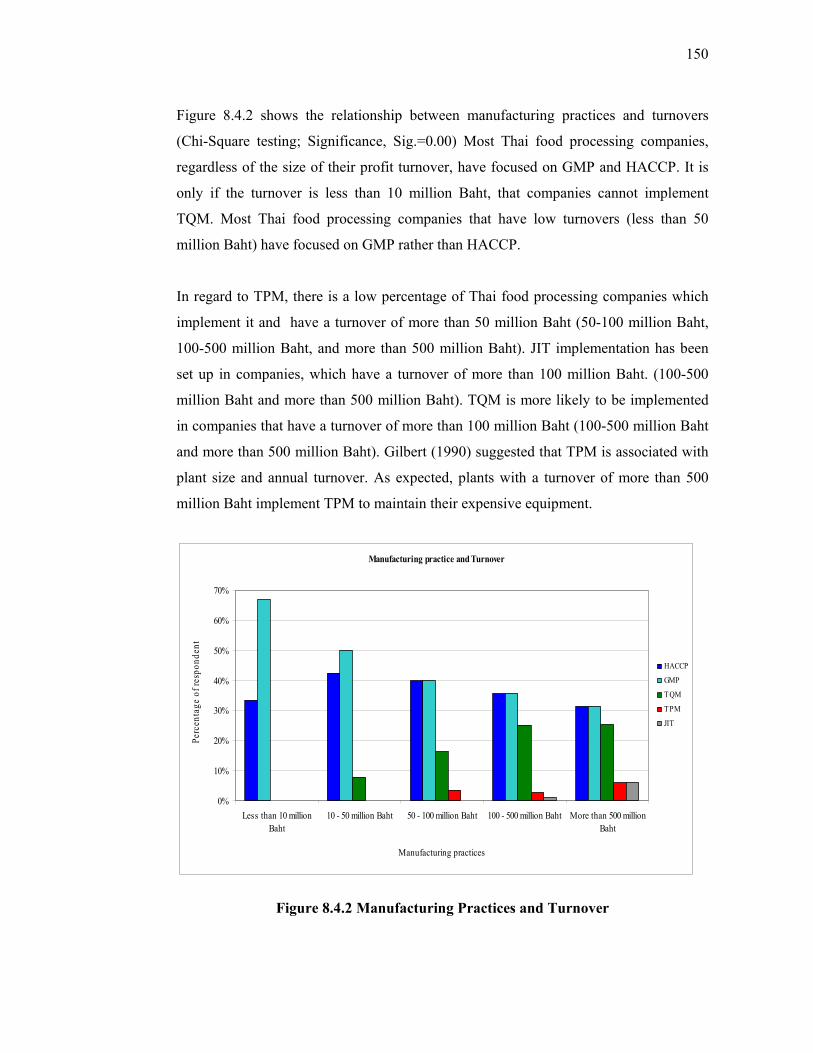
150
Figure 8.4.2 shows the relationship between manufacturing practices and turnovers
(Chi-Square testing; Significance, Sig.=0.00) Most Thai food processing companies,
regardless of the size of their profit turnover, have focused on GMP and HACCP. It is
only if the turnover is less than 10 million Baht, that companies cannot implement
TQM. Most Thai food processing companies that have low turnovers (less than 50
million Baht) have focused on GMP rather than HACCP.
In regard to TPM, there is a low percentage of Thai food processing companies which
implement it and have a turnover of more than 50 million Baht (50-100 million Baht,
100-500 million Baht, and more than 500 million Baht). JIT implementation has been
set up in companies, which have a turnover of more than 100 million Baht. (100-500
million Baht and more than 500 million Baht). TQM is more likely to be implemented
in companies that have a turnover of more than 100 million Baht (100-500 million Baht
and more than 500 million Baht). Gilbert (1990) suggested that TPM is associated with
plant size and annual turnover. As expected, plants with a turnover of more than 500
million Baht implement TPM to maintain their expensive equipment.
Manufacturing practice and Turnover
0%
10%
20%
30%
40%
50%
60%
70%
Less than 10 millionBaht
10 - 50 million Baht 50 - 100 million Baht 100 - 500 million Baht More than 500 millionBaht
Manufacturing practices
Perc
enta
ge o
f res
pond
ent
HACCP
GMP
TQM
TPM
JIT
Figure 8.4.2 Manufacturing Practices and Turnover

151
According to the results of the Chi-Square test presented, there is no relationship
between manufacturing practices and manufacturing processes at a level of confidence
of 95% (Sig = 0.33). Figure 8.4.3 shows all the manufacturing processes used in the
companies studied that utilise GMP and HACCP. The latter is implemented more in
Thai food processing companies that utilise the project manufacturing process while
only the batch manufacturing process can be implemented by using all of the
manufacturing practices.
In companies that use the continuous process, TPM and JIT are not implemented and
TQM, TPM and JIT are also not implemented in companies that use the project process.
It can therefore be summarised from the above discussion that some characteristics of
the plant may or may not influence the implementation of GMP, HACCP, TPM, JIT and
TQM, depending upon the contextual factors surrounding them. TPM is influenced by
the size and turnover of the company because of the differences in financial capability
to support its implementation.
Manufacturing processes and Manufacturing practices
0%
10%
20%
30%
40%
50%
60%
70%
Continuous Batch Project
Manufacturing processes
Perc
enta
ge o
f res
pond
ent
GMP
HACCP
TQM
TPM
JIT
Figure 8.4.3 Manufacturing Process and Manufacturing Practices
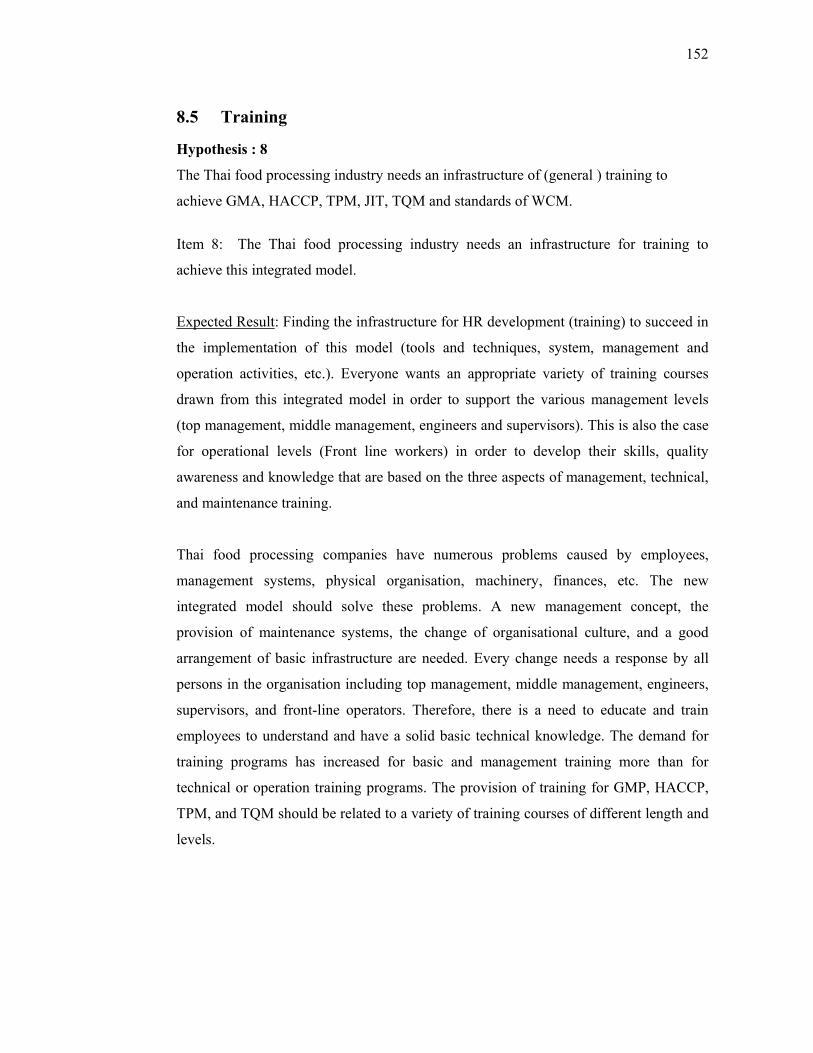
152
8.5 Training
Hypothesis : 8
The Thai food processing industry needs an infrastructure of (general ) training to
achieve GMA, HACCP, TPM, JIT, TQM and standards of WCM.
Item 8: The Thai food processing industry needs an infrastructure for training to
achieve this integrated model.
Expected Result: Finding the infrastructure for HR development (training) to succeed in
the implementation of this model (tools and techniques, system, management and
operation activities, etc.). Everyone wants an appropriate variety of training courses
drawn from this integrated model in order to support the various management levels
(top management, middle management, engineers and supervisors). This is also the case
for operational levels (Front line workers) in order to develop their skills, quality
awareness and knowledge that are based on the three aspects of management, technical,
and maintenance training.
Thai food processing companies have numerous problems caused by employees,
management systems, physical organisation, machinery, finances, etc. The new
integrated model should solve these problems. A new management concept, the
provision of maintenance systems, the change of organisational culture, and a good
arrangement of basic infrastructure are needed. Every change needs a response by all
persons in the organisation including top management, middle management, engineers,
supervisors, and front-line operators. Therefore, there is a need to educate and train
employees to understand and have a solid basic technical knowledge. The demand for
training programs has increased for basic and management training more than for
technical or operation training programs. The provision of training for GMP, HACCP,
TPM, and TQM should be related to a variety of training courses of different length and
levels.
153
To achieve a level of industry excellence, basic training is very important for
employees. Figure 8.5 shows an 81% increase in benefits from management training
and 74% for technical and operational training. Basic, management, technical and
operational training are separate in GMP, HACCP , JIT, TPM and TQM. Figure 8.5.1-
8.5.5 show that each level of employees needs a different number of days for training in
each practice.
Training program for companiesthat need to achieve Thai food proceessing industry excellence
6668707274767880828486
Basic Training Management training Technical training Operation training
Perc
enta
ge o
f tra
inin
g pr
ogra
m
Figure 8.5 Training Programs in GMP, HACCP, TPM and TQM that are
necessary for Achieving Thai Food Processing Industry Excellence
154
8.5.1 GMP training Figure 8.5.1a shows two groups with differences in the number of basic training days at
GMP for various levels of management at the following significance level (Sig. 0.05).
The first group has training courses of two to three days duration for engineers,
supervisors, middle management, and front line operators, respectively. The latter group
is made up of top management and the causes are designed for durations of less than
two days.
Figure 8.5.1b shows three groups of technical training course periods for GMP
designed for different management levels and statistically have the following
significance level (Sig. 0.05). The first group has training of more than two days for the
following management levels: supervisors (2.32±0.83), engineers (2.30±0.84), and
middle management (2.00±0.66). The second group is a homogeneous subset made up
of training course periods for middle management (2.00±0.66) and front line operators
(1.72±0.67). The third group of training course periods is for front line operators
(1.72±0.67) and top management (1.44±0.74) and does not differ significantly from the
other two groups.
Figure 8.5.1c shows that three groups of maintenance training course periods for GMP
are designed for different management levels and statistically have the following
significant level (Sig. 0.05). The first group has more than two training days for the
following levels: engineers (2.35±0.77), supervisors (2.20±0.78), and front line
operators (1.87±0.74). The second group is a homogeneous subset that is made up of
training course periods for front line operators (1.87±0.74) and middle management
(1.63±0.53). The final group of training course periods is for middle management
(1.63±0.53) and top management (1.23±0.60) and does not differ significantly.
Figure 8.5.1.d shows that there are no significant differences in management training for
GMP amongst the five management levels at Sig. 0.05. Every management level should
receive this training course for the same length of time around two to three days.

155
Figure 8.5.1 GMP Training Basic training (a)
Basic Training of GMP
0
0.5
1
1.5
2
2.5
3
Engi
neer
s
Supe
rvis
ors
Mid
dle
man
agem
ent
Fron
t lin
eop
erat
ors
Top
man
agem
ent
Num
ber o
f day
s
Technical training (b)
Technical Training of GMP
0
0.5
1
1.5
2
2.5
Supe
rvis
ors
Engi
neer
s
Mid
dle
man
agem
ent
Fron
t li n
e op
erat
ors
Top
man
agem
ent
Num
ber o
f day
s
Maintenance training (c)
Maintenance Training of GMP
0
0.5
1
1.5
2
2.5
Engi
neer
s
Supe
rvis
ors
Fron
t lin
eop
erat
ors
Mid
dle
man
agem
ent
Top
man
agem
ent
Num
ber o
f day
s
Management training (d)
Management Training of GMP
0
0.5
1
1.5
2
2.5
3
Engi
neer
s
Top
man
agem
ent
Mid
dle
man
agem
ent
Supe
rvis
ors
Fron
t lin
eop
erat
ors
Num
ber o
f day
s

156
8.5.2 HACCP Training
Figure 8.5.2a shows that there were two groups of differences in basic training days for
HACCP for various management levels at the following significance level (Sig. 0.05).
The first group is made up of longer training periods of between two to three days for
courses for the following levels of management: supervisors (2.56±0.77), middle
management (2.31±0.94), and engineers (2.02±0.83), respectively. In the latter group,
some training course periods for management level are in a homogeneous subset with
some from the first group such as middle management and engineers. However, besides
these, there are front line operators (1.81±0.63) and top management (1.79±0.77).
Figure 8.5.2b shows the two groups of technical training course periods for HACCP are
designed for different management levels and statistically have the following
significance level (Sig. 0.05). One training course period for management level
overlapped with others. This was the engineers training course. The first group has a
higher number of training days (more than two), and this was for the following levels of
management; supervisors (2.49±0.64) and engineers (2.09±0.67). The last group is
made up of training courses for engineers, front line operators (1.85±0.69), top
management (1.81±0.65), and middle management (1.65±0.48), respectively.
Figure 8.5.2c shows two groups of maintenance training course periods for HACCP that
are designed for different management levels and statistically have the following
significance level (Sig. 0.05). Most of them are in the homogeneous subset such as
engineers (2.24±0.76), middle management (1.88±0.61), and top management
(1.87±0.77). Besides this, the outstanding training courses in the first group and the last
group are that of supervisors (2.29±0.68) and front line operators (1.87±0.74),
respectively. Figure 8.5.2d shows that there are no significant differences in
management training courses periods for HACCP amongst the five management levels
at Sig. 0.05. Every management level should receive this training course for the same
period of time, i.e. around two to three days.
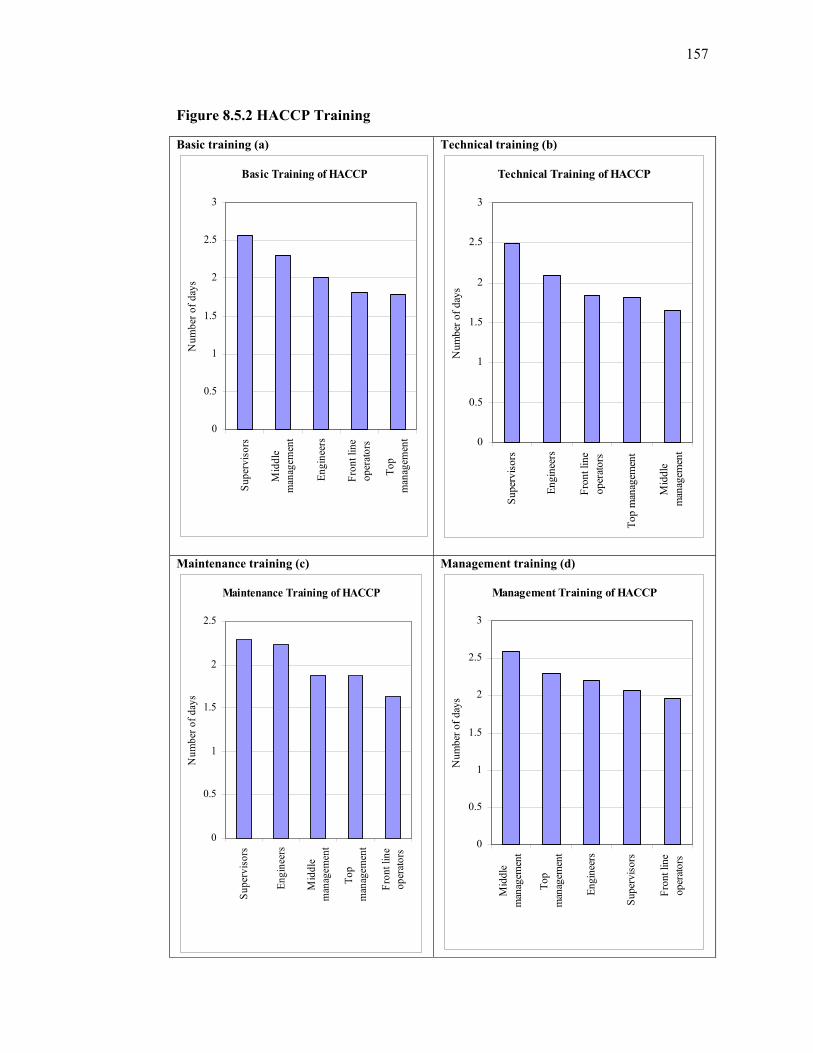
157
Figure 8.5.2 HACCP Training Basic training (a)
Basic Training of HACCP
0
0.5
1
1.5
2
2.5
3
Supe
rvis
ors
Mid
dle
man
agem
ent
Engi
neer
s
Fron
t lin
eop
erat
ors
Top
man
agem
ent
Num
ber o
f day
s
Technical training (b)
Technical Training of HACCP
0
0.5
1
1.5
2
2.5
3
Supe
rvis
ors
Engi
neer
s
Fron
t lin
eop
erat
ors
Top
man
agem
ent
Mid
dle
man
agem
ent
Num
ber o
f day
s
Maintenance training (c)
Maintenance Training of HACCP
0
0.5
1
1.5
2
2.5
Supe
rvis
ors
Engi
neer
s
Mid
dle
man
agem
ent
Top
man
agem
ent
Fron
t lin
eop
erat
ors
Num
ber o
f day
s
Management training (d)
Management Training of HACCP
0
0.5
1
1.5
2
2.5
3
Mid
dle
man
agem
ent
Top
man
agem
ent
Engi
neer
s
Supe
rvis
ors
Fron
t lin
eop
erat
ors
Num
ber o
f day
s

158
8.5.3 TPM Training
From figure 8.5.3a it can be concluded that there are no significant differences in basic
training course periods of TPM amongst the five management levels at Sig. 0.05. Every
management level should receive this basic training course.
In figure 8.5.3b it shows that there are no significant differences of technical training
course periods of TPM amongst the five management levels at Sig. 0.05. Every
management level should receive this technical training.
Figure 8.5.3c shows that there are no significant differences of maintenance training
courses of TPM amongst the five management levels at Sig. 0.05. Every management
level should get this maintenance training course.
In figure 8.5.3d shows that there are no significant differences in management training
courses of TPM amongst the five management levels at Sig. 0.05. Every management
level should receive this management training course.

159
Figure 8.5.3 TPM Training Basic training (a)
Basic Training of TPM
0
0.5
1
1.5
2
2.5
Engi
neer
s
Top
man
agem
ent
Supe
rvis
ors
Mid
dle
man
agem
ent
Fron
t lin
eop
erat
ors
Num
ber o
f day
s
Technical training (b)
Technical Training of TPM
0
0.5
1
1.5
2
2.5
Mid
dle
man
agem
ent
Engi
neer
s
Supe
rvis
ors
Top
man
agem
ent
Fron
t lin
eop
erat
ors
Num
ber o
f day
s
Maintenance training (c)
Maintenance Training of TPM
0
0.5
1
1.5
2
2.5
Mid
dle
man
agem
ent
Engi
neer
s
Fron
t lin
eop
erat
ors
Supe
rvis
ors
Top
man
gem
ent
Num
ber o
f day
s
Management training (d)
Management Training of TPM
1.6
1.65
1.7
1.75
1.8
1.85
1.9
1.95
2
2.05
2.1
Fron
t lin
e op
erat
ors
Engi
neer
s
Mid
dle
man
agem
ent
Supe
rvis
ors
Top
man
agem
ent
Num
ber o
f day
s
160
8.5.4 TQM Training Figure 8.5.4a shows that there are no significant differences for management training
courses for TQM amongst the five management levels at Sig. 0.05. Every management
level should receive this basic training course.
Figure 8.5.4b shows that the outstanding group of technical training course periods of
TQM for middle management differs from the others, significance at Sig. 0.05. The last
group of training courses is designed for engineers, top management, supervisors, and
front line operators, respectively.
Figure 8.5.4c shows that the three groups of maintenance training courses for TQM are
designed for different management levels and statistically have the following
significance level (Sig. 0.05). The first group with the higher number of training days is
made up of middle management (2.76±0.53) and engineers (2.24±0.71). The
homogeneous subset overlapping the first and second groups is engineers. The second
group are engineers, supervisors (1.72±0.57), and front line operators (1.72±0.57).
There is also overlapping between the second and third groups including supervisors
and front line operators. Apart from this, the outstanding training course in the last
group is the top management course.
Figure 8.5.4d shows that the outstanding management training course for TQM for
middle management is different from the others and statistically has the following
significance level (Sig. 0.05), and is approximately of three to four days duration. The
last group of training courses is approximately between two to three days for engineers,
top management, supervisors, and front line operators, respectively.

161
Figure 8.5.4 TQM Training Basic training (a)
Basic Training of TQM
1.8
1.85
1.9
1.95
2
2.05
2.1
2.15
2.2
2.25
2.3
Mid
dle
man
agem
ent
Engi
neer
s
Top
man
agem
ent
Supe
rvis
ors
Fron
t lin
eop
erat
ors
Num
ber o
f day
s
Technical training (b)
Technical Training of TQM
0
0.5
1
1.5
2
2.5
3
Mid
dle
man
agem
ent
Engi
neer
s
Top
man
agem
ent
Supe
rvis
ors
Fron
t lin
eop
erat
ors
Num
ber o
f day
s
Maintenance training (c)
Maintenance Training of TQM
0
0.5
1
1.5
2
2.5
3
Mid
dle
man
agem
ent
Engi
neer
s
Supe
rvis
ors
Fron
t lin
eop
erat
ors
Top
man
gem
ent
Num
ber o
f day
s
Management training (d)
Management Training of TQM
0
0.5
1
1.5
2
2.5
3
3.5
4
Mid
dle
man
agem
ent
Engi
neer
s
Top
man
agem
ent
Supe
rvis
ors
Fron
t lin
eop
erat
ors
Num
ber o
f day
s

162
8.5.5 JIT training For JIT training, there are two groups of basic training courses for various management
levels that have significant differences at Sig. 0.05. Middle management (1.87±0.82),
supervisors (1.57±0.51), and front line operators (1.57±0.51), respectively overlap the
two groups. The outstanding courses of the first and the last group are engineers
(2.10±0.72) and top management (1.40±0.55), respectively.
There are no significant differences for technical training course periods for JIT
amongst the five management levels at Sig. 0.05. Every management level should
receive this technical training course. There are also no significant differences in
maintenance training course periods for JIT amongst the five management levels at Sig.
0.05. Every management level should receive this maintenance training course. There
are no significant differences in management training courses for JIT amongst the five
management levels at Sig. 0.05. Every management level should receive this
management training course.
8.6 Conclusion The eight hypotheses that have been investigated in this chapter are all acceptable. As a
result, further investigations is necessary to relate the findings of the survey of Thai
food processing companies in Chapter 7 to the appropriate integrated Thai food
processing manufacturing strategy model developed in Chapter 4. The next chapter will
discuss this further.

163
Chapter 9
Data Analysis Supporting the Implementation of an
Appropriate Thai Food Processing Manufacturing Strategy
Model
9.1 Introduction In order to achieve best practice, the Thai food processing industry needs to develop a
new appropriate model that integrates the various manufacturing practices including
GMP, HACCP, TPM, and TQM. However, each manufacturing practice has particular
individual characteristics so that when they are being combined, it is necessary to
understand their basic infrastructure in the early stages of implementation. Therefore,
one should study the elements of the basic infrastructure of each of the practices before
setting them up as the base for the development of the model.
This study focuses on analysing the implementation of the various manufacturing
practices before developing an appropriate model and before developing an appropriate
model and education and training of the workforce by Thai food processing companies
throughout their organisations (Chapter 10). The data analysis is based on grouping the
percentage of respondents according to the focus of each of the items in each question.
Furthermore, it separates the various items into four groups according to how they are
implemented in these companies. If there are more than 50% of respondents
implementing the practice, it means that status of the implementation of this item in
Thai food processing companies is important.
9.2 Elements or Basic Infrastructure of an Organisation Table 9.1 shows that the percentage of the 123 Thai food processing companies
investigated in Chapter 7, were the best when their business performance was compared
with their competitors.

164
However, some elements in the majority of these companies could be improved, in
regard to overall quality, manufacturing cost, flexibility, overall company reputation,
and research & development of products. These business performances were affected by
the elements of their organisations that are shown in Table 9.2 (Organisational
structure), Table 9.3 (Management system), Table 9.4 (Management activities), and
Table 9.5 (Potential of problem solving)
Table 9.1 Competitive Business Performance
Percentage of respondent Indicators of Business performance
for high performing companies Need for
Improvement
Improved Good Best
0%-20% 20%-50% 50%-80% 80%-100% Level of product image X Level of delivery performance X Level of productivity X Level of human resource development X Level of market share X Level of continuous improvement activities
X
Level of advanced technology X Level of overall quality X Level of manufacturing cost X Level of flexibility X Level of overall company reputation X Level of research & development of products
X
9.2.1 Organisational structure Most of companies surveyed had not fully implemented the organisational structures
represented in Table 9.2.1. These structures are needed for co-operation amongst units
or departments and for decentralising the authority of decision making by the various
groups of employees in order to manage and control by themselves. They need to
improve, particularly the matrix structure, includes production and maintenance in
problem solving. Consequently, the table shows a very low percentage of
implementation rates from respondents.

165
Table 9.2.1 Organisational Structure
Percentage of respondents Need for
Improvement
Improved Good Best
Full implementation 0%-20% 20%-50% 50%-80% 80%-100% Matrix structures inc. sales, marketing, design, and production in new product
X
Cross functional groups X Self controlling groups in the production area
X
Matrix structures inc. production and maintenance in problem solving
X
9.2.2 Management Systems Most of the Thai food processing companies are very strong in quality assurance
systems and strategic planning which were implemented formally and was the
responsibility of groups. Moreover, other management systems were quite good in areas
such as performance evaluation systems, maintenance systems, strategy development,
education and training, project planning, and cost accounting systems. (Table 9.2.2)
Table 9.2.2 Management Systems
Percentage of respondents Need for
Improvement
Improved Good Best
Formal implementation, responsibility of groups
0%-20% 20%-50% 50%-80% 80%-100%
Quality assurance systems X Strategic planning X Performance evaluation systems X Maintenance systems X Strategy development X Education and training X Project planning X Cost accounting systems X Sales forecasting systems X

166
9.2.3 Management Activities Table 9.2.3 shows that there are some management activities that need improvement in
most Thai food-processing companies, particularly in encouraging the internal customer
concept and job rotation. Moreover, there is a strong need for improving work
environment and safety, training and education of employees, and instilling quality
consciousness.
Table 9.2.3 Management activities
Percentage of respondents Need for
Improvement
Improved Good Best
Full implementation 0%-20% 20%-50% 50%-80% 80%-100% Improving work environment and safety
X
Training and education of employees X Instilling quality consciousness in employees
X
Establishing individual performance X Providing assistance to suppliers in problem solving
X
Communicating common organisational goals across functions
X
Development of individual initiatives X Empowering employees’ decision making
X
Empowering employees’ participation X Encouraging the internal customer concept
X
Encouraging job rotation X 9.2.4 Potential of problem solving Tables 9.2.4a – 9.2.4d show the potential of problem solving which occurred in the
companies that were investigated. Some problems in most businesses were easy to
solve, such as, lack of production performance and time wasting. However, some were
not, such as lack of commitment by top management, teamwork, machinery
breakdowns, availability of material, meeting customer deadlines, production schedules,
measurement of control systems, budget planning, cost controlling & evaluation,
overstocking & inventory evaluation, information management, lack of product ideas
development, understanding customer demands, community relationships, resource
planning, understanding competitors’ business, and setting manufacturing strategies.

167
Table 9.2.4 a Potential of Solving Human Resource Problems
Percentage of respondents Need for
Improvement
Improved Good Best
Simple Problems 0%-20% 20%-50% 50%-80% 80%-100% Safety problems in the workplace X Insufficiency of technical skill X Personal conflict X Lack of employee empowerment X Continuous improvement activity X Lack of management skill X Lack of commitment of top management
X
Teamwork X
Table 9.2.4 b Potential of Solving Quality Problems
Percentage of respondents Need for
Improvement
Improved Good Best
Simple Problems 0%-20% 20%-50% 50%-80% 80%-100% Lack of production performance X Time wasting X Defects X Machinery breakdown X Availability of material X Meeting customer deadlines X
Table 9.2.4 c Potential of Solving Basic Infrastructure Problems
Percentage of respondents Need for
Improvement Improved Good Best
Simple Problems 0%-20% 20%-50% 50%-80% 80%-100% Work standards X Unclear organisational structure X Production schedules X Measurement control systems X Budget planning X Cost control & evaluation X Overstocking & inventory evaluation X Information management X

168
Table 9.2.4d Potential of Solving Problems Regarding Competitors
Percentage of respondent Need for
Improvement Improved Good Best
Simple Problems 0%-20% 20%-50% 50%-80% 80%-100% Supplier relationships X Marketing plan X Lack of product idea development X Understanding customer demands X Community relationship X Resource planning X Understanding competitors’ businesses X Setting manufacturing strategies X
9.2.5 The relationship between organisational characteristics There is a relationship among the various elements of business performance,
organisational structure, management systems, management activities and the potential
of problem solving. The following relationships are grouped and shown in Table 9.2.5:
a. Safety
b. Maintenance
c. Production
d. Supplier
e. Strategic management
f. Financial management
g. Development of new product
h. Sales and marketing
i. Performance management
j. Education and training
k. Co-operation
l. Quality management
m. Continuous improvement
n. Organisation aspects
These items are also rated in the following way:
B = Best, G = Good, I = Need for improvement, and
II = Need for Immediate Improvement.

169
Table 9.2.5a Group (a) - Safety Elements
Items Details Management activities Improving the work environment and safety B Potential of solving problems Safety problems in the workplace G
Table 9.2.5b Group (b) - Maintenance Elements
Items Details Organisation structure Matrix structure including production and maintenance in
problem solving I
Management system Maintenance systems G Potential of problem solving Machinery breakdown I
Table 9.2.5c Group (c) - Production Elements
Items Details Business performance Level of productivity G Business performance Level of advanced technology G Business performance Level of flexibility I Potential of problem solving Lack of production performance B Potential of problem solving Production schedule I Potential of problem solving Overstocking & inventory evaluation II
Table 9.2.5d Group (d) - Supplier Elements
Items Details Management activities Providing assistance to suppliers in problem solving G Potential of problem solving Availability of material II Potential of problem solving Supplier relationship G
Table 9.2.4e Group (e) - Strategic Management Elements
Items Details Management system Strategic planning B Management system Strategy development G Potential of problem solving Understanding competitors’ business I Potential of problem solving Setting manufacturing strategies II
Table 9.2.5f Group (f) - Financial Management Elements
Items Details Business performance Level of manufacturing cost I Management system Cost accounting system G Potential of problem solving Budget planning I Potential of problem solving Cost control & evaluation II

170
Table 9.2.5g Group (g) - Development of New Product Elements
Items Details Business performance Level of research & development of new products I Organisational structure Matrix structure inc. sales, marketing, design, and
production in new product I
Potential of problem solving Lack of product idea development I
Table 9.2.5h Group (h) - Sales and Marketing Elements
Items Details Business performance Level of market share G Business performance Level of product image G Business performance Level of overall company reputation I Management system Sales forecasting system G Potential of problem solving Marketing planning G Potential of problem solving Understanding customer demands I Potential of problem solving Community relationships I
Table 9.2.5i Group (i) - Performance of Management Elements
Items Details
Management system Performance of evaluation system G Management activities Establishment of individual performance G
Table 9.2.5j Group (j) - Education and Training Elements
Items Details Business performance Level of human resource development G Management system Education and training G Management activities Training and education of employees B Management activities Promotion of quality consciousness in employees B Management activities Encouragement of job rotation I Potential of problem solving Insufficiency of technical skill I Potential of problem solving Lack of management skill I
Table 9.2.5k Group (k) – Co-operative Elements
Items Details Organisational structure Matrix structure inc. sales, marketing, design, and
production in new product I
Organisational structure Cross functional groups I Organisational structure Matrix structure inc. production and maintenance in
problem solving II
Management systems Project planning G Management activities Communicating common organisational goals across
functions G
Potential of problem solving Personal conflict G Potential of problem solving Teamwork I Potential of problem solving Resource planning I

171
Table 9.2.5l Group (l) - Quality Management Elements
Items Details Business performance Level of delivery performance G Business performance Level of overall quality I Management system Quality assurance B Potential of problem solving Time wasting B Potential of problem solving Defects G Potential of problem solving Meeting customer deadlines II
Table 9.2.5m Group (m) - Continuous Improvement Activities
Items Details Business performance Level of continuous improvement activities G Organisation structure Self controlling groups in the production area I Management activities Development of individual initiatives G Management activities Empowering employees’ decision making G Management activities Empowering employees’ participation G Management activities Encouraging the internal customer concept I Potential of problem solving Lack of employee empowerment I Potential of problem solving Continuous improvement activities G Potential of problem solving Lack of commitment by top management I
Table 9.2.5n Group (n) - Organisational Aspects
Items Details Potential of problem solving Unclear organisation structure G Potential of problem solving Work standard G Potential of problem solving Information management II
Therefore Table 9.2.5a – Table 9.2.5n emphasise the following points:
1. Management activities used to improve work environment and safety issues in
most companies are excellent and able to solve the safety problems in
workplace easily.
2. The established maintenance systems in most companies do not co-operate with
the production systems and therefore cannot solve problems successfully.
3. The level of productivity and level of advanced technology in most companies
rival that of the competitors, but it has a weak level of flexibility. Problems of
production schedules and overstocking and inventory evaluation occur in most
companies and cannot be solved easily. However, the problem of production
schedules is easy to solve.
4. There are management activities to provide assistance to suppliers in problem
solving and supplier relationship in most companies, but most companies still
have problems of availability of material which is not easily solved.

172
5. The strategic management in most companies is well established. However, it is
not related to problem solving, understanding of competitors’ business and
setting manufacturing strategies that occur. It should be improved to solve
simple problems.
6. Again, the cost accounting system in most companies is well established, but it
cannot be used for budget planning, and cost controlling and evaluation while
the level of manufacturing cost is still uncontrollable.
7. The development of new products should be improved for upgrading business
performance. The matrix structure including sales, marketing, design and
productions in new products is well established only in some companies, but
most other companies are unable to solve the problem of lack of product idea
development.
8. The level of market share and product image of most companies pose no
problems when compared with their competitors, but they should increase the
level of overall company reputation. There is an established sales forecasting
systems in most companies and they have the potential for solving problems of
marketing plans easily. However, they should improve the solving of problems
involving customer demands and community relationships.
9. Performance management is provided in most companies in terms of
performance systems and the assessment of individual performance.
10. The management system and management activities for supporting education
and training in order to raise the level of human resource development are
excellent with the exception of encouraging job rotation. These can support easy
solutions for problems of insufficiency of technical skill and lack of
management skill.
11. The organisation structures, matrix structure and cross-functional groups that
support co-operation amongst units in most companies should be improved.
Project planning and communication of common organisational goals exist
across functions in order to provide assistance for arrangement of work and
work co-operation. Most companies can solve problems of personal conflict
easily, but the potential for solving problems of teamwork and resource
planning should be improved.

173
12. Although there is a quality assurance system in most companies, the level of
overall quality is still not good when compared with the competitors. However,
the level of delivery performance is good. The potential for solving problems of
time wasting and defects in most companies is excellent, but improvements
could be made regarding meeting customer deadline.
13. The level of continuous improvement activities in most companies is good;
however, there has not been sufficient establishment of self-control groups in
the production area. There is also no encouragement of the internal customer
concept which could be improved. Most companies should focus on solutions
for the lack of commitment of top management.
14. There is the ability to solve unclear organization structure and work standards in
most companies, but there is a problem of information management. Again, the
potential for solving this problem needs to be improved.
9.3 Manufacturing Practices This model is developed from the real database of respondents drawn from an existing
group of Thai food processing companies. The models has also originated from GMP
and HACCP practices and have developed their quality assurance to the level of WCM
practice by integrating other manufacturing practices such as TPM and TQM. It
proposes the implementation of the following manufacturing practices in Thai food
processing companies at present:
1. GMP and HACCP should be established through enforcement of government
regulations in order to assure food safety for consumers. Hence, all Thai food
processing companies should implement them.
2. TPM implementation has been added to this model. It aims to assist optimising
and solving problems of machinery and equipment.
3. TQM should be implemented in order to improve quality rather than simply
assure quality management systems. It needs to involve every employee and
member of management in order to increase organisational performance by their
contribution to the process. This management process should include all
resources and cover all manufacturing practices.

174
All the Thai food processing companies mentioned in Chapter 7 have already
implemented GMP and HACCP, but TQM and TPM were only applied by a small
number of them. More than 80% of these companies did not implement TPM and TQM.
However, most of them have future plans for doing so.
9.4 Application of Tools and Techniques This section is concerned with tools and technique for supporting a Thai food
processing industry model. They are explained in detail in Chapter 4 and constitute
the core of the integrated model. The 42 tools and techniques that are investigated in
this study can be classified into four groups. These are:
1. Tools that are related to GMP and HACCP (Figure 9.4.1, Table 9.4.1),
2. Basic tools (Figure 9.4.2, Table 9.4.2),
3. Tools related to supplier management (Figure 9.4.3, Table 9.4.3),
4. Management tools (Figure 9.4.4, Table 9.4.4).
9.4.1 Tools and Techniques related to GMP and HACCP According to Chi-Square testing Level of Significance of 0.00, it indicates that there is a
relationship between tools and techniques related to GMP and HACCP. Figure 9.4.1
indicates that there are two groups drawn from the surveyed companies focusing on
their degree of importance (Appendix F). They are classed as “very important” and
“important”. The first group expected tools and techniques related to GMP and HACCP
to solve more than 80% of their problems. These are in the area of hazard analysis,
transport control, pest control, environment control, personal hygiene, product recall,
product instructions to customers, loss control and safety management.

175
Tools and techniques related with GMP and HACCP and their degree of importance
0
10
20
30
40
50
60
70
80
90
100
Haz
ard
anal
ysis
Tran
spor
t con
trol
P es t
con
tr ol
Env i
ronm
ent c
ontro
l
Pers
onal
Hy g
iene
Prod
uct r
ecal
l
P rod
uct i
n stru
ctio
n to
cus
tom
er
Los s
con
trol a
nd sa
fety
man
agem
ent
P roc
ess c
ontro
l
P ack
agin
g an
d s t
orag
e
Mat
eria
l co n
trol
Prev
entiv
e m
aint
enan
ce
Stan
dar d
izat
ion
of p
arts
, pro
duct
s an
d pr
oces
se
Prod
uctio
n co
ntro
l
Was
te m
anag
emen
t
Mea
sure
men
t equ
ipm
ent c
ontro
l
P lan
t lay
out
Cal
ibra
tion
Tools and techniques related to GMP and HACCP
Perc
enta
ge o
f res
pond
ent
Unimportant
Important
Very important
Figure 9.4.1 Tools and Techniques Related to GMP and HACCP and Degree of
Importance
The last group regarded the tools and techniques as only important in the following
areas: process control, packaging and storage, material control, preventive maintenance,
standardization of parts, products and processes, production control, waste management,
measurement equipment control, plant layout, and calibration. The degrees of
unimportance of all tools and techniques are very low (less than 10%). This can be
concluded from the information in Table 9.4.1.
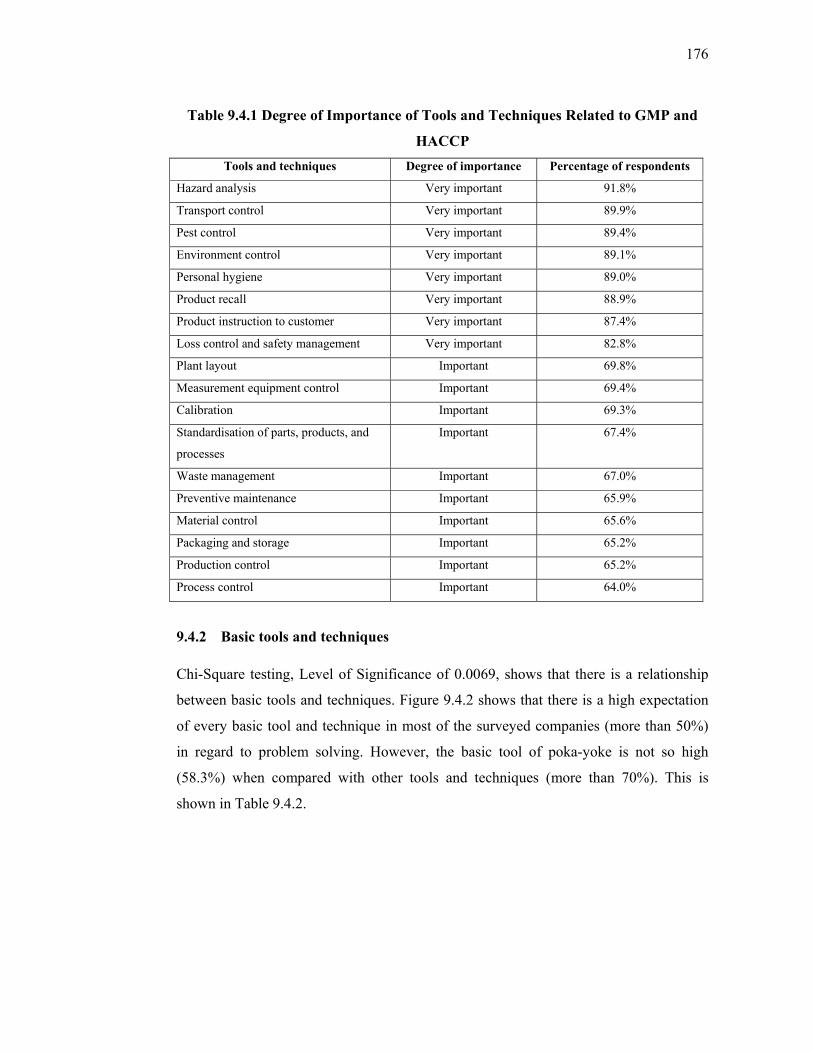
176
Table 9.4.1 Degree of Importance of Tools and Techniques Related to GMP and
HACCP Tools and techniques Degree of importance Percentage of respondents
Hazard analysis Very important 91.8%
Transport control Very important 89.9%
Pest control Very important 89.4%
Environment control Very important 89.1%
Personal hygiene Very important 89.0%
Product recall Very important 88.9%
Product instruction to customer Very important 87.4%
Loss control and safety management Very important 82.8%
Plant layout Important 69.8%
Measurement equipment control Important 69.4%
Calibration Important 69.3%
Standardisation of parts, products, and
processes
Important 67.4%
Waste management Important 67.0%
Preventive maintenance Important 65.9%
Material control Important 65.6%
Packaging and storage Important 65.2%
Production control Important 65.2%
Process control Important 64.0%
9.4.2 Basic tools and techniques Chi-Square testing, Level of Significance of 0.0069, shows that there is a relationship
between basic tools and techniques. Figure 9.4.2 shows that there is a high expectation
of every basic tool and technique in most of the surveyed companies (more than 50%)
in regard to problem solving. However, the basic tool of poka-yoke is not so high
(58.3%) when compared with other tools and techniques (more than 70%). This is
shown in Table 9.4.2.

177
Basic toos and tehniques and degree of importance
0%
20%
40%
60%
80%
100%
QC
C
PDC
A c
ycle
Insp
ectio
n an
dte
stin
g pr
oduc
t
Sugg
estio
n sy
stem
5S &
hou
seke
epin
g
SPC
Smal
l gro
upim
prov
emen
tac
tivity
Mul
ti-sk
illed
empl
oyee
s
Bas
ic 7
tool
s
Bra
nist
orm
ing
Poka
-yok
e
Basic tools and techniques
Perc
enta
ge o
f res
pord
ents
Unimportant
Important
Very important
Figure 9.4.2 Basic Tools and Techniques and Degree of Importance
Table 9.4.2 Degree of Importance of Basic Tools and Techniques
Tools Degree of importance Percentage of respondents
QCC Very important 78.6%
PDCA cycle Very important 75.5%
Inspection and testing product Very important 74.8%
Suggestion system Very important 74.5%
5S and housekeeping Very important 74.0%
SPC Very important 73.0%
Small group improvement activity Very important 71.8%
Multi-skilled employees Very important 71.3%
Basic 7 tools Very important 70.9%
Brainstorming Very important 70.2%
Poka-yoke Very important 58.3%

178
9.4.3 Tools and techniques related to supplier management
Figure 9.4.3 shows that there is a relationship between tools and techniques related to
supplier management (Chi-Square testing at Significance, 0.0008). All tools and
techniques are very important for the Thai food processing companies (more than 60%).
There are degrees of unimportance in the rating of all tools in some companies, but they
make up a low percentage (less than 5%). This can be concluded from information
given in Table 9.4.3.
Tools and techniques relate to supplier management and degree of importance
0
10
20
30
40
50
60
70
80
90
100
Supplier qualitycertification
Reduction of number ofsuppliers and distance
Total supplier evaluation Supplier long-term contract
Tools and techniques relate to supplier management
Perc
enta
ge o
f res
pond
ents
Unimportant
Important
Very important
Figure 9.4.3 Tools and Techniques related to Supplier Management and Degree of
Importance
Table 9.4.3 Degree of Importance of Tools and Techniques related to Supplier
Management
Tools and techniques Degree of importance Percentage of respondents
Supplier quality certification Very important 85.7%
Reduction of number of suppliers and
distance
Very important 80.3%
Total supplier evaluation Very important 64.0%
Supplier long-term contract Very important 62.5%

179
9.4.4 Management tools and techniques Figure 9.4.4 shows the relationship between management tools and techniques and
degree of importance at a level of confidence of 95% (Chi-Square testing at
Significance, 0.0003). There are eight tools and techniques (more than 50%) which are
rated as very important for solving the following problems: human resource
management, motivation, quality auditing, quality records, document control, effective
meetings, personnel management, and equipment management. Database and
information management are rated as being “very important” rather than “important” by
50% of the Thai food processing companies. However less than 50% of the industry
emphasised as “important” such things as cross functional management, facility
management, daily management, policy deployment, conflict management,
benchmarking and project management. Again, the differences between the “important”
and the “very important” groups varied only less than 7%. There are degrees of
unimportance in the rating of all tools in some companies, but they show low
percentages (less than 7%). This can be concluded from the information given in Table
9.4.4.
Management tools and techniques and degree of importance
0
10
20
30
40
50
60
70
80
90
100
Hum
an re
sour
ce d
evel
opm
ent
Mot
ivat
ion
Qua
lity
audi
t
Qua
lity
reco
rds
Doc
umen
t con
trol
Effe
ctiv
e m
eetin
g
Pers
onne
l man
agem
ent
Equi
pmen
t man
agem
ent
Dat
abas
e &
info
rmat
ion
man
agem
ent
Cro
ss fu
nctio
nal m
anag
emen
t
Faci
lity
man
agem
ent
Dai
ly m
anag
emen
t
Polic
y de
ploy
men
t
Con
flict
man
agem
ent
Ben
chm
arki
ng
Proj
ect m
anag
emen
t
Management tools and techniques
Perc
enta
ge o
f res
pond
ents
Unimportant
Important
Very important
Figure 9.4.4 Management Tools and Techniques and Degree of Importance

180
Table 9.4.4 Degree of Importance of Management Tools and Techniques Tools and techniques Degree of importance Percentage of respondents
Human resource management Very important 74.4%
Motivation Very important 73.4%
Quality auditing Very important 66.0%
Quality records Very important 64.5%
Document control Very important 61.5%
Effective meeting Very important 55.1%
Personnel management Very important 53.4%
Equipment management Very important 53.3%
Database and information management Very important 47.4%
Cross functional management Important 47.4%
Facility management Important 46.5%
Daily management Important 46.3%
Policy management Important 45.5%
Conflict management Important 45.5%
Policy management Important 44.8%
Benchmarking Important 42.7%
Project management Important 41.0%
9.5 Conclusion In this data analysis, the data is grouped into three important elements. These are basic
infrastructure, manufacturing practice and tools and techniques. Furthermore, less than
fifty percent of respondent companies were not operating at their full capacity and some
aspects of their business performance needed to be improved. They included such things
as level of overall quality, manufacturing costs, level of flexibility, level of overall
company reputation, and level of research & development of products.
Moreover, most Thai food processing companies had problems that related to
organisational structure and weakness on some management activities such as
encouragement of the internal customer concept and encouragement of job rotation. In
aspects regarding the potential of problem solving, there were some aspects that should
be improved such as lack of commitment by top management, poor teamwork,
machinery breakdowns, production schedules, measurement control systems, budget
planning, lack of product idea development, lack of understanding of customer
demands, community relationships, resource planning, and understanding competitors’
181
businesses. Certain aspects needed to be improved immediately. These were such
matters as availability of material, meeting customer deadlines, cost controlling &
evaluating, overstocking & inventory evaluation, information management, and the
setting up of manufacturing strategies.
Secondly, the model has been developed from extensions of both GMP and HACCP
which are practices that are enforced by government regulation in order to develop
potential competitiveness by adding quality to existing products and process practices
(TQM) and optimising machinery and equipment (TPM). Finally, it is concluded that
all tools and techniques used in the respondent companies can be classed as “important”
or “very important.”

182
Chapter 10
A new Manufacturing Strategy Model
For the Thai Food Processing Industry
10.1 Introduction This model has been developed for Thai food processing companies in order to achieve
high organisational performance and as a business strategy to compete in the market
arena. There are many tools and techniques used in this research that are necessary for
the development of an appropriate model and for solving most problems which occur in
Thai food processing companies. There are also some suggestion on using them and
developing the necessary steps to achieve successful implementation. Training courses
can assist workers at each of the various job levels to improve their skills and upgrade
organisational performance to gain an advantage in competitive situations. The
recommendations of the survey, in regard to the implementation of this model in the
Thai food processing industry, should be of practical value for organisations seeking a
better business strategy.
10.2 Suggested Tools and Techniques for Problem Solving In the companies that were investigated (Chapter 7), there were many problems that
occurred frequently and urgently needed manufacturing practices and tools and
techniques to eliminate them. Table 10.2 shows the relationship between
manufacturing practices and suggested tools and techniques suitable for solving
these problems.

183
Table 10.2 Relationship between Problems and Manufacturing Practices and
Suggested Tools and Techniques
Manufacturing practices Problems Infrastruc
ture GMP HACCP TPM TQM
Suggested Tools and Technique
Lack of production performance
● ● Process control, Production control , Quality audit, Standardisation of parts, products and process, SPC, Human resource development, Daily management, 7 Basic tools.
Marketing plan
● Database and information management, Brainstorming, Policy deployment, PDCA cycle, Cross function management, Benchmarking.
Overstocking & inventory Evaluation
● ● ● Process control, Production control, Database and information management, Material control, Packaging and storage, 5S & housekeeping, Supplier long-term contract.
Safety problems in workplace
● ● ● ● Small group improvement activities, Hazard analysis, Plant layout, Daily management, Packing and storage, Environmental control, Preventive maintenance, Document control, 5S & housekeeping , Personal hygiene, Human resources development, Suggestion system, Personnel management, Poka-yoke, Loss control and safety management.
Information for management
● Database and information management, Document control, Quality Records, 5S & housekeeping.
Budget planning
● Database and information management, Effective meeting, Brainstorming, PDCA cycle, Cross functional management.
Resource planning
● ● ● Brainstorming, Database and information management, Effective meeting, PDCA cycle, Process control, Production control, Material control, Equipment management, Project management, Facility management, Cross functional management.
Setting manufacturing strategies
● ● Database and information management, Effective meeting, Brainstorming, Policy deployment, PDCA cycle, Human resources development, Facility management, Benchmarking.

184
Manufacturing practices Problems Infrastruc
ture GMP HACCP TPM TQM
Suggested Tools and Technique
Time wasting
● ● Small group improvement activities, Database and information management, SPC, Process control, Standardisation of parts, products and processes, Human resources development, 5S & housekeeping, Production control, Material control
Meeting customer deadlines
● Database and information management, Reduction of number of suppliers and distance, Process control, Transport control, Material control, Preventive maintenance, Production control, Human resources development, Project management, Cross functional management.
Community relationship
● Transport control, Environmental control, Personnel hygiene, Product recall, Product instruction to consumer.
Lack of employee empowerment
● ● ● Small group improvement activities ,Database and information management, Brainstorming, Motivation, Preventive maintenance, Human resources development, 5S & housekeeping, Cross functional management, QCC, Personnel management, Multi-skill employees.
Defects
● Small group improvement activities, Brainstorming, Pest control, Hazard analysis, SPC, Daily management, Production control, Basic 7 tools, Standardisation of parts, products and processes, Material control, Packaging and storage, Preventive maintenance Document control, Quality Records, Inspection and testing product, Process control, Waste management, Quality audit, Personnel hygiene, Human resources development, QCC, 5S & housekeeping, Poka-yoke, Supplier quality certification, Loss control and safety management
Insufficiency of technical skill
● Motivation, Human resources development, Personnel management, Multi-skilled employees.
Machinery breakdown
● Small group improvement activities, Database and information management, Effective meetings, Brainstorming, Basic 7 tools, Preventive maintenance, Human resources development, 5S & housekeeping, Suggestion system, QCC, Poka-yoke.

185
Manufacturing practices Problems Infrastruc
ture GMP HACCP TPM TQM
Suggested of Tools and Technique
Cost control & evaluation
● Database and information management, Reduction of number of suppliers and distance, Standardisation of parts, products and processes, Total supplier evaluation, Supplier long-term contract.
Measurement of control system
● ● Preventive maintenance, Inspection and testing product, Equipment management, 5S & housekeeping, Calibration, Facility management, Measurement equipment control, Process control.
Production schedule
● Process control, Document control, Production control, Database and information management, Reduction of number of suppliers and distance, Standardisation of parts, products and processes, Material control.
Personal conflict
● Small group improvement activities, Conflict management, Personnel management, Motivation, QCC, Human resource development, Cross functional management.
Teamwork
● Small group improvement activities, Motivation, Database and information management, QCC, Effective meetings, Brainstorming, Conflict management, Policy deployment, Human resource development, Project management, Personnel management, Suggestion system, Cross functional management.
Human error
● Small group improvement activities, Effective meetings, Brainstorming, Motivation, QCC, Cross functional management, Suggestion system, Loss control and safety management
Lack of product ideas development
● Small group improvement activities, QCC, Database and information management, Effective meetings, Brainstorming, Motivation, Project management, Suggestion system, Cross functional management, Benchmarking.
Work standards
● Process control, Production control, Quality audit, Database and information management, Document control, Human resource development
Unclear organisational Structure
● Personnel management.
Lack of management skill
● ● Motivation, Multi-skill employees, Personnel management, Human resource management.
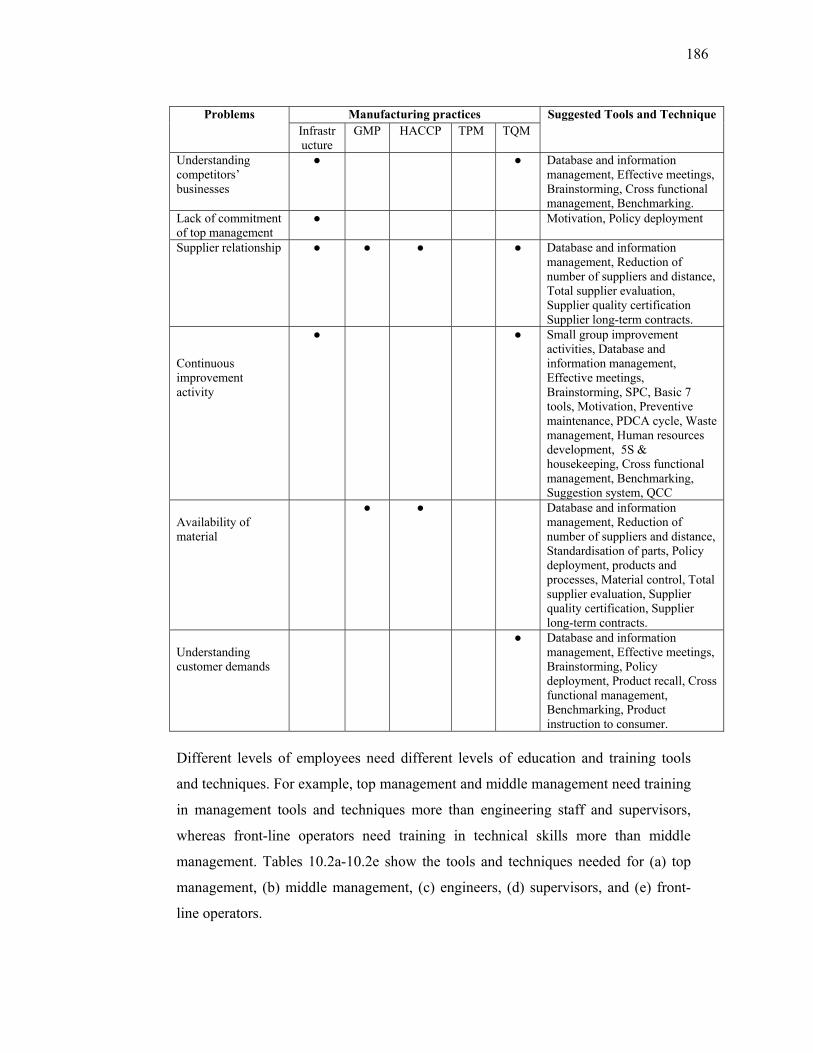
186
Manufacturing practices Problems Infrastructure
GMP HACCP TPM TQM Suggested Tools and Technique
Understanding competitors’ businesses
● ● Database and information management, Effective meetings, Brainstorming, Cross functional management, Benchmarking.
Lack of commitment of top management
● Motivation, Policy deployment
Supplier relationship
● ● ● ● Database and information management, Reduction of number of suppliers and distance, Total supplier evaluation, Supplier quality certification Supplier long-term contracts.
Continuous improvement activity
● ● Small group improvement activities, Database and information management, Effective meetings, Brainstorming, SPC, Basic 7 tools, Motivation, Preventive maintenance, PDCA cycle, Waste management, Human resources development, 5S & housekeeping, Cross functional management, Benchmarking, Suggestion system, QCC
Availability of material
● ● Database and information management, Reduction of number of suppliers and distance, Standardisation of parts, Policy deployment, products and processes, Material control, Total supplier evaluation, Supplier quality certification, Supplier long-term contracts.
Understanding customer demands
● Database and information management, Effective meetings, Brainstorming, Policy deployment, Product recall, Cross functional management, Benchmarking, Product instruction to consumer.
Different levels of employees need different levels of education and training tools
and techniques. For example, top management and middle management need training
in management tools and techniques more than engineering staff and supervisors,
whereas front-line operators need training in technical skills more than middle
management. Tables 10.2a-10.2e show the tools and techniques needed for (a) top
management, (b) middle management, (c) engineers, (d) supervisors, and (e) front-
line operators.

187
Table 10.2a Tools and Techniques used by Top Management
Tools and Techniques Job position
Tools Techniques
Top Management Cross functional management PDCA cycle Benchmarking
Policy development Human resource management Motivation Personal management Cross functional management Database and information management Total supplier relation
Table 10.2b Tools and Techniques used by Middle Management
Tools and Techniques Job position
Tools Techniques
Middle Management
Cross function management PDCA cycle Inspection and testing system Supplier contract Brain storming QCC SPC
Policy deployment Human resource management Motivation Personal management Cross functional management Conflict management Quality audit Quality record Database and information management Product recall Package and storage system Transport control Material control Process control Reduction of number of Supplier & distance Supplier quality certification Equipment management Suggestion system
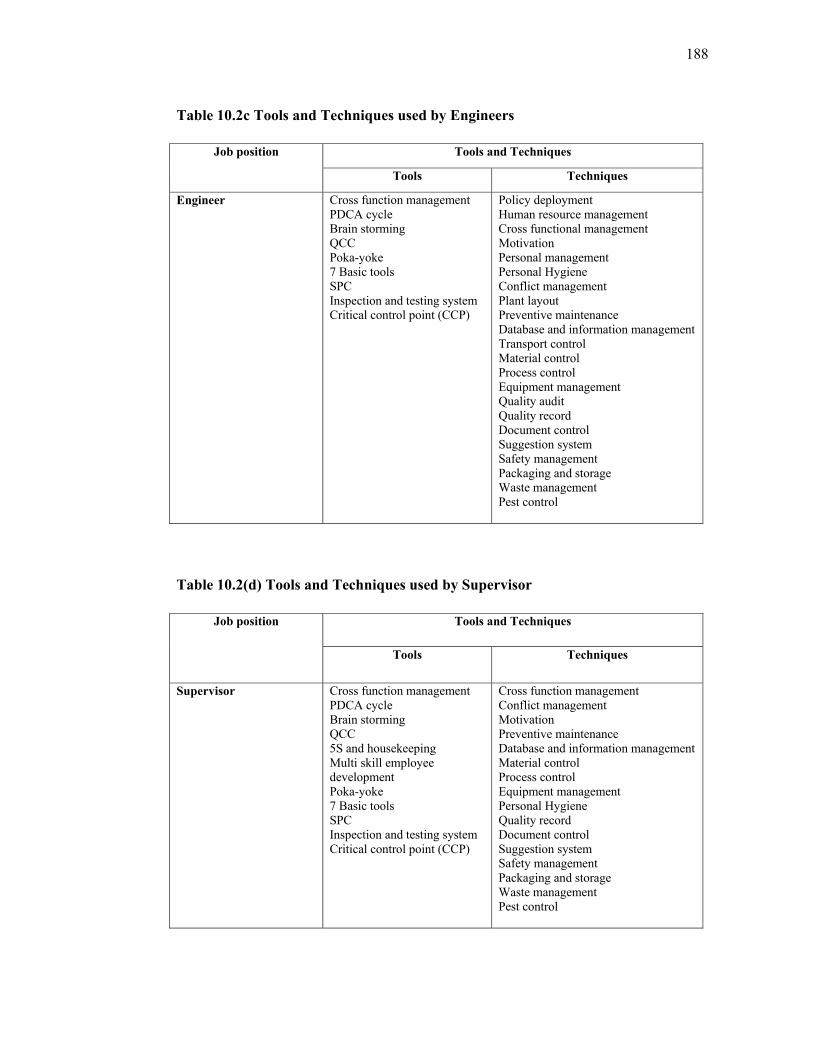
188
Table 10.2c Tools and Techniques used by Engineers
Tools and Techniques Job position
Tools Techniques
Engineer Cross function management PDCA cycle Brain storming QCC Poka-yoke 7 Basic tools SPC Inspection and testing system Critical control point (CCP)
Policy deployment Human resource management Cross functional management Motivation Personal management Personal Hygiene Conflict management Plant layout Preventive maintenance Database and information management Transport control Material control Process control Equipment management Quality audit Quality record Document control Suggestion system Safety management Packaging and storage Waste management Pest control
Table 10.2(d) Tools and Techniques used by Supervisor
Tools and Techniques Job position
Tools Techniques
Supervisor Cross function management PDCA cycle Brain storming QCC 5S and housekeeping Multi skill employee development Poka-yoke 7 Basic tools SPC Inspection and testing system Critical control point (CCP)
Cross function management Conflict management Motivation Preventive maintenance Database and information management Material control Process control Equipment management Personal Hygiene Quality record Document control Suggestion system Safety management Packaging and storage Waste management Pest control
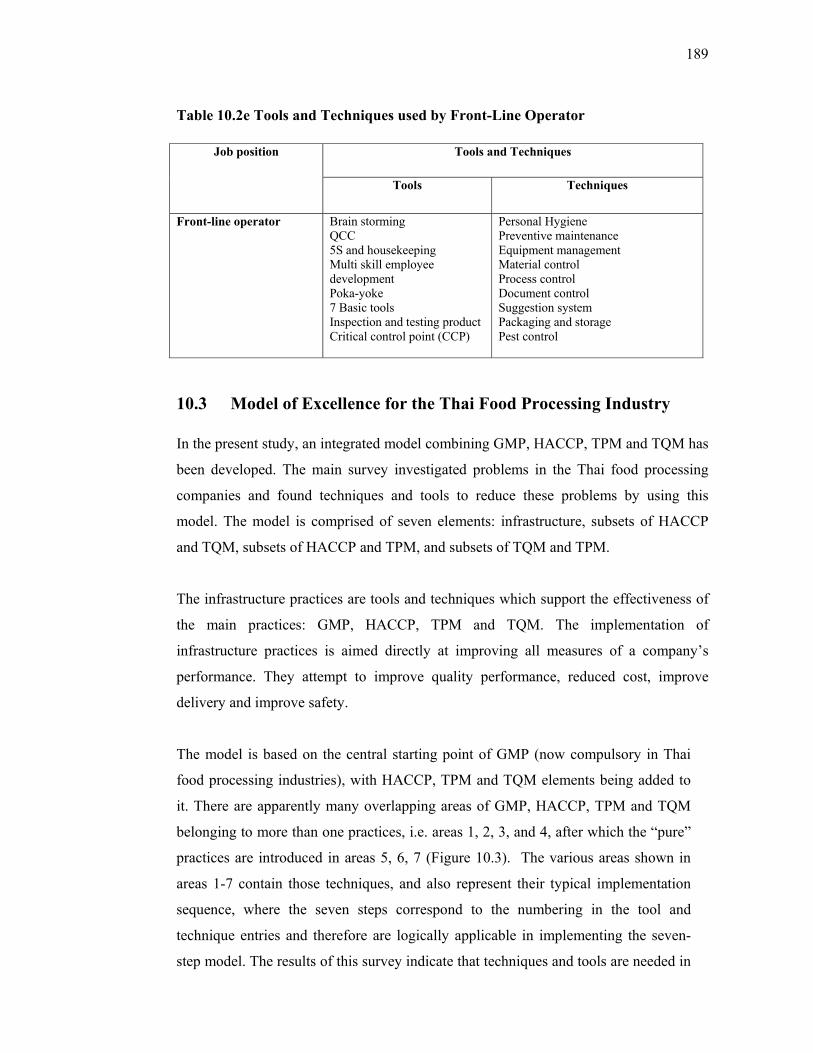
189
Table 10.2e Tools and Techniques used by Front-Line Operator
Tools and Techniques Job position
Tools Techniques
Front-line operator
Brain storming QCC 5S and housekeeping Multi skill employee development Poka-yoke 7 Basic tools Inspection and testing product Critical control point (CCP)
Personal Hygiene Preventive maintenance Equipment management Material control Process control Document control Suggestion system Packaging and storage Pest control
10.3 Model of Excellence for the Thai Food Processing Industry In the present study, an integrated model combining GMP, HACCP, TPM and TQM has
been developed. The main survey investigated problems in the Thai food processing
companies and found techniques and tools to reduce these problems by using this
model. The model is comprised of seven elements: infrastructure, subsets of HACCP
and TQM, subsets of HACCP and TPM, and subsets of TQM and TPM.
The infrastructure practices are tools and techniques which support the effectiveness of
the main practices: GMP, HACCP, TPM and TQM. The implementation of
infrastructure practices is aimed directly at improving all measures of a company’s
performance. They attempt to improve quality performance, reduced cost, improve
delivery and improve safety.
The model is based on the central starting point of GMP (now compulsory in Thai
food processing industries), with HACCP, TPM and TQM elements being added to
it. There are apparently many overlapping areas of GMP, HACCP, TPM and TQM
belonging to more than one practices, i.e. areas 1, 2, 3, and 4, after which the “pure”
practices are introduced in areas 5, 6, 7 (Figure 10.3). The various areas shown in
areas 1-7 contain those techniques, and also represent their typical implementation
sequence, where the seven steps correspond to the numbering in the tool and
technique entries and therefore are logically applicable in implementing the seven-
step model. The results of this survey indicate that techniques and tools are needed in

190
order to implement and develop a model. The steps to build this model are as
follows:
Figure 10.3 New Manufacturing Strategy Model for Thai Food Processing Industry
Step one
1. Establishing the infrastructure practices,
2. Problem solving,
3. Employee involvement & empowerment improvement,
4. Workplace management (5S & housekeeping),
5. Product control,
6. Supplier relationship,
7. Measurement (calibration and equipment control),
8. Document control,
9. Quality audit, safety,
10. Production and other continuous improvement.
Step 1 GMP
Step 5 HACCP
Quality improved /Safety
Step 6 TPM
Equipment effectiveness
Step 7 TQM Quality
improvement
Step 2
Step 3
Step 4

191
Step two
1. Building the relationship between HACCP and TQM implementation,
2. Teamwork,
3. Brainstorming,
4. Conflict management,
5. Cross functional management,
6. Effective communication systems and quality policy.
Step three
1. Building the relationship between HACCP and TPM,
2. Small group activity,
3. Problem solving, 5S activity and housekeeping
4. Poka-yoke technique.
Step four
1. Building the relationship between TQM and TPM,
2. Small group activity,
3. Problem solving,
4. 5S activity and housekeeping,
5. Motivation,
6. Multi-skilled employees.
Step five
1. Extending the implementation of the HACCP system,
2. Hazards analysis,
3. Critical control point (CCP),
4. Managing of CCPs.
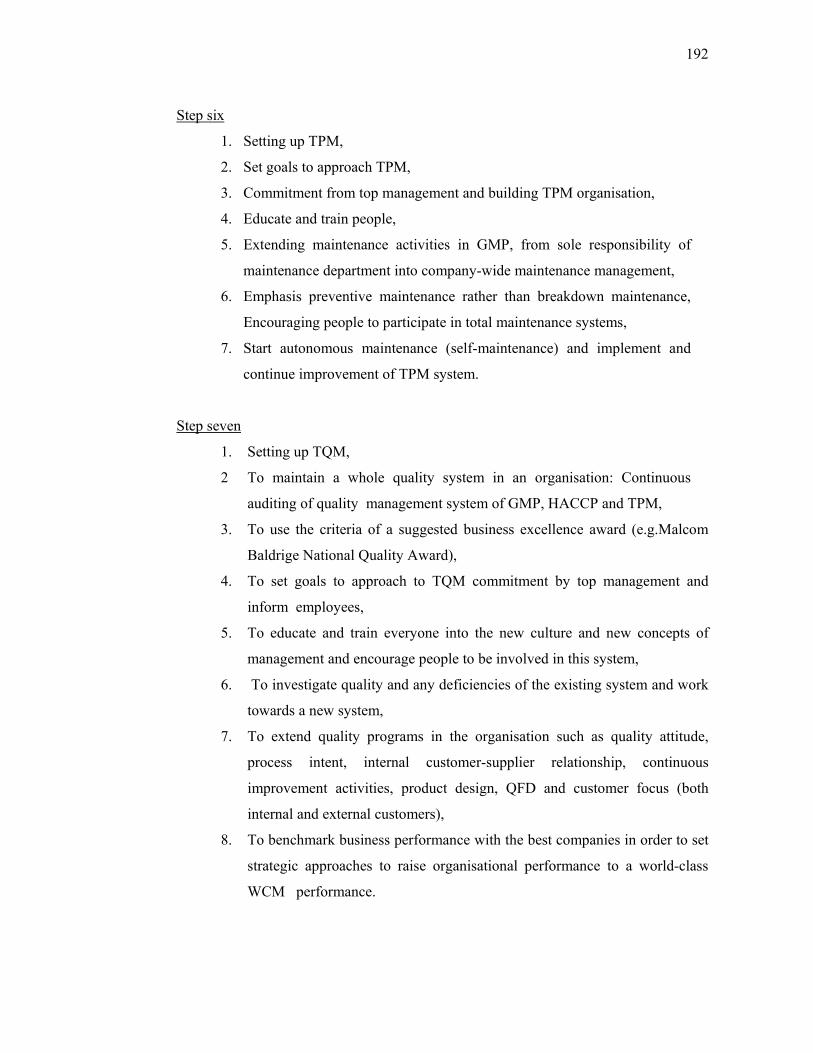
192
Step six
1. Setting up TPM,
2. Set goals to approach TPM,
3. Commitment from top management and building TPM organisation,
4. Educate and train people,
5. Extending maintenance activities in GMP, from sole responsibility of
maintenance department into company-wide maintenance management,
6. Emphasis preventive maintenance rather than breakdown maintenance,
Encouraging people to participate in total maintenance systems,
7. Start autonomous maintenance (self-maintenance) and implement and
continue improvement of TPM system.
Step seven
1. Setting up TQM,
2 To maintain a whole quality system in an organisation: Continuous
auditing of quality management system of GMP, HACCP and TPM,
3. To use the criteria of a suggested business excellence award (e.g.Malcom
Baldrige National Quality Award),
4. To set goals to approach to TQM commitment by top management and
inform employees,
5. To educate and train everyone into the new culture and new concepts of
management and encourage people to be involved in this system,
6. To investigate quality and any deficiencies of the existing system and work
towards a new system,
7. To extend quality programs in the organisation such as quality attitude,
process intent, internal customer-supplier relationship, continuous
improvement activities, product design, QFD and customer focus (both
internal and external customers),
8. To benchmark business performance with the best companies in order to set
strategic approaches to raise organisational performance to a world-class
WCM performance.

193
10.3.1 Extension of GMP Implementation of GMP is intended for the control of hazards. This implementation is
necessary for confirming each process and making sure that every product is safe and
hygienic before being sent to the consumer. This practice emphasises the technical
aspects rather than the management aspects and therefore the company should provide
technical knowledge to employees such as hazard analysis, risk control management,
and hazard control. The importance of this implementation is to educate and train
employees to understand and know about product safety, hygiene, hazard analysis and
control, cleanliness, material control, process control, etc. The frequent practice of 5S
and housekeeping activities is very useful in implementing this.
10.3.2 HACCP Building The HACCP requirement seems to be the manufacturing practice of quality assurance
of all food-processing companies since it is also enforced by government regulation. It
is necessary to implement it as a base for an integrated model. The successful keys to
this implementation should be as follows:
1. Top management commitment
2. Employee involvement
3. Workplace management (5S and housekeeping)
4. SPC and statistic program
5. Supplier relationship
6. Document control
7. Data & information management
8. Material control
9. Measurement control (Calibration & equipment control)
10. Process control
11. Production control
12. Transport control
13. Quality audit
14. Product safety and hygiene
15. Training and Education

194
10.3.3 Focus on human aspects by implementing TQM Simply setting the system of quality assurance and increasing technical knowledge is
insufficient to compete in a competitive situation. The key component of the
organisation that is necessary to sustain this quality system and upgrade its potential is
to enforce the quality culture to involve everyone in the organisation. Therefore, the
next necessary program is TQM which focuses on employees with the aim to create
synergy in every sector and to make every person within the organisation participate in
a continuous quality improvement program. This program can be assisted by the
following management tools and techniques:
1. Training and education,
2. Cross function management,
3. Effective communication systems,
4. Policy deployment,
5. Conflict management,
6. Teamwork,
7. Motivation & reward system,
8. Brainstorming,
9. Problem solving,
10. Small group activity,
11. Kaizen activity.
10.3.4 Focus on effective equipment management by implementing TPM In process control, equipment is very important in producing either a quality or
defective product. It is therefore necessary to maintain a full working capacity for a
sustained length of time. The efficiency and effectiveness of equipment results from
employees taking care of machinery as part of the maintenance management system.
Hence, the TPM implementation program should focus on developing HR and installing
maintenance systems. Implementation of TQM assists in changing employee attitudes
about quality and participating in a quality culture which focuses on a continuous
improvement program. However, it is not enough to manage equipment effectively.

195
There should be more focus on activities regarding maintenance aspects, such as self
maintenance, TPM activity, period maintenance, corrective maintenance, multi-skilled
employees, etc. The 5S and housekeeping activities are also very important in the
inspection and maintenance of cleanliness of equipment.
10.3.5 Selected tools and techniques to use in the model There are various useful tools and techniques available to Thai food processing
companies. They are aimed at assisting the implementation of successful manufacturing
practices. Figure 10.3.5 shows how these tools and techniques are related to
manufacturing practices in this model.
10.4 Training Courses In order to implement this model, many job levels will require training in all of
manufacturing practices such as GMP, HACCP, TPM and TQM. All Thai food-
companies need short training courses (3 days, 3 times per year). Supervisors are
expected to train for a longer period than other employees. There should be separate
basic training and maintenance training courses divided into the following four groups:
1. Basic training courses: GMP and HACCP (2-3 days, 3 times per year) and
TQM and TPM (2 days, 3 times per year);
2. Maintenance training courses: GMP, HACCP, and TPM (2–3 days, 3 times
per year), and TQM (2 days, 3 times per year );
3. Technical training course: GMP, HACCP, TQM and TPM (2-3days, 3 times
per year );
4. Management training course: GMP, HACCP, TQM and TPM (2 days, 3 times
per year ).
The design of any courses needs an appropriate period of time, focusing on one that is
appropriate to the job position. (Table 10.4.1).

196
Figure 10.3.5 Tools and Techniques for the Appropriate Thai Food Processing
Industry Manufacturing Strategy Model
GMP
HACCP Quality improved
/Safety TPM Equipment effectiveness
TQM Quality improvement
1
2
3
4
5 6
7
Teamwork, Brainstorming, Conflict management, Cross functional management, Effective communication system, Quality policy Supplier long-term contract
Small group activity, Problem solving, 5S activity and housekeeping, Motivation, Multi-skilled employees
Small group activity, Problem solving, 5S activity and housekeeping Poka-yoke technique
Problem solving, SPC Top management commitment Employee involvement & empowerment, Motivation Workplace management (5S & housekeeping), Material control, Product control, Process control Transport control Product recall Supplier relationship, Supplier quality certification Measurement (calibration and equipment control) Document control, Quality audit, Safety of Product Plant layout PDCA cycle Quality control circle

197
Table 10.4.1 Training Courses for Particular Job Positions
Job position Basic Training (3 times per
year)
Maintenance Training
(3 times per year)
Technical Training
(3 times per year)
Management Training
(3 times per year)
Top management
GMP, HACCP, TQM and TPM
GMP, HACCP, TQM and TPM
GMP, HACCP, TQM and TPM
GMP, HACCP, TQM and TPM
2 days 2 days 2 days 2-3 days Middle management
GMP, HACCP, TQM and TPM
GMP, HACCP, TQM and TPM
GMP, HACCP, TQM and TPM
GMP, HACCP, TQM and TPM
2 days Less than 2 days Less than 2 days Less than 2 days Engineer GMP, HACCP,
TQM and TPM
GMP, HACCP, TQM and TPM
GMP, HACCP, TQM and TPM
GMP, HACCP, TQM and TPM
2 – 3 days 2 – 3 days 2 – 3 days 2 – 3 days Supervisor GMP and
HACCP
GMP, HACCP, and TPM
GMP, HACCP, TQM and TPM
GMP, HACCP, TQM and TPM
2 – 3 days 2 – 3 days 2 – 3 days 2 days TQM and TPM
TQM - -
2 days 2 days - - Front-line operator
GMP and HACCP
GMP, HACCP, TPM and TQM
GMP, HACCP, TQM and TPM
GMP, HACCP, TQM and TPM
2 days 2 days 2 days 2 days TQM and TPM
- - -
2 days - - - Table 10.4.2 shows the design of training courses for each particular level. These
include top management, middle management, engineer, supervisor, and front-line
operator. Correspondingly, there are four training courses for each of these levels and
they include (a) Basic training, (b) Management training, (c) Technical training, and (d)
Maintenance training.
Table 10.4.2a Basic Training for each Particular Levels
Job position Training days (3 times/year) GMP HACCP TPM TQM
Top management < 2 days < 2 days < 2 days < 2 days Middle management 2-3 days 2-3 days 2-3 days < 2 days Engineer 2-3 days 2-3 days 2-3 days 2-3 days Supervisor 2-3 days 2-3 days < 2 days < 2 days Front-line operator 2-3 days < 2 days < 2 days < 2 days
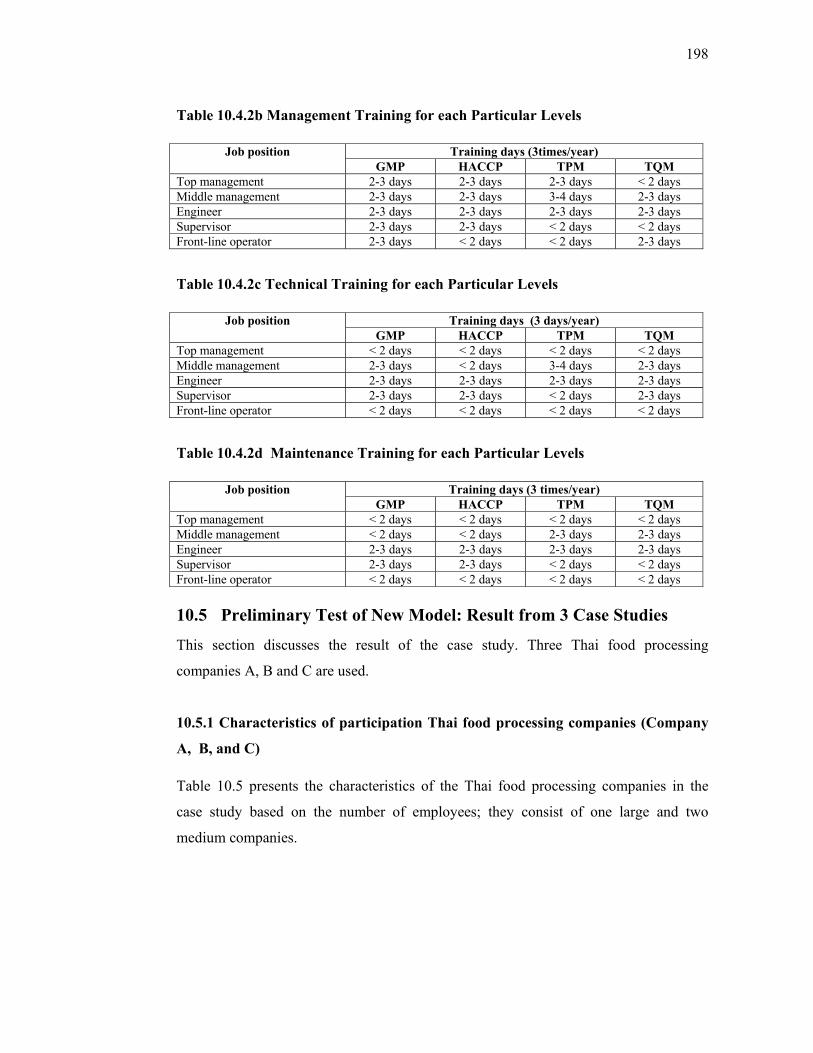
198
Table 10.4.2b Management Training for each Particular Levels
Job position Training days (3times/year) GMP HACCP TPM TQM
Top management 2-3 days 2-3 days 2-3 days < 2 days Middle management 2-3 days 2-3 days 3-4 days 2-3 days Engineer 2-3 days 2-3 days 2-3 days 2-3 days Supervisor 2-3 days 2-3 days < 2 days < 2 days Front-line operator 2-3 days < 2 days < 2 days 2-3 days
Table 10.4.2c Technical Training for each Particular Levels
Job position Training days (3 days/year) GMP HACCP TPM TQM
Top management < 2 days < 2 days < 2 days < 2 days Middle management 2-3 days < 2 days 3-4 days 2-3 days Engineer 2-3 days 2-3 days 2-3 days 2-3 days Supervisor 2-3 days 2-3 days < 2 days 2-3 days Front-line operator < 2 days < 2 days < 2 days < 2 days
Table 10.4.2d Maintenance Training for each Particular Levels
Job position Training days (3 times/year) GMP HACCP TPM TQM
Top management < 2 days < 2 days < 2 days < 2 days Middle management < 2 days < 2 days 2-3 days 2-3 days Engineer 2-3 days 2-3 days 2-3 days 2-3 days Supervisor 2-3 days 2-3 days < 2 days < 2 days Front-line operator < 2 days < 2 days < 2 days < 2 days
10.5 Preliminary Test of New Model: Result from 3 Case Studies This section discusses the result of the case study. Three Thai food processing
companies A, B and C are used.
10.5.1 Characteristics of participation Thai food processing companies (Company
A, B, and C) Table 10.5 presents the characteristics of the Thai food processing companies in the
case study based on the number of employees; they consist of one large and two
medium companies.

199
Table 10.5 Characteristics of the Thai Food Processing Companies Participated in
the Case Study
Thai food processing
companies
A B C
Number of employees 140 190 1,000
Annual turnover
(million Baht)
30 100 1,400
Established 1980 1985 1987
Finished product Canned fruit and
vegetable
Canned Tuna Canned fruit and
vegetable
Manufacturing
operation
Continuous Continuous Continuous and project
Manufacturing practices GMP, HACCP and 5s GMP, HACCP and
TQM
GMP, HACCP, TPM
and TQM
Production approach Make to stock (66%)
and order (34%)
Make to stock (60%)
and order (40%)
Make to stock (70%)
and order (30%)
10.5.2 Implementation of manufacturing practice models in Company A,
B, and C This section investigates the adoption of GMP, HACCP, TPM and TQM by the
companies participating.
10.5.2.1 Company A Company A is apparently aware of recent development in new approaches to
manufacturing. External and internal pressures have driven this company to
implementing GMP and HACCP in order to achieve quality assurance. This can be
proved by results of Hypothesis 2 testing that External (market requirement) influence
the implementation of GMP and HACCP. This company has enough resources to use
GMP and HACCP. Although the production line is in an advantageous position to adopt
TPM and JIT compared with other types of manufacturing operation, this plant does not
attempt it formally due to the difficulty in seeking local manufacturers. However, some
TPM practices are applied.

200
10.5.2.2 Company B Company B, by adopting GMP and HACCP, is motivated by its need to comply with
the requirement of the Food and Drug Administration, Department of Medical Science.
The main motivation to implement TQM for this company is to obtain external
recognition besides seeking internal efficiency. This can be proved by results of
Hypothesis 6 testing that large companies based on the number of employees, prefer to
implement TQM compared with smaller companies. Smaller companies, based on
annual turnover do not use TPM as much as large companies do. However, this
particular company plans to implement TPM in the future.
10.5.2.3 Company C Company C has adopted GMP, HACCP, TPM and TQM. Its motivation to implement
TQM is in order to seek internal efficiency and develop relationships with customers. It
also implements TPM in its effort to control critical equipment. Equipment breakdown
leads to huge production losses and start up costs. Employees are encouraged to be
multi skilled in order to obtain better benefits. The management of quality and
equipment in this company is dependent on a small number of trade persons instead of
the participation of all employees. The main method of controlling employees to do
their job safely, properly, and productively is various designs throughout the company.
However, this company has not attempted to implement JIT practice because some
processes are not under its control. For example, suppliers of raw materials depend on
the weather and the company relies on a buffer stock in order to be responsive to
customer demands.
10.5.3 Comparison of Company A, B and C Company A, B and C have different forms of implementing the manufacturing practice
model, as stated in the previous section. They also have various basic infrastructures,
benefits and tools, and techniques which they use in their. Table 10.5.3.1a–Table
10.5.3.1b shows organisation structure and typical management characteristics:
Company A has only partially implemented these organisational structures compared
with Company B and C which have both fully implemented them. Moreover, Company
A used informal management characteristics.

201
Table 10.5.3.1a Basic Infrastructures (Organisation Structures)
Organisation structures Some Very much Self controlling groups in the production area A BC Matrix structure including sales, marketing, design and production development in new production
A BC
Matrix structure including production and maintenance in problem solving
A BC
Cross functional groups for problem solving A BC
Table 10.5.3.1b Basic Infrastructures (Management Characteristics)
Management characteristics Implemented Informal Formal, depending on
person Formal, depending
responsibility of group Strategic planning system A BC Strategy development A BC Quality assurance system A BC Education and training system A BC Sales forecasting system A BC Cost accounting system A BC Maintenance system A BC
Company B and C have completely implemented formal management characteristics
and assigned responsibility to the group. The benchmarking method is only used in
Company B and C for developing manufacturing strategies. However, they use
benchmarking methods in different ways. Company B uses competitors but Company C
uses an excellent Company in Thailand for benchmarking. The quality focuses of
Company B and C are very important in all aspects, but Company A is only focused on
decreasing defects, speeding delivery, and reducing costs. Research and development of
product quality, quality of working life for employees, and improvement of customer
service are also important. The quality aspects used to develop the manufacturing
strategies in any company are different as follows:
1. Company A: Process control, Inspection system, Product service,
and Quality system.
2. Company B: Supplier relationship, Process control, Inspection
system, Customer relationship, Product service, Quality system, and
Marketing and selling.
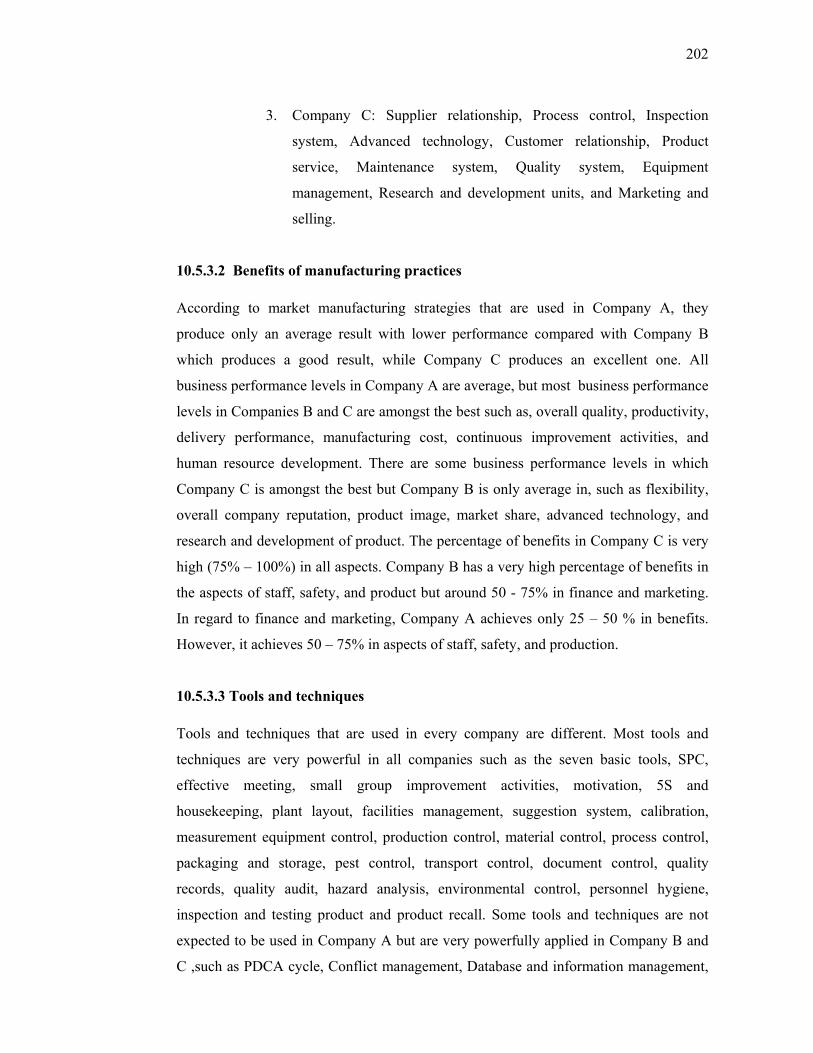
202
3. Company C: Supplier relationship, Process control, Inspection
system, Advanced technology, Customer relationship, Product
service, Maintenance system, Quality system, Equipment
management, Research and development units, and Marketing and
selling.
10.5.3.2 Benefits of manufacturing practices According to market manufacturing strategies that are used in Company A, they
produce only an average result with lower performance compared with Company B
which produces a good result, while Company C produces an excellent one. All
business performance levels in Company A are average, but most business performance
levels in Companies B and C are amongst the best such as, overall quality, productivity,
delivery performance, manufacturing cost, continuous improvement activities, and
human resource development. There are some business performance levels in which
Company C is amongst the best but Company B is only average in, such as flexibility,
overall company reputation, product image, market share, advanced technology, and
research and development of product. The percentage of benefits in Company C is very
high (75% – 100%) in all aspects. Company B has a very high percentage of benefits in
the aspects of staff, safety, and product but around 50 - 75% in finance and marketing.
In regard to finance and marketing, Company A achieves only 25 – 50 % in benefits.
However, it achieves 50 – 75% in aspects of staff, safety, and production.
10.5.3.3 Tools and techniques Tools and techniques that are used in every company are different. Most tools and
techniques are very powerful in all companies such as the seven basic tools, SPC,
effective meeting, small group improvement activities, motivation, 5S and
housekeeping, plant layout, facilities management, suggestion system, calibration,
measurement equipment control, production control, material control, process control,
packaging and storage, pest control, transport control, document control, quality
records, quality audit, hazard analysis, environmental control, personnel hygiene,
inspection and testing product and product recall. Some tools and techniques are not
expected to be used in Company A but are very powerfully applied in Company B and
C ,such as PDCA cycle, Conflict management, Database and information management,
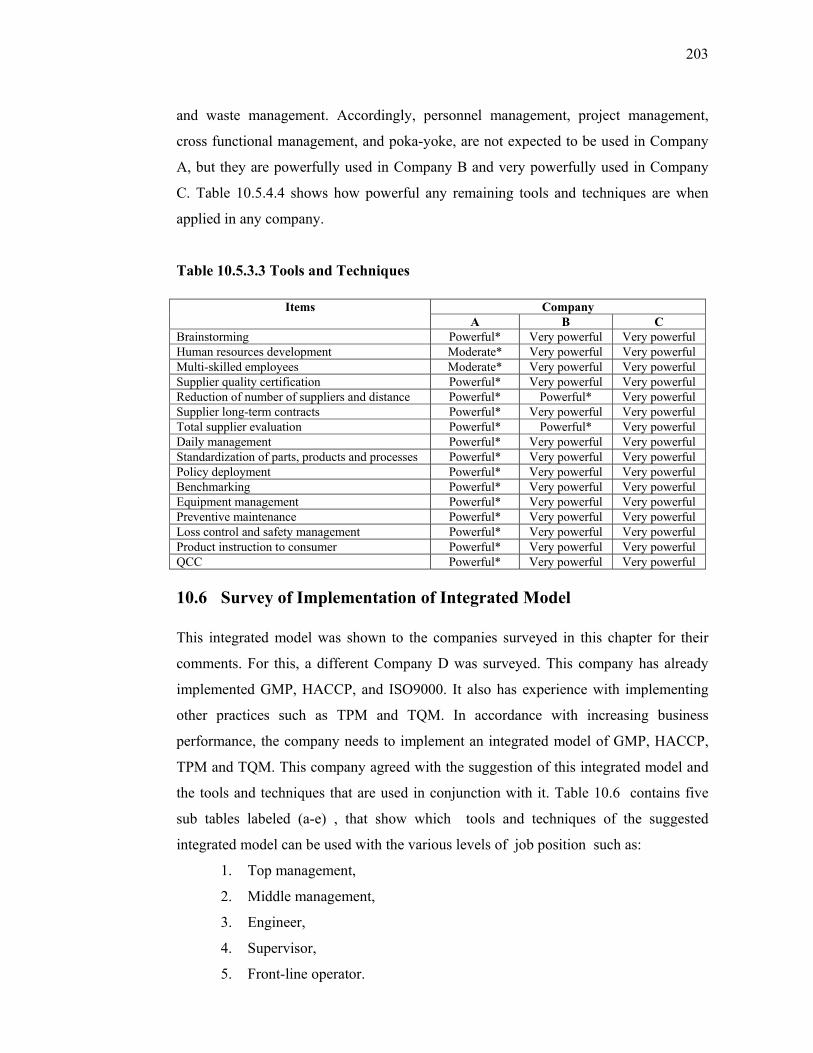
203
and waste management. Accordingly, personnel management, project management,
cross functional management, and poka-yoke, are not expected to be used in Company
A, but they are powerfully used in Company B and very powerfully used in Company
C. Table 10.5.4.4 shows how powerful any remaining tools and techniques are when
applied in any company.
Table 10.5.3.3 Tools and Techniques
Items Company A B C Brainstorming Powerful* Very powerful Very powerful Human resources development Moderate* Very powerful Very powerful Multi-skilled employees Moderate* Very powerful Very powerful Supplier quality certification Powerful* Very powerful Very powerful Reduction of number of suppliers and distance Powerful* Powerful* Very powerful Supplier long-term contracts Powerful* Very powerful Very powerful Total supplier evaluation Powerful* Powerful* Very powerful Daily management Powerful* Very powerful Very powerful Standardization of parts, products and processes Powerful* Very powerful Very powerful Policy deployment Powerful* Very powerful Very powerful Benchmarking Powerful* Very powerful Very powerful Equipment management Powerful* Very powerful Very powerful Preventive maintenance Powerful* Very powerful Very powerful Loss control and safety management Powerful* Very powerful Very powerful Product instruction to consumer Powerful* Very powerful Very powerful QCC Powerful* Very powerful Very powerful
10.6 Survey of Implementation of Integrated Model This integrated model was shown to the companies surveyed in this chapter for their
comments. For this, a different Company D was surveyed. This company has already
implemented GMP, HACCP, and ISO9000. It also has experience with implementing
other practices such as TPM and TQM. In accordance with increasing business
performance, the company needs to implement an integrated model of GMP, HACCP,
TPM and TQM. This company agreed with the suggestion of this integrated model and
the tools and techniques that are used in conjunction with it. Table 10.6 contains five
sub tables labeled (a-e) , that show which tools and techniques of the suggested
integrated model can be used with the various levels of job position such as:
1. Top management,
2. Middle management,
3. Engineer,
4. Supervisor,
5. Front-line operator.

204
Table 10.6a Tools and Techniques of the Suggested Integrated Model suitable for
Top Management in Company D
Job position Tools Techniques
Top management Cross functional management
PDCA cycle
Benchmarking
5S and housekeeping
Human resource management
Motivation
Personal management
Cross functional management
Conflict management
Database & information management
Total supplier relation
Recommendation
- The top management should clearly understand and explain all policies to every employee and know
why the company needs to implement them.
- The top management should be open-minded and get opinions and suggestions from employees in
order to understand problems thoroughly and solve them.
Table 10.6b Tools and Techniques of the Suggested Integrated Model suitable for
Middle Management in Company D
Job position Tools Techniques
Middle management - Cross functional management
- PDCA cycle
- Inspection and testing system
- Supplier contract
- Brainstorming
- 5S and housekeeping
- QCC
- SPC
- Human resource management
- Personal management
- Cross functional management
- Conflict management
- Quality audit
- Database & information management
- Product recall
- Packaging and storage system
- Transport control
- Material control
- Process control
- Reduction of number of supplier
and distance
- Supplier quality certification
- Equipment management
Recommendation - Middle management should assist top management to keep close contact with every
employee and help deploy company policies.

205
Table 10.6c Tools and Techniques of the Suggested Integrated Model suitable for
Engineers in Company D Job position Tools Techniques
Engineer - Cross functional management
- PDCA cycle
- Poka-yoke
- 7 basic tools
- Brainstorming
- 5S and housekeeping
- QCC
- SPC
- Inspection and testing system
- Motivation
- Cross functional management
- Conflict management
- Plant layout
- Database & information management
- Preventive maintenance
- Packaging and storage system
- Quality audit
- Equipment management
- Transport control
- Material control
- Process control
Recommendation- The engineer should help the company establish quality assurance systems and
focus on implementation of GMP and HACCP.
Table 10.6d Tools and Techniques of the Suggested Integrated Model suitable for
Supervisors in Company D
Job position Tools Techniques
Supervisor - Cross functional management
- PDCA cycle
- Poka-yoke
- 7 basic tools
- Multi-skilled employee
development
- 5S and housekeeping
- QCC
- SPC
- Inspection and testing system
- Motivation
- Cross functional management
- Conflict management
- Database & information management
- Preventive maintenance
- Equipment management
- Material control
- Process control
Recommendation
- The supervisor should help the company establish quality assurance systems, control documents,
write work instructions and focus on implementation of GMP and HACCP.
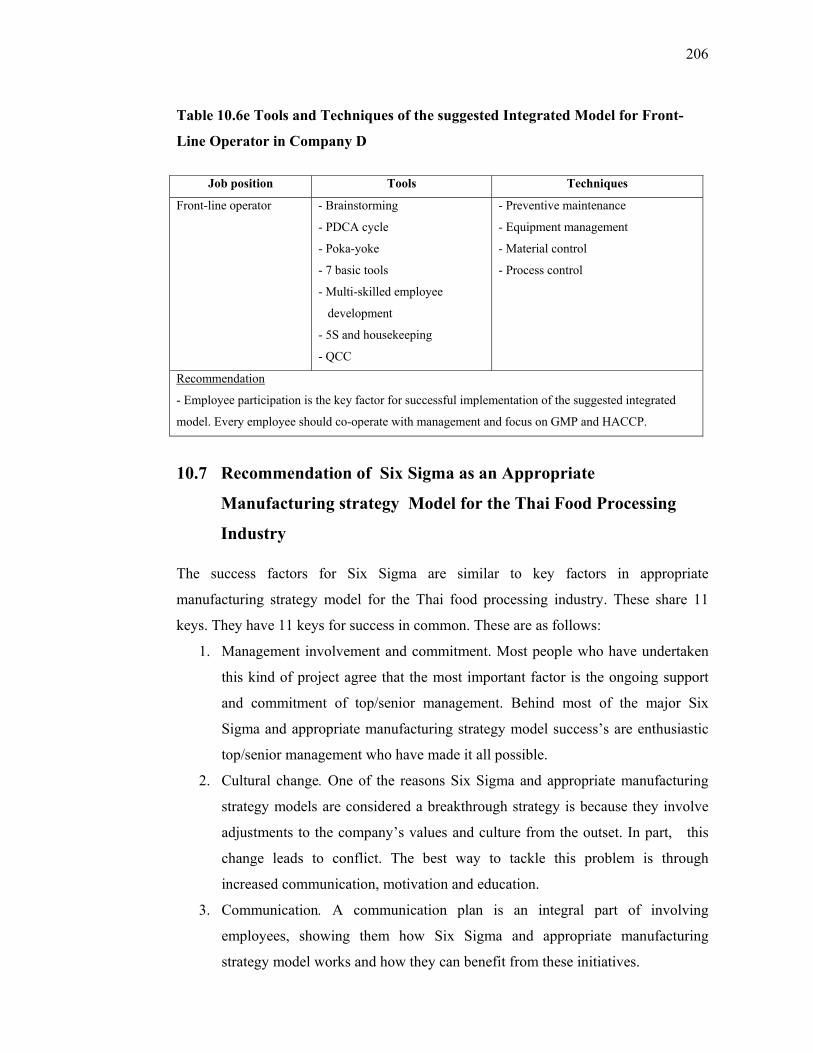
206
Table 10.6e Tools and Techniques of the suggested Integrated Model for Front-
Line Operator in Company D
Job position Tools Techniques
Front-line operator - Brainstorming
- PDCA cycle
- Poka-yoke
- 7 basic tools
- Multi-skilled employee
development
- 5S and housekeeping
- QCC
- Preventive maintenance
- Equipment management
- Material control
- Process control
Recommendation
- Employee participation is the key factor for successful implementation of the suggested integrated
model. Every employee should co-operate with management and focus on GMP and HACCP.
10.7 Recommendation of Six Sigma as an Appropriate
Manufacturing strategy Model for the Thai Food Processing
Industry The success factors for Six Sigma are similar to key factors in appropriate
manufacturing strategy model for the Thai food processing industry. These share 11
keys. They have 11 keys for success in common. These are as follows:
1. Management involvement and commitment. Most people who have undertaken
this kind of project agree that the most important factor is the ongoing support
and commitment of top/senior management. Behind most of the major Six
Sigma and appropriate manufacturing strategy model success’s are enthusiastic
top/senior management who have made it all possible.
2. Cultural change. One of the reasons Six Sigma and appropriate manufacturing
strategy models are considered a breakthrough strategy is because they involve
adjustments to the company’s values and culture from the outset. In part, this
change leads to conflict. The best way to tackle this problem is through
increased communication, motivation and education.
3. Communication. A communication plan is an integral part of involving
employees, showing them how Six Sigma and appropriate manufacturing
strategy model works and how they can benefit from these initiatives.
207
4. Organisation infrastructure. Before considering a Six Sigma and appropriate
manufacturing strategy model program, certain characteristics must already be
in place. The company must have a long-term strategy, at least the beginning of
a communication plan and there should be enough resources and investments
available to sustain the program over a considerable period of time.
5. Training. Training also creates a sense of ownership for everyone in the
organisation, whatever their level of involvement.
6. Linking Six Sigma and appropriate manufacturing strategy model to business
strategy. These cannot be treated as stand-alone activities. The projects must
have a direct impact on both financial and operational goals. These have more of
a philosophy than just a few tools and techniques.
7. Linking Six Sigma and appropriate manufacturing strategy model to customer.
These should begin and end with the customer.
8. Linking Six Sigma and appropriate manufacturing strategy model to human
resources.
9. Linking Six Sigma and appropriate manufacturing strategy model to suppliers.
Suppliers must also participate in this drive for quality.
10. Understanding tools and techniques within Six Sigma and appropriate
manufacturing strategy model. During the Six Sigma training employees learn
three main groups of tools and techniques which are divided into team tools,
process tools, and leadership tools. They also need to have a basic understanding
of statistics as it forms a major part of the measurement process.
11. Project management skills. Project managers should consider the key elements
of project management, time, cost and quality. Defining them will provide
teams with the scope, aims and resources needed to deliver improvements in a
short time, at the lowest cost and meeting requirements.
According to tools and techniques for Six Sigma and appropriate manufacturing
strategy model they are similar as shown here: cause and effect analysis, Pareto
analysis, control charts and run charts. It was found that many companies are not using
more powerful techniques such as design of experiments, Taguchi methods, quality
function deployment, failure mode effect and criticality analysis, 5S and housekeeping,
Poka-Yoke and SPC.

208
Six Sigma could be implemented at the same time as the Thai food processing
companies used appropriate manufacturing strategy model. Companies will reduce time
and costs by implementing Six Sigma and appropriate manufacturing strategy model
because some elements shown above use the same tools and techniques. Kim and
James, 2002 and Graeme, Martin and Steve, 2004 showed in there research that the
implementation of Six Sigma gave 75% of the companies financial benefits. It is
recommended that after implementing of the appropriate manufacturing strategy model
for Thai food processing industry propose here, Thai food processing companies should
concern Six Sigma to achieve even greater benefit.
10.8 Recommendation ISO 9000 as an Appropriate Manufacturing
Strategy Model for the Thai Food Processing Industry
ISO 9000 is a route to TQM. They are complementary. For companies which already
using TQM, installing ISO 9000 is relatively straightforward. ISO 9000 can be used as a
means of advancing toward the use of TQM. From the above discussion, there are a
number of important points which need to be followed in order to implement TQM and
ISO 9000 successfully.
These are a knowledge of TQM principles, Practice TQM principles, Create your own
TQM model (ISO 9000 as a structural framework for the implementation of TQM),
Customer satisfaction and continuous improvement, use of ISO 9000 as a route to TQM
(develop a Quality Manual for ISO 9000 that is suitable for your company and its
customers), ISO 9000 needs TQM (Even with ISO 9000 certification in hand, it would
not guarantee that the products and services are of high quality. In order to produce
quality products and services, the system needs TQM to lift it up to expectations),
knowledge-base conscious (Everybody needs to be educated and trained to do a better
job), and use tools, knowledge and skills. All this evidence supports the theme “ISO
9000 and TQM are the passports to success”.
10.8.1 Relationship of ISO 9000, GMP and HACCP
The concepts of systems and product standards are related in principles to the quality
management systems required for the effective functioning of the management systems,
and in most cases do not concern themselves with the correctness of product

209
specifications. However in the manufacture of good quality products, some form of
assessment of the product specifications are required to ensure that these meet the
regulatory and customer requirements. The requirements in ISO 9000 and GMP should
be considered as complementary as the two standards have common grounds, and that
the implementation of both standards will provide a good balance between management
systems and specific system requirements relating to food processing industry which are
essential for the control processes. Even though both documents make indirect reference
to product requirements and standards, the two are ,in effect, system standards which do
not mention any specific details of product quality control elements of the products
being manufactured. The ISO 9000 Quality Management Systems series of standards
are a series of standards which have been developed for the control of management
processes in a broad range of industries. The requirements of ISO9000 cover the
requirements of GMP, therefore an essential element to further clarify acceptable
practices and standards for the Thai food processing industry would be considered as an
important element for the implementation of ISO 9000 and development of the systems.
Both HACCP and ISO 9000 systems are management philosophies that rely on
disciplined operator control and teamwork. Both focus on prevention rather than
retrospective inspection. However, the major difference between the two systems is the
scope. HACCP is process and product oriented. HACCP is totally focused on food
safety therefore quality factors should not be part of a HACCP program. In contrast,
ISO 9000 is more systems-oriented and designed to manage quality. ISO 9000 provides
confidence that a supplier's quality system is capable of providing a stated product or
service. HACCP puts control mechanisms in place to ensure that the product is safe and
manufactured to standards that are formulated internationally, whereas ISO 9000
requires that an organisation defines their own system and demonstrates that it can
comply with it. HACCP and ISO focus on prevention. HACCP assures food safety by
controlling the process. ISO 9000 ensures system conformance to the standards. These
two programs have complimentary systems that reinforce and strengthen an
organisation's overall quality system. To be maximally effective, these companies must
be tailored to the manufacturing facility, requiring management leadership and
commitment, expert knowledge in program development, employee training and
operator control. In the competitive arena of the Thai food processing industry,
consumers demand high quality, safe products, and value-added pricing. Food

210
companies can meet these demands and maintain profitability by implementing systems
which focus on doing things right the first time.
Both HACCP and an ISO 9000 system are beneficial. HACCP was used to manage the
food safety element of the quality system while ISO 9000 was used as a framework to
manage quality. In these facilities, ISO 9000 implementation forced changes in their
pre-existent HACCP systems, primarily document and data control. An additional
advantage to having HACCP before ISO 9000 is that the former creates a
framework/foundation for a formal quality management system. Other than having
gained an improved understanding of the requirements of a formally documented
system from having gone through the HACCP recognition process, one respondent to
the case study, company D indicated that it gave company credibility and confidence to
proceed with ISO 9000. The learning and training involved in formulating a HACCP
plan can be transferred to ISO 9000 implementation. HACCP is easier to implement
since there is less interpretation, whereas ISO 9000 is a quality management tool. The
principle of ISO 9000 is similar to some tools and techniques to propose model for an
appropriate manufacturing strategy for the Thai food processing industry, especially
document control for GMP and HACCP systems. If companies have already
implemented the proposed model followed by ISO 9000, they should achieve maximum
benefits.
10.9 Conclusion The use of this integrated model is necessary for Thai food processing companies to
upgrade their business performance. It combines the manufacturing practices of GMP,
HACCP, TPM, and TQM. GMP and HACCP are quality assurance systems for food
safety enforced by present government regulation. TPM and TQM implementation help
an organisation to achieve WCM performance. TPM is necessary for optimising
machine and equipment efficiency while TQM establishes a high level of quality
assurance in order to build a work culture of quality standards that involves all
employees. This ensures improvements to quality are continuous, and in turn, satisfies
the customer. Its success is dependent on implementing all the necessary tools and
techniques. It is also sufficiently flexible to be applied usefully in any Thai food

211
processing company. Chapter 11, which follows, gives the conclusion of this research
and recommendation for its future use.
212
Chapter 11
Conclusion
The Thai food manufacturing industry plays a major role in the Thai economy as shown
in Chapter 2. The food processing industry discussed here is its most important sector. It
uses the raw materials or ingredients from agricultural products and processes them in
order to produce new food products (semi-products or finished products). Typical
examples are the canning and the preservation of meat, fruit, vegetables, fish and other
sea products, noodles and other flour based products, sugar products, coffee and tea
processing, soft drinks and carbonated beverages. Because of its relationship to the
rural industries, the Thai food processing industry offers economic advantages, such as
adding value to agricultural products, reducing the number of imported products,
providing employment in local areas, and gaining income from export products.
Most of the food processing industry needs to implement basic manufacturing practices
which conform to international standards and practices and relate to food safety for
consumers. These basic manufacturing practices are enforced by the government. They
include GMP and HACCP. They are seen along with ISO 9000 and other quality
assurances such as quality systems. However, quality assurance system is not good
enough for succeeding in the face of aggressive competition and the dynamic changing
marketplace. In order to survive and flourish amongst its many competitors, it is
necessary for it to upgrade its business performance to manufacturing excellence.
Drawing from the study of problems found in the Thai food processing companies in
the pilot survey, it has been shown that these are mostly machinery breakdown,
preparation of raw materials from suppliers, and process management. There is a need
to improve maintenance systems, supplier management and quality management
systems to achieve manufacturing excellence. The TPM, the JIT, and TQM are
solutions for eliminating or reducing these problems. These manufacturing practices are
explained in detail in Chapter 4.
The study also showed that JIT systems cannot be easily implemented in the Thai food
processing companies because the provision of raw materials from suppliers are not

213
constant nor controllable due to seasonal changes and undeveloped inventory control
processes. Most of the companies do not agree on a method of application for JIT.
Although it can be implemented in the integrated model, it has been shown that business
performance decreases when it is not. Therefore, this research focuses on the integrated
model which combines the manufacturing practices of GMP, HACCP, TPM, and TQM.
Before testing the hypotheses, Chapter 7 presented the findings of the results of the
questionnaire. There were eight hypotheses in this research that related to the
development of best practice for the Thai food processing industry. These hypotheses
could be classed into four groups. The first group examined the necessary elements of
various manufacturing practices and market requirements. The second group dealt with
the implementation of the integrated model necessary for the Thai food processing in
contrast to individual manufacturing practices. It focused on a few integrated models as
a means of examining which can perform the best. The third group emphasised the
relationship between the implementation of these manufacturing practices, industrial
characteristics and product and process strategies. The fourth group looked at the design
of training courses and how they assisted successful implementation of this integrated
model. It is concluded that:
1. There are many urgent problems that occur frequently in companies as
well as the market requirements demanding an upgrade in the quality of
products. Therefore any elements of TQM, JIT, HACCP, GMP, and TPM
that are utilised are very useful for solving these problems and assisting
the improvement of business performance.
2. Companies, which implement any manufacturing practices of GMP,
HACCP, TPM, JIT and TQM perform better than those that do not
utilise any of these practices or those that implement only one of them.
The combination of GMP, HACCP, TQM and TPM implementation
gives a better performance for this model than implementation without
TPM because the latter is necessary for solving the main problems of
machinery breakdown and optimising machinery/equipment or facility
efficiency and effectiveness.
3. There is a relationship between the implementation of these
manufacturing practices and industrial characteristics and products and
process strategies.

214
4. Companies need the infrastructure of training in order to achieve this
integrated model. This training can be separated into four courses of
GMP, HACCP, TPM, and TQM and are as follows: (1) Basic training
courses, (2) Management training courses, (3) Technical training
courses, and (4) Maintenance training courses. These courses should be
designed specifically for each particular job position including top
management, middle management, engineers, supervisors, and front-line
operators. The data shows that they need periods of training courses that
differ in duration of approximately 2-3 days, 3 time per year.
The integrated model was developed and shown in Chapter 9. The elements of
organisation are extremely necessary for building up manufacturing practices such as
organisational structure, management systems, management activities, and the solution
of potential of solving problems. Thai food processing industries should understand
clearly each of the manufacturing practices of GMP, HACCP, TPM, and TQM before
combining them. This also applies to the tools and techniques that are required for
assisting companies to achieve success in implementation of this model. Companies
should build up strong infrastructures and relationships amongst the various subsets of
manufacturing practices; e.g. the subset of HACCP and TQM, the subset of HACCP
and TPM, and the subset of TQM and TPM, and follow the seven steps of implementing
the model. The successful implementation of the model is reliant on human resources,
so the company’s employee should understand it clearly and know how to implement it.
This can be achieved by training courses that are provided for each particular employee
level.
This study proposed an appropriate manufacturing strategy model to reduce the
main problem areas in The Thai food processing companies concerning management,
human resources, quality, safety, cost, and equipment. These problems can be
reduced by integrating the combined techniques and practices of GMP, HACCP,
TPM and TQM into one approach suitable for application in the Thai food
processing industry. Accordingly, an appropriate manufacturing strategy based on a
seven-step implementation model for this industry is suggested with a view to
increasing Thailand’s competitive position in the international market.

215
There are limitation as shown in Chapter 7 to this research caused by restructuring of
time and resources. The findings were necessarily limited therefore to the Thai food
processing industry and were not able to be generalised without consideration of larger
sample. It was also found that the classification for Thai food processing industry is not
clear. Some government departments uses different classification regarding size. It
reveals that it is a useful application for all companies in the Thai food processing
industry. It should be used as a basis for further large scale research.

216
References
1. Adam E.E., Flores B.E., and Macias A. (2001) Quality improvement practices
and the effect on manufacturing firm performance: evidence from Mexico and
the USA, International Journal of Production Research, June.
2. Ahmed N. U., Tunc E.A. and Montagno R.V. (1991) A comparative study of US
manufacturing firms at various stages of Just-in-Time implementation,
International Journal of Production Research, Vol. 29, No. 4, 787-802.
3. Amabile T.M., (1998) A Model of creativity and innovation in organinsation,
Research in Organisation Behavior, Issue 10, pp.53.
4. Amankawa P.A. (1999) Quality and process control in the food industry, Food
Research Institute
5. Andersen T.M. and Rasmussen M. (1999) Decision support in a condition based
environment, Journal of Quality in Maintenance Engineering, Vol.5, No. 2, 89-
101.
7. Anonymous (1993), Thai textile industry: Adjusting to survive, East Asian
Executive Reports, Washington, US, Dec.
8. Anonymous (2000) Agriculture and technology: A not-so-perfect market, The
Economist, London, Vol. 354, No. 8163, S8-S10.
9. Anonymous, (1999) What next after the Kaizen Biltz?, Works Management,
Horton Kirby, Vol. 52, No. 3, 40-41.
10. Antero O., and Markku M. (1999) Case studies maintenance has a role in
quality, The TQM magazine, Vol. 11 No 1 pp. 17-21
11. Antonius R. (2003) Interpreting Quantitative data with SPSS, SAGE
Publications Ltd., London, UK.

217
12. Appelbaum S. H. and Shapiro B., (1998) The management of multicultural
group conflict, Team Performance Management, vol. 4, No. 5, 211-234.
13. Arndt G., (1985) Technology Transfer and Agricultural Robotics, Annals of the
CIRP, Vol.34 No.1
14. Arndt G., (1989a) Basic Improvement Concepts and the New Seven Tools for
TQM, (JQT-I/PIQS-Basic), CAMIA, University of Wollongong
15. Arndt G., (1995) From TQM to TPM: An Australian perspective on
development in Japan and Germany, Feature paper presented at “TPM in action”
Forum, Synergy, University of Auckland
16. Asia Pacific Food Industry (1991) Thailand’s food processing industry taking
the lead in South East Asia, May, pp. 32-39.
17. Aviation, M. (1998) Success with Six Sigma often an elusive goal, Aviation
week and Space Technology, Vol1 139, No. 20, pp.53
18. Aviation (1998) Success with Six Sigma often an Elusive Goal, Week and Space
Technology, Vol. 139, No.20, pp.53.
19. Azaiez M.N., (2002) A multi-attribute preventive replacement model, Journal of
Quality in Maintenance Engineering, Vol. 8, No. 3, 213-225.
20. Bahrami G.K. Price J.W.H. and Mathew J. (2002) The constant-interval
replacement model for preventive maintenance: A new perspective, International
Journal of Quality & Reliability Management, Vol. 17, No. 8, 822-838.
21. Balnaves M. and Caputi P. (2001) Introduction to quantitative research
methods: an investigative approach, SAGE , London.

218
22. Bamber C.J., Sharp J.M. and Hhides (1999) Factors affecting successful
implementation of total productive maintenance: A UK manufacturing case
study perspective, Journal of Quality in Maintenance Engineering, Vol. 5, Issue
3.
23. Bamber C.J., Castka P., Sharp J.M. and Motara Y, (2002) Cross-functional team
working for overall equipment effectiveness (OEE), Journal of Quality in
Maintenance Engineering, Vol. 9, No. 3, 223-238.
24. Bangkok Bank (1998) Report review of Thailand’s Economic, Bangkok,
Thailand
25. Bank of Thailand (1996) A Quarterly review of Thailand’s Economic, Financial
institution and Markets in Thailand, Bank of Thailand,
26. Bank of Thailand (1997) A Quarterly review of Thailand’s Economic, Financial
institution and Markets in Thailand, Bank of Thailand, Vol, 1, No3 Oct-Dec
27. Bank of Thailand (1998) Thailand’s Economic, Focus on Thai crisis, Bank of
Thailand, Vol 2,No2, May -July,
28. Bank of Thailand (1999) Thailand’s Economic, Financial institution and
Markets in Thailand, Bank of Thailand, Vol 1, No1, Jan- April
29. Bank of Thailand (2000) Review of Thailand’s Economic, Financial institution
and Markets in Thailand, Bank of Thailand,
30. Bartz A.E. (1971) Basic descriptive statistics for education and the behavioral
science, Minneapolis, Min, Burgess Pub. Co.
31. Bates T.F., Visser B. and Bates C.F. (2000) An integrated approach to problem
solving: linking K-T, TQM and RCA to TPM, The TQM Magazine, Vol.12, No.
4
219
32. Bennet, W.L., Steed, L.L., (1999), An integrated approach to food safety,
Quality Progress, February, 37-42.
33. Benton W.C., (1997), Statistical process control and the Taguchi method: a
comparative evaluation, International Journal of Production Research, Vol. 29,
No. 9,
34. Blake, S., (1992) Keeping it simple to reduce spoiled efficiency in the food
industry, industrial Engineering, Norcross, Vol. 24, Issue 6 pp. 6-12
35. Blakeslee, J.A., (1999) Implementing the Six Sigma Solution: How to achieve
quantum leaps in quality and competitiveness, Quality Progress 32(7):77-85
36. Blanchard B.S., (1997) An Enhanced approach for implementing total
productive maintenance in the manufacturing environment, Journal of Quality in
Maintenance Engineering, Vol. 3, No.5.
37. Bhumiratana S., (1990) Survey Report: Biotechnology in Thailand, Asia
development strategies and potentials, Asian Productivity Organisation, Tokyo
38. Bower J. B., (1997) Statistics for food science V: comparison of many groups
(part A), Nutrition & Food Science, March/April , No 2, 78-84.
39. Bower J. B., (1998) Statistics for food science V: ANOVA and multiple
comparisons (part B), Nutrition & Food Science, Jan/Feb , No 1, 41-48.
40. Brookes N.J. and Backhouse C.J., (1998) Understanding concurrent engineering
implementation: a case-study approach, International Journal of Production
Research, Vol. 36, No.11, 3035-3054.
41. Breyfogle F.W., Cupello J.M. and Meadows B. (2001) Managing Six Sigma, A
Practical Guide to Understanding, Assessing and Implementing the Strategy
That Yields Bottom Line Success, John Willey & Sing, Inc, Canada

220
42. Bryan, F.L., Guzewich, J.J. and Todd, E.C.D. (1993) Use of the hazard analysis
critical control point approach by state, provincial and local food protection
agencies: result of a survey and discussion, Dairy Food and Environmental
Sanitation, Vol.13, No.6 pp.323-31
43. Bukchin J., (1998) A comparative study of performance measures for throughput
of a mixed model assembly line in a JIT environment, International Journal of
Production Research, Vol. 36, No. 10, 2669-2685.
44. Camp R.C., (1989) Benchmarking: The Search for Industry Best Practices that
Lead to Superior Performance, ASQC Quality Press, Milwaukee.
45. Cavalier M.P. and Knapp G.M., (1996) Reducing preventive maintenance cost
error caused by uncertainty, Journal of Quality in Maintenance Engineering,
Vol. 2, No. 3, 21-36.
46. Chadwick H. (1997), Industry Guide to Good Hygiene Practice: Retail Guide,
Chadwick House Group Ltd, London.
47. Chamarik S., and Goodnatilake S., (1998), Technological independence: The
Asian experience The Asian Experience, United Nations University Press
48. Chand G. and Shirvani B., (2000) Implementation of TPM in cellular
manufacture, Journal of Materials Processing Technology, Vol. 103 pp.149-
154.
49. Chantratmanklasri N., (1994) TDRI Quarterly Reviews, Thailand Development
Research Institutes, Bangkok, Thailand, June
50. Chaudhry S.S., Tamimi N.A. and Betton J. The management and control of
quality in a process industry, International Journal of Quality & Reliability
Management, Vol. 14, No. 6, pp. 575-581.

221
51. Cheng T.C.E. and Musaphir H., (1996) Theory and practice of manufacturing
strategy, International Journal of Production Research, Vol. 34, No. 5, 1243-
1259.
52. Chayowan, S. (1997) Role of Thailand National Food Institute, Annual
Academic Meeting, Feb, Kasetsart University, Thailand
53. Childs, N.M., (1997) Japanese food wholesaling: US comparisons and future
issues, British Food Journal, Vol. 11, pp. 447-455
54. Chiu H.N. and Huang B.S. (1995) The economic design of X and S2 control
charts with preventive maintenance and increasing hazard rate, Journal of
Quality in Maintenance Engineering, Vol. 1, No. 4, pp.17-40.
55. Chiu H.N. and Huang B.S., (1996) The economic design of X control charts
under a preventive maintenance policy, International Journal of Quality &
Reliability Management, Vol. 13, No. 1, 61-71.
56. Cooke F.C. (2003) Plant maintenance strategy: evidence from four British
manufacturing firms, Journal of Quality in Maintenance Engineering, Vol. 9,
No. 3, 239-249.
57. Corston R. (2000) Andrew C. A Crash Course in SPSS for windows Second
Edition for Version 10, Blaukwell Publishing.
58. Corbett L.M., Adam E.E., Harrison N. J., Lee T.S., Rho B.-H. and Samson D.,
(1998) A study of quality management practices and performance in Asia and
the south Pacific, International Journal of Production Research, Vol. 36, No. 9,
2597-2607.
59. Cross, R .(1994). What HACCP Really Means Available:
http://ifse.tamu.edu/ifse/haccp.htm pp. 1-4.
60. Crosby P.B., (1989) Let’s Talk quality, McGraw Hill Book Co., New York

222
61. Dale B.G., Boaden R.J. and Lascelles D.M., (1994) Total Quality Management,
an Overview, in Barrie G. Dale Managing Quality, second edition, Prentice Hall,
New York
62. David, W. (1991) The food Industry Takes the Offensive, Nation’s Business,
Washington Vol. 79 issue 7 pp.42-46
63. Daya M.B. and Alghamdi A.S., (2000) On an imperfect preventive maintenance
model, International Journal of Operations & Production Management, Vol.17,
No. 6, 661-670.
64. Deming W.E., (1986) Out of the Crisis: Quality, Productivity and Competitive
Position, Cambridge University Press, Cambridge.
65. Department of Business Economics (1998) Trade Statistic and Economic
Indicator of Thailand, Ministry of Commerce, Thailand.
66. Department of Business Economics (2000) Business and Industrial Statistics,
Ministry of Commerce, Thailand.
67. Department of Customs (2000) Annual Report Year 2000, Ministry, of
Commerce, Thailand.
68. Department of Industry Promotion (1998) Summary Statistic of the 1997
Industrial Establishment, Ministry of Industry, Thailand.
69. Department of Industrial Promotion (2000) Strategies for incubation &
strengthening for Small & Medium-scale industries under the 5 Year industrial
restructuring plan, 1998-2002, Ministry of Industrial, Thailand.
70. Department of Industrial Workers (1997) Report of the Labour force survey,
Ministry of Industry, Thailand.
223
71. Dewongpasart, K. (2003) Introduction of Food Law, Food and Drug
Organisation, Ministry of Health, Thailand
72. Dhanamitta S., Tontisirin A., and Valyasevi A. (1983), Proceedings of
Workshop on home and village prepared supplementary food practices in Asia,
The Institute of Nutrition Mahidol University, Thailand and International
Development Research Centre Ottawa, Canada, 28-30 Oct
73. Dollar D., Hallward-Driemeir M., (2000) Crisis, adjustment, and reform in
Thailand’s industrial firms, The World Bank Research Observer, Washington,
Feb.
74. Durell, T.G. and Howard, M. (1997) The industry guides to good hygiene
practice: a commentary and comparison with guidance issued to assist in
compliance with health and safety law, British Food Journal, Vol. 99 No. 10,
pp.376-9.
75. Educational Foundation of the National Restaurant Association, (1992) Applied
Foodservice Sanitation, (4th ed.), Kendall/Hund Publishing Company.
76. Ehiri, J., Morris, G.P., and McEwan (1995) Implementation of HACCP in food
business: the way ahead, Food Control, Vol.6 No.6 pp. 341-5.
77. Esquival M. A. and Kleiner B. H., (1997) The importance of conflict in work
team effectiveness, Team Performance Management, Vol.3, No. 2, 89-96.
78. Ettlie J.E. (1996) Taking Charge of manufacturing: How companies are
combininb technological and organisational innovations to compete
successfully, Jossey-Bass Publishers, San Francisco
79. Evans J.R. amd Lindsay W.M., (1999) The Management and Control of
Quality, Fourth Fdition, South-Western College Publishing, Cincinnati.

224
80. Event G. (1991) Quality method in management research, Sage Publication Inc.,
London, UK
81. FAO/WHO (1997) Recommended International Code of Practice, General
Principles of `Food Hygiene, [CAC/RCP 1-1969 Rev. 3(1997)], Rome
82. Fallows, S.C. (1994) Implementing the EC general food hygiene directive,
British Food Journal, Vol. 96 No. 8, pp.,44-46
83. Fawcett S.E. and Myers M.B., (2001) Product and employee development in a
dvanced manufacturing: implementation and impact, International Journal of
Production Research, Vol. 39, No. 1, 65-79.
84. Fielding N.G. and Fielding J.L. (1986) Linking Data Qualitative Research
Methods, Beverly Hills, Sage Publications.
87. Filippini R., (1997) Operation management Research: some reflections on
evolution, models and empirical studies in OM, International Journal of
Operations & Production Management, Vol17, No.7, pp. 655-670
88. Finch, B.J. and Cox, J.F. (1986) Examination of Just-in-Time management for
the small manufacture, International Journal of Production Research, Vol. 24,
pp.30-38
89. Finlow-Bates T., Visser B. and Folow Bates C., An integrated approach to
problem solving: linking K-T, TQM and RCA to TPM, The TQM Magazine,
2000, Vol. 12.
90. Foreman C.R. and Vargas D.H, (1999) Affecting the value chain through
supplier Kaizen, Hospital Material Management Quarterly, Rockville, Vol. 20,
No. 3, 21-27.
225
91. Fonkegchai Y., (1998) Study of Fruit and Vegetable Production Development,
Department of Industrial Promotion, Bangkok, Thailand.
92. Food and Agriculture Organisation and Ministry of Agriculture (2000) Annual
report 2000, Ministry of Agriculture, Bangkok, Thailand
100. Forker L.B., Mendez D. and Hershauer J.C., (1997) Total quality management in
the supply chain: what is its impact on performance?, International Journal of
Production Research, Vol. 35, No. 6, 1681-1701.
101. Frazer L. and Meredith L. (2000) Questionnaire design administration, John
Wiley & Sons Australia Ltd., Brisbane.
102. Fredendall L. D., Patterson J. W. Kennedy W.J. and Griffin T., (1997)
Maintenance: Modeling its strategic impact, Journal of Managerial Issues,
Pittsburg, Vol. 9, No. 4, 440-453 .
103. Gaylor, S. (1988) Training needs of the Victorian wine industry, Proceedings of
the Second Conference of the Victorian Wine Industry Association Inc.,
Melbourne, Australia, pp. 78-95
104. Gelders L., Mannaerts P. and Males J., (1994) Manufacturing strategy,
performance indicators and improvement programmes, International Journal of
Production Research, vol. 32, No. 4, 797-805.
105. Gersotikun A. (1997) A study of the demand for food science and technology
graduates in the Thai food processing industry, Department of Food science,
Faculty of Science, Payup University, Chiengmai, Thailand.
106. Ghanim A. A., (2003) A statistical approach linking energy management to
maintenance and production factors, Journal of Quality in Maintenance
Engineering, Vol. 9, No. 1, pp.25-37.

226
107. Gilbert J.P. (1990) The state of JIT implementation and development in the
USA, International Journal of Production Research, Vol.28, No.6, pp.1099-
1109,
108 Gibson P., Greemhalgh and Heer., (1995) Manufacturing management principles
and concepts, Chapman & Hall, London
109. Giffi C., Roth A.V. and Seal G.M. (1990) Competing in World-Class
Manufacturing: America’s 21 Century challenge, Business One Irwin,
Homewood
110. Golestani M.M., and Zwanenberg N.V., (1997) Teamwork aspect of fixed-price
and cost-plus contracts in “bespoke” engineering companies, Team Performance
Management, Vol. 3. No. 1, 43-53.
111 Golhar D. Y. and Stamm C.L., (1991) The just-in-time philosophy: literature
review, International Journal of Production Research, Vol. 29, No. 4, 657-676.
112. Goode S.A. (1999) IPEC GMP audit guideline, Pharmaceutical Technology,
Cleveland, Vol. 23, Issue 8, pp30-33
113. Graf, E. and Saguy, I.S. (1991) Food Product Development from Concept to the
Market placeM Reinhold, Ney York, NY.
114. Greenwood P.E. (1996) A guide to chi-squared testing, John Willey & Sons,
New York
115 Grigg N.P. (1998) Statistical process control in UK food production overview,
British Food Journal, Vol. 15 No.1, pp371-373
116. Groover, M.P. (2001) Automation, Production Systems, and Computer-
Integrated Manufacturing Second Edition, Prentice Hall Inc., New Jersey.
227
117. Hair J.F. Anderson R.E., Ratham R.L. and Black W.C., (1995) Multivariate Data
Analysis with readings, Fourth Edition, Prentice Hall, Englewood Cliffs, New
Jersey
118. Hall R.W. (1987) Attaining Manufacturing Excellence, Dow Jones-Irwin,
Homewood, IIIinios.
119. Hallihan A, Sackett P. and Williams G. M, ( 1997) JIT manufacturing: the
evolution to an implementation model founded I current practice, International
Journal of Production Research, Vol. 35, No. 4, 901-920.
120. Harrigan, W.F. (1993) The ISO 9000 series and its implication for HACCP,
Food Control, Vol.4 No.2 pp. 105-11
121. Hartmann E.H. (1992) Successfully Installing TPM in a Non-Japanese Plant,
TPM Press, Inc., Pittsburgh, Pennsylvania.
122. Hasek G., (2000) Extraordinary extrusions, Industry Week, Cleveland, Vol. 249.
No. 17, 79-80.
123. Hassan L.K., Chan J.F., and Metcalfe A. V., (2000) The role of total productive
maintenance in business excellence, Total Quality Management, Abingdon, Vol.
11, No. 4-6, S596.
124. Hathaway, S.C. (1993) Rick assessment procedures used by the Codex
Alimentarius Committee and its subsidiary and advisory bodies, Food Control,
Vol. 4, pp..189-204
125. Hemamalini B. and Rajendran C., (2000) Determination of the number of
containers, production kanbans and withdrawal kanbans; and scheduling in
kanban flowshops-Part 1, International Journal of Production Research, Vol.
38, No. 11, 2529-2548.

228
116. Hendon D. W., (2001) How to negotiate with Thai Executives, Asia Pacific,
Journal of Marketing and Logistics, Vol. 13, No. 3, 41-62.
117. Herbert F.W. and Jon A.K. (1996) An introduction to survey research polling
and data analysis third edition, Sage Publications.
118. Herderschee Han, (1996), Incentive for export A case study of Taiwan and
Thailand, Avebury Ashgater Publishing Ltd., London.
119. Hipkin I. (1999) The implementation of information systems for maintenance
management, International Journal of Production Research, Vol. 35, No. 9,
2429-2444.
120. Hipkin I.B. and Cock C.D, (2000) TQM and BPR: lessons for maintenance
management, The International Journal of Management Science, Omega 28 pp.
277-292.
121. Hiroshi Katayama H., Sirichan K. and Hiraki S. (1999) Japanese offshore
manufacturing in Thailand: its difficulties and future prospects ,Integrated
Manufacturing Systems, Vol. 10, No. 4 pp. 210-220
122. Hoffer G., (1993) Breakthrough Thinking in TQM, Prentice Hall
123. Holbert N.B.(1993) Practical marketing research an integrated global
perspective, Prince- Hall, Singapore.
124. Holt, G. and Hemson ,S.J. (2000) Information for good hygiene practice in small
businesses, British Food Journal, Vol.102, No.4, pp., 320-337
125. Hutchison T.P., Chekaluk E. and Cairns D., (2000) ANOVA applied to
examination scores, Work Study, Vol. 49, No. 3, 104-106.
126. .Imai M., (1986) Kaizen: The Key to Japan’s Competitive Success,
McGraw-Hill Publishing Co., Tokyo

229
127. Ingram H. and Jones S., Teamwork and the management of food service
operations, Team Performance Management, 1996, Vol. 4., No. 2, 67-73.
128. Inman R., (1990) Quality Certification of Suppliers by JIT Manufactures,
Production and Inventory Management Journal, Vol.31 No.2 pp. 58-61
129. Institute for SMEs Development (1999) SME Policy In Thailand, Bangkok,
Thailand.
130. Ishikawa K., (1985) What is Total Quality Control: the Japanese Way, translated
by David J Li, Prentice-Hall Inc. Englewood Cliffs, USA.
131. Jin G., Kelly T., Vargas N. and Callahan M, (2003) Preliminary evaluation of
metals removal in three pilot-scale constructed wetland systems, Management of
Environmental Quality: An International Journal, Vol. 14, No. 3, 323-332.
132. Jatupitak S.., (2004) Thai Food Industry: Challenges and Opportunities in the
Global Market, Owen G. Kenan Conference, 28 January, Bangkok, Thailand
133. Jewaranon D. (2004) Thai Food Industry: Challenges and Opportunities in the
Global Market, Owen G. Kenan Conference, 28 January, Bangkok, Thailand
134. John H., (1993), Thailand: Resurgent indusry, Institutional Investor, New York,
Nov
135. John. G, and Phil. J. (1991) Research methods managers, Paul Chapman
Publishing, London
136. Joseph I.N. snf Rajendran C. Kamalannhan T.J. and Anantharaman R.N. (1999)
Organisational factors and total quality management-an empirical study,
International Journal of Production Research, Vol.37, No.6, pp.1337-1352.
137. Juran J.M., (1989) Juran on Leadership for quality, Free Press, New York
230
138. Kane, M.C.K. (1995) The role of food scientists and technologists in a major
retailer, Food Science and Technology Today, Vol. 9 No. 2
140. Kardon B. and Frededall L.D., (2002) Incorporating overall probability of
system failure into a preventive maintenance model for a serial system, Journal
of Quality in Maintenance Engineering, 2002, Vol. 8, No. 4, 331-345.
141. Kawamoto, H., (1992) Significant trends in Japan’s retailing industry, Japan 21 s
t, September, pp. 95, Tokyo
142. Kay, Michael Z., Murphy, J. William, and Harris, Jeffrey S.; (1994) How to
Zap Your Workers' Comp Costs Financial Executive, January/February, pp. 44-
48.
143. Kepner C.H. (1965) The Rational Manger, McGraw Hill Book Co., New York
144. Ketnin N. (2000) Import and Export review of Food Industry, Food Journal Of
Thailand, Vol3., No 14.
145. Ketpibun S.(2000) Introduction of HACCP, The Japan-Thailand Cooperation
Society, Bangkok, Thailand.
146. Ketpibun S.(2001) Introduction of HACCP, The Japan-Thailand Cooperation
Society, Bangkok, Thailand.
147. Kenne J.P. and Boukas E.K., (2003) Hierarchical control of production and
maintenance rates in manufacturing systems, Journal of Quality in Maintenance
Engineering, Vol. 9, No. 1, 66-82.
148. Kim, Y. and Lee, J.(1993) Manufacturing strategy and production systems: an
integrated framework, Journal of Operation Management, Voll.11, pp.3-15.
149. Kirby, k. (1994) HACCP in practice, Food Control, VOl.5 No.4 pp. 230-36

231
150. Kirk J. and Miller M.C. (1986) Reliability and Validity in Qualitative Research,
SAGE Publication, New York.
151. Kohata K. (1988) Small and Medium industries Modernization Policy by sector
in Japan International Cooperation Agency (JICA) and Thailand, Department of
Industrial Promotion Ministry of Industry, Bangkok Thailand.
152. Koku P. S., (1998) Innovations and Information management in the food
industry, British Food Journal, 100/6, 278-285.
153. Kongton N. and Gatkong S. (2001) Go to Food international market by HACCP
bring Thai to food for the world, Food Journal of Thailand, Vol15. Jan-Feb
154. Krasachol. L. and Tannock, J.D. (1998) A study of TQM implementation in
Thailand, International Journal of Quality & Reliability Management, Vol. 16
No. 5, 1999, pp. 418-432.
155. Kronkeaw M., (1995), Thailand’s Industrialisation and its Consequences,
Antony Rowe Ltd., London.
156. Kumar V. (1996) Data mining for scientific and engineering applications,
Mass. : Kluwer Academic, Boston.
157. Labib A.W.(1999) A framework for benchmarking appropriate productive
maintenance, Management Decision, 37/10, pp. 792-799.
158. Lamprecht, J.L. (1993), Implementing the ISO 9000 Seriers, Marcel Deller INC.
New York.
159. Leeu E.D., Pippo C., and Schwarzn T.D. (1997) Survey measurement and
process quality, Wiely Interscience Publication.
160. Lee L.C. (1989) A comparative study of the push and pull production systems,
International Journal of Operations and Production management, Vol 9 pp.5-18

232
161. Leksrisompong P. Agro-Industry in Thailand, Start Feedmil company Limited,
Bangkok, Thailand.
162. Liyanage J.P. and Kumar U, (2003) Towards a value-based view on operations
and maintenance performance management, Journal of Quality in Maintenance
Engineering, Vol. 9, No. 4, 333-350.
163. Lofsten H., (1999) Management of industrial maintenance-economic evaluation
of maintenance policies, International Journal of Operations & Production
Management, Vol. 19, No. 7, 716-737.
164. Lloyd R. (1991) Food Industry Guidelines, Issue 2, London
165. Lyberg L. (1997) Survey measurement and process quality, Willey Published,
New York.
166. Mangelsdorf D. (1999) Evolution from quality management to an integrative
management system based on TQM and its impact in the profession of quality
managers in industry, The TQM magazine, Vol.11, No.6, pp.419-424.
167. Mann L, Saxena A. and Knapp G. M., Statistical-based or condition-based
preventive maintenance, International Journal of Operations & Production
Management, 1995, Vol. 1, No. 1, 46-59.
168. Mann R., Adebanjio O.,and Kehoe D. (1999) Best practices in the food and
drink industry, British Food Journal, Vol 101 No3 pp. 235-254
169. Manz C.C. and Neck C. P., Teamthink: beyond the groupthink syndrome in self-
managing work teams, Team Performance Management, 1997, Vol. 3, No. 1,
18-31.
233
170. Marsh R. F. and Meredith J.R., (1998) Changes in performance measures on the
factory floor, Production and Inventory Management Journal, Vol. 39, No. 1,
36-40.
171. Martinez-Lorente A.R., Dewhurst F.W. and Gallego-Rodriguez A (2000)
Relating TQM, marketing and business performance: an exploratory study,
International Journal of Production Research, Vol. 38. No. 14, 3227-3246.
172 Mason J. (1996) Qualitative Researching, SAGA Published, London.
173. Mayes T and Mortimore S. (2001) Making the most of HACCP Learning from o
thers’ experience, Woodhead Publishing Limited, Cambridge, England.
174. Maykut P.S. (1994) Beginning qualitative research : a philosophic and practical
guide, Falmer Press, London
175. McCalman J.,(1998) Self managing teams in high technology manufacture:
Overcoming technological barriers, Team Performance Management, Vol. 4,
No. 3, 93-112.
176 McFadzean E., (2000) Techniques to enhance creative thinking, Team
Performance Management, An International Journal, Vol. 6, No.3/4, 62-72.
178 Mcllveen K., (1996) production development and the QMS, British Food
Journal, Vol 96 Mo 3 pp.18-22
179. McNichols T., Hassinger R. and Bapst G. W., (1999) Quick and continuous
improvement through kaizen blitz, Hospital Material Management Quarterly, V
ol. 20, No. 4, 1-7.
180. McTeer M.M. and Dale B.C., (1996) The process of ISO 9000 series
registration: an examination in small companies, International Journal of
Production Research, Vol. 34, No. 9, 2379-2392.

234
181. Mephokee Chanin, (1999), Thai SMEs, Industry Economic Monitor, Jan-Feb
182, Mcllveen, H. (1994) Product development and the QMS: An Essential
Combination or a Contradiction in Terms, British Food Journal, Vol 96 No.3.
pp.18-22
183. Mehta, S., Wilcock, A. (1996, “Quality system standards in the Canadian food
and beverage industry, Quality Management Journal, 4, 1, 72-93.
184. Merchanl R. (1999) Basic statistics using Excel for Office 97 for use with
statistical techniques in business and economics, tenth edition, Boston, McGraw-
Hill, Boston.
185. Meyer D.A. and Ferdows K. (1991) Quality up technology down:
manufacturing improvement programs in Europe, International Journal of
Technology Management: Special Publication on the Role of Technology in
corporate Policy, pp. 136-53.
186. Miltenburg J., (1997), Comparing JIT, MRP and TOC, and embedding TOC into
MRP, International Journal of Production Research, Vol. 35, No. 4, 1147-1169.
187. Mossel, A. (1995), Principle of food control and good hygiene in the European
single market, Food Control, Vol.6 No.5, pp. 289-93
188. Mtthew P.M., Adrion C.P. and Chrithapher J.G. (2003) A national survey of
food hygiene training and qualification levels in the UK food industrym, Journal
of Enviromental Health Research, Vo,.10 No.2 pp.115-123.
189. Nadler G. and Chandon W., (2000) A breakthrough thinking organisation, Team
Performance Management: An International Journal, Vol. 6, No. 7/8, 122-130.
190. Nakajima S., (1988) Introduction to TPM, Productivity Press, Cambridge, Ma.

235
191. Nakajima S., (1988) TPM Development Program, Productivity Press,
Cambridge, Ma
192. Naik B. and Chakravarty A. K., (1992) Strategic acquisition of new
manufacturing technology: a review and research framework, International
Journal of Production Research, Vol. 30, No. 7, 1575-1601.
193. National Advisory Committee for Microbiological Criteria for Food
(NACMCF), (1992) Hazard Analysis and Critical Control Point System
Adopted, USDA-FSIS Information Office Washington, DC
194. National Advisory Committee for Microbiological Criteria for Food
(NACMCF), (1989), HACCP Principles for Food Production, USDA-FSIS
Information Office Washington, DC
195. National Food Industry Review (1999) Report of the 1999 Industrial Census
Vicinity, Bangkok, Thailand
196. National Food Industry Review (2001) Compiled food statistical data, Bangkok.
Thailand.
197. National Statistical Office (1997), Economic indicators 1997, National
Statistical Office, Office of the Prime Minister, Bangkok, Thailand
198. Ngamkroeckjoti C. and Johri L. M., (2000) Management of environmental
scanning processes in large companies in Thailand, Business Process
Management Journal, Vol. 6, No. 4, 331-341.
199. Nigel P.G. (2001) Statistical process control in UK food production: an
overview, British Food Journal, Vol. 8, No. 100, pp. 371-379.
200. Norusis M.J. (2002) SPSS 11.0 guide to data analysis, Prentice Hall.
236
201. Norton C.; (2002) Proper food handing is cornerstone skill, Food management,
Cleveland, Vol.37 Issue 3 ppl52-54
202. Norton C., (2002) HACCP start-up step: part II, Food management, Cleveland,
Vol. 37, Issue 2, pp.60-62
203. Oakland, J.S., (1989) Total Quality Management, Butterworth-Heinemann Ltd,
Oxford.
204. Oakland J., (1993) Total Quality Management: The Route to Improving
Performance, (Second Edition), Heinemann, London
205. Office of The Board of Investment, Office of The Prime Minister Royal Thai
Government, (1993), Investment Opportunities study Agricultural Machinery
Industry in Thailand, Board of Investment Welfare
206. Olarikovit C. (1996) Comparative advantage in the food industry of Thailand: a
domestic resource cost study, Department of Economic, Graduate school,
Chulalongkorn University
207. Ongsritrakul S. and Hubbard L. (1996) The export market for Thai frozen
shrimps in the European Union, British Food Journal, Vol . 7, No.4 pp.24–28
208. Orgden S.M.. and Grigg N.P., (2003) The development of sector-based quality
assurance standards in UK: dovetailing or dovetailing?, The TQM Magazine,
Vol. 15 No.1 p.p.7-13
209. Ralph (1995) Production control in the food processing industry, International
Journal of Operation & Production management, Vol. 15, No. 8, 73-88.
210. Payne, K. (1999) Food for thought: Accreditation schemes, The Safety & Health
Practitioner, Borehamwood, Vol. 1 Issue 1 pp.54-55
211. Pike J. and Barnes R. (1994) TQM in Action, Chapman & Hall, London
237
212. Pongpattanasili, C. and Arndt, G. (2002) An appropriate manufacturing
strategy in Thai food processing industry, Industrial Engineering net work
conference, 24-24 October , Thailand, pp. 321-327
213. Pongpattanasili, C. and Arndt, G. (2003) Towards an appropriate
manufacturing strategy model for the Thai food processing industry, 9th
International Conference on Manufacturing Excellence 2003, October,
Melbourne, Australia
214. Porter, M.E. (1980) Competitive Strategy, The Free Press, New York
215. Ratnatunga J. (1995) The impact of structural factors on the performance of the
Australian food processing industry, British Food Journal, Vol.97 No.2 pp 21-
33
216. Rishel T.D. and Christy D.P., Incorporating maintenance activities into
production planning; integration the master schedule versus material
requirements level, International Journal of Production Research, 1996, Vol.
34, No. 2, 421-446.
217. Riswadkar, A.V. (2000) An introduction to HACCP, Professional Safety,
Ridge, Vol 45 Issue 6 pp. 33-36
218. Raouf A and Daya B.M. (1995) Total maintenance management: A timely
integration of product, Production and Inventory Management Journal,Vol.1
No.4
219. Rohitratana, K.and Sakun B. Quality standard implementation in the Thai
seafood processing industry, British Food Journal, Vol. 103 No. 9, 2001, pp.
623-630.
220. Rungtusanatham M., Ogden J.A. and Wu B., Advancing theory development in
total quality management A “Deming management method” perspective,

238
International Journal Operations & Production Management, 2003, Vol.23, No.
8, 918-936.
221. Rushmer R.K., How do we measure the effectiveness of team building? Is it
good enough? Team Management Systems- a case study, Team Performance
Management, 1997, Vol. 3, No. 4, 244-260.
222. Salant and Dillman (1994) How ti conduct our own survey, Willey Published,
New York.
223. Samantha J.G., Gilling E.A., and Joanne Z.T. Successful Hazard Critical
Control Poing Implementation in The UK Understanding the Barriers through
the Use of a Behavioral Adherence Model, Journal of Food Production, Vol.64
No.5, pp. 720-725.
224. Saraph, J.V., Benson P.G. and Schroeder R.G. (1989) An Instrument for
measuring the critical factors of Quality management, Decision Science, Vol. 20
pp. 810-829
225. Sasananan M. and Sethavanich K., (2000) Implementation of Total Productive
Maintenance (TPM) in Thai SME, Processing of Special International
Conference on Production Research, Bangkok, Thailand August 2-4
226. Savsar M., Simulation analysis of maintenance policies in just-in-time
production systems, International Journal of Operations & Production
Management, 1997, Vol. 17, No. 3, 256-266.
227. Scheuermann L., Zhu Z. and Scheuerman S.B. (1997) TQM success efforts: use
more quantitative or qualitative tools, Industrial Management & Data Systems,
97/7 pp.264-270.
228. Schonberger R. (1986) World Class Manufacturing Casebook: Implementing JIT
and TQC, The Free Predd, New York

239
229. Semanochang P. (2000) Important Factors Influencing Reading , Barries and
Supporting Criteria for Good Manufacturing Practice (GMP) Among
Phamaceutical Manufactures, Faculty of Pharmacy, Chiang Mai University ,
Thailand
230. Shabbir T. and Gerald M.K (2002) Equipment assignment to multiple overhaul
blocks in series systems, Journal of Quality in Maintenance Engineering, Vol.8
No.4, pp.319-330
231. Shafer S., Fast-tracking moldmaking, Molding System, Dearborn, 1999, Vol. 57,
No. 10, 20-23.
232. Shapiro J. C., (1997) The impact of a TQM intervention on teamwork: a
longitudinal assessment, Team Performance Management, Vol. 3, No. 3, 150-
161.
233. Sherif J.S., Repair times for systems that have high early failures, Journal of
Quality in Maintenance Engineering, 2003, Vol. 9, No. 3, 279-283.
234. Sherwin D.J., Age-base opportunity maintenance, Journal of Quality in
Maintenance Engineering, 1999, Vol. 5, No. 3, 221-235.
235. Shinakawa K., Yokoyama, O. (1997) HACCP system implementation
Application course, Science Forum
236. Shinawat T.,(2004) Thai Food Industry: Challenges and Opportunities in the
Global Market, Owen G. Kenan Conference, 28 January, Bangkok, Thailand
237. Siegel A.F. (1996) Statistics and data analysis : an introduction, J Wiley, New
York.
240
238. Sirisaong P. Semanochang P. and Busayawong, C. (2000) Potential of
Pharmaceutical Manufactures and Problems related to (Draft) GMP Approval
for Traditional Medicine Manufactures in Chiang Mai Province, Faculty of
Pharmacy, Chiang Mai University, Thailand
239. Sohal, A.S.(1993) JIT manufacturing: industry analysis and a method for
implementation, International Journal of Operations & Production
Management, Vol.13 No.2 pp.135-142
240. Sohal, A.S. (1995) Assessing implementations: an empirical field study,
Proceedings of the European Conference on Management of Technology
Conference on Management Technology, Birmingham, p.469-84
241. Soliman F.; (2000) Application knowledge management for hazard analysis in
the Australian dairy industry, Journal of knowledge Management, Vol
4,November, pp.287-294
242. Spharim I. and Haruvy N., (1999) Case study of transfer of adapted dairy
technology to Thailand: A methodological approach, Journal of Financial
Management & Analysis, Mumbai, Vol. 12, No.1 , 77-83.
243. Stephens B. (1997) Implementation ISO 9000 on Ford’s Quality Award: effects
on organisaonal Knowledge and application of TQM principles and quality
tools, The TQM magazine, Vol. 9, No. 3, pp.190-200.
244. Stephenson, Susie.(1993) TQM: Making it Work for You Restaurants &
Institutions, pp. 109-111. October 1
245. Stevenson K.E. (1995) Establishing Hazard Analysis Critical Control Point
Programs: A workshop manual, The Food Processors Institute, New York.
246. Sumner, J. (2000) A guide to food quality Assurance” M&S Food Consultants
Pty Ltd.,
241
247. Suwannaporn P.and Speece M.,(2000) Continuous learning process in new
product development in the Thai food processing industry, British Food Journal,
Vol. 102, No. 8, 598-614.
248. Surak, J.G., Simpson, K., (1994), Using ISO 9000 standards as a quality
framework, Food Technology, December, 63-4.
249. Suwanpatikorn N. (2000) Food processing industry distribution control for
department store, Food Journal of Thailand, Vol.3, No.13, pp.48-52
250. Suzaki K.(1987) The New Manufacturing Challenge, Free Press, New York.
251. Sweeney, M. (1993) Strategic manufacturing management: restructuring
wasteful production to world class, Journal of General Management, Vol18,
No.3 pp. 57-76
252. Swink, M. and Way, M.H. (1995) Manufacturing strategies: propositions,
current research, renewed directions, International Journal of Operations &
Production Management, Vol.15 No7. pp. 4-26.
253. Tabucanon M.T. (1993), Thailand’s manufacturing sector: Issues on
development, technology, and management, Journal of Manufacturing Systems,
Deartorn, Vol.12, no. 3, 199.
254. Taguchi G. (1986) Introduction to quality engineering: designing quality into
products and processes (translated into English by the Asian Productivity
Organisation), The Organization, Tokyo.
255. Tannock, J. and Krasachol, L.and (2000), The Thai foundation quality system
standard, The TQM Magazine; Vol 12 No.1
256. Tannock, J.; Krasachol, L.;and Ruangperpool, S. (2002), The development of
total quality management in Thai manufacturing SMEs: A case study approach,
International Journal of Quality & Reliability Management,Vol. 19 No. 4.

242
257. TechniCAL (1996). HACCP: A Principle Whose Time has Come Available:
http://www.tcal.com/haccp.htm p 1.
258. Thai Government (1995), Industrial Factory's Statistics (in Thai), Registration
and Factory's Statistical Section, Factory Control Division, Department of I
ndustrial Factory,Bangkok, pp. 105-8.
259. Thai Industrial Standards Institute (2002) Thailand’s Industrial Standards,
Ministry of Industry, Bangkok, Thailand.
260. Thailand Development Research Institute (TDRI), (1983) Study of food
processing industry based on Cassava raw material, Bangkok, Thailand.
261. TDRI (1989) Study of demand and status of food processing Industry employee,
Bangkok, Thailand.
262 TDRI (1989) The development of Thailand’s Technology Capability in industry,
Bangkok, Thailand.
263. Thailand Productivity Institute (1997) Evaluation study on the effects of ISO
9000 Quality Management systems to Thai enterprise’ (in Thai), Bangkok,
Thailand.
264. Thaveesook K. and Chirapatanakorn M. (1991) Food Processing industry in
Asia and The Pacific, Asian Producivity Organisation, Tokyo p.p. 242-250
265. The Eight Nation Economic and Social Development Plan (1996) National
Economic and Social Development, Board Office of the Prime Minister,
Bangkok, Thailand.
266. The National Fisheries institute ( 1997), The NFI Seafood HACCP Manual: A
Guide for Developing Seafood HACCP Plans, Arlington, Virginia, USA
243
267. The Seven Nation Economic and Social Development Plan (1992) National
Economic and Social Development, Board Office of the Prime Minister,
Bangkok, Thailand.
268. The Sixth Nation Economic and Social Development Plan, (1987) National
Economic and Social Development, Board Office of the Prime Minister,
Bangkok, Thailand.
269. Thomas D.C. and Chasless R. (1979) Quantitative method in evaluation
research, Sage Publication Inc.
270. Trace K. (1992) Strategies for research management, Graduate School of
Management, Monash University, Australia.
271. Tsang A.H.C., A strategic approach to managing maintenance performance,
Journal of Quality in Maintenance Engineering, 1998, Vol. 4.
272. U.S. Department of Agriculture. Bacterial Foodborne Diseases, Medial and
Productivity Losses, Agriculture Economic Report No 741, Wasihngton, DC:
USDA , USA
273. Voss C and Robinson. (1987) Application of Jus-in-Time Manufacturing
Techniques in the United Kingdom, International journal of Operation &
Production Management, Vol0 No4, p.p.46-52
274. Warr G.P.(2000) Is growth good for the poor: Thailand’s boom and bust,
International Journal of Social Economic, Vol.27 N0.7 pp.862-877.
275. Waterson P.E., Clegg C. W., Bolden R., Pepper K., Warr P. B. and Wall T.D.,
(1999) The use and effectiveness of modern manufacturing practices: a survey of
UK industry, International Journal of Production Research, Vol. 37 No. 10,
2271-2292.

244
276. Wattanasin S. (2000) Implementation of HACCP, The Japan-Thailand
Economic Cooperation Society, Bangkok, Thailand.
277. Weller D.L., Application of the multiple intelligences theory in quality
orginsations, Team Performance Management, 1999, Vol. 5, No. 4, 136-146.
278. WHO (1992) Guidance on Regulatory Assessment of HACCP, World Health
Organisation, Geneva
279. WHO (1999) HACCP principle and practice, Teacher’s handbook
280. Willbur A.G.(1990) CGMP’s/ food pant sanitation, CTI Publication,
281. Willbur A.G.(1992) Total Quality Management for food industries, CTI
Publication,
282. Wilson P (2000) The export competitiveness of dynamic economic 1983-1995,
Journal of Economic Studies, Vol 27 No 6 P.P 541-565
283. Wilkinson, A., Allen, P., Snape, E., (1991) TQM and the Management of
Labour, Employee Relations, 13, 1, 24-31.
284. Williams A.p., Smith R.A., Gaze R. Motarigemi T. and Wallace C.A. An
international future for standards of HACCP training, Food Control, Vol. 14 No.
2, pp. 111-121.
285. World Bank Report, (2000), Thailand Economic monitor, World Bank.
286. World Bank report, (2000), Thailand worker and crisis, World Bank.
287. Xin H. and Haya C.H. (2002) The impact of Just-in-Time production on food
quality, Total Quality Management, Vol. 13, No. 5, pp.651-670.

245
288. Yamashina, H. (1995) Japanese manufacturing strategy and the role of total
productive maintenance, Journal of Quality in Maintenance Engineering, Vol 1,
Issue 1, pp.27-38
289. Yamashina H and Otani S., (2001) preventive maintenance planning for
multiple elevators, Journal of Quality in Maintenance Engineering, Vol. 7, No.
2, 128-150.
290. Zikmund, W. (1997) Business Research Methods, The Dryden Press, USA

246
Appendix A
Thai Industry clarification and Main statistic
A-1 Type of Industry in Thailand by ISIC 1.Agriculture, forestry & fishery 1110 Agriculture & Livestock 1301 Ocean & coastal fishing 1120 Agriculture services 1302 Fishing n.e.c. 1210 Forestry 2. Oil exploration & mining 2.1 2200 Oil exploration 2.2 Mining and quarrying 2301 Iron ore mining 2902 Chemical & fertilizer 2302 Non-ferrous ore mining 2909 Mining & quarrying 2901 Stone, clay &sand pits 3. Manufacturing 3.1 Processed food
3111 Meat products 3117 Bakery products 3112 Dairy products 3118 Sugar factories & refineries 3113 Canning & preserving of fruits and vegetables
3119 Confectioneries
3114 Canning & preserving of sea- food 3121 Food products 3115 Vegetable &animal oil and fats 3122 Prepared animal feeds 3116 Grain mill products 3.2 Tobacco and beverages 3131 Distilling & rectifying spirits 3140 Tobacco manufacturing 3134 Soft drink 3.3 Construction materials 3691 Structural clay products 3696 Non-metallic mineral products 3692 Cement, lime and plaster 3.4 Intermediate product I 3110 Processed agricultural products 3620 Glass & glass products 3215 Cordage, rope and twine 3710,12 Iron & steel, basic industry 3311 Sawmill, planing 3720 Non-ferrous metal 3513 Synthetic resins 3819 Fabricated metal except machinery,
n.e.c. 3530 Petroleum refineries 3839 Electrical apparatus and supplies,
n.e.c. 3540 Miscellaneous petroleum products
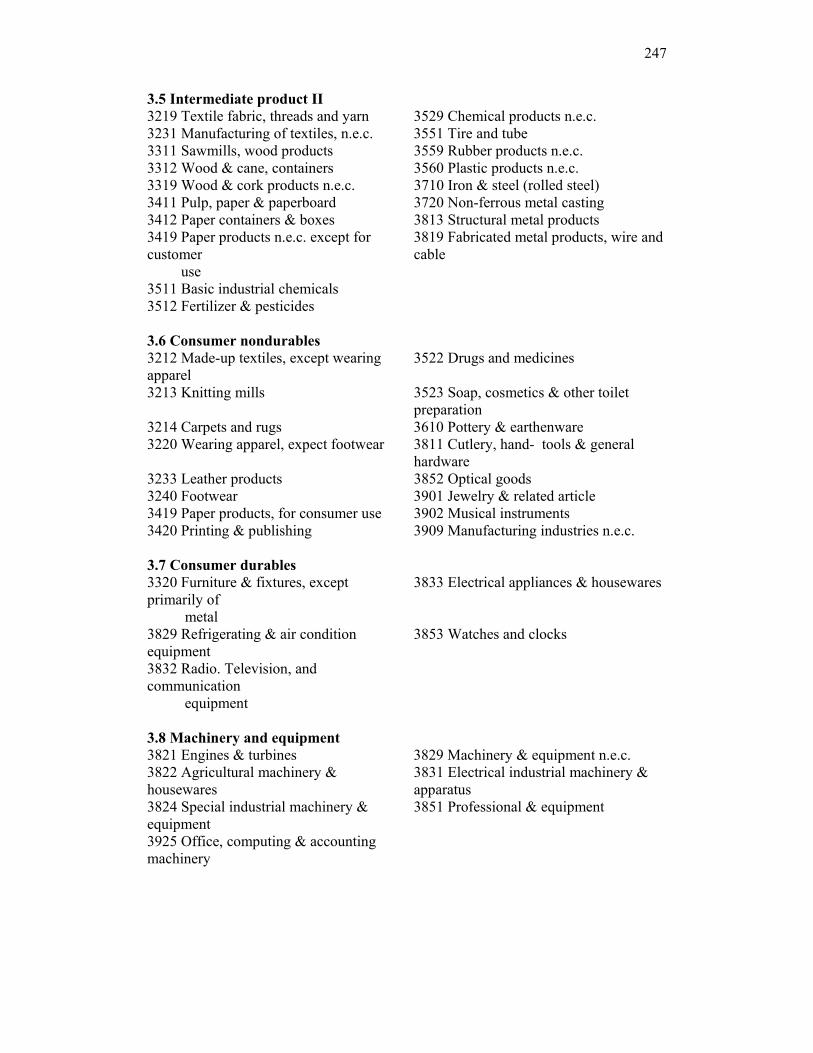
247
3.5 Intermediate product II 3219 Textile fabric, threads and yarn 3529 Chemical products n.e.c. 3231 Manufacturing of textiles, n.e.c. 3551 Tire and tube 3311 Sawmills, wood products 3559 Rubber products n.e.c. 3312 Wood & cane, containers 3560 Plastic products n.e.c. 3319 Wood & cork products n.e.c. 3710 Iron & steel (rolled steel) 3411 Pulp, paper & paperboard 3720 Non-ferrous metal casting 3412 Paper containers & boxes 3813 Structural metal products 3419 Paper products n.e.c. except for customer use
3819 Fabricated metal products, wire and cable
3511 Basic industrial chemicals 3512 Fertilizer & pesticides 3.6 Consumer nondurables 3212 Made-up textiles, except wearing apparel
3522 Drugs and medicines
3213 Knitting mills 3523 Soap, cosmetics & other toilet preparation
3214 Carpets and rugs 3610 Pottery & earthenware 3220 Wearing apparel, expect footwear 3811 Cutlery, hand- tools & general
hardware 3233 Leather products 3852 Optical goods 3240 Footwear 3901 Jewelry & related article 3419 Paper products, for consumer use 3902 Musical instruments 3420 Printing & publishing 3909 Manufacturing industries n.e.c. 3.7 Consumer durables 3320 Furniture & fixtures, except primarily of metal
3833 Electrical appliances & housewares
3829 Refrigerating & air condition equipment
3853 Watches and clocks
3832 Radio. Television, and communication equipment
3.8 Machinery and equipment 3821 Engines & turbines 3829 Machinery & equipment n.e.c. 3822 Agricultural machinery & housewares
3831 Electrical industrial machinery & apparatus
3824 Special industrial machinery & equipment
3851 Professional & equipment
3925 Office, computing & accounting machinery
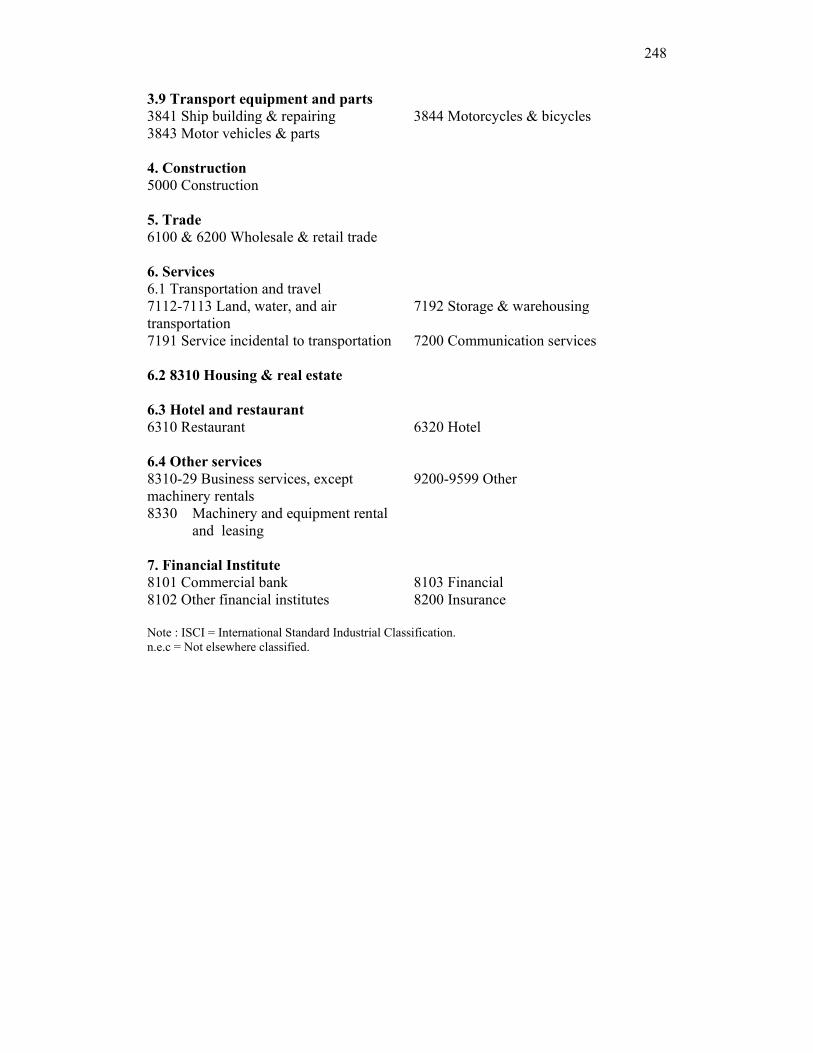
248
3.9 Transport equipment and parts 3841 Ship building & repairing 3844 Motorcycles & bicycles 3843 Motor vehicles & parts 4. Construction 5000 Construction 5. Trade 6100 & 6200 Wholesale & retail trade 6. Services 6.1 Transportation and travel 7112-7113 Land, water, and air transportation
7192 Storage & warehousing
7191 Service incidental to transportation 7200 Communication services 6.2 8310 Housing & real estate 6.3 Hotel and restaurant 6310 Restaurant 6320 Hotel 6.4 Other services 8310-29 Business services, except machinery rentals
9200-9599 Other
8330 Machinery and equipment rental and leasing
7. Financial Institute 8101 Commercial bank 8103 Financial 8102 Other financial institutes 8200 Insurance Note : ISCI = International Standard Industrial Classification. n.e.c = Not elsewhere classified.

249
A-2 Main statistic A-2.1 Figure 2.2.1: The number of factories closed in Thailand during 1998 Factory/Labor
Sector June July August September October November December
1 Agricultural 22./242 15/140 18./230 16./121 14./45 13/.83 23./166
2 Construction 35./478 30/276 52./418 23./227 28./318 20./200 41./530
3 Food and Beverage 14./189 5./27 6./121 4./31 5./78 3./217 12./482
4 Wood and Furniture 26./409 23/355 23./254 15./127 19./194 15./697 28./327
5 Textile 5./242 1./9 4./91 1./12 4./1,587 4./325 9./2,272
6 Chemical and Plastics 6./242 4./694./24 4./200 4./38 5./124 1./14 2./65
7 Metallic and 8./81 4./69 5./38 5./77 1./9 15./246 6./84
Non Metallic Product
8 Service 42./628 31./3,510 32./2,241 21./475 16./121 25./377 28./264
9 Other Products 9./253 6./1,883 4./74 4./236 1./51 9./249 6./698
Total 167./ 2,764
119/ 6,293
148/ 3,667
93/1,343 93/2,527 105/2,408 188/4,888
Total = 913/23,891
A-2.2 Figure 2.5.1: Thailand’s Import Product Unit : Million Bath Year Total Products
Mineral &Fuel
Capital Raw Material
Automobile Other
1990 852,981.5 79,153.8 330,893.8 304,131.5 59,100.9 19,827.1
1991 959,408.0 88,679.3 379,193.3 351,410.4 51,489.7 21,458.4
1992 1,033,244.7 84,734.9 418,035.6 360,408.7 63,249.5 24,529.7
1993 1,170,846.4 87,519.0 493,535.6 380,480.0 88,884.4 28,775.0
1994 1,369,260.4 93,136.2 603,381.1 435,732.1 102,354.9 19,509.6
1995 1,763,591.3 119,077.0 787,782.3 561,190.6 131,343.0 21,658.0
1996 1,832,825.2 160,587.8 832,156.6 530,144.9 123,255.1 35,632.9
1997 1,924,263.1 178,285.3 925,832.2 552,466.5 67,319.5 39,611.1
1998 1,774,066.4 142,117.3 886,530.2 535,801.2 18,896.4 36,195.1
1999 1,907,390.6 183,433.5 901,536.4 574,307.2 50,443.4 37,957.1
2000 (Jun.-July.)
1,306,962.1 149,826.7 594,257.5 399,108.0 43,947.3 14,443.8

250
Figure 2.6.1 Net foreign Investment Flow in the Thai Electrical/Electronic Sector Classified according to Country
Country 1993 1994 1995 Japan 7.3102 7.0408 12.455 Hong Kong 4.3202 6.3638 6.3432 Taiwan 1.2394 2.2202 2.5798 USA 5.0885 3.5217 6.3321 Europe 3.5678 2.4180 3.0248 ASEAN 1.0166 1.5979 4.0936 Others 9.8363 5.6686 9.8255
Total 34.915 31.3680 47.192 A-2.4 Table 2.12.1: Trade Balance of Thai Electrical/Electronics Products
(Unit : Million Baht)
Year Export Import Net Profit
1995 433,079.9 410,316.2 22,763.7
1996 487,266.8 428,527.6 58,739.2
1997 601,151.4 518,082.2 82,024
1998 791,462.1 555,127.4 236,334.7
1999 798,780.7 548,244.6 250,536.1
A-2.5 Table 2.12.1: Trade Balance of Thai Agriculture Manufacturing Industry Products
(Unit : Million Baht)
Year Export 1995 794,880.90 1996 667,383.70 1997 806,782.30 1998 987,123.60 1999 941,752.30
A-2.6 Table 2.11.1 Comparison of Trade Balance Figures for Thai Export
Products (Unit : Million Baht)
Year Farm Agriculture Manufacturing
Industrial
Electrical/ Electronic Industry
1995 231,416.7 794,880.90 433,079.9
1996 230,658.8 667,383.70 487,266.8
1997 257,562.2 806,782.30 601,151.4
1998 304,424.5 987,123.60 791,462.1
1999 266,644.8 941,752.30 798,780.7

251
Appendix B
Output and Value Added by Thai Manufacturing Industry
B-1. Table Gross Output and Value Added by Industry Sector
Source : Report of The 1997 Industrial census whole Kingdom, National statistical office Total Value added = Value of gross output – Intermediate consumption Value of gross out put = Sale of goods produced, Receipts of good of resale, Receipts from contract and commission work, Receipts from sales of repair and maintenance, Receipts from rent on building vehicle machinery and equipment, other and Change in value of stock of work in progress, finished goods and goods for Resale.

252
Appendix C
Pilot Questionnaire
Survey on Thai Food Processing Industry University of Wollongong
Faculty of Engineering
1. ขอมลูทัว่ไป (General Information) ปท่ีเริ่มทาํการ :……………………………………………..
(Year of Factory Establishment) 1.1 ทุนจดทะเบียน ………………………………… บาท
(Registered capital) 1.2 รายไดเฉลี่ยตอป : ……………………………….บาท/ป
(Average Capital income) 1.3 ประเภทของธุรกิจType of Business
( ) เจาของกิจการ (Single proprietorship) ( ) หางหุนสวน (Partnership) ( ) หางหุนสวนจํากัด (Limited partnership) ( ) บริษัท (Company Limited) ( ) อ่ืนๆ (Others Identify)
1.4 ประเภทของโรงงาน (Type of products manufactured ) 1.……………………………………………………………………………… 2.………………………………………………………………………………
3.……………………………………………………………………………… 4.………………………………………………………………………………
1.5 ในระยะชวงเวลา 3 ปท่ีผานมา ผลติภัณฑอะไร คือ ผลิตภัณฑหลักของบริษัททาน
จํานนวนกี่เปอรเซ็นต? (What have been your company’s main products during the past 3 years in terms of production volume? ( % if possible )) …………………………………………………………………………………………………………………………………………………………………………………………………….
1.6 ผลิตภัณฑ อะไร ที่เปนผลติภัณฑท่ีใหผลกําไรแกบริษัททานมากที่สุดในชวงระยะเวลา 3 ป ? (What have been your company ‘s main products during the past 3 years in terms of profits? ( % if possible)) ………………………………………………………………………………………
2 ขอมลูของพนกังาน (Employees) 2.1 จํานวนของพนักงาน (Number of employees) เพศชาย(Male) เพศหญิง(Female) รวมทั้งหมด(Total)
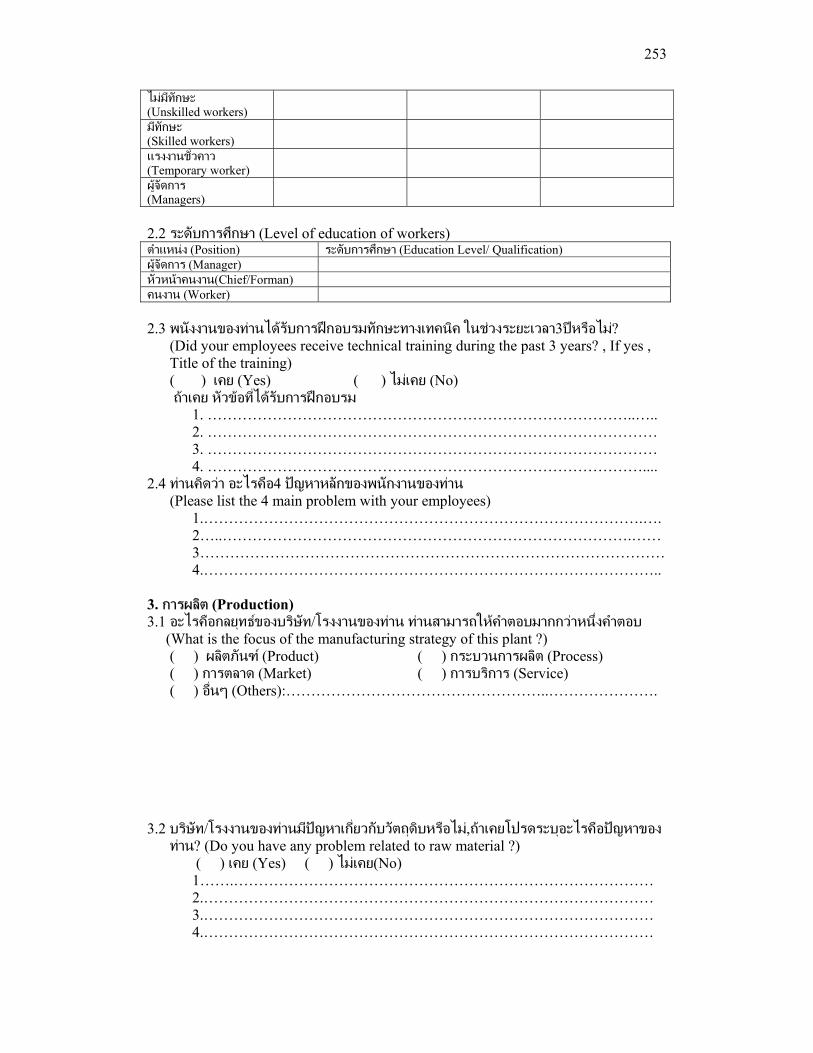
253
ไมมีทักษะ (Unskilled workers)
มีทักษะ (Skilled workers)
แรงงานชั่วคาว (Temporary worker)
ผูจัดการ (Managers)
2.2 ระดับการศึกษา (Level of education of workers) ตําแหนง (Position) ระดับการศึกษา (Education Level/ Qualification) ผูจัดการ (Manager) หัวหนาคนงาน(Chief/Forman) คนงาน (Worker) 2.3 พนังงานของทานไดรับการฝกอบรมทักษะทางเทคนิค ในชวงระยะเวลา3ปหรือไม?
(Did your employees receive technical training during the past 3 years? , If yes , Title of the training) ( ) เคย (Yes) ( ) ไมเคย (No)
ถาเคย หัวขอที่ไดรับการฝกอบรม 1. …………………………………………………………………………..…..
2. ……………………………………………………………………………… 3. ………………………………………………………………………………
4. …………………………………………………………………………….... 2.4 ทานคิดวา อะไรคือ4 ปญหาหลักของพนักงานของทาน
(Please list the 4 main problem with your employees) 1.…………………………………………………………………………….….
2…..……………………………………………………………………….…… 3…………………………………………………………………………………
4.……………………………………………………………………………….. 3. การผลติ (Production) 3.1 อะไรคือกลยุทธของบริษัท/โรงงานของทาน ทานสามารถใหคําตอบมากกวาหนึ่งคําตอบ (What is the focus of the manufacturing strategy of this plant ?) ( ) ผลติภันฑ (Product) ( ) กระบวนการผลิต (Process) ( ) การตลาด (Market) ( ) การบริการ (Service) ( ) อ่ืนๆ (Others):……………………………………………..…………………. 3.2 บริษัท/โรงงานของทานมีปญหาเกี่ยวกับวัตถุดิบหรอืไม,ถาเคยโปรดระบุอะไรคือปญหาของ ทาน? (Do you have any problem related to raw material ?)
( ) เคย (Yes) ( ) ไมเคย(No) 1…….………………………………………………………………………… 2.……………………………………………………………………………… 3.……………………………………………………………………………… 4.………………………………………………………………………………

254
3.3 บริษัท/โรงงานของทาน เคยใชระบบปฎิบัติการตอไปน้ีหรือไม ? (Does your factory practice any of the following?) ใช (Yes ) ไมใช (No) 5 S ( ) ( ) Kaizen ( ) ( ) Total Quality Management (TQM) ( ) ( ) Just In Time (JIT) ( ) ( ) Total Productive Maintenance (TPM) ( ) ( ) ISO 9000 ( ) ( ) อ่ืนๆ (Other),…………………………………………………………..…………………… 3.4 บริษัท/โรงงานของทานมีการทดสอบคุณภาพผลติภันฑขั้นสุดทายหรือไม?, ถามีกรุณาระบุ ระบบอะไรที่ทานใช (Does your factory test finished product quality, If yes, How ?) ( ) มี (Yes) ( ) ไมมี (No)
1.……………………………………………………………………………….…
2. …………………………………………………………………………………. 3. …………………………………………………………………………………. 4. …………………………………………………………………………………. 3.5 บริษัท/โรงานของทานมีปญหาเรื่องคุณภาพของสินคาหรือไม ถามีอะไรคือปญหาของทาน?
(Do you have any problems with product quality?, If yes, What is the Major problem)
( ) มี (Yes) , ………………………………. ( ) ไมมี (No)
3.6 ทานมีโครงการที่จะปรับปรุงคุณภาพของสินคาหรือไม ถามีอะไรคือส่ิงที่ทาจะปรับปรุง (Do you have any plans to improve product quality?, If yes, How?) ( ) มี (Yes) ( ) ไมมี (No) ( ) เทคโนโลยีการผลิต (production techniques), ( ) เครื่องจักรและอุปกรณ(machine or equipment) ( ) การออกแบบ (design) ( ) อ่ืนๆ (Others) : …………………………………………………….……. 3.7 เครื่องจักรที่สําคัญท่ีใชในกระบวนการผลติในโรงงานของทาน (Main production machinery) ประเภทของเครื่องจักร(Type of
machine)
จํานวน (Number
of machines)
ซื้อเครื่องใหม(Bought new)
ซื้อเครื่องท่ีใชแลว(Bought Second hand)
อายุการใชงาน(ป)
(Present age of
machine)
กําลังการผลิต (Size of
machine)
ประเทศผูผลิต (Country of
origin)
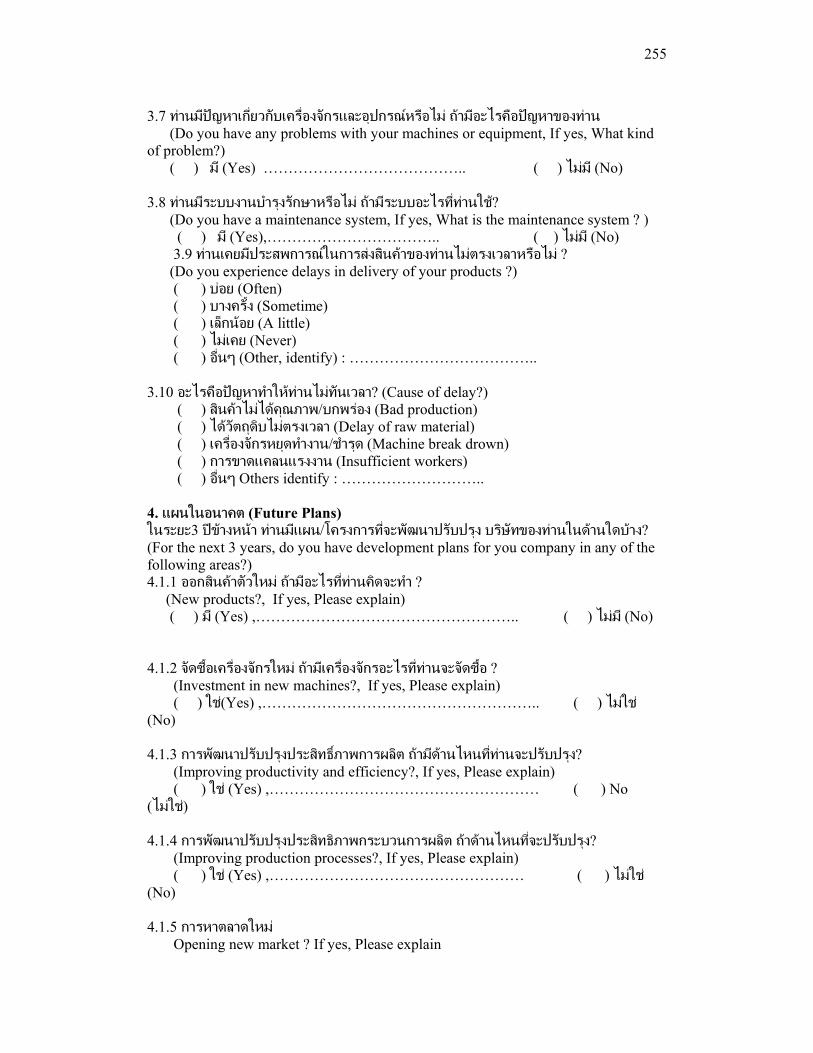
255
3.7 ทานมีปญหาเก่ียวกับเครื่องจักรและอุปกรณหรือไม ถามีอะไรคือปญหาของทาน (Do you have any problems with your machines or equipment, If yes, What kind of problem?) ( ) มี (Yes) ………………………………….. ( ) ไมมี (No) 3.8 ทานมีระบบงานบํารุงรกัษาหรือไม ถามีระบบอะไรที่ทานใช? (Do you have a maintenance system, If yes, What is the maintenance system ? ) ( ) มี (Yes),…………………………….. ( ) ไมมี (No) 3.9 ทานเคยมีประสพการณในการสงสินคาของทานไมตรงเวลาหรือไม ? (Do you experience delays in delivery of your products ?) ( ) บอย (Often) ( ) บางครั้ง (Sometime) ( ) เล็กนอย (A little) ( ) ไมเคย (Never) ( ) อ่ืนๆ (Other, identify) : ……………………………….. 3.10 อะไรคือปญหาทําใหทานไมทันเวลา? (Cause of delay?) ( ) สินคาไมไดคุณภาพ/บกพรอง (Bad production) ( ) ไดวัตถดุิบไมตรงเวลา (Delay of raw material) ( ) เครื่องจักรหยุดทํางาน/ชํารุด (Machine break drown) ( ) การขาดแคลนแรงงาน (Insufficient workers) ( ) อ่ืนๆ Others identify : ……………………….. 4. แผนในอนาคต (Future Plans) ในระยะ3 ปขางหนา ทานมีแผน/โครงการที่จะพัฒนาปรับปรุง บริษัทของทานในดานใดบาง? (For the next 3 years, do you have development plans for you company in any of the following areas?) 4.1.1 ออกสินคาตัวใหม ถามีอะไรที่ทานคิดจะทํา ? (New products?, If yes, Please explain) ( ) มี (Yes) ,…………………………………………….. ( ) ไมมี (No) 4.1.2 จัดซื้อเครื่องจักรใหม ถามีเครื่องจักรอะไรที่ทานจะจัดซื้อ ? (Investment in new machines?, If yes, Please explain) ( ) ใช(Yes) ,……………………………………………….. ( ) ไมใช (No) 4.1.3 การพฒันาปรับปรุงประสิทธ์ิภาพการผลิต ถามดีานไหนที่ทานจะปรับปรุง? (Improving productivity and efficiency?, If yes, Please explain) ( ) ใช (Yes) ,……………………………………………… ( ) No (ไมใช) 4.1.4 การพฒันาปรับปรุงประสิทธิภาพกระบวนการผลิต ถาดานไหนที่จะปรับปรุง? (Improving production processes?, If yes, Please explain) ( ) ใช (Yes) ,…………………………………………… ( ) ไมใช (No) 4.1.5 การหาตลาดใหม Opening new market ? If yes, Please explain

256
( ) ใชYes ,………………………………………………….. ( ) ไมใช No 4.2 อะไรคือส่ิงที่คิดวาเปนภยัคุกครามตอบริษัทของทานในระยะ3ปขางหนา? (What do you see as the major threats to your company over the next 3 years?)
1. ………………………………………………………………………………… 2. ………………………………………………………………………………… 3. ………………………………………………………………………………… 4. …………………………………………………………………………………
4.3 ทานจะพฒันาอยางไรที่จะทําใหบริษัทของทานดีขึ้นในชวงระยะเวลา3ปขางหนา? (How could your company’s performance to improved over the next 3 years ?)
1.…………………………………………………………………………………… 2. ………………………………………………………………………………… 3. …………………………………………………………………………………
Thank you for your cooperation

257
Appendix D
Main Thai food processing industry Survey University of Wollongong
Faculty of Engineering
1. General information This section attempts to position your company with respect to number of employees, turnover, production and characteristic of management system etc.
1.1 How many employees do you have in this company? (Please tick one)
( ) Less than 20 ( ) Between 20-49 ( ) Between 50-99 ( ) Between 100-199 ( ) Between 200-499 ( ) Greater than 500
1.2 What is the approximate annual turnover of this company? (Please tick one) ( ) Less than 10 million Baht ( ) Between 10-50 million Baht ( ) Between 50-100 million Baht ( ) 100-500 million Baht ( ) Over 500 million Baht
1.3 How many products are produced in this company? (Please tick one) ( ) 3 or less products ( ) 4-10 products ( ) 11-30 products ( ) more than 30 products
1.4 What are the characteristics of the organization structure in your company? (Please tick box)
Organization structures Some Very much 1. Are there any self controlling groups in the
production area
2. Is there any matrix structure including sales, marketing, design and production development in new production
3. Is there any matrix structure including production and maintenance in problem solving
4. Are there any cross functional groups for problem solving

258
1.5 Listed below are some typical management characteristics, which of these apply to your company? If yes indicate, how they are implemented. (Please tick box)
1 = informal 2 = formal, depending on person 3 = formal, responsibility of group
Management characteristics Management characteristics 1 2 3
strategic planning system Strategy development quality assurance system education and training system sales forecasting system cost accounting system performance evaluation system project planning system maintenance system
1.6 What are the efforts in carrying out the following activities? (Please tick one box per activity)
Activities None Some A lot training and education of employees development of individual initiatives empowering of employees participation in problem solving empowering employees decision making instilling quality consciousness in employees encouraging the internal customer concept improving work environment and safety encouraging job rotation establishing individual performance communicating common organizational goals across functions
providing assistance to suppliers in problem solving
1.7 This question aims to establish the degree of automation used in your factory now, ie the proportion of activities carried out by machines as against people. Please estimate the ratio of automatic operations to manual operations in your factory for both "value-adding" (eg cutting up fruit or meat) and "non-value-adding" (eg transport, which does not add value to the product) activities:
All manual 0 :100 25:75 50:50 75:25 All automation
100:0 Value-adding operations Non-Value adding operations
2. Manufacturing strategies This section evaluates your manufacturing strategy in terms of company strategy, quality improvement, marketing, production, human resource and supplier relationship etc. 2.1 What is the type of production approach of this company? (Please tick one)
( ) Project ( ) Batch ( ) Continuous

259
2.2 What is the main market for this company? (Please tick one) ( ) Domestic market only ( ) International market only ( ) Both, percentage of your market (Domestic market : International market) = ……….. : …………. (approximately) Domestic >International = International >=Domestic
2.3 What is the focus of the manufacturing strategies for this company? (Please tick one or more) ( ) Production ( ) Process ( ) Market ( ) Service ( ) Other, specify …………………………………………………………………………………………
2.4 What is the focus of current quality status in this company to win against competitors and what is the priority of its importance? (Please tick box)
Degree of importance: 1 = unimportant 2 = important 3 = very important
Quality status Degree of importance 1 2 3
1. Decreasing defects 2. Research and development of product quality
3. Speeding delivery 4. Reducing cost 5. Quality of work life of employee 6. Improving customer after service
2.5 What is the quality focus that the market expects? (Please tick one or more)
( ) Decreasing defects ( ) Research and developing quality in products ( ) Speeding delivery ( ) Improving customer after service ( ) Quality of work life of employee ( ) Reducing cost ( ) Other, specify………………………………………………………………………………………………
2.6 What quality aspects in this company are used to develop the manufacturing strategies? (Please tick one or more)
( ) Supplier relationship ( ) Process control ( ) Advanced technology ( ) Employee empowerment ( ) Measurement control ( ) Inspection system ( ) Customer relationship ( ) Distribution system ( ) Product service ( ) Maintenance system ( ) Quality system ( ) Quality group activities ( ) Product design ( ) Material control ( ) Equipment management ( ) Research and development units ( ) Management information system ( ) Marketing and selling ( ) Top management commitment ( ) Other, specify ……………………………………………………………………………….
2.7 According to market, how do your manufacturing strategies stand in the competitive environment? (Please tick one)
( ) Excellent ( ) Good ( ) Average ( ) Bad ( ) Worst
2.8 Does this company use other companies as a benchmark for developing the manufacturing strategies? (Please tick one)
( ) No, go to 2.10 ( ) Benchmark, but no use for developing manufacturing strategies. ( ) Benchmark, and use for developing manufacturing strategies.

260
2.9 If your company uses an external benchmark, which type of companies? (Please tick one or more)
( ) Competitors ( ) Excellent company in Thailand ( ) World class manufacturing company ( ) Subsidiary company ( ) Other, pecify ………………………………………………………………………………
2.10 Please estimate the level of business performance of this company compared with competitors for the last 3 years? (Please tick one box for each business performance aspect)
1 = Among the best 2 = Average 3 = Below average 4 = Among the worst 5= Not applicable
Business performance Level
1 2 3 4 5
1) Level of overall quality
2) Level of productivity
3) Level of delivery performance
4) Level of manufacturing cost
5) Level of flexibility
6) Level of overall company reputation
7) Level of product image
8) Level of market share
9) Level of advanced technology
10) Level of continuous improvement activities
11) Level of research & development product
12) Level of human resource development
2.11 In which areas from 2.10 does your company expect to outperform competitors? (Please tick one or more)
( ) overall quality ( ) productivity ( ) delivery performance ( ) manufacturing cost ( ) flexibility ( ) overall company reputation ( ) product image ( ) market share ( ) advanced technology ( ) continuous improvement activities ( ) human resource development ( ) research & development product
3. Manufacturing practices This section identifies the manufacturing practices in your company by referring to HACCP (Hazard critical control point), GMP (Good manufacturing practices), JIT (Just in time), TPM (Total productive maintenance) and TQM (Total quality management) practices used to achieve World Class Manufacturing.

261
3.1 How familiar are you with these 5 manufacturing practices? (Please tick box)
Manufacturing practice Never heard of
Heard of Familiar understand
Applying it now
GMP: HACCP: JIT: TPM: TQM:
3.2a If your company is using any of these practices NOW, when did you first introduce them? (Please tick box)
Manufacturing practice/Year 2002 2001 2000 Earlier (state) GMP HACCP JIT TPM TQM
3.2b What percentage of benefit has this had on your company performance? (Please tick one for each section of benefit)
Section of benefit None 0 – 25% 25- 50% 50-75% 75-100 %
Financial Marketing
Staff Safety
Production
3.3 What practice needs immediate or future implementation in your company? (Please tick in box)
1 Yes, implementing 2= No, but have future plan 3 = No, without future plan If you have a future plan, please indicate when it will be implementation
Factory practice Current implementation
Future plan
1 2 3 Next year
Next 2 years
More than 2 year
GMP
HACCP
JIT
TPM
TQM
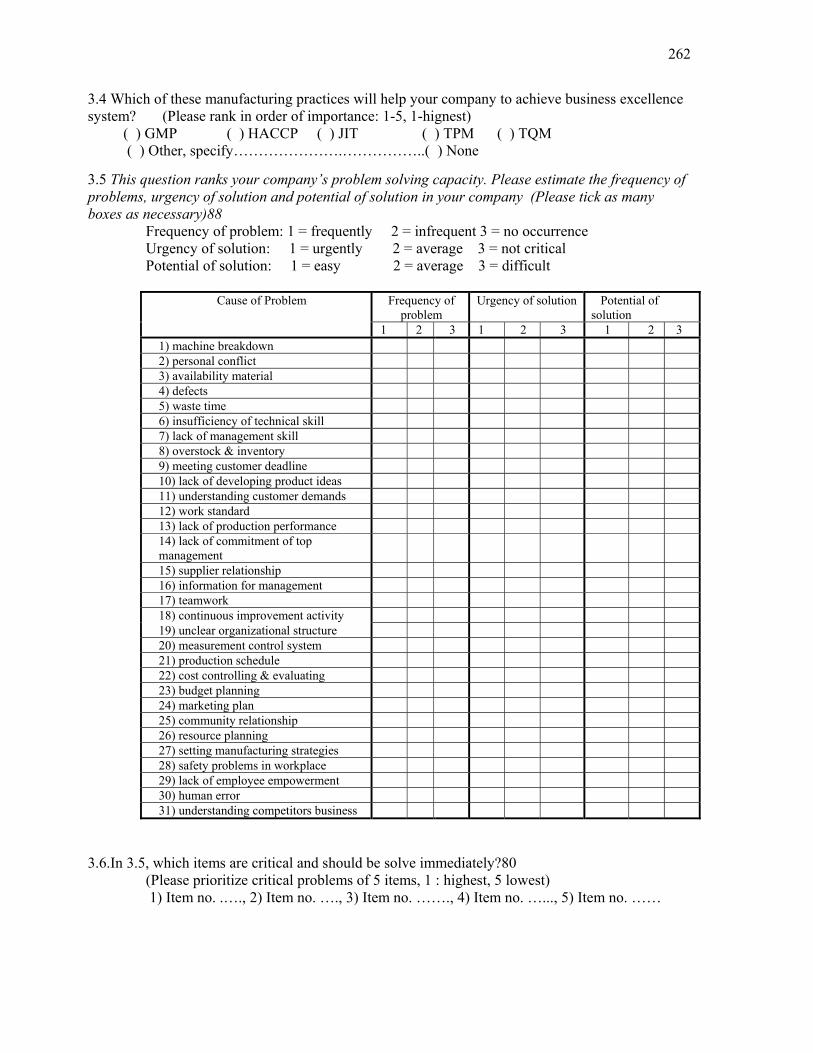
262
3.4 Which of these manufacturing practices will help your company to achieve business excellence system? (Please rank in order of importance: 1-5, 1-hignest)
( ) GMP ( ) HACCP ( ) JIT ( ) TPM ( ) TQM ( ) Other, specify………………….……………..( ) None
3.5 This question ranks your company’s problem solving capacity. Please estimate the frequency of problems, urgency of solution and potential of solution in your company (Please tick as many boxes as necessary)88
Frequency of problem: 1 = frequently 2 = infrequent 3 = no occurrence Urgency of solution: 1 = urgently 2 = average 3 = not critical Potential of solution: 1 = easy 2 = average 3 = difficult
Cause of Problem Frequency of problem
Urgency of solution Potential of solution
1 2 3 1 2 3 1 2 3 1) machine breakdown 2) personal conflict 3) availability material 4) defects 5) waste time 6) insufficiency of technical skill 7) lack of management skill 8) overstock & inventory 9) meeting customer deadline 10) lack of developing product ideas 11) understanding customer demands 12) work standard 13) lack of production performance 14) lack of commitment of top management
15) supplier relationship 16) information for management 17) teamwork 18) continuous improvement activity 19) unclear organizational structure 20) measurement control system 21) production schedule 22) cost controlling & evaluating 23) budget planning 24) marketing plan 25) community relationship 26) resource planning 27) setting manufacturing strategies 28) safety problems in workplace 29) lack of employee empowerment 30) human error 31) understanding competitors business
3.6.In 3.5, which items are critical and should be solve immediately?80 (Please prioritize critical problems of 5 items, 1 : highest, 5 lowest)
1) Item no. .…., 2) Item no. …., 3) Item no. ……., 4) Item no. …..., 5) Item no. ……

263
3.7 Which improvement tools does your company expect to use to solve your problems? (Please indicate degree of importance for those to be used, tick as many boxes as necessary) Degree of importance: 1 = Unimportant 2 = important 3 = very important
Items Degree of importance
1 2 3 Basic 7 tools SPC PDCP cycle Brainstorming Effective meeting Human resources development Multi-skilled employees Small group improvement activities Personnel management Motivation Conflict management Supplier quality certification Reduction of number of suppliers and distance Supplier long-term contracts Total supplier evaluation 5S & housekeeping Database and information management Plant layout Daily management Facilities Project management Standardization of parts, products and processes Cross functional management Policy deployment Benchmarking Suggestion system Calibration Measurement equipment control Production control Equipment management Preventive maintenance Material control Process control Packaging and storage Waste management Pest control Transport control Document control Quality Records Quality audit Hazard analysis
Items Degree of

264
importance 1 2 3 Loss control and safety management Environmental control Poka-yoke Personnel Hygiene Inspection and testing product Product recall Product instruction to consumer QCC
3.8 In order to achieve best practice, companies may need to use the practices in 3.1. How would your company adapt GMP, HACCP, TPM, JIT and TQM practices? (Please tick one)
( ) Implement each practice individually ( ) Combination of GMP,HACCP,TQM and TPM without JIT (GO TO 3.9) ( ) Integrated all of these practice GMP HACCP, TPM, JIT, and TQM ( ) Other, specify…………………………………………………………………………………………
3.9 If you should combination of GMP, HACCP, TQM and TPM with out JIT, Do you think If take TPM out from the model will get for the model?
( ) yes ( ) No
3.10f you are implementing GMP, HACCP, JIT, TQM and TPM, what is the main motivation for this? (Please tick one or more)
( ) Customer requirement ( ) Company policy ( ) Government requirement ( ) Competitive market ( ) Not applicable ( ) Other ,specify… ……………
3.11 What are the practices that your customers expect in your company? (Please tick one or more) ( ) Final inspection before delivery to customer ( ) Quality assurance, GM ( ) Quality assurance, HACCP ( ) Just-In-Time system, JIT ( ) Total productive maintenance, TPM ( ) Total quality management, TQM ( ) Other, specify…………………………………………………………………………
3.12 Is your company implement JIT, If Yes go to Question 3.13, If No please indicate, what limits its implementation ? (Please tick one or more)
( ) No knowledge of this system( ) Production system( ) Top management commitment ( ) Employee involvement( ) Inventory control ( ) Forecasting customer demand ( ) Waste elimination technique ( ) Small lot size focus ( ) Supplier participation ( ) Education and training ( ) Advanced technology ( ) Expensive to implementation ( ) Other, specify………………………………………………… ( ) None
3.13 your company implement TPM, If YES go to Question 3.14, If NO please indicate, what factors limit TPM in your company? (Please tick one or more)

265
( ) No knowledge of this system ( ) Low potential of employees ( ) Lack of equipment management ( ) Lack of maintenance system ( ) No time to do maintenance activities ( ) Obsolete machinery ( ) No education and training ( ) Bad plant layout ( ) None ( ) No responsibilities for employees to do maintenance by themselves ( ) Other, specify……………………………………………………………………. ( ) None
3.14a What does your company expect from TPM practice? (Please tick one or more)
( ) Reduce hazards in processing ( ) Reduce manufacturing cost ( ) Reduce maintenance cost ( ) Reduce defects ( ) Reduce lead time ( ) Reduce set up time ( ) Reduce delivery time ( ) Increase equipment performance ( ) Continuous improvement activity ( ) Increase employee performance ( ) Employee empowerment ( ) Increase company reputation ( ) Other, specify…………………………………………………………………………… ( ) None
3.14 b Do you think TPM technique from 3.14a support HACCP and GMP practice? ( ) Yes ( ) NO
3.15 In your company, do any of the “barriers” listed below prevent you to achieve world class manufacturing? (Please tick one or more and describe the nature of the barriers)
( ) Money, …………………………………………………………………………………….. ( ) Organization (size, structure), …………………………….………………………………. ( ) Inside communication, ……………………………………………………………………. ( ) Employees, …………………………………………………………………………...……. ( ) Management system, ……………………………………………………………………… ( ) Information management, ………………………………………………………………… ( ) Management level, ……………………………………………………………………… ( ) Maintenance system, ………………………………………….………………………… ( ) Quality system, ………………………………………………………………….…… ( ) Customer contract, ………………………………………….………………………… ( ) Production system, ……………………………………………………………………. ( ) Technology, …………………………………………………………………………… ( ) Research and development unit, ……………………………………………………… ( ) Suppliers, ………………………………………………………… ………………….. ( ) From external factors, ……………………………………..…………………………… ( ) Other, specify …………………………………………….…………………………… ( ) None
4. Benefits
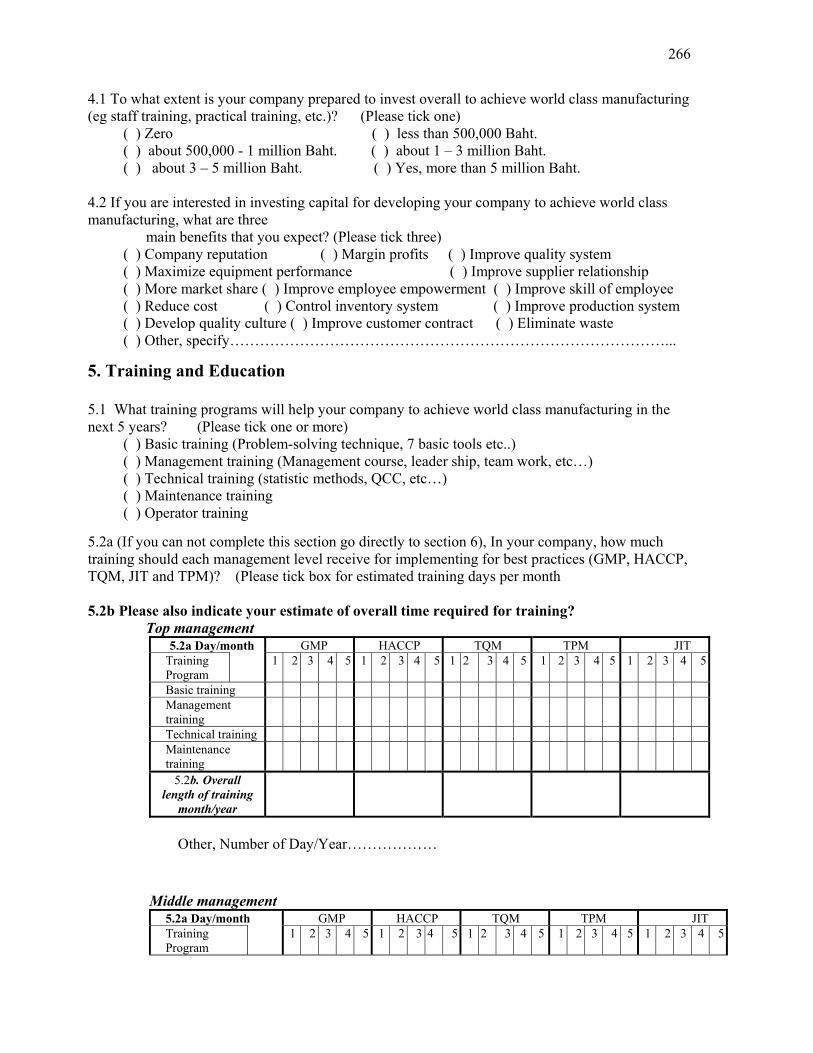
266
4.1 To what extent is your company prepared to invest overall to achieve world class manufacturing (eg staff training, practical training, etc.)? (Please tick one)
( ) Zero ( ) less than 500,000 Baht. ( ) about 500,000 - 1 million Baht. ( ) about 1 – 3 million Baht. ( ) about 3 – 5 million Baht. ( ) Yes, more than 5 million Baht.
4.2 If you are interested in investing capital for developing your company to achieve world class manufacturing, what are three
main benefits that you expect? (Please tick three) ( ) Company reputation ( ) Margin profits ( ) Improve quality system ( ) Maximize equipment performance ( ) Improve supplier relationship ( ) More market share ( ) Improve employee empowerment ( ) Improve skill of employee ( ) Reduce cost ( ) Control inventory system ( ) Improve production system ( ) Develop quality culture ( ) Improve customer contract ( ) Eliminate waste ( ) Other, specify……………………………………………………………………………...
5. Training and Education 5.1 What training programs will help your company to achieve world class manufacturing in the next 5 years? (Please tick one or more)
( ) Basic training (Problem-solving technique, 7 basic tools etc..) ( ) Management training (Management course, leader ship, team work, etc…) ( ) Technical training (statistic methods, QCC, etc…) ( ) Maintenance training ( ) Operator training
5.2a (If you can not complete this section go directly to section 6), In your company, how much training should each management level receive for implementing for best practices (GMP, HACCP, TQM, JIT and TPM)? (Please tick box for estimated training days per month 5.2b Please also indicate your estimate of overall time required for training?
Top management 5.2a Day/month GMP HACCP TQM TPM JIT
Training Program
1 2 3 4 5 1 2 3 4 5 1 2 3 4 5 1 2 3 4 5 1 2 3 4 5
Basic training Management training Technical training Maintenance training
5.2b. Overall length of training
month/year
Other, Number of Day/Year………………
Middle management 5.2a Day/month GMP HACCP TQM TPM JIT Training Program
1 2 3 4 5 1 2 3 4 5 1 2 3 4 5 1 2 3 4 5 1 2 3 4 5

267
Basic training Management training Technical training Maintenance training
5.2b. Overall length of training month/year
Other, Number of Day/Year………………
Engineers 5.2a Day/month GMP HACCP TQM TPM JIT Training Program
1 2 3 4 5 1 2 3 4 5 1 2 3 4 5 1 2 3 4 5 1 2 3 4 5
Basic training Management training Technical training Maintenance training
5.2b Overall length of training month/year
Other, Number of Day/Year………………
Supervisors 5.2a Day/month GMP HACCP TQM TPM JIT Training Program
1 2 3 4 5 1 2 3 4 5 1 2 3 4 5 1 2 3 4 5 1 2 3 4 5
Basic training Management training Technical training Maintenance training
5.2b Overall length of training month/year
Other, Number of Day/Year………………
Front line operators 5.2a Day/month GMP HACCP TQM TPM JIT Training Program
1 2 3 4 5 1 2 3 4 5 1 2 3 4 5 1 2 3 4 5 1 2 3 4 5
Basic training

268
Management training Technical training Maintenance training
5.2b Overall length of training month/year
Other, Number of Day/Year………………
6. Interest in research findings 6.1 Are you interested in obtaining the results of the study? (Please tick one)
( ) Yes ( ) No
6.2 Would your company be prepared to be included in the case study by personal visit/interview in your company? (Please tick one)
( ) Yes ( ) No
6.3 How much time did you take to complete this questionnaire? (Please tick one) ( ) 30 minutes ( ) 30 - 60 minutes ( ) 60- 120 minutes ( ) more than 120 minutes
Please return this survey by 1 November 2003 To Chaitamlong Pongpattanasili Department of Industrial Engineering,
Faculty of Engineering, Naresuan University Phitsanulok, 65000, Thailand Phone : Fax :
******** Thank you for your cooperation ********
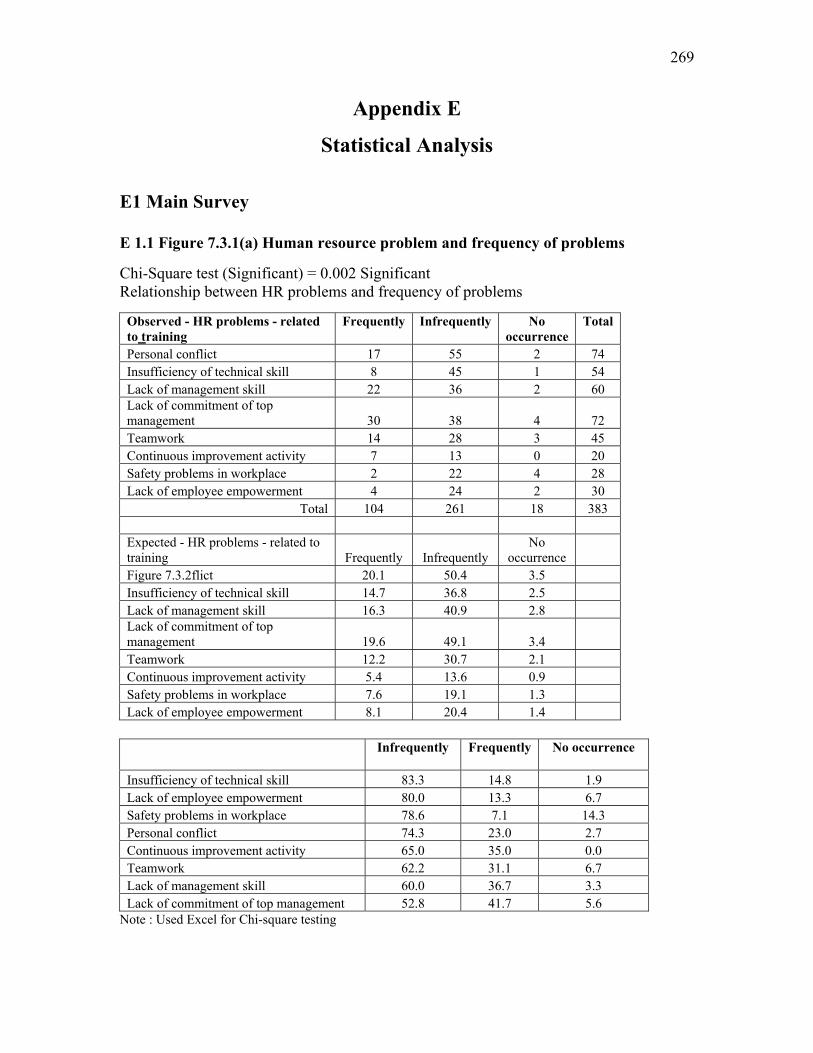
269
Appendix E
Statistical Analysis E1 Main Survey E 1.1 Figure 7.3.1(a) Human resource problem and frequency of problems Chi-Square test (Significant) = 0.002 Significant Relationship between HR problems and frequency of problems
Observed - HR problems - related to training
Frequently
Infrequently
No occurrence
Total
Personal conflict 17 55 2 74 Insufficiency of technical skill 8 45 1 54 Lack of management skill 22 36 2 60 Lack of commitment of top management 30 38 4 72 Teamwork 14 28 3 45 Continuous improvement activity 7 13 0 20 Safety problems in workplace 2 22 4 28 Lack of employee empowerment 4 24 2 30
Total 104 261 18 383 Expected - HR problems - related to training Frequently Infrequently
No occurrence
Figure 7.3.2flict 20.1 50.4 3.5 Insufficiency of technical skill 14.7 36.8 2.5 Lack of management skill 16.3 40.9 2.8 Lack of commitment of top management 19.6 49.1 3.4 Teamwork 12.2 30.7 2.1 Continuous improvement activity 5.4 13.6 0.9 Safety problems in workplace 7.6 19.1 1.3 Lack of employee empowerment 8.1 20.4 1.4
Infrequently
Frequently
No occurrence
Insufficiency of technical skill 83.3 14.8 1.9 Lack of employee empowerment 80.0 13.3 6.7 Safety problems in workplace 78.6 7.1 14.3 Personal conflict 74.3 23.0 2.7 Continuous improvement activity 65.0 35.0 0.0 Teamwork 62.2 31.1 6.7 Lack of management skill 60.0 36.7 3.3 Lack of commitment of top management 52.8 41.7 5.6
Note : Used Excel for Chi-square testing

270
E1.2 Figure 7.3.2 Human resource problems and urgency of problems Chi-Square test (Significant) = 0.0001 Significant Relationship between HR problems and urgency of problems
Observed - HR problems - related to training
Urgency
Average
Not critical
Total
Personal conflict 70 2 2 74 Insufficiency of technical skill 42 11 1 54 Lack of management skill 36 22 2 60 Lack of commitment of top management 64 4 0 68 Teamwork 26 4 0 30 Continuous improvement activity 12 6 0 18 Safety problems in workplace 20 2 0 22 Lack of employee empowerment 18 5 0 23 Human error 24 6 0 30
total 312 62 5 379
Expected - HR problems - related to training
Urgency
Average
Not critical
Personal conflict 60.9 12.1 1.0 Insufficiency of technical skill 44.5 8.8 0.7 Lack of management skill 49.4 9.8 0.8 Lack of commitment of top management 56.0 11.1 0.9 Teamwork 24.7 4.9 0.4 Continuous improvement activity 14.8 2.9 0.2 Safety problems in workplace 18.1 3.6 0.3 Lack of employee empowerment 18.9 3.8 0.3 Human error 25 5 0.4
Urgency Average Not critical Personal conflict 94.6 2.7 2.7 Lack of commitment of top management 94.1 5.9 0.0 Safety problems in workplace 90.9 9.1 0.0 Teamwork 86.7 13.3 0.0 Human error 80.0 20.0 0.0 Lack of employee empowerment 78.3 21.7 0.0 Insufficiency of technical skill 77.8 20.4 1.9 Continuous improvement activity 66.7 33.3 0.0 Lack of management skill 60.0 36.7 3.3
E1.3 Figure 7.3.2(a) Quality problem and frequency of quality problem

271
Chi-Square test (Significant) = 0.000 Significant Relationship between quality problems and frequency of problems
Observed - Quality problems Frequently
Infrequently
No occurrence
Total
Defects 10 37 4 51 Machine breakdown 18 42 1 61 Availability of material 28 39 0 67 Meeting customer deadline 6 28 4 38 Waste time 8 32 2 42 Lack of production performance (productivity) 4 12 9 25
total 74 190 20 284
Expected - Quality problems Frequently
Infrequently
No occurrence
Defects 13.3 34.1 3.6 Machine breakdown 15.9 40.8 4.3 Availability of material 17.5 44.8 4.7 Meeting customer deadline 9.9 25.4 2.7 Waste time 10.9 28.1 3.0 Lack of production performance (productivity) 6.5 16.7 1.8
Infrequently
Frequently
No occurrence
Waste time 76.2 19.0 4.8 Meeting customer deadline 73.7 15.8 10.5 Defects 72.5 19.6 7.8 Machine breakdown 68.9 29.5 1.6 Availability of material 58.2 41.8 0.0 Lack of production performance (productivity) 48.0 16.0 36.0
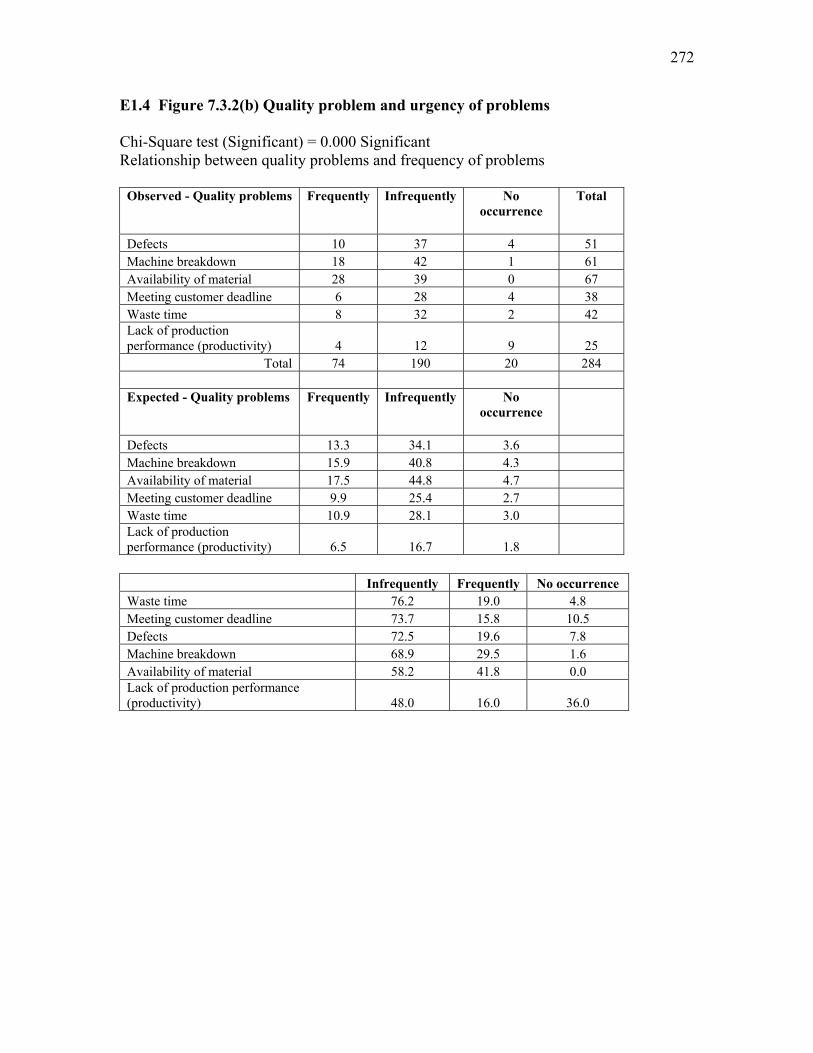
272
E1.4 Figure 7.3.2(b) Quality problem and urgency of problems Chi-Square test (Significant) = 0.000 Significant Relationship between quality problems and frequency of problems
Observed - Quality problems
Frequently
Infrequently
No occurrence
Total
Defects 10 37 4 51 Machine breakdown 18 42 1 61 Availability of material 28 39 0 67 Meeting customer deadline 6 28 4 38 Waste time 8 32 2 42 Lack of production performance (productivity) 4 12 9 25
Total 74 190 20 284 Expected - Quality problems
Frequently
Infrequently
No occurrence
Defects 13.3 34.1 3.6 Machine breakdown 15.9 40.8 4.3 Availability of material 17.5 44.8 4.7 Meeting customer deadline 9.9 25.4 2.7 Waste time 10.9 28.1 3.0 Lack of production performance (productivity) 6.5 16.7 1.8
Infrequently Frequently No occurrence Waste time 76.2 19.0 4.8 Meeting customer deadline 73.7 15.8 10.5 Defects 72.5 19.6 7.8 Machine breakdown 68.9 29.5 1.6 Availability of material 58.2 41.8 0.0 Lack of production performance (productivity) 48.0 16.0 36.0
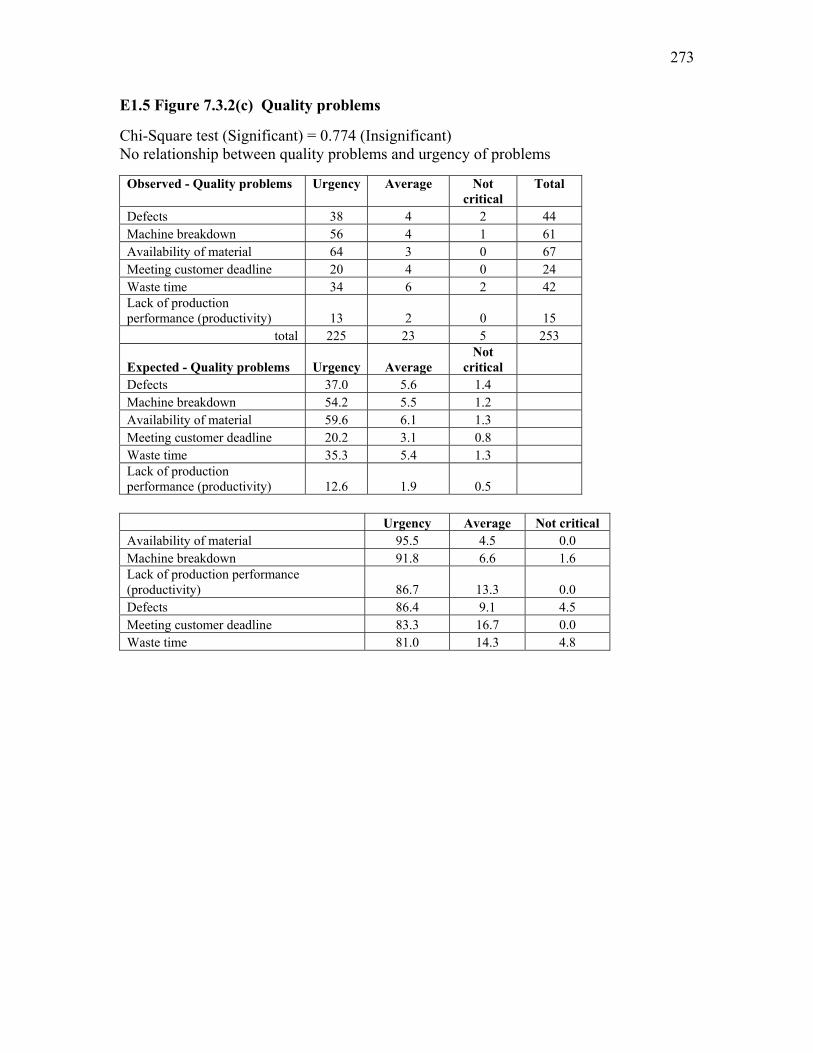
273
E1.5 Figure 7.3.2(c) Quality problems Chi-Square test (Significant) = 0.774 (Insignificant) No relationship between quality problems and urgency of problems
Observed - Quality problems
Urgency
Average
Not critical
Total
Defects 38 4 2 44 Machine breakdown 56 4 1 61 Availability of material 64 3 0 67 Meeting customer deadline 20 4 0 24 Waste time 34 6 2 42 Lack of production performance (productivity) 13 2 0 15
total 225 23 5 253
Expected - Quality problems Urgency Average Not
critical Defects 37.0 5.6 1.4 Machine breakdown 54.2 5.5 1.2 Availability of material 59.6 6.1 1.3 Meeting customer deadline 20.2 3.1 0.8 Waste time 35.3 5.4 1.3 Lack of production performance (productivity) 12.6 1.9 0.5
Urgency Average Not critical Availability of material 95.5 4.5 0.0 Machine breakdown 91.8 6.6 1.6 Lack of production performance (productivity) 86.7 13.3 0.0 Defects 86.4 9.1 4.5 Meeting customer deadline 83.3 16.7 0.0 Waste time 81.0 14.3 4.8

274
E1.6 Figure 7.3.3(a) Basic infrastructure and frequency of problems Chi-Square test (Significant) = 0.0007 Significant Relationship between basic infrastructure problems and frequency of problems
Observed - Basic infrastructure problems
Frequently
Some
No occurrence
Total
Work standard 9 10 3 22 Overstock & inventory 2 40 6 48 Production schedule 12 10 7 29 Cost controlling & evaluating 6 18 2 26 Budget planning 5 27 6 38 Measurement control system 4 14 0 18 Information for management 2 14 3 19 Unclear organization structure 6 14 0 20
total 46 147 27 220
Expected - Basic infrastructure problems
Frequently
Some
No occurrence
Work standard 4.6 14.7 2.7 Overstock & inventory 10.0 32.1 5.9 Production schedule 6.1 19.4 3.6 Cost controlling & evaluating 5.4 17.4 3.2 Budget planning 7.9 25.4 4.7 Measurement control system 3.8 12.0 2.2 Information for management 4.0 12.7 2.3 Unclear organization structure 4.2 13.4 2.5
Some
Frequently
No occurrence
Overstock & inventory 83.3 4.2 12.5 Measurement control system 77.8 22.2 0.0 Information for management 73.7 10.5 15.8 Budget planning 71.1 13.2 15.8 Unclear organization structure 70.0 30.0 0.0 Cost controlling & evaluating 69.2 23.1 7.7 Work standard 45.5 40.9 13.6 Production schedule 34.5 41.4 24.1
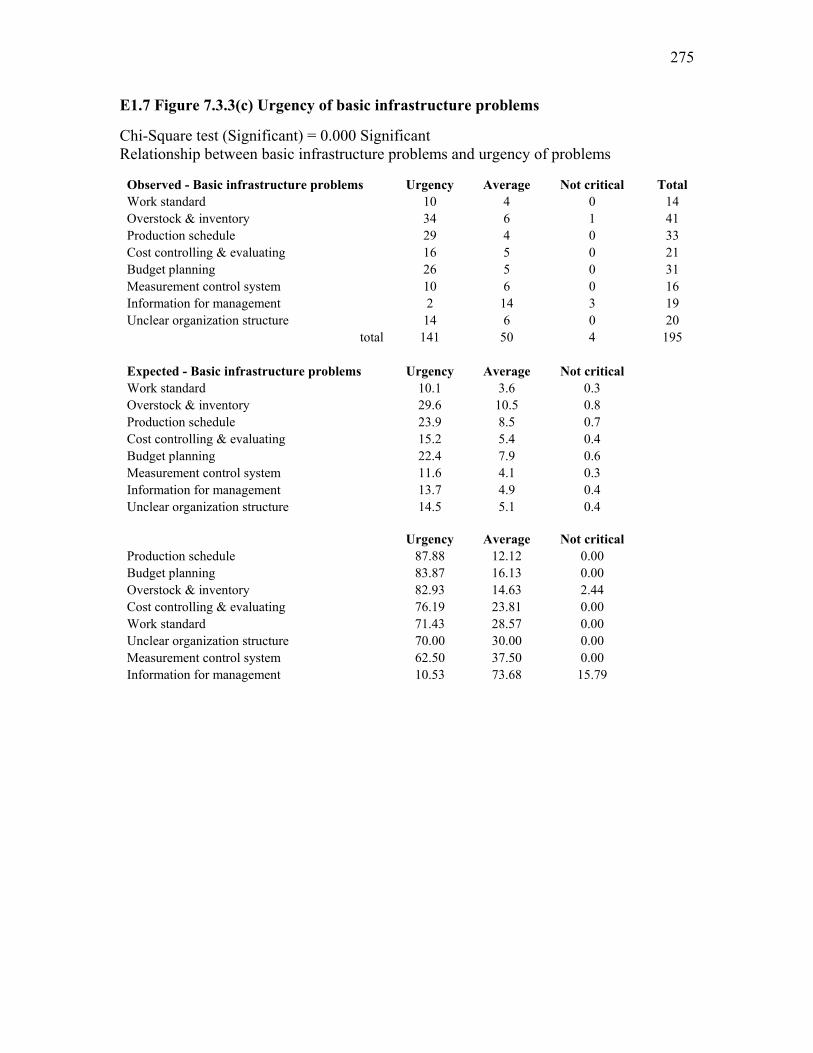
275
E1.7 Figure 7.3.3(c) Urgency of basic infrastructure problems Chi-Square test (Significant) = 0.000 Significant Relationship between basic infrastructure problems and urgency of problems
Observed - Basic infrastructure problems Urgency Average Not critical Total Work standard 10 4 0 14 Overstock & inventory 34 6 1 41 Production schedule 29 4 0 33 Cost controlling & evaluating 16 5 0 21 Budget planning 26 5 0 31 Measurement control system 10 6 0 16 Information for management 2 14 3 19 Unclear organization structure 14 6 0 20
total 141 50 4 195 Expected - Basic infrastructure problems Urgency Average Not critical Work standard 10.1 3.6 0.3 Overstock & inventory 29.6 10.5 0.8 Production schedule 23.9 8.5 0.7 Cost controlling & evaluating 15.2 5.4 0.4 Budget planning 22.4 7.9 0.6 Measurement control system 11.6 4.1 0.3 Information for management 13.7 4.9 0.4 Unclear organization structure 14.5 5.1 0.4
Urgency Average Not critical
Production schedule 87.88 12.12 0.00 Budget planning 83.87 16.13 0.00 Overstock & inventory 82.93 14.63 2.44 Cost controlling & evaluating 76.19 23.81 0.00 Work standard 71.43 28.57 0.00 Unclear organization structure 70.00 30.00 0.00 Measurement control system 62.50 37.50 0.00 Information for management 10.53 73.68 15.79

276
E1.8 Figure 7.7.1 Familiarity with manufacturing practices Chi-Square test (Significant) = 0.000 Significant Relationship between best practices and familiar
Observed
Never heard
Heard
Familiar understand
Applying it now Total
GMP 0 0 0 120 120 HACCP 0 0 0 115 115 JIT 0 44 12 8 64 TPM 8 72 14 12 106 TQM 0 67 34 20 121
total 8 183 60 275 526
Expected Never heard Heard
Familiar understand
Applying it now
GMP 2 42 14 63 HACCP 2 40 13 60 JIT 1 22 7 33 TPM 2 37 12 55 TQM 2 42 14 63
Applying it now
Familiar understand
Heard
Never heard
GMP 100.0 0.0 0.0 0.0 HACCP 100.0 0.0 0.0 0.0 TQM 16.5 28.1 55.4 0.0 JIT 12.5 18.8 68.8 0.0 TPM 11.3 13.2 67.9 7.5
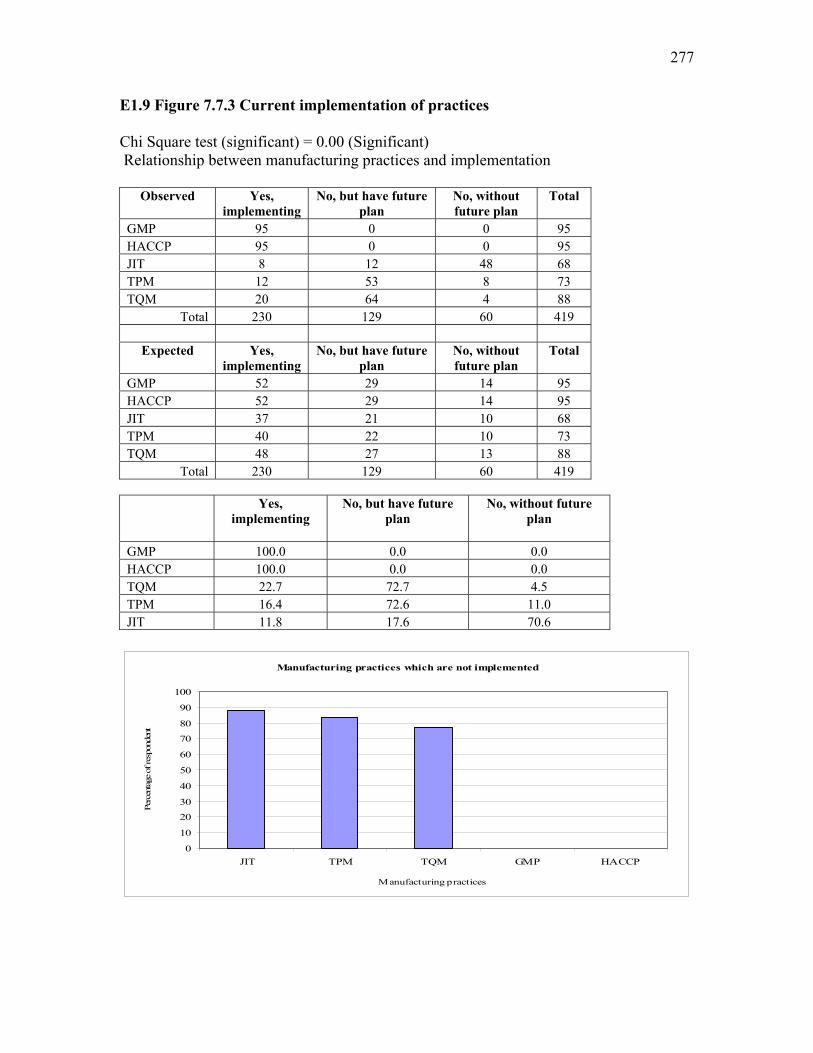
277
E1.9 Figure 7.7.3 Current implementation of practices Chi Square test (significant) = 0.00 (Significant) Relationship between manufacturing practices and implementation
Observed
Yes, implementing
No, but have future plan
No, without future plan
Total
GMP 95 0 0 95 HACCP 95 0 0 95 JIT 8 12 48 68 TPM 12 53 8 73 TQM 20 64 4 88
Total 230 129 60 419
Expected
Yes, implementing
No, but have future plan
No, without future plan
Total
GMP 52 29 14 95 HACCP 52 29 14 95 JIT 37 21 10 68 TPM 40 22 10 73 TQM 48 27 13 88
Total 230 129 60 419
Yes, implementing
No, but have future plan
No, without future plan
GMP 100.0 0.0 0.0 HACCP 100.0 0.0 0.0 TQM 22.7 72.7 4.5 TPM 16.4 72.6 11.0 JIT 11.8 17.6 70.6
Manufacturing practices which are not implemented
0
10
20
30
40
50
60
70
80
90
100
JIT TPM TQM GMP HACCP
Manufacturing practices
Perc
entage
of r
espo
nden
t

278
Future plan to implementation manufacturing practices Chi-Square test (Significant) = 0.089 (Insignificant) No relationship between manufacturing practices and year of implementation
Observed Next year Next 2 year More than 2 years Total JIT 7 5 0 12 TPM 22 17 14 53 TQM 38 18 8 64
total 67 40 22 129
Expected Next year Next 2 years More than 2 years JIT 6 4 2 TPM 28 16 9 TQM 33 20 11
E1.10 Figure 7.7.6 Benefits of company performance from manufacturing practices Chi-Square test (Significant) = 0.00 Significant Relationship between company performance and percentage of benefits
Observed 25-50% 50-75% 75-100% Total Financial 0 24 61 85 Marketing 0 10 81 91 Staff 10 50 24 84 Safety 2 7 86 95 Production 1 18 72 91
total 13 109 324 446 Expected 25-50% 50-75% 75-100% Total Financial 2 21 62 85 Marketing 3 22 66 91 Staff 2 21 61 84 Safety 3 23 69 95 Production 3 22 66 91
total 13 109 324 446
75-100% 50-75% 25-50% Safety 90.5 7.4 2.1 Marketing 89.0 11.0 0.0 Production 79.1 19.8 1.1 Financial 71.8 28.2 0.0 Staff 28.6 59.5 11.9

279
E1.11Figure 7.4.1 Potential of solving human resource problems Chi-Square test (Significant) = 0.000 Significant Relationship between HR problems and potential of solving
Observed - HR problems - related to training
Easy
Average
Difficult
Total
Personal conflict 18 48 6 72 Insufficiency of technical skill 11 38 4 53 Lack of management skill 20 34 6 60 Lack of commitment of top management 32 29 1 62 Teamwork 20 5 2 27 Continuous improvement activity 5 11 2 18 Safety problems in workplace 4 16 1 21 Lack of employee empowerment 6 15 2 23
total 116 196 24 336
Expected - HR problems - related to training
Easy
Average
Difficult
Personal conflict 24.9 42.0 5.1 Insufficiency of technical skill 18.3 30.9 3.8 Lack of management skill 20.7 35.0 4.3 Lack of commitment of top management 21.4 36.2 4.4 Teamwork 9.3 15.8 1.9 Continuous improvement activity 6.2 10.5 1.3 Safety problems in workplace 7.3 12.3 1.5 Lack of employee empowerment 7.9 13.4 1.6
Urgency
Average
Not
critical Personal conflict 94.6 2.7 2.7 Lack of commitment of top management 94.1 5.9 0.0 Safety problems in workplace 90.9 9.1 0.0 Teamwork 86.7 13.3 0.0 Human error 80.0 20.0 0.0 Lack of employee empowerment 78.3 21.7 0.0 Insufficiency of technical skill 77.8 20.4 1.9 Continuous improvement activity 66.7 33.3 0.0 Lack of management skill 60.0 36.7 3.3

280
Difficulty of solving human resource problems
0
2
4
6
8
10
12
Continuousimprovement
activity
Lack ofmanagement
skill
Lack ofemployee
empowerment
Personalconflict
Insufficiencyof technical
skill
Teamwork Safetyproblems inworkplace
Lack ofcommitment
of topmanagement
HR problems
Perc
enta
ge o
f res
pond
ent
E1.12 Figure 7.4.2 Potential of solving quality problems Chi-Square test (Significant) = 0.000 Significant Relationship between quality problems and potential of solving
Observed - Quality problems Easy Average Difficult Total Defects 24 16 2 42 Machine breakdown 20 32 8 60 Availability of material 10 32 22 64 Meeting customer deadline 3 20 1 24 Waste time 34 6 2 42 Lack of production performance (productivity) 13 2 0 15
Total 104 108 35 247 Expected - Quality problems Easy Average Difficult Defects 17.7 18.4 6.0 Machine breakdown 25.3 26.2 8.5 Availability of material 26.9 28.0 9.1 Meeting customer deadline 10.1 10.5 3.4 Waste time 17.7 18.4 6.0 Lack of production performance (productivity) 6.3 6.6 2.1
Infrequently
Frequently
No
occurrence Waste time 76.2 19.0 4.8 Meeting customer deadline 73.7 15.8 10.5 Defects 72.5 19.6 7.8 Machine breakdown 68.9 29.5 1.6 Availability of material 58.2 41.8 0.0 Lack of production performance (productivity) 48.0 16.0 36.0
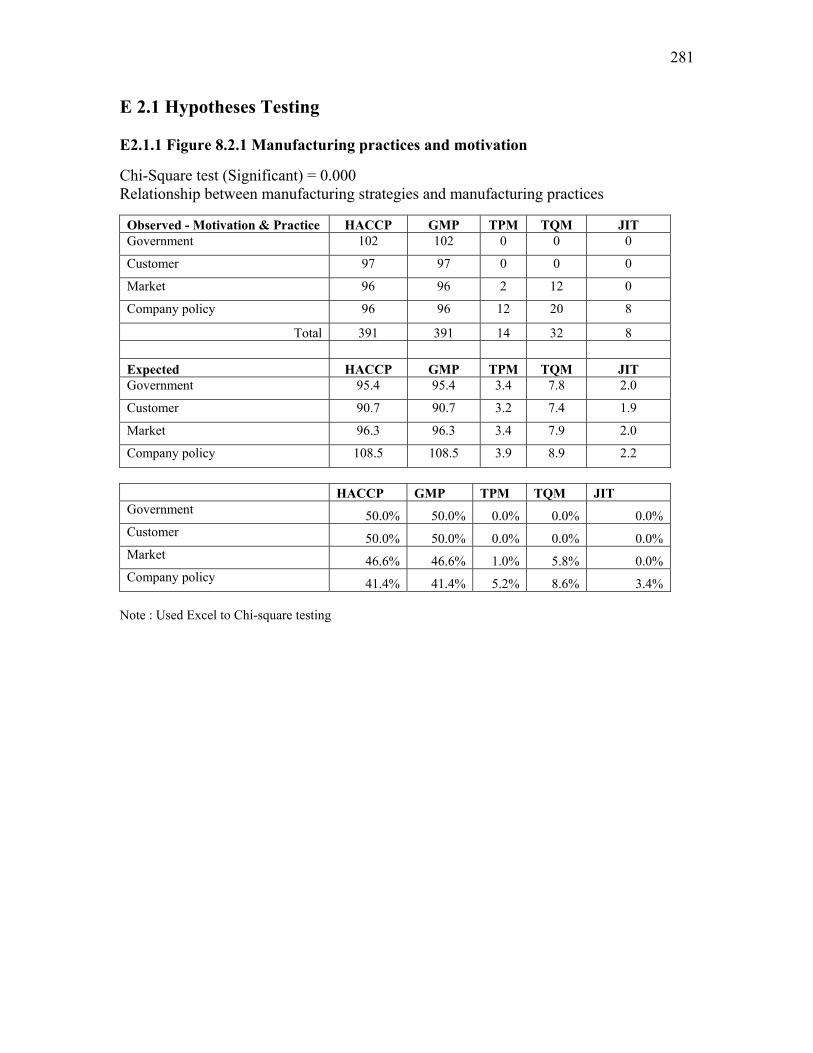
281
E 2.1 Hypotheses Testing E2.1.1 Figure 8.2.1 Manufacturing practices and motivation Chi-Square test (Significant) = 0.000 Relationship between manufacturing strategies and manufacturing practices
Observed - Motivation & Practice HACCP GMP TPM TQM JIT Government 102 102 0 0 0
Customer 97 97 0 0 0
Market 96 96 2 12 0
Company policy 96 96 12 20 8
Total 391 391 14 32 8 Expected HACCP GMP TPM TQM JIT Government 95.4 95.4 3.4 7.8 2.0
Customer 90.7 90.7 3.2 7.4 1.9
Market 96.3 96.3 3.4 7.9 2.0
Company policy 108.5 108.5 3.9 8.9 2.2
HACCP GMP TPM TQM JIT Government 50.0% 50.0% 0.0% 0.0% 0.0% Customer 50.0% 50.0% 0.0% 0.0% 0.0% Market 46.6% 46.6% 1.0% 5.8% 0.0% Company policy 41.4% 41.4% 5.2% 8.6% 3.4%
Note : Used Excel to Chi-square testing

282
E2.2 Figure 8.2.2 Manufacturing strategies and manufacturing practices Chi-Square test (Significant) = 0.0253 Significant Relationship between manufacturing strategies and manufacturing practices
Observed - Manufacturing strategy & Practice
HACCP
GMP
TPM
JIT
TQM
Total
Production 18 18 2 0 18 56 Process 102 102 10 8 46 268 Market 82 82 0 0 38 202 Service 2 2 0 0 2 6
Total 204 204 12 8 104 532
Expected HACCP GMP TPM JIT TQM Production 21.5 21.5 1.3 0.8 10.9 Process 102.8 102.8 6.0 4.0 52.4 Market 77.5 77.5 4.6 3.0 39.5 Service 2.3 2.3 0.1 0.1 1.2
HACCP GMP TQM TPM JIT
Market 40.6% 40.6% 18.8% 0.0% 0.0% Process 38.1% 38.1% 17.2% 3.7% 3.0% Service 33.3% 33.3% 33.3% 0.0% 0.0% Production 32.1% 32.1% 32.1% 3.6% 0.0%
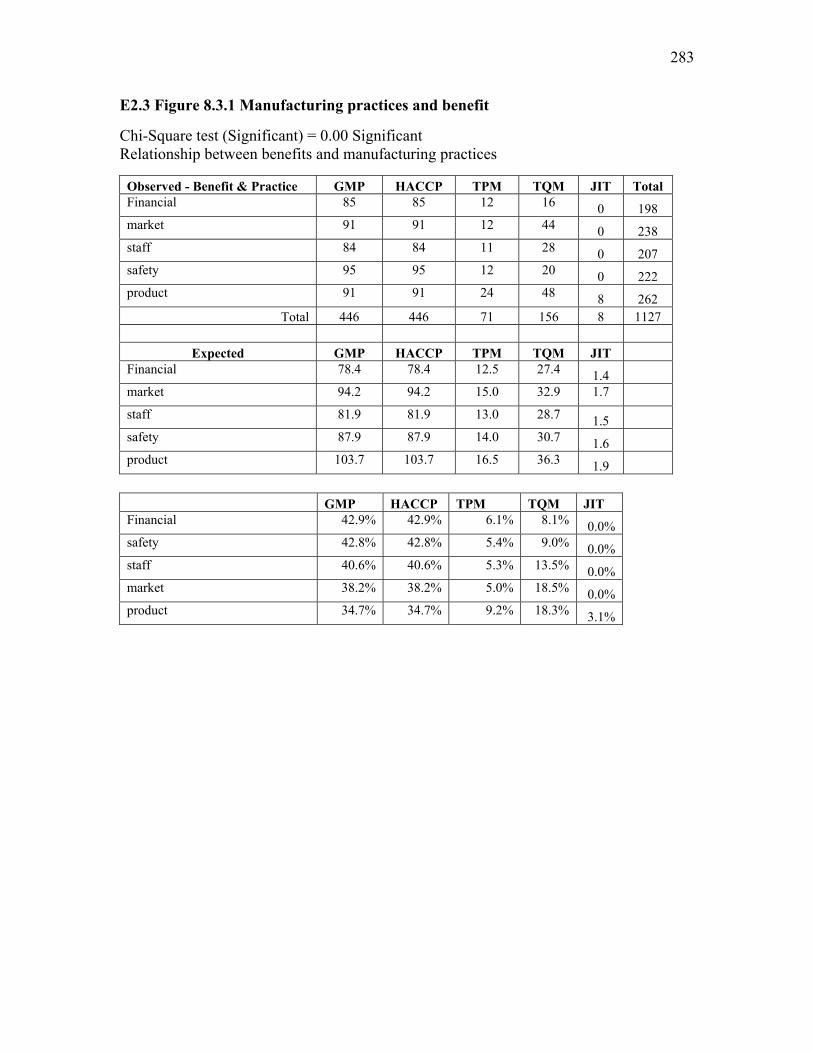
283
E2.3 Figure 8.3.1 Manufacturing practices and benefit Chi-Square test (Significant) = 0.00 Significant Relationship between benefits and manufacturing practices
Observed - Benefit & Practice GMP HACCP TPM TQM JIT Total Financial 85 85 12 16 0 198 market 91 91 12 44 0 238 staff 84 84 11 28 0 207 safety 95 95 12 20 0 222 product 91 91 24 48 8 262
Total 446 446 71 156 8 1127
Expected GMP HACCP TPM TQM JIT Financial 78.4 78.4 12.5 27.4 1.4 market 94.2 94.2 15.0 32.9 1.7
staff 81.9 81.9 13.0 28.7 1.5
safety 87.9 87.9 14.0 30.7 1.6
product 103.7 103.7 16.5 36.3 1.9
GMP HACCP TPM TQM JIT Financial 42.9% 42.9% 6.1% 8.1% 0.0% safety 42.8% 42.8% 5.4% 9.0% 0.0% staff 40.6% 40.6% 5.3% 13.5% 0.0% market 38.2% 38.2% 5.0% 18.5% 0.0% product 34.7% 34.7% 9.2% 18.3% 3.1%

284
E2.4 Figure 8.4.1 Company size and manufacturing practices Chi-Square test (Significant) = 0.00 Significant Relationship between firm sizes and manufacturing practices
Observed - Size & Practice HACCP GMP TPM JIT TQM Total Small 18 22 0 0 2 42 Medium 66 66 3 0 24 159 Large 28 28 9 8 28 101
Total 112 116 12 8 54 302
Expected HACCP GMP TPM JIT TQM Small 15.6 16.1 1.7 1.1 7.5 Medium 59.0 61.1 6.3 4.2 28.4 Large 37.5 38.8 4.0 2.7 18.1
GMP HACCP TQM TPM JIT Small 52.4% 42.9% 4.8% 0.0% 0.0% Medium 41.5% 41.5% 15.1% 1.9% 0.0% Large 27.7% 27.7% 27.7% 8.9% 7.9%
E2.5 Figure 8.4.2 Manufacturing practices and turns over Chi-Square test (Significant) = 0.00 Significant Relationship between turnovers and manufacturing practices
Observed Turnover & Practice
HACCP
GMP
TPM
JIT
TQM
Total
Less than 10 million Baht 2 4 0 0 0 6 10 - 50 million Baht 11 13 0 0 2 26 50 - 100 million Baht 22 22 2 0 9 55 100 - 500 million Baht 40 40 3 1 28 112 More than 500 million Baht 37 37 7 7 30 118
total 112 116 12 8 69 317
Expected HACCP GMP TPM JIT TQM Less than 10 million Baht 2.1 2.2 0.2 0.2 1.3 10 - 50 million Baht 9.2 9.5 1.0 0.7 5.7 50 - 100 million Baht 19.4 2.1 2.1 1.4 12.0 100 - 500 million Baht 39.6 41.0 4.2 2.8 24.4 More than 500 million Baht 41.7 43.2 4.5 3.0 25.7
HACCP GMP TQM TPM JIT Less than 10 million Baht 33.3% 66.7% 0.0% 0.0% 0.0% 10 - 50 million Baht 42.3% 50.0% 7.7% 0.0% 0.0% 50 - 100 million Baht 40.0% 40.0% 16.4% 3.6% 0.0% 100 - 500 million Baht 35.7% 35.7% 25.0% 2.7% 0.9% More than 500 million Baht 31.4% 31.4% 25.4% 5.9% 5.9%

285
E2.6 Figure 8.4.3 Manufacturing process and Manufacturing practices Chi-Square test (Significant) = 0.0253 Significant Relationship between manufacturing strategies and manufacturing practices
Observed - Manufacturing strategy & Practice
HACCP
GMP
TPM
JIT
TQM
Total
Production 18 18 2 0 18 56 Process 102 102 10 8 46 268 Market 82 82 0 0 38 202 Service 2 2 0 0 2 6
Total 204 204 12 8 104 532
Expected HACCP GMP TPM JIT TQM Production 21.5 21.5 1.3 0.8 10.9 Process 102.8 102.8 6.0 4.0 52.4 Market 77.5 77.5 4.6 3.0 39.5 Service 2.3 2.3 0.1 0.1 1.2
HACCP GMP TQM TPM JIT Market 40.6% 40.6% 18.8% 0.0% 0.0% Process 38.1% 38.1% 17.2% 3.7% 3.0% Service 33.3% 33.3% 33.3% 0.0% 0.0% Production 32.1% 32.1% 32.1% 3.6% 0.0%
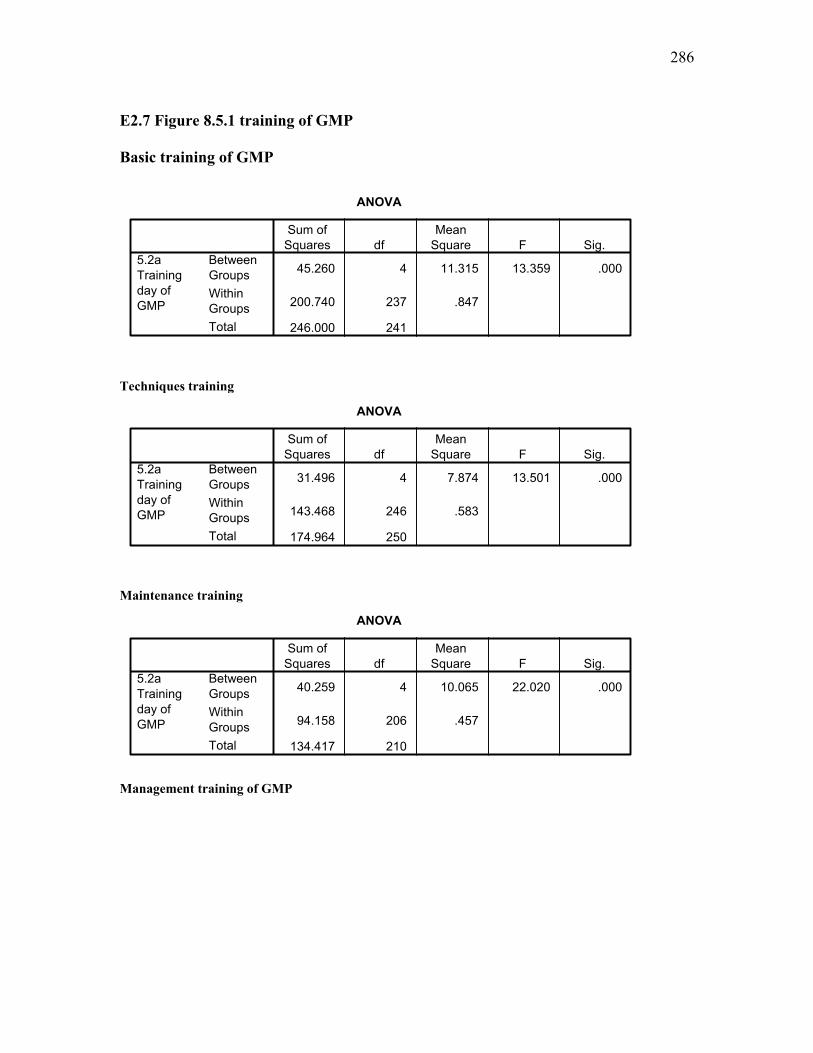
286
E2.7 Figure 8.5.1 training of GMP Basic training of GMP
ANOVA
45.260 4 11.315 13.359 .000
200.740 237 .847
246.000 241
BetweenGroupsWithinGroupsTotal
5.2aTrainingday ofGMP
Sum ofSquares df
MeanSquare F Sig.
Techniques training
ANOVA
31.496 4 7.874 13.501 .000
143.468 246 .583
174.964 250
BetweenGroupsWithinGroupsTotal
5.2aTrainingday ofGMP
Sum ofSquares df
MeanSquare F Sig.
Maintenance training
ANOVA
40.259 4 10.065 22.020 .000
94.158 206 .457
134.417 210
BetweenGroupsWithinGroupsTotal
5.2aTrainingday ofGMP
Sum ofSquares df
MeanSquare F Sig.
Management training of GMP

287
ANOVA
7.409 4 1.852 2.480 .045
183.007 245 .747
190.416 249
BetweenGroupsWithinGroupsTotal
5.2aTrainingday ofGMP
Sum ofSquares df
MeanSquare F Sig.
E2.8 Figure 8.5.2 training HACCP Basic training HACCP
ANOVA
21.792 4 5.448 8.085 .000
169.145 251 .674
190.938 255
BetweenGroupsWithinGroupsTotal
5.2aTrainingday ofHACCP
Sum ofSquares df
MeanSquare F Sig.
Technical training
ANOVA
20.925 4 5.231 13.800 .000
75.055 198 .379
95.980 202
BetweenGroupsWithinGroupsTotal
5.2aTrainingday ofHACCP
Sum ofSquares df
MeanSquare F Sig.
Maintenance training of HCCP
ANOVA
7.696 4 1.924 3.890 .005
77.149 156 .495
84.845 160
BetweenGroupsWithinGroupsTotal
5.2aTrainingday ofHACCP
Sum ofSquares df
MeanSquare F Sig.
Management training HACCP

288
ANOVA
10.148 4 2.537 2.543 .041
210.477 211 .998
220.625 215
BetweenGroupsWithinGroupsTotal
5.2aTrainingday ofHACCP
Sum ofSquares df
MeanSquare F Sig.
E2.9 Figure 8.5.3 training of TPM Basic training of TPM
ANOVA
5.930 4 1.483 2.555 .041
94.588 163 .580
100.518 167
BetweenGroupsWithinGroupsTotal
5.2aTrainingday ofTPM
Sum ofSquares df
MeanSquare F Sig.
Technical training of TPM
ANOVA
2.674 4 .668 1.018 .400
112.275 171 .657
114.949 175
BetweenGroupsWithinGroupsTotal
5.2aTrainingday ofTPM
Sum ofSquares df
MeanSquare F Sig.
Maintenance training of TPM
ANOVA
9.423 4 2.356 3.293 .014
76.541 107 .715
85.964 111
BetweenGroupsWithinGroupsTotal
5.2aTrainingday ofTPM
Sum ofSquares df
MeanSquare F Sig.

289
Management training of TPM
ANOVA
2.225 4 .556 .936 .445
106.997 180 .594
109.222 184
BetweenGroupsWithinGroupsTotal
5.2aTrainingday ofTPM
Sum ofSquares df
MeanSquare F Sig.
E2.10 Figure 8.5.4 training of TQM Basic training of TQM
ANOVA
3.036 4 .759 1.156 .331
139.186 212 .657
142.221 216
BetweenGroupsWithinGroupsTotal
5.2aTrainingday ofTQM
Sum ofSquares df
MeanSquare F Sig.
Technical training of TQM
ANOVA
32.123 4 8.031 14.776 .000
109.790 202 .544
141.913 206
BetweenGroupsWithinGroupsTotal
5.2aTrainingday ofTQM
Sum ofSquares df
MeanSquare F Sig.
Maintenance training of TQM
ANOVA
38.436 4 9.609 20.361 .000
68.902 146 .472
107.338 150
BetweenGroupsWithinGroupsTotal
5.2aTrainingday ofTQM
Sum ofSquares df
MeanSquare F Sig.

290
Management training of TQM
ANOVA
72.433 4 18.108 23.538 .000
156.945 204 .769
229.378 208
BetweenGroupsWithinGroupsTotal
5.2aTrainingday ofTQM
Sum ofSquares df
MeanSquare F Sig.
E2.11 JIT training Basic training of JIT
ANOVA
7.635 4 1.909 4.431 .002
46.524 108 .431
54.159 112
BetweenGroupsWithinGroupsTotal
5.2aTrainingday of JIT
Sum ofSquares df
MeanSquare F Sig.
Technical training of JIT
ANOVA
.631 4 .158 .441 .778
21.431 60 .357
22.062 64
BetweenGroupsWithinGroupsTotal
5.2aTrainingday of JIT
Sum ofSquares df
MeanSquare F Sig.
Maintenance training of JIT
ANOVA
5.147 3 1.716 3.593 .019
27.692 58 .477
32.839 61
BetweenGroupsWithinGroupsTotal
5.2aTrainingday of JIT
Sum ofSquares df
MeanSquare F Sig.
Management training of JIT
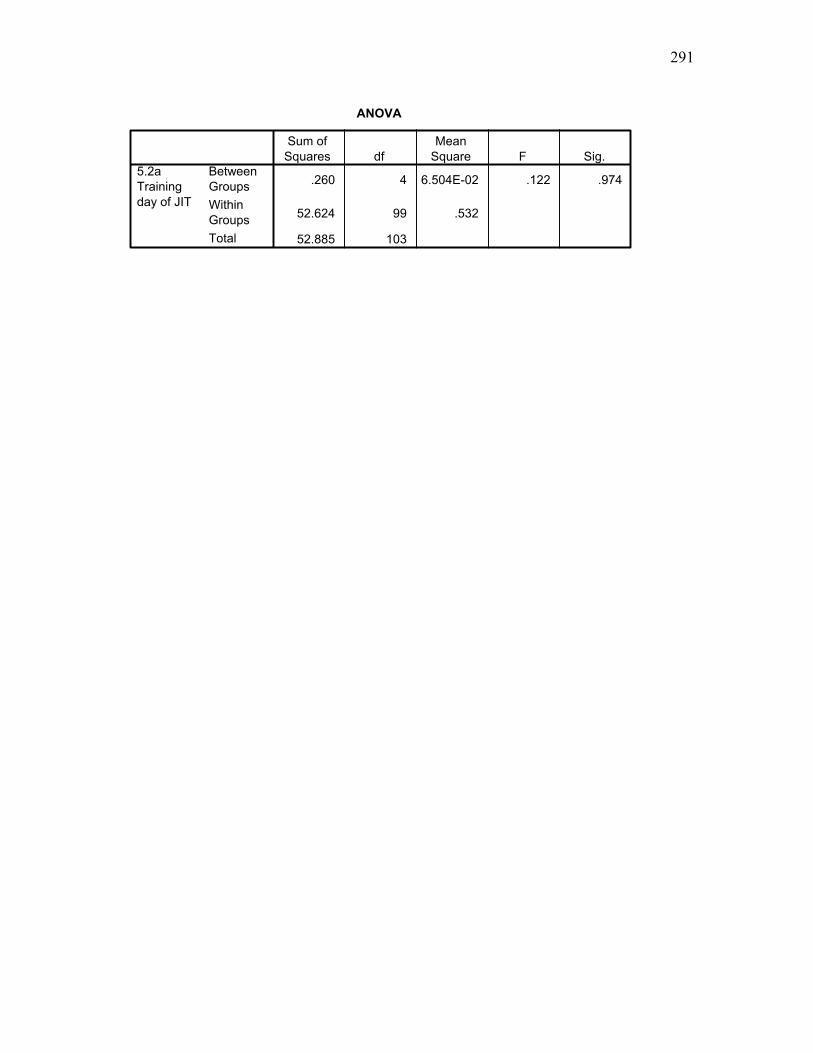
291
ANOVA
.260 4 6.504E-02 .122 .974
52.624 99 .532
52.885 103
BetweenGroupsWithinGroupsTotal
5.2aTrainingday of JIT
Sum ofSquares df
MeanSquare F Sig.
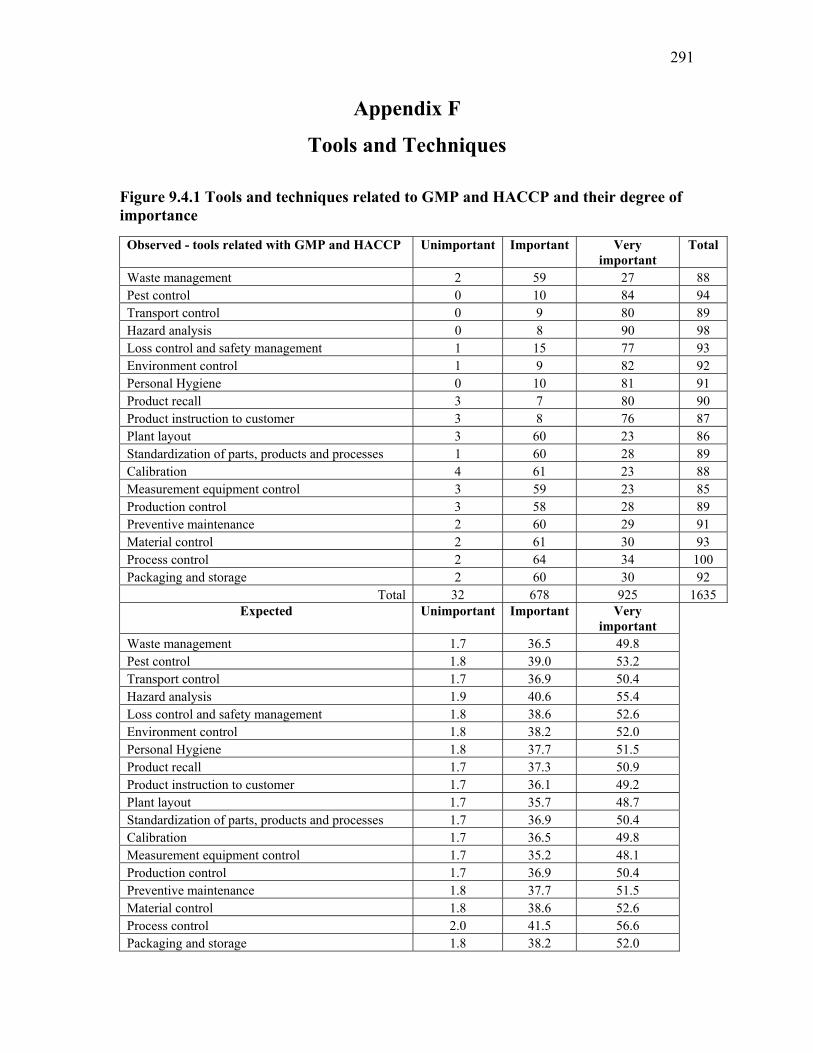
291
Appendix F
Tools and Techniques Figure 9.4.1 Tools and techniques related to GMP and HACCP and their degree of importance
Observed - tools related with GMP and HACCP
Unimportant
Important
Very important
Total
Waste management 2 59 27 88 Pest control 0 10 84 94 Transport control 0 9 80 89 Hazard analysis 0 8 90 98 Loss control and safety management 1 15 77 93 Environment control 1 9 82 92 Personal Hygiene 0 10 81 91 Product recall 3 7 80 90 Product instruction to customer 3 8 76 87 Plant layout 3 60 23 86 Standardization of parts, products and processes 1 60 28 89 Calibration 4 61 23 88 Measurement equipment control 3 59 23 85 Production control 3 58 28 89 Preventive maintenance 2 60 29 91 Material control 2 61 30 93 Process control 2 64 34 100 Packaging and storage 2 60 30 92
Total 32 678 925 1635 Expected
Unimportant
Important
Very
important Waste management 1.7 36.5 49.8 Pest control 1.8 39.0 53.2 Transport control 1.7 36.9 50.4 Hazard analysis 1.9 40.6 55.4 Loss control and safety management 1.8 38.6 52.6 Environment control 1.8 38.2 52.0 Personal Hygiene 1.8 37.7 51.5 Product recall 1.7 37.3 50.9 Product instruction to customer 1.7 36.1 49.2 Plant layout 1.7 35.7 48.7 Standardization of parts, products and processes 1.7 36.9 50.4 Calibration 1.7 36.5 49.8 Measurement equipment control 1.7 35.2 48.1 Production control 1.7 36.9 50.4 Preventive maintenance 1.8 37.7 51.5 Material control 1.8 38.6 52.6 Process control 2.0 41.5 56.6 Packaging and storage 1.8 38.2 52.0

292
Figure 9.4.1 Tools and techniques related to GMP and HACCP and their degree of importance
Very important
Important
Unimportant
Hazard analysis 91.8 8.2 0.0 Transport control 89.9 10.1 0.0 Pest control 89.4 10.6 0.0 Environment control 89.1 9.8 1.1 Personal Hygiene 89.0 11.0 0.0 Product recall 88.9 7.8 3.3 Product instruction to customer 87.4 9.2 3.4 Loss control and safety management 82.8 16.1 1.1 Process control 34.0 64.0 2.0 Packaging and storage 32.6 65.2 2.2 Material control 32.3 65.6 2.2 Preventive maintenance 31.9 65.9 2.2 Standardization of parts, products and processes 31.5 67.4 1.1 Production control 31.5 65.2 3.4 Waste management 30.7 67.0 2.3 Measurement equipment control 27.1 69.4 3.5 Plant layout 26.7 69.8 3.5 Calibration 26.1 69.3 4.5
Chi-Square test (Significant) = 0.00 Significant Relationship between tools related with GMP and HACCP and degree of importance

293
E3.2 Figure 9.4.2 Basic tools and techniques and their degree of importance Chi-Square test (Significant) = 0.0069 Significant Relationship between basic tools and degree of importance
Observed - Basic tools
Unimportant
Important
Very important
Total
Basic 7 tools 0 32 78 110 SPC 0 30 81 111 PDCA cycle 3 22 77 102 Brainstorming 1 33 80 114 Multi-skilled employees 3 28 77 108 Small group improvement activity 2 27 74 103 QCC 1 20 77 98 Poka-yoke 7 28 49 84 Inspection and testing product 1 26 80 107 5S & housekeeping 0 27 77 104 Suggestion system 1 24 73 98
total 19 297 823 1139
Expected Unimportant
Important
Very
important Basic 7 tools 1.8 28.7 79.5 SPC 1.9 28.9 80.2 PDCA cycle 1.7 26.6 73.7 Brainstorming 1.9 29.7 82.4 Multi-skilled employees 1.8 28.2 78.0 Small group improvement activity 1.7 26.9 74.4 QCC 1.6 25.6 70.8 Poka-yoke 1.4 21.9 60.7 Inspection and testing product 1.8 27.9 77.3 5S & housekeeping 1.7 27.1 75.1 Suggestion system 1.6 25.6 70.8
Very important Important Unimportant QCC 78.6 20.4 1.0 PDCA cycle 75.5 21.6 2.9 Inspection and testing product 74.8 24.3 1 Suggestion system 74.5 24.5 1 5S & housekeeping 74.0 26.0 0.0 SPC 73.0 27.0 0.0 Small group improvement activity 71.8 26.2 1.9 Multi-skilled employees 71.3 25.9 2.8 Basic 7 tools 70.9 29.1 0 Brainstorming 70.2 28.9 0.9 Poka-yoke 58.3 33.3 8.3
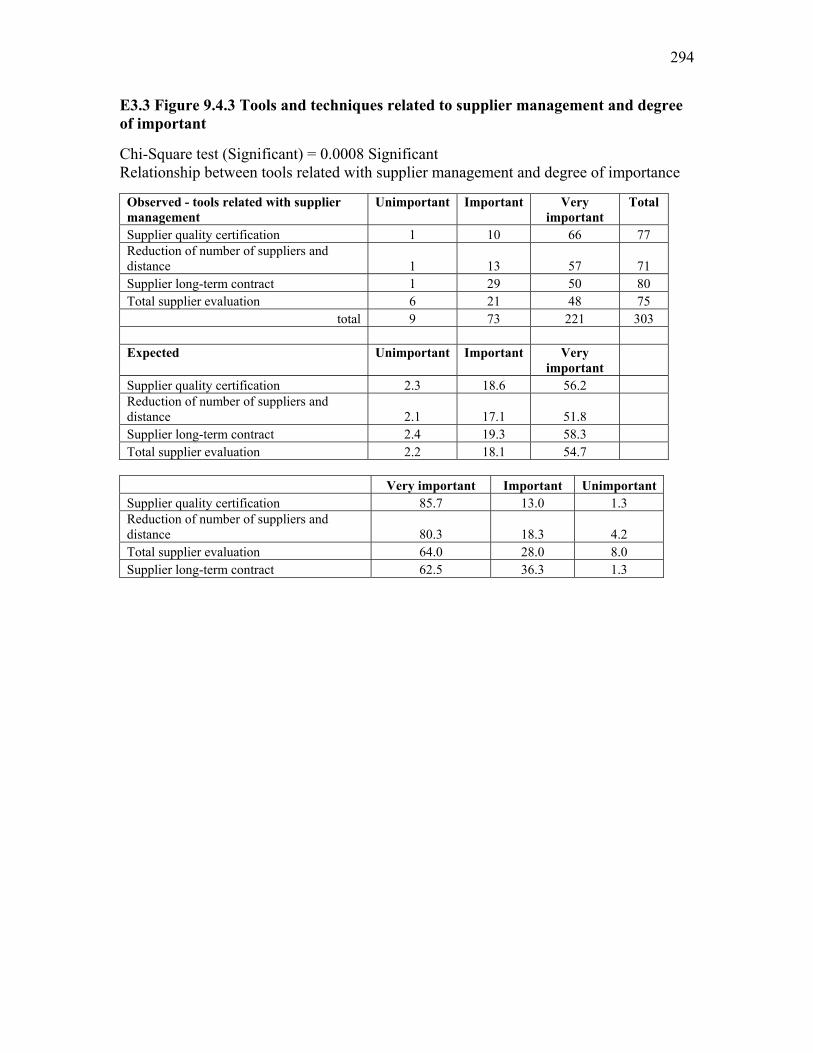
294
E3.3 Figure 9.4.3 Tools and techniques related to supplier management and degree of important Chi-Square test (Significant) = 0.0008 Significant Relationship between tools related with supplier management and degree of importance
Observed - tools related with supplier management
Unimportant
Important
Very important
Total
Supplier quality certification 1 10 66 77 Reduction of number of suppliers and distance 1 13 57 71 Supplier long-term contract 1 29 50 80 Total supplier evaluation 6 21 48 75
total 9 73 221 303 Expected
Unimportant
Important
Very important
Supplier quality certification 2.3 18.6 56.2 Reduction of number of suppliers and distance 2.1 17.1 51.8 Supplier long-term contract 2.4 19.3 58.3 Total supplier evaluation 2.2 18.1 54.7
Very important Important Unimportant Supplier quality certification 85.7 13.0 1.3 Reduction of number of suppliers and distance 80.3 18.3 4.2 Total supplier evaluation 64.0 28.0 8.0 Supplier long-term contract 62.5 36.3 1.3

295
E3.4 Figure 9.4.4 Management tools and techniques and the degree of importance Chi-Square test (Significant) = 0.0003 Significant Relationship between management tools and degree of importance
Observed - Management tools
Unimportant
Important
Very important
Total
Effective meeting 1 30 38 69 Human resource development 0 23 67 90 Personnel management 4 30 39 73 Motivation 1 20 58 79 Conflict management 1 30 36 67 Database & information management 5 36 37 78 Daily management 4 40 38 82 Facility management 3 40 43 86 Project management 2 44 32 78 Cross functional management 2 39 37 78 Policy deployment 4 44 40 88 Equipment management 2 40 48 90 Benchmarking 2 45 35 82 Document control 2 35 59 96 Quality records 2 31 60 93 Quality audit 2 30 62 94
Total 37 557 729 1323
Expected
Unimportant
Important
Very important
Effective meeting 1.9 29.0 37.9 Human resource development 2.5 37.8 49.5 Personnel management 2.6 30.7 40.1 Motivation 2.2 33.2 43.4 Conflict management 1.9 28.1 36.8 Database & information management 2.2 32.8 42.9 Daily management 2.3 34.4 45.1 Facility management 2.4 36.1 47.3 Project management 2.2 32.8 42.9 Cross functional management 2.2 32.8 42.9 Policy deployment 2.5 37.0 48.4 Equipment management 2.5 37.8 49.5 Benchmarking 2.3 34.4 45.1 Document control 2.7 40.3 52.8 Quality records 2.6 40.3 52.8 Quality audit 2.6 39.5 51.7

296
E3.4 Figure 9.4.4 Management tools and techniques and the degree of importance
Expected
Very important
Important
Unimportant
Human resource development 74.4 25.6 0.0 Motivation 73.4 25.3 1.3 Quality audit 66.0 31.9 2.1 Quality records 64.5 33.3 2.2 Document control 61.5 36.5 2.1 Effective meeting 55.1 43.5 1.4 Personnel management 53.4 41.1 5.5 Equipment management 53.3 44.4 2.2 Database & information management 47.4 46.2 6.4 Cross functional management 47.4 50.0 2.6 Facility management 46.5 50.0 3.5 Daily management 46.3 48.8 4.9 Policy deployment 45.5 50.0 4.5 Conflict management 44.8 53.7 1.5 Benchmarking 42.7 54.9 2.4 Project management 41.0 56.4 2.6

297
E3.5 Figure 9.4.4 Management tools and techniques and the degree of importance Chi-Square test (Significant) = 0.0003 Significant Relationship between management tools and degree of importance
Observed - Management tools
Unimportant
Important
Very important
Total
Effective meeting 1 30 38 69 Human resource development 0 23 67 90 Personnel management 4 30 39 73 Motivation 1 20 58 79 Conflict management 1 30 36 67 Database & information management 5 36 37 78 Daily management 4 40 38 82 Facility management 3 40 43 86 Project management 2 44 32 78 Cross functional management 2 39 37 78 Policy deployment 4 44 40 88 Equipment management 2 40 48 90 Benchmarking 2 45 35 82 Document control 2 35 59 96 Quality records 2 31 60 93 Quality audit 2 30 62 94
total 37 557 729 1323 Expected
Unimportant
Important
Very important
Effective meeting 1.9 29.0 37.9 Human resource development 2.5 37.8 49.5 Personnel management 2.6 30.7 40.1 Motivation 2.2 33.2 43.4 Conflict management 1.9 28.1 36.8 Database & information management 2.2 32.8 42.9 Daily management 2.3 34.4 45.1 Facility management 2.4 36.1 47.3 Project management 2.2 32.8 42.9 Cross functional management 2.2 32.8 42.9 Policy deployment 2.5 37.0 48.4 Equipment management 2.5 37.8 49.5 Benchmarking 2.3 34.4 45.1 Document control 2.7 40.3 52.8 Quality records 2.6 40.3 52.8 Quality audit 2.6 39.5 51.7