Embed Size (px)
Citation preview

1
Yu-Li Huang, Ph.D.Assistant Professor
Industrial Engineering DepartmentNew Mexico State University
AN APPOINTMENT ORDER OUTPATIENT SCHEDULING SYSTEM
THAT IMPROVES OUTPATIENT EXPERIENCE

2
Learning Objectives
1. Understand the fundamental reasons and shortcomings of the current scheduling systems.
2. Define an effective patient central scheduling model that meets the clinic policies.
3. Develop and extend the proposed model considering ancillary services.
4. Learn and evaluate the implementation of the proposed model.
5. Develop a overbooking policy to reduce the negative impact of no-shows.

3
Introduction
Shift inpatient care to outpatient facilities to reduce cost Competition increases Currently focus more on the efficiency of provider timeLack of implemented model

4
Learning Objective 1
Unrealistic Estimations of Treatment Time
Physician centric solution to the problem of wait timeUnderestimating visit timesOverbooking or double booking
Physician’s perception
Patient Arrival Time vs. Patient Appointment Time
Often blurred in practicePhysician idling may compounds patient wait time

5
Learning Objective 1 Impact of Inaccurate Estimated of Treatment Time
Even “One Minute” on average will make a significant difference.

6
Most studies are either theoretical or case-specific.
Appointment rules have not been adopted and implemented successfully in reality due to the lack of understanding and cooperation of the medical staff.
No real case study supports these appointment rules.
Learning Objective 1 Literature Limitation

7
The variability of the physician treatment time has not been addressed from the patients’ standpoint.
The probability of a patient delay at any given time has never been studied to the point that the patients of each type should be treated equally at any given time in the pre-determined template (slots).
There isn’t a clear distinguish between the physician’s schedule and the patients’ schedule.
PW cPcW ×+×.minMajor Problem
Learning Objective 1 Literature Limitation
(cost ratio)

Appointment Rules

9
General ModelingDefinitions and Formulations
=iT Physician’s service time to treat patient i where i = 1, 2, 3, …, n, and ( )2,~ σμDTi
=n
=iS
=X
The number of patients scheduled per session
The scheduled time interval for a patient in minutes
The scheduled time to start patient i where i = 1, 2, 3, …, n, and
01=S( )XiXSS ii 11 −=+= −
The finish time for patient i where i = 1, 2, 3, …, n=iF

10
General Modeling Definitions and Formulations
=iA The actual time to start patient i where i = 1, 2, 3, …, n
=iW The wait time for patient i in minutes where i = 1, 2, 3, …, n
iii TAF +=Otherwise
SFifFS
A ii
i
ii
<
⎩⎨⎧
= −
−
1
1
iii SAW −=
=iP The physician idle time waiting for patient i where i = 1, 2, 3, …, n
1−−= iii FAP
11
General Modeling Definitions and Formulations
Patient Scheduled Time
Physician Service Time
5T4T3T2T1T

12
General Modeling Definitions and Formulations
The average patient wait time=W
n
WW
n
ii∑
== 1
The average physician idle time=P
n
PP
n
ii∑
== 1

13
Learning Objective 2Wait Ratio
=R The wait ratio, which is the degree to which patient wait time exceeds R physician idle time
σμ *** dXdWRPRPW
+=→→=×⇒=
Number of standard deviation away from =d μ
σμ dX +=

14
Learning Objective 2Wait Ratio
( )4,15~ == σμGammaTi
32=n
3=R
for Return Visit patients, a simulation run.
, 32 patients a day
, Wait Ratio is equal to 3
Example:

15
Learning Objective 2 Wait Ratio Example

16
Learning Objective 2 Wait Ratio Example
The simulation found . Therefore, the is calculated as:
min5.17463.015** =×+=+= σμ dX
63.0* =d *X

17
Learning Objective 2 Determine the best wait ratio - Underlying Constraints
Let be the Scheduled Time Interval, the i th patient wait time “in general” is:
In order not to generate additional waiting, the term is preferred to be less than “0”. Therefore, given and best time interval , we can only hope:
( )XTandWofconsistsW iii −−− 11
( ) 5.0Pr * ≥≤ XTi
X
( )2,~ σμDTi*X
( )2,~ σμDTi
*X
( )XTi −−1

18
Learning Objective 2 Determine the best wait ratio - Clinical Constraints
Clinic or session finish timeTime of last appointmentNumber of patients to be seen in a given sessionAverage patient wait timeMaximum patient wait timeAverage physician Idle timeMaximum physician Idle time

19
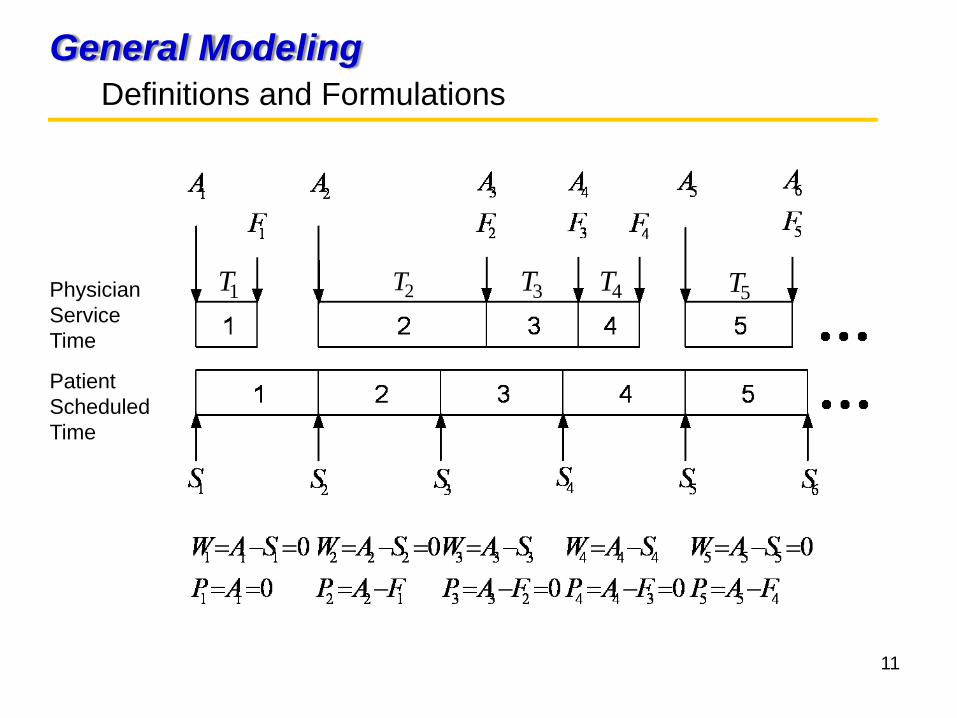
Learning Objective 2 Example – Orthopedic Surgery Clinic
NP: new patientsFU: follow-up patientsXR: patients need x-ray
before being seen
Patient Type
Average Standard Deviation
NP 10.6 4.5FU 7.3 4.0XR 5.5 3.4
Unit: minutes

20
Learning Objective 2 Orthopedic Surgery Clinic

21
Learning Objective 2 Example – Orthopedic Surgery Clinic
Clinic constraints:
Session finished by 11:30 a.m. (210 min)Last patient scheduled by 11:00 a.m. (180 min)25 patients in a session
22
Learning Objective 2 Example – Orthopedic Surgery Clinic

23
Learning Objective 2 Example – Orthopedic Surgery Clinic
The wait ratio that satisfies both constraints is 18:1, which
( ) %57Pr * ≅≤ XTi

24
Learning Objective 2 Provider Schedule – Orthopedic Surgery Clinic
Provider Schedule: Once best treatment time intervals for each visit type are determined, the schedule can be set up accordingly. For example: assuming start time is at 8:00 a.m.
Visit Type
Best Time Interval (min.)
FU 7.4NP 10.6XR 5.3
MM
Visit Type
Physician Schedule
FU 8:00XR 8:07NP 8:13FU 8:23XR 8:31NP 8:36

25
Learning Objective 3Patient Arrival Schedule
Patient Arrival Schedule: Once the provider schedule is set up, then patients’ arrival is scheduled accordingly. The determination of “Enough Time” includes:
Signing in
Filling out paperwork
Having vital or x-ray taken
Moving from room to room
Being seen by Medical Assistance or Nurse
Providing a specimen……..
Goal is to minimize average patient wait time.

26
Learning Objective 3Patient Arrival Schedule – Orthopedic Surgery Clinic
X-ray is the main ancillary service that is focused on.
2824201612840
70
60
50
40
30
20
10
0
x-ray
Freq
uenc
y
Histogram of x-rayGamma
α = 3.32
β = 2.11

27
Learning Objective 3 Patient Arrival Schedule – Orthopedic Surgery Clinic
( ) ( ) .min535.0Pr7.3,3.6~ **2 =⇒=≤−→− YYrayXGammarayX
Let Y be the scheduled time interval of ancillary service

28
Learning Objective 3 Patient Arrival Schedule – Orthopedic Surgery Clinic
10 minutes for all pre-visit activities and 5 minutes for taking x-ray for XR patients. (Arrival times are rounded to the nearest 5-minute increment)
M MM
Visit Type
Physician Schedule
Patient Arrival Schedule
FU 8:00 7:50 (0 – 10)XR 8:07 7:50 (7.4 - 15)NP 8:13 8:00 (12.7 - 10)FU 8:23 8:15 (23.3 – 10)XR 8:31 8:15 (30.7 – 15)NP 8:36 8:25 (36 – 10)
29
Learning Objective 3 Patient Arrival Schedule – Orthopedic Surgery Clinic
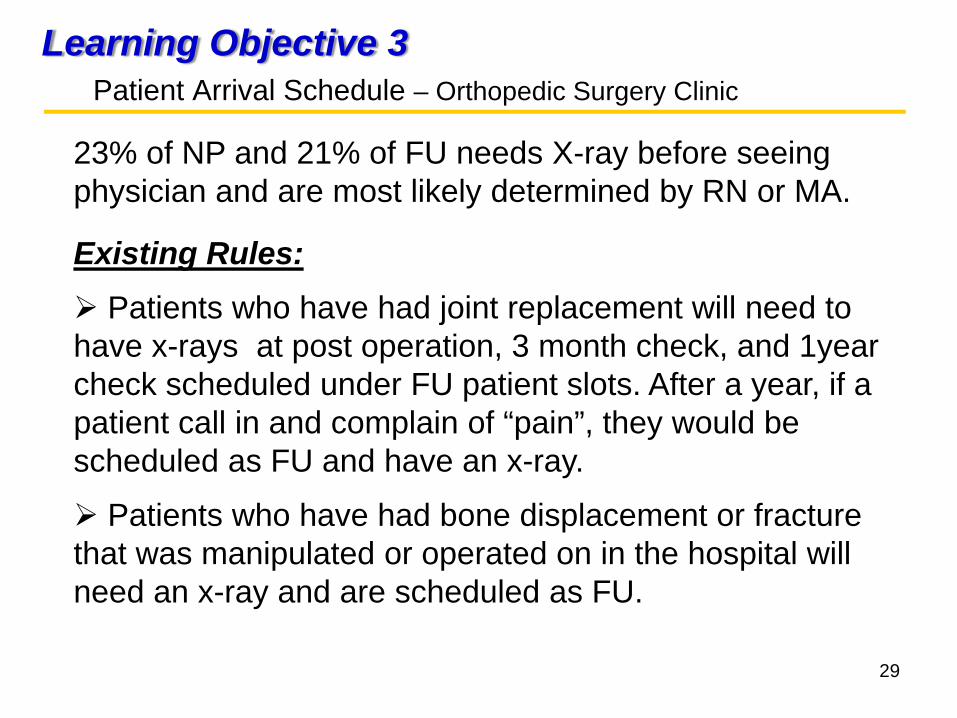
23% of NP and 21% of FU needs X-ray before seeing physician and are most likely determined by RN or MA.
Existing Rules:Patients who have had joint replacement will need to
have x-rays at post operation, 3 month check, and 1year check scheduled under FU patient slots. After a year, if a patient call in and complain of “pain”, they would be scheduled as FU and have an x-ray.
Patients who have had bone displacement or fracture that was manipulated or operated on in the hospital will need an x-ray and are scheduled as FU.
30
Learning Objective 3 Patient Arrival Schedule – Orthopedic Surgery Clinic
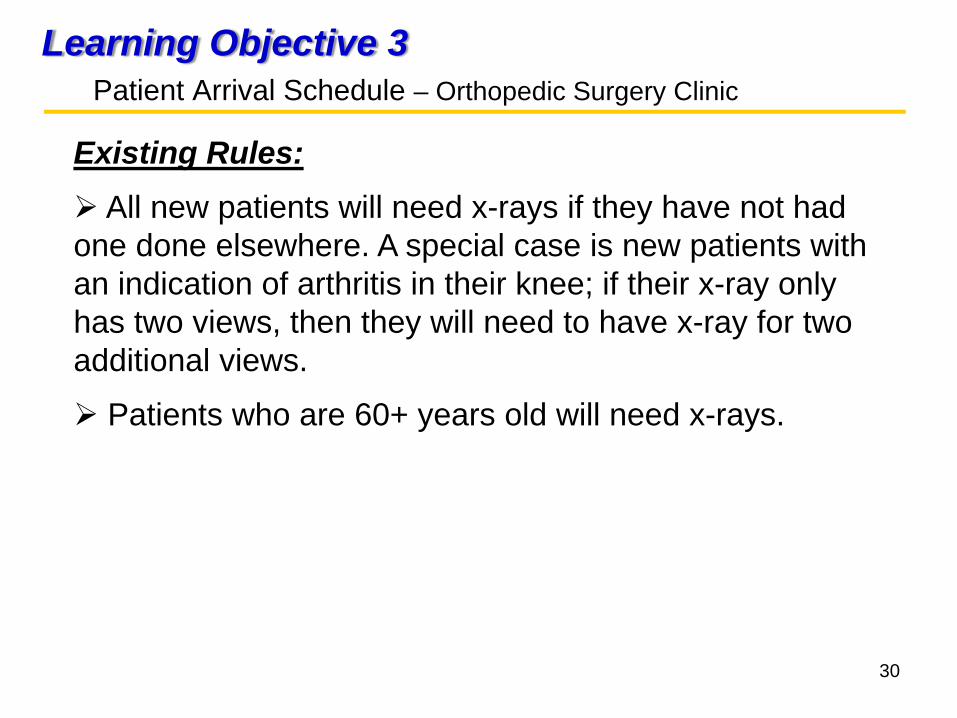
Existing Rules:All new patients will need x-rays if they have not had
one done elsewhere. A special case is new patients with an indication of arthritis in their knee; if their x-ray only has two views, then they will need to have x-ray for two additional views.
Patients who are 60+ years old will need x-rays.

31
Learning Objective 4Case Study General Problems
Patient wait time is very sensitive to the average treatment time yet most clinics collects no data on average treatment times.
Clinics usually have 15 or 30 minute slots regardless the difference on the practice of individual physician which generates additional wait time either on the patients or the physician.

32
Learning Objective 4Case Study General Problems
There isn’t a clear distinguish between physician schedule and patient arrival schedule. No ancillary services being considered.
Many clinic schedules are designed to overbook appointments to prevent idle time for physician, which creates unnecessary patient wait time.

33
Learning Objective 4Case Study – Orthopedic Surgery Clinic

34
Learning Objective 4Case Study Summary
Case 1 (Orthopedic Surgery):
Results:
Current ProposedVisit Type
Scheduled Time (min)
Wait Ratio
Scheduled Time (min)
Wait Ratio
NP 10 58:1 10.6 18:1FU 5 7.4 18:1XR none 5.3 18:1
1:∞1:∞
Avg. Patient Wait Time (min)
Est. Avg. Physician Idle Time (min)
Before 27.8 0.2After 13.1 0.8
% Reduction 53%

35
Learning Objective 4Case Study Summary
Avg. Patient Wait Time (min)
Est. Avg. Physician Idle Time (min)
Before 15.0 5.4After 7.5 5.3
% Reduction 50%
Case 2 (Plastic Surgery):
Results:
Current ProposedVisit Type
Scheduled Time (min)
Wait Ratio
Scheduled Time (min)
Wait Ratio
NP 30 25:1 33.3 3:1RV 15 33:1 17.5 3:1
POP 15 53:1 17.4 3:1HP 15 20.4 3:11:∞

36
Learning Objective 4Case Study Summary
Avg. Patient Wait Time (min)
Est. Avg. Physician Idle Time (min)
Before 27.8 2.0After 12.4 1.1
% Reduction 56%
Case 3 (Vascular Surgery):
Results:
Current ProposedVisit Type
Scheduled Time (min)
Wait Ratio
Scheduled Time (min)
Wait Ratio
NP 30 1:9 20.7 9:1RV 15 6:1 14.6 9:1

37
Learning Objective 4Case Study Summary
Scenarios
TeachingClinic
PrivateClinic
Schedule byPhysician
Schedule byResident
SingleResident
MultipleResidents
Schedule byPhysician
Schedule byPhysician
Case Study 1
Case Study 3
Case Study 2

38
Learning Objective 5Introduction to No-show
• Some of the negative consequences of patient no show are:– They create disturbances in the system– Reduced provider productivity and clinic
efficiency – Increased healthcare costs– Limited patient access to care

39
Learning Objective 5Introduction to No-show
• Issue with Open Access– “Doing today’s work today”– Burden patients in attempting to get appointments
– Patients and profit loss– Allow overtime to complete– High patient wait time

40
Learning Objective 5Proposed Overbooking Policy
• Basic steps:1. Use a predictive no-show model to estimate
individual no-show probabilities2. Find the optimal no-show threshold that
minimizes the total costs (patient wait time, physician idle time, and overtime)
3. Overbook slots where the patient’s no-show probability is greater than the threshold
• Slots can be overbooked more than once if the combined no-show rate of patients in any given slot exceeds the threshold

41
Learning Objective 5Proposed Overbooking Policy

42
Learning Objective 5Proposed Overbooking Policy
i Scheduledtime slots
j=1First booked
patient1=Yes 2=No
pi,1 j=2 first overbooked
patient if pi,1 ≥ p*
pi,2 pi,1 x pi,2
j=3 second overbooked
patient ifpi,1 x pi,2 ≥ p*
Total overbooked (j=2) +( j=3)
Totalbooked
1 8:00 1 0.14 0 1
2 8:15 1 0.37 1 0.38 0.14 0 1 2
3 8:30 1 0.21 0 1
4 8:45 1 0.55 1 0.42 0.21 0 1 2
5 9:00 1 0.22 0 1
6 9:15 1 0.37 1 0.16 0.06 0 1 2
7 9:30 1 0.59 1 0.38 0.22 0 1 2
8 9:45 1 0.21 0 1
9 10:00 1 0.24 0 1
10 10:15 1 0.36 1 0.32 0.12 0 1 2
Given p* = 0.28, is the predicted no-show rate for patient j at slot ijip ,

43
Implementation Steps and OutcomesOverview
Step 1:
Data for physician and medical staff treatment time
Data for patient and physician wait time
Understand patient visit time and its variability
Improve physician and staff understanding of time required for different patient types
Activities Development Outcomes

44
Implementation Steps and OutcomesOverview
Step 2:
Clinic process flow
Clinic constraints
Build simulation model corresponding to the process flow of the clinic
Develop improved scheduling policies for providers
Activities Development Outcomes
Determine the best treatment time interval for each visit type
Build physician schedule

45
Implementation Steps and OutcomesOverview
Step 3:
Date for treatment time of ancillary services
Build patient arrival schedule
Develop improved scheduling practices for patient arrival
Activities Development Outcomes
46
Implementation Steps and OutcomesOverview
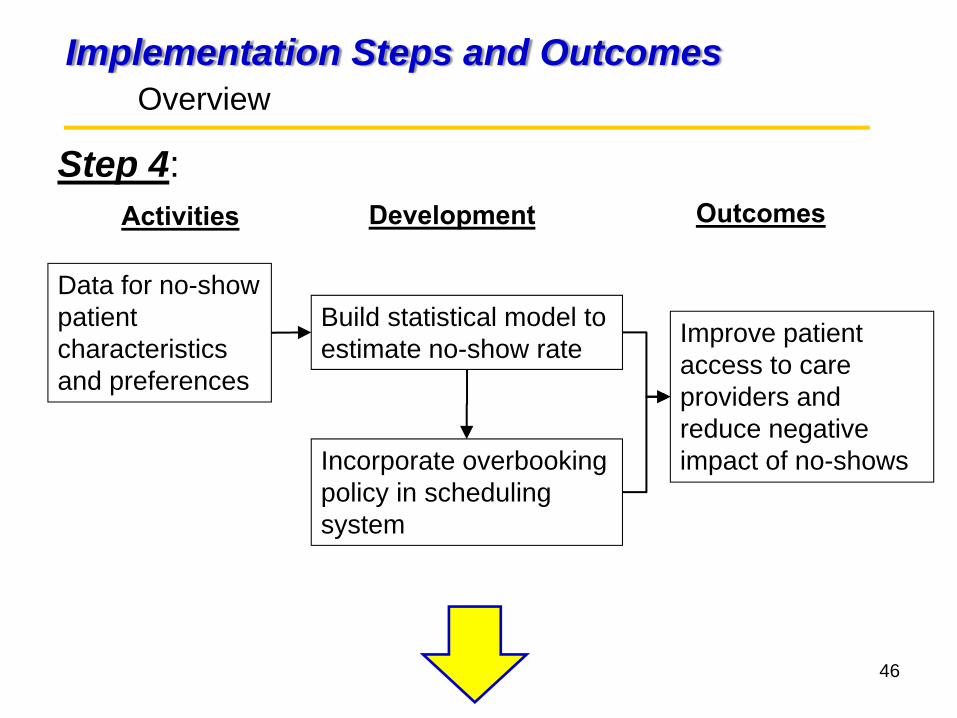
Step 4:
Data for no-show patient characteristics and preferences
Build statistical model to estimate no-show rate Improve patient
access to care providers and reduce negative impact of no-shows
Activities Development Outcomes
Incorporate overbooking policy in scheduling system

47
Implementation Steps and OutcomesOverview
Step 5:
Date for patient and physician wait time after implementation
Approach implementation in clinics
Enhance patient satisfaction and quality of care
Activities Development Outcomes

48
ConclusionContributions
Present the impact where the scheduled treatment times are not based on the actual data.
Understand the benefit and difference of wait ratio concept to the traditional cost ratio.
Provide step-by-step approach to develop physician and patient arrival schedules.
Implement the proposed solution for three clinics to further demonstrate the effectiveness and the simplicity of the approach.

49
5. ConclusionContributions
A cost-effective overbooking policy that accounts for individual patient’s no-show rate.
Change patients’ perception of long wait in a physician office.
Provide a better quality service in terms of patients’ waiting.
Create a much less stressful working environment for the medical staff.

50
Questions?
Please contact…


![Optimal outpatient appointment scheduling · analyzed appointment scheduling in various settings (see Cayirli and Veral [2] for an overview). Most of them use simulation to analyze](https://img.dokumen.tips/doc/110x75/5eda106eb3745412b570b2d3/optimal-outpatient-appointment-scheduling-analyzed-appointment-scheduling-in-various.jpg)