Embed Size (px)
Citation preview

Distribution limited to sponsor only.
An Analysis of Marine Corps
Female Recruit Training Attrition
December 2014
(b) (6)
(b) (6) (b) (6)
(b) (6) (b) (6)(b)
(6)
(b) (6)
(b) (6)

Copyright © 2014 CNA
This document contains the best opinion of CNA at the time of issue.
It does not necessarily represent the opinion of the sponsor.
Distribution
Distribution limited to sponsor only. Specific authority: N00014-11-D-0323.
Photography Credit: Recruits from negotiate
the “Run-Jump-Swing” on the Marine Corps Confidence Course. Marine Corps Recruit
Depot, Parris Island, SC, Oct. 3, 2012. (U. S. Marine Corps photo by L
Released)
Approved by: December 2014
Marine Corps Manpower Team
Resource Analysis Division
(b) (6)
(b) (6)
(b) (6)

i
Abstract
Over the past several years, the Department of Defense has asked the services to
pursue expanded opportunities for women in the military. To support this effort, the
Marine Corps started a deliberate and measured effort to examine the possible
integration of women into ground combat units and military occupational specialties
(MOSs) with the development of the Marine Corps Force Integration Plan (MCFIP). In
turn, the Marine Corps asked CNA to examine female recruit training attrition. We
examined the relationship between female recruit training attrition and four general
groups of factors: (1) recruit characteristics, (2) recruiter and recruiter/recruit
interaction characteristics, (3) recruiting substation leadership and management
metrics, and (4) shipping timing factors. Although recruit characteristics and
shipping timing factors continue to be the best predictors of female recruit training
success, we found some interesting relationships between attrition and (1) recruiter
and recruiter/recruit interaction characteristics and (2) recruiting substation
leadership/management metrics. These may merit additional examination in future
analyses.

ii
This page intentionally left blank.

iii
Executive Summary
As part of its effort to more fully integrate women into previously closed units and
military occupational specialties (MOSs), the Marine Corps asked CNA to examine
factors related to female recruit training attrition. Generally, the factors that are
related to male recruit training attrition are also related to female recruit training
attrition, although the relationships are not as consistently statistically significant
across time for women as they are for men. These less pronounced relationships
have made it difficult for the Marine Corps to target successful women. Also, the fact
that the Marine Corps generally enlists women with lower Armed Forces Qualification
Test (AFQT) and Initial Strength Test (IST) scores has contributed to a training
attrition rate for women that is consistently higher than that for men.1
Using data from the Marine Corps Recruiting Information Support System (MCRISS)
and Total Force Data Warehouse (TFDW), we examined female recruit training
attrition for recruits who accessed during two periods: Fiscal Year (FY) 2005 to FY
2008 (a more difficult recruiting period), and FY 2009 to FY 2013 (a less difficult
recruiting period). The literature is replete with evidence that the state of the
economy has significant effects on many recruiting outcomes, including recruit
training attrition. By segmenting the analysis, we can compare the attrition outcomes
from these two time periods; we see that they do in fact turn out to be quite
different.
Traditionally, analysts have used recruit characteristics and shipping timing factors
to predict recruit training attrition. We expand upon these two groups by including
variables that measure: (1) recruiter and recruiter/recruit interaction characteristics,
and (2) recruiting substation (RSS) leadership/management factors.2
1 Previous CNA analysis indicates that male and female recruits of similar physical ability have
more similar attrition rates.
2 We added these additional factor groups in response to Marine Corps Recruiting Command’s
request that we expand upon the characteristics and factors traditionally analyzed for recruit
training attrition.

iv
Key results within each factor group are as follows:
Recruit characteristics
o Tier I (and above) educational credentials and above-average AFQT scores
are related to lower female recruit training attrition.
o Female recruits who are 17 to 18 years old have lower attrition than older
female recruits for FY05-08; however, in FY09-13, we found no attrition
differences by age.
o Minority female recruits generally have lower attrition than white female
recruits. In FY09-13, however, all minority groups had significantly lower
attrition than white women. Non-citizen women also have significantly
lower attrition than citizens.
o Higher physical fitness levels as measured by the IST are related to lower
female recruit training attrition.
o The effect of a woman being under the minimum weight for her height or
over the maximum weight for her height (based on retention standards) at
accession had particularly interesting results. Although being under the
minimum weight is related to higher female recruit training attrition, being
above the maximum weight had a statistically significant negative effect on
female recruit training attrition. These results suggest that validation of
height and weight standards may be needed.
o Female recruits with open contracts (no specific enlistment guarantee) have
higher recruit training attrition than those assigned an enlistment program.
o There are only small attrition differences between women who have an
enlistment waiver and those who do not for FY05-08. For FY09-13, there is
no statistically significant difference.
o There are no consistent differences in attrition among female recruits with
different enlistment contract sources.
Recruiter and recruiter/recruit interaction characteristics
o Female recruits who are the same race/ethnicity and gender as their
recruiters do not have different attrition rates from those who are not the
same race/ethnicity and gender as their recruiters.

v
o Female recruits whose recruiters had a detectability code history (a code
that suggests possible irregularity in the enlistment process) for previous
recruit training discharges had higher attrition in FY09-13.
o “Pool orphans” (those who do not ship to recruit training until after their
recruiters have transferred from recruiting duty) have significantly higher
attrition while in the delayed entry program (DEP), but no significant
differences in their attrition during recruit training.
RSS leadership/management metrics
o We constructed five RSS-level metrics (IST improvement, quality
prospecting, DEP attrition, contract sources, and focus on female recruiting)
to assess how they are related to female recruit training attrition.
o The effects of these metrics were not statistically significant when other
factors were controlled; however, in the uncontrolled relationships, female
recruits from RSSs that did better in these five metrics have as much as 2.0
to 2.5 percentage points lower recruit training attrition.
o This suggests that future analyses may want to explore these factors
further.
Shipping timing factors
o Female recruits who ship in the summer have lower attrition than those
who ship in the fall, winter, or spring.
o Female recruits had lower attrition in the FY09-13 period, when the
unemployment rate was higher and recruiting was less difficult.
Our findings suggest that to reduce recruit training attrition, the Marine Corps
should continue to recruit women who: (1) are at least tier I high school diploma
graduates, (2) score well on the AFQT, and (3) are in good physical condition. We
recommend further analysis to validate female height and weight standards, and to
assess strategies for reducing pool orphan DEP attrition. We also believe that the RSS-
level leadership/management metrics findings are particularly relevant for female
recruiting due to the small number of women that a recruiting station accesses each
year. Although our findings in this regard are quite preliminary and more work is
needed to further explore these leadership/management metric effects, they could
ultimately suggest policies that could limit which RSSs within a recruiting station are
assigned female recruiting missions.

vi
This page intentionally left blank.

vii
Contents
Introduction ............................................................................................................................ 1
Data .......................................................................................................................................... 2
Methodology ........................................................................................................................... 3
Findings ................................................................................................................................... 5
Recruit characteristics .......................................................................................................... 5
Recruit aptitude/education and attrition ................................................................. 6
Recruit demographic characteristics and attrition ................................................. 8
Recruit physical fitness characteristics and attrition .......................................... 10
Other recruit characteristics and attrition.............................................................. 13
Recruiter and recruiter/recruit interaction characteristics ........................................ 16
RSS leadership/management metrics ............................................................................. 18
Shipping timing factors ..................................................................................................... 22
Recommendations and Conclusions ................................................................................ 23
Appendix A: Regression Results....................................................................................... 25
Appendix B: RSS Metrics and Male Recruit Training Attrition ................................... 35
References ............................................................................................................................. 36

viii
This page intentionally left blank.

ix
List of Tables
Table 1. Unemployment rates, recruit training attrition rates, and sample
sizes (FY05-08 and FY09-13) ......................................................................... 4 Table 2. Recruit characteristics (education/aptitude) and female recruit
training attrition (FY05-FY13) ....................................................................... 7 Table 3. Recruit characteristics (demographics) and female recruit training
attrition (FY05-FY13) ....................................................................................... 9 Table 4. Recruit characteristics (physical fitness) and female recruit
training attrition (FY05-FY13) ..................................................................... 11 Table 5. Recruit characteristics (other) and female recruit training attrition
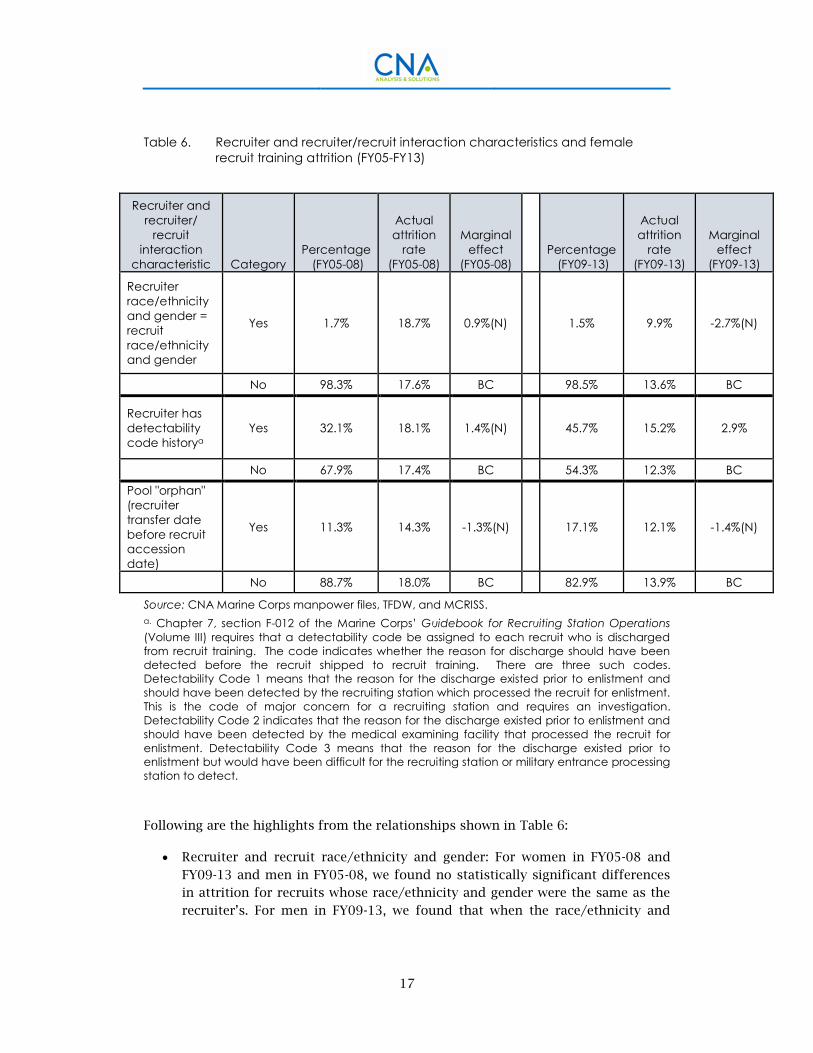
(FY05-FY13) ..................................................................................................... 13 Table 6. Recruiter and recruiter/recruit interaction characteristics and
female recruit training attrition (FY05-FY13) .......................................... 17 Table 7. RSS leadership/management metrics and female recruit training
attrition (FY05-FY13) ..................................................................................... 20 Table 8. Shipping timing factors and female recruit training attrition (FY05-
FY13) ................................................................................................................. 22 Table 9. Logit regression results for female recruit training attrition (FY05-
08 and FY09-13) ............................................................................................. 25 Table 10. Logit regression results for male recruit training attrition (FY05-08
and FY09-13) ................................................................................................... 30 Table 11. RSS leadership/management metrics and male recruit training
attrition (FY05-FY13) ..................................................................................... 35

x
This page intentionally left blank.

xi
Glossary
AFQT Armed Forces Qualification Test
BC Base Case
CFT Combat Fitness Test
DEP Delayed Entry Program
FAH Flexed-Arm Hang
FY Fiscal Year
IST Initial Strength Test
MCFIP Marine Corps Force Integration Plan
MCRISS Marine Corps Recruiting Information Support System
MOS Military Occupational Specialty
NH Non-Hispanic
PEF Program Enlisted For
PFT Physical Fitness Test
PPC Priority Prospect Card
RSS Recruiting Substation
TFDW Total Force Data Warehouse

xii
This page intentionally left blank.

1
Introduction
As part of its ongoing research and analysis related to the integration of women into
previously closed military occupational specialties (MOSs) and units, the Marine
Corps has asked CNA to analyze female recruit training attrition in order to improve
the Marine Corps’ understanding of the characteristics and factors that lead to
success.
CNA has, over many years, developed a substantial literature that identifies the
characteristics and factors that are related to Marine Corps recruit training attrition.
This literature has been particularly successful in identifying the characteristics and
factors that are related to male recruit training attrition. Successful male recruits:
Score at the 50th percentile or above on the Armed Forces
Qualification Test (AFQT)
Earn tier I high school diplomas (excluding tier I credentials
earned through adult education, semester/quarter hours of
college, or home schooling)
Have no enlistment waivers
Are within height and weight standards
Have good physical fitness as measured by the Initial Strength
Test (IST), which includes pull-ups, crunches, and a 1.5-mile run
Are young (typically 17 to 18 years of age and accessed directly
after high school)
Ship to recruit training in the summer, and
Have had at least three months in the Delayed Entry Program
(DEP) to prepare for recruit training. [1]
Although analysts have found that many of these same characteristics are related to
female recruit training success, the relationships are not as consistently statistically
significant across time as they are for male recruits. These less pronounced
relationships have made it difficult for the Marine Corps to target successful women.
Also, the fact that the Marine Corps generally accesses women with lower AFQT and

2
IST scores has no doubt contributed to the Marine Corps’ enduring result in recruit
training attrition: female recruits attrite at roughly double the rate of male recruits.
Beyond recruit training attrition, female recruiting has historically been more
challenging and problematic than male recruiting, as evidenced by higher female DEP
attrition and lower efficiency in converting prospecting activities into female
enlistment contracts.
Traditional hypotheses that recruit training success is related to recruit
characteristics and shipping-related factors (e.g., what time of the year the recruit
was accessed) have been driven, to some extent, by data availability. We improve
upon previous analyses by incorporating additional data sources (described below)
that allow us to expand these traditionally analyzed characteristics and factors. Our
additions include recruiter characteristics (and the interaction of these
characteristics with those of the recruit), and local recruiting
leadership/management metrics.3
We also will examine factors that are seemingly more closely related to DEP attrition
to determine if they might have persistent effects that manifest themselves in recruit
training attrition. For example, when recruiters transfer from recruiting duty before
their recruits ship to recruit training, those recruits are commonly referred to as
“pool orphans.” Other recruiters take over leadership responsibilities for these
recruits, to prevent them from losing their motivation; however, these recruits may
still attrite from the DEP at a significantly higher rate than those who are not pool
orphans. It could be that, even when pool orphans still ship to recruit training, they
may do so with lower levels of motivation and preparation because their connections
to the Marines who recruited them have been disrupted. Alternatively, pool orphans
who stay in the DEP and ship to recruit training may be especially committed to
becoming Marines and may have lower attrition, other things being equal.
Data
The data are primarily extracted from the Marine Corps Recruiting Information
Support System (MCRISS) and include nearly 22,000 female accessions between FY
2005 and FY 2013. Some recruiter information is available in MCRISS; however, we
were able to match MCRISS recruiter data to Marine Corps Total Force Data
Warehouse (TFDW) data in order to obtain more complete recruiter characteristics.
3 We added these variable groups in response to Marine Corps Recruiting Command’s request
to expand the factors traditionally analyzed for recruit training attrition. Also, this hypothesis
could be further expanded to include drill instructor characteristics and recruit training
leadership and management factors; however, these data are not yet captured in a way that
allows us to test this more expansive hypothesis.

3
Methodology
We measure female recruit training outcomes using attrition from recruit training as
an indicator variable; this variable takes a value of one if the recruit attrites and zero
if she does not. Our explanatory factors fall into the following groups, which are
further defined in the next section of this report:
Recruit characteristics
Recruiter and recruiter/recruit interaction characteristics
Recruiting substation (RSS) leadership/management metrics4
Shipping timing factors.
We use two approaches to measure the relationship between female recruit training
attrition and these explanatory variables. First, we compute the female recruit
training attrition rate for each variable category without controlling for the effects of
other variables.
Second, we measure the relationship between female recruit training attrition and the
explanatory variables using the logit regression technique.5 This measurement
approach enables us to estimate the effect of one explanatory variable on female
recruit training attrition while holding the effects of all other explanatory variables
constant.
4 We selected the RSS level to use for assessing organizational leadership and management
because this is the primary level at which recruits are exposed to and interact with recruiting
leaders. There are typically 10 to 14 RSSs in each recruiting station—each is led by a staff non-
commissioned officer-in-charge and has two to six recruiters assigned to it.
5 The logit regression technique allows us to estimate the relationship of explanatory variables
to a limited dependent variable (0 or 1) using a non-linear functional form.

4
In addition, we measure the relationship for two time periods—a more difficult
recruiting period (FY05-08) and a less difficult recruiting period (FY09-13)—that
largely are differentiated by macroeconomic conditions (i.e., the unemployment rate
for 16- to 24-year-olds).6 The literature is replete with evidence that the state of the
economy has significant effects on many recruiting outcomes, including recruit
training attrition. By segmenting the analysis, we can see that these two time periods
do have quite different attrition outcomes.
Table 1 shows the unemployment rates, recruit training attrition rates, and sample
sizes for the two periods we examined. For FY05-08, there are 9,077 female recruits,
with an overall 17.6 percent attrition rate; for FY09-13, there are 11,775 female
recruits, with an overall 13.6 percent attrition rate. We also measure the relationships
for male recruits, to assist with comparisons of men and women. For FY05-08, there
are 119,231 male recruits, with an overall attrition rate of 9.2 percent; for FY09-13,
there are 125,574 male recruits, with an overall attrition rate of 6.7 percent.
Table 1. Unemployment rates, recruit training attrition rates, and sample sizes
(FY05-08 and FY09-13)
Women Men
FY05-08 FY09-13 FY05-08 FY09-13
Unemployment rate (16- to 24-year-olds) 10.8% 16.1% 10.8% 16.1%
Recruit training attrition rate 17.6% 13.6% 9.2% 6.7%
Sample size 9,077 11,775 119,231 125,574
Source: CNA Marine Corps manpower files, MCRISS, and the Current Population Survey.
6 The youth unemployment rate could have been introduced as a separate variable; if so, we
would have included it in shipping timing factors. Instead, we chose to introduce the
unemployment rate by segmenting our analysis based on substantially different
macroeconomic conditions as indicated by the unemployment rates for 16- to 24-year-olds.
Labor force statistics from the Current Population Survey show that the monthly
unemployment rate for 16- to 24-year-olds ranged from 9.1 percent to 14.4 percent from FY05
to FY08 (most months were in the 10 to 11 percent range). For FY09 to FY13, the rate ranged
from 11.9 percent to 20.0 percent (most months were in the 16 to 17 percent range).

5
Findings
In this section, we discuss the relationships of female recruit training attrition to
each of the characteristics in our four factor groups. For comparison, we also provide
selected male recruit training attrition rates. (The complete regression results for
both women and men are provided in Table 9 and Table 10 in appendix A.)
Recruit characteristics
We display the relationship between recruit characteristics and female recruit
training attrition in four factor groups:
Education/aptitude (Table 2)
Demographics (Table 3)
Physical fitness (Table 4), and
Other characteristics (Table 5)
In the table headings, the percentage shows the share of the sample that is in that
category. The actual attrition rates are those for which there are no controls for other
variable effects. The marginal effect shows the percentage-point change in female
recruit training attrition relative to the base case (BC) (i.e., omitted variable category)
when all other variables/categories are at their mean values.7 In Table 2, for example,
women with some college who accessed in FY05-08 represented 1.1 percent of the
sample, had an actual attrition rate without controlling for other effects of 7.7
percent, and had 10 percentage points lower (statistically significant) recruit training
attrition than those women who were only tier I graduates (the base case).
Most of the characteristics in Table 2 through Table 5 are self-explanatory or have
amplifying information in the table footnotes; however, the contract source variable
7 In cases where the marginal effect is not statistically significant at the 10 percent level or
lower, we have so indicated by including (N) after it. The marginal effects displayed in Table 2
through Table 5 correspond to the derivatives presented in the technical results in Table 9 of
Appendix A.

6
in Table 5 may be less familiar.8 Contract source identifies how the recruiter
identified the applicant during the prospecting process. Contract sources can be
broadly categorized into those that are recruiter generated (the recruiter found the
applicant on his or her own, through area canvassing or using a high school list) and
those that are generated through other recruiting programs. These other recruiting
programs include:
Command recruiter (e.g., a Marine who is home on leave refers an applicant to
the recruiter)
DEP referral (i.e., a member of the DEP refers an applicant to the recruiter)
Priority prospect card (PPC) (i.e., the recruiter receives a lead from the Marine
Corps’ “hot lead” system that is tied to its advertising and marketing program)
Walk-/call-in (i.e., an applicant walks or calls into the recruiting office), and
Other (other sources are identified in footnote c of Table 5).
Generally, a good balance of contract sources indicates that recruiters are using all
available programs to identify prospects. We will explore the effects of that balance
in Table 7 at the RSS level; meanwhile, in Table 5 we assess the relationship between
a recruit’s contract source and her probability of attriting from recruit training.
Recruit aptitude/education and attrition
Table 2 displays the relationship between female recruit aptitude and education
characteristics and female recruit training attrition.
8 We found no references in the literature to analysis of contract source and its relationship to
recruit training attrition. We include it in this analysis at the request of Marine Corps
Recruiting Command.

7
Table 2. Recruit characteristics (education/aptitude) and female recruit training
attrition (FY05-FY13)
Recruit
characteristic Category
Percentage
(FY05-08)
Actual
attrition
rate
(FY05-08)
Marginal
effect
(FY05-08)
Percentage
(FY09-13)
Actual
attrition
rate
(FY09-13)
Marginal
effect
(FY09-13)
Educationa College 1.1% 7.7% -10.0% 1.6% 10.0% -2.0% (N)
Tier I 91.4% 17.3% BC 93.7% 13.4% BC
Tier I other 5.5% 20.8% 2.2% (N) 4.4% 17.0% 2.7%
Tier II or III 1.9% 27.0% 6.1% 0.3% 29.7% 11.5%
AFQT score
categoryb I-IIIA 64.1% 16.7% BC 68.9% 13.2% BC
IIIB/IV 35.9% 19.3% 2.0% 31.1% 14.5% 1.2%
Source: CNA Marine Corps manpower files and MCRISS.
a. College includes those recruits who have attained any level of post-secondary
education. Tier I education status includes traditional high school diploma graduates. Tier I
other includes recruits who have attained tier I status through adult education programs,
completion of 12 or more college semester hours or 18 or more college quarter hours, or
home schooling. We categorize tier I and tier I other separately because previous CNA
work has indicated that recruit attrition for tier I other is higher than for tier Is. Tier II and III
education status indicates that the recruit is a high school dropout—tier II recruits have
various alternative education credentials short of a high school diploma (e.g., GED).
b. AFQT score category I-IIIA includes recruits who scored at the 50th percentile or above on
the AFQT. Those in AFQT score category IIIB scored in the 31st to the 49th percentile, and
those in AFQT category IV scored in the 21st to the 30th percentile. We combined AFQT
categories IIIB and IV because of the very small number of category IV recruits and
because category IIIB and IV recruits had similar attrition rates.
The following highlights the relationship between recruit characteristics examined in
Table 2 and recruit training attrition when the effects of other factors are held
constant.9
Education: In FY05-08, women with some college had 10.0 percentage points
lower attrition than those with a tier I credential; however, in FY09-13, the
differences in attrition were not statistically significant. In FY05-08, those with
a tier I other credential did not have statistically significant differences in
attrition compared to those who were tier Is; however, in FY09-13, tier I others
had 2.7 percentage points higher attrition than tier Is. In both time periods,
tier IIs and IIIs had higher attrition than tier Is: they had 6.1 percentage points
9 Unless otherwise indicated, differences cited are statistically significant.

8
higher in FY05-08, and 11.5 percentage points in FY09-13. By comparison, men
have statistically significant differences among all education categories across
both time periods. We also note that during both periods, the Marine Corps
enlisted a lower share of women with tier II/III education credentials (1.9 and
.3 percent, respectively) than men (4.4 and .5 percent, respectively).
AFQT score category: Women who scored in AFQT categories IIIB or IV had 2
percentage points higher attrition than those scoring in categories I-IIIA in
FY05-08. This difference drops to 1.2 percentage points for FY09-13 but
remains statistically significant. These effects are generally consistent with
those for male recruits within the same periods. In addition, we note that
during FY05-08 and FY09-13, the Marine Corps enlisted a higher share of
women with AFQT score categories IIIB and IV (35.9 and 33.0 percent,
respectively) than men (31.1 and 26.9 percent, respectively). Although the
percentage of low-quality female recruits (as measured by AFQT) went down in
better recruiting conditions, the percentage reduction for women was less than
that for men. This suggests that even in the less difficult recruiting period,
female recruiting was still more challenging than male recruiting.
Recruit demographic characteristics and attrition
Table 3 displays the relationship between female recruit demographic characteristics
and female recruit training attrition.

9
Table 3. Recruit characteristics (demographics) and female recruit training attrition
(FY05-FY13)
Recruit
characteristic Category
Percentage
(FY05-08)
Actual
attrition
rate
(FY05-08)
Marginal
effect
(FY05-08)
Percentage
(FY09-13)
Actual
attrition
rate
(FY09-13)
Marginal
effect
(FY09-13)
Accession
age 17-18 51.0% 15.4% BC 47.1% 12.6% BC
19-23 44.5% 19.8% 1.5% 47.9% 14.5% -0.1% (N)
24+ 4.6% 20.7% 4.5% 5.0% 14.2% -0.2% (N)
Race/ethnicity
Non-
Hispanic
(NH) white
59.1% 19.3% BC 54.7% 15.9% BC
NH black 13.9% 18.3% -1.9% (N) 14.2% 12.8% -3.7%
Hispanic 21.0% 12.5% -6.8% 25.2% 9.4% -6.1%
Asian 3.5% 17.9% -0.8% (N) 3.6% 11.2% -4.5%
Other 2.5% 17.1% -3.6% (N) 2.3% 13.9% -3.8%
Non-citizen Yes 3.7% 10.0% -7.3% 3.1% 7.6% -5.3%
No 96.3% 17.9% BC 96.9% 13.8% BC
Married or
dependents
at accession
Yes 5.9% 20.7% 2.2% (N) 3.2% 17.6% 2.7% (N)
No 94.1% 17.4% BC 96.8% 13.4% BC
Source: CNA Marine Corps manpower files and MCRISS.
The following highlights the relationship between the recruit characteristics
examined in Table 3 and recruit training attrition when the effects of other factors
are held constant.
Accession age: In FY05-08, women who were 19 to 23 years old had higher
attrition than those 17 to 18 years of age by 1.5 percentage point. This
difference jumps to 4.5 percentage points for those 24 years of age or older. In
FY09-13, women in these two older age groups did not have statistically
significant differences in attrition from those who were 17 to 18 years old. One
possible explanation for this absence of differences in attrition is that
commanders may have more closely reviewed enlistments for older women
during less difficult recruiting times, knowing that older women attrite at
higher rates. This seems unlikely, however, because the percentage of women
in these two older groups actually increased somewhat in FY09-13, which
suggests that such enlistments were likely not discouraged during this period.

10
By comparison, the attrition rates of male recruits have statistically significant
differences among all age groups across both time periods; those who are
older have higher attrition.
Race/ethnicity: In FY05-08, Hispanic women had lower attrition than white
women by 6.8 percentage points, but there were no statistically significant
differences in attrition between those in all other racial/ethnic categories and
white women. This result changed considerably in FY09-13. Women in all other
racial/ethnic categories had lower attrition than white women: 6.1 percentage
points lower for Hispanics, 4.5 percentage points for Asians, 3.7 percentage
points for African Americans, and 3.8 percentage points for others. For men
during both periods, Hispanics and Asians both had lower attrition than
whites. There were no statistically significant differences between the attrition
of African Americans and others and the attrition of whites. We also note that
the percentage of minority female and male accessions increased by 4.4 and
3.8 percentage points, respectively, between these two periods.
Citizenship: Non-citizen women had 7.3 and 5.3 percentage points lower
attrition than those who were citizens in FY05-08 and FY09-13, respectively.
Non-citizen men also had lower attrition than citizens, but the effects were
smaller (2.1 and 1.5 percentage points, respectively, for the two time periods).
Married or dependents: The differences in attrition between women who were
married or had dependents and those who were not married or had no
dependents were not statistically significant in both time periods. Men who
were married or had dependents did have slightly higher attrition (.6 for FY05-
08 and .7 percentage points for FY09-13) than those who were not married or
did not have dependents.
Recruit physical fitness characteristics and attrition
Table 4 displays the relationship between female recruit physical fitness
characteristics and female recruit training attrition.

11
Table 4. Recruit characteristics (physical fitness) and female recruit training attrition
(FY05-FY13)
Recruit
characteristic Category
Percentage
(FY05-08)
Actual
attrition
rate
(FY05-08)
Marginal
effect
(FY05-08)
Percentage
(FY09-13)
Actual
attrition
rate
(FY09-13)
Marginal
effect
(FY09-13)
First DEP IST
scorea <154 39.1% 23.4% 5.9% 29.7% 18.3% 3.7%
155-200 32.9% 16.7% BC 33.6% 13.3% BC
201-300 28.0% 10.6% -5.5% 36.7% 10.0% -2.3%
First DEP IST
run time 13+ minutes 66.0% 19.7% 2.0% 63.1% 16.1% 4.6%
<13 minutes 34.0% 13.4% BC 36.9% 9.2% BC
Retention
height and
weight
standards at
accession
Meet 87.7% 17.2% BC 88.6% 13.4% BC
Over 6.3% 18.1% -1.9% (N) 5.7% 10.8% -3.8%
Under 6.0% 22.4% 6.0% 5.7% 18.9% 6.1%
Source: CNA Marine Corps manpower files and MCRISS.
a. We scale the IST score to have a maximum value of 300, the same as the maximum
score for the Marine Corps physical fitness test (PFT). For the crunches and pull-up/FAH
components, the score for the IST is computed exactly the same as for the PFT, with a
maximum of 100 points in each component; however, unlike the computation of PFT
scores, there is no lower bound of 3 pull-ups (15 points), 40 crunches (40 points), and 15
seconds (15 points) on the FAH. For the 1.5-mile run, a time of 9 minutes or less for men and
10.5 minutes or less for women is given 100 points, with one point deducted for each
additional five seconds over the respective 9-minute and 10.5-minute thresholds. The score
categories roughly separate scores into thirds.
The following highlights the relationship between the recruit characteristics
examined in Table 4 and recruit training attrition when the effects of other factors
are held constant.
First IST performance: In both time periods, women who scored better on their
first IST in DEP had lower recruit training attrition. Compared to those scoring
in roughly the middle third (i.e., 155-200 points), those scoring lower had 5.9
percentage points higher attrition in FY05-08 and 3.7 percentage points higher
attrition in FY09-13. Those scoring higher than the middle third had 5.5
percentage points and 2.3 percentage points lower attrition in FY05-08 and

12
FY09-13, respectively. These results are consistent with those for men.10 In
addition, we also analyzed how the three individual events of the IST are
related to recruit training attrition and found that the run time is the most
consistent predictor of attrition among the three. Women who ran 1.5 miles at
13:00 or slower had 2.0 and 4.6 percentage points higher attrition in FY05-08
and FY09-13, respectively. These results also are consistent with those for
men. We also note the following with respect to female and male IST scores in
these two periods:
o The percentage of women who scored in the top IST category improved
from 28.0 to 36.7 percent from FY05-08 to FY09-13. The percentage for
men increased by an even greater margin—from 30.6 to 44.3 percent. More
favorable recruiting conditions appear to have allowed recruiters to select
more physically fit female and male applicants, who then graduated from
recruit training at higher rates; however, the share of women in the highest
fitness category lagged behind that for men in both periods and increased
less with improved recruiting conditions. This suggests that even in a less
difficult recruiting period, recruiting women was still more challenging than
recruiting men.
o The lower female IST scores discussed above indicate that women were less
physically fit than men at the starting point. Thus, in addition to being
related to higher recruit training attrition, these lower IST scores also are
related to higher recruit training injury rates, higher 24- and 45-month
attrition rates, and lower PFT and combat fitness test (CFT) scores. [2]
Retention height and weight standards: Women who weighed less than the
minimum weight standard for their height (based on retention standards)
when they accessed had 6.0 and 6.1 percentage points higher attrition rates,
respectively, for FY05-08 and FY09-13 compared to women who met height
and weight standards. Women who weighed more than the maximum weight
for their height in FY05-08 had no statistically significant differences in
attrition compared to those who met height and weight standards; however,
for FY09-13, women who were over standards had 3.8 percentage points lower
attrition than those who met the standards. This is a particularly interesting
result as it could indicate that height and weight standards for women may
need validation. It could be that women of larger stature are better able to
endure the challenges of recruit training, and that those of smaller stature are
more prone to injury and, ultimately, attrition. This assertion is consistent
10 Although we used the same IST score ranges to create IST categories for our regressions for
men and women, we note that the scores are gender-normed and therefore not directly
comparable.

13
with [3] (recently cited in [4]), “Greater height, hip circumference, and overall
weight also appeared to be correlated with shorter march times under very
heavy loads (90 pounds, or about 67 percent of the average female
participant’s body weight).11 We found similar results for men.12 Men who were
under the weight standards when they accessed had approximately 4.2
percentage points higher attrition in both time periods as compared with those
who met standards. One particularly surprising result is that men who were
over standards in FY05-08 did not have a statistically significant different
attrition rate compared to those who met standards. Previous research,
particularly during difficult recruiting periods, has found that those who are
over standards attrite at higher rates. Even more surprising is that men who
were over standards in FY09-13 had a 0.9 percentage point lower attrition rate
than those who met standards. This may suggest that during less difficult
recruiting times, commanders allowed those who were above retention
standards to ship to recruit training only if they were otherwise highly
qualified recruits.
Other recruit characteristics and attrition
Table 5 displays the relationship between “other” female recruit characteristics and
female recruit training attrition.
Table 5. Recruit characteristics (other) and female recruit training attrition (FY05-
FY13)
Recruit
characteristic Category
Percentage
(FY05-08)
Actual
attrition
rate
(FY05-08)
Marginal
effect
(FY05-08)
Percentage
(FY09-13)
Actual
attrition
rate
(FY09-13)
Marginal
effect
(FY09-13)
DEP months 3+ 57.1% 15.3% -1.3% (N) 65.8% 12.8% -0.7% (N)
<3 42.9% 20.6% BC 34.2% 15.2% BC
Open
contracta Yes 8.7% 22.1% 3.0% 8.6% 16.4% 3.0%
No 91.3% 17.2% BC 91.4% 13.3% BC
11 These characteristics may, however, be at odds with the Marine Corps’ plan to require female
Marines to do pull-ups for the PFT.
12 Note that Marine Corps height and weight standards are gender-normed.

14
Recruit
characteristic Category
Percentage
(FY05-08)
Actual
attrition
rate
(FY05-08)
Marginal
effect
(FY05-08)
Percentage
(FY09-13)
Actual
attrition
rate
(FY09-13)
Marginal
effect
(FY09-13)
Enlistment
waiver Yes 41.3% 20.0% 2.2% 25.2% 14.8% -0.1% (N)
No 58.7% 15.9% BC 74.8% 13.2% BC
Contract
source DEP referral 25.0% 16.3% -1.6%(N) 23.9% 12.1% -2.0%
PPC 10.8% 18.7% -0.4%(N) 11.4% 14.5% 0.0%(N)
Command
recruiter 19.0% 17.1% -2.4% 14.8% 13.1% -1.5%(N)
Recruiter-
generatedb 33.9% 18.9% BC 36.1% 14.2% BC
Walk-/call-
in 6.6% 16.3% -4.2% 7.8% 16.8% 2.1%
Otherc 4.7% 16.0% -3.6% 6.0% 11.1% -3.3%
Source: CNA Marine Corps manpower files and MCRISS.
a. Open contract means that the recruit has no enlistment guarantee. Traditionally, this was
indicated by an absence of a program enlisted for (PEF), which is an enlistment program
that guarantees that a recruit will be classified into one of a group of related MOSs for
which he or she is qualified. Starting in FY09, open contract became its own PEF. There are,
however, small numbers of recruits from FY09 and beyond who have no open contract (or
any other) PEF—we considered these recruits as having open contracts.
b. Recruiter-generated contract sources include: (1) area canvassing, (2) list canvassing,
and (3) local mail back.
c. Other includes: (1) Marine Corps Reserve referrals, (2) reenlistment card, (3) prior service
recruiter, (4) temporary additional duty officer selection officer, and (5) other.
The following highlights the relationship between the recruit characteristics
examined in Table 5 and recruit training attrition when the effects of other factors
are held constant.
Time in the DEP: Women who had three or more months in the DEP did not
have attrition differences from those with less DEP time. This result is
consistent across both time periods and is at odds with the results for men—
men with three or more months in DEP have statistically significant lower
attrition during both periods. We note, however, that the percentages of
women and men shipping with three or more months in DEP in FY05-08
compared to those percentages in FY09-13 are strikingly different. For women,
57.1 percent shipped with three or more months of DEP time in FY05-08 but,
despite the significant improvement in recruiting conditions in FY09-FY13,
that percentage only increased to 65.8 percent. For men, the percentage rose
from 57.0 percent to 82.6 percent. This indicates that, even in the most

15
favorable recruiting conditions in the All-Volunteer Force era, recruiters still
struggled to develop the female DEP, shipping nearly 35 percent of all women
with less than three months of DEP time.13
Open contract: Women with an open contract had 3.0 percentage points higher
attrition in both FY05-08 and FY09-13. These results are consistent with those
for men during the same periods; however, approximately 9 percent of women
ship with an open contract whereas only about 5 percent of men do. This could
be related to an insufficient supply of traditional female enlistment programs
(e.g., administration) which could cause recruiters to encourage female recruits
to take their chances for getting their MOS preferences through open
contracts. It also could be related to male recruits having higher AFQT scores
than women which may result in men having higher enlistment program
qualification rates than women.
Enlistment waivers: We used having a waiver (or waivers) instead of waiver
type to estimate the effect on attrition because we found in our preliminary
analysis that across virtually all waiver types, the relationships were roughly
the same (those with waivers attrited at higher percentages than those
without).14 In FY05-08, women with a waiver had 2.2 percentage points higher
attrition than women without a waiver; however, the difference between
attrition rates for those with and without a waiver in FY09-13 was not
statistically significant. For men with a waiver, we found no statistically
significant differences in attrition for FY05-08, but in FY09-13 those with a
waiver had slightly higher attrition (0.4 percentage point).
Contract source: For FY05-08, we found that women whose contract source
was command recruiter, walk-/call-in, or “other” had lower attrition than those
whose source was recruiter generated. Attrition was 2.4 percentage points
lower for command recruiter, 4.2 percentage points lower for walk-/call-in, and
3.6 percentage points lower for “other.” Those whose contract source was pool
referral or PPC did not have statistically significant differences in attrition
from those whose source was recruiter generated. For FY09-13, the results
were different. Compared to those whose contract source was recruiter
generated, those whose source was pool referral or “other” had lower
attrition—2.0 and 3.3 percentage points, respectively. Those whose contract
13 We also did some initial investigation of whether women who were shipped early to fill
vacant shipping slots attrited at higher levels—we found no differences in attrition for these
recruits.
14 The felony waiver category was the only waiver category for which waivered recruits had
lower attrition (when other factors were not controlled for). The number of these waivers is,
however, too small to provide reliable attrition estimates. Further, these recruits would have
received significant scrutiny in the waiver process and been otherwise very highly qualified.

16
source was walk-/call-in had 2.1 percentage points higher attrition than those
whose source was recruiter generated. Those whose source was command
recruiter or PPC did not have statistically significant differences in attrition
compared to those with a recruiter-generated source. For men in FY05-08,
those with a contract source of command recruiter or pool referral had slightly
(less than one percentage point) lower recruit training attrition than those with
a recruiter-generated source—attrition differences for other contract sources
were not statistically significant. In FY09-13, men with a contract source of
command recruiter, pool referral, or “other” had slightly lower attrition (less
than one percentage point but statistically significant) than those whose
contract source was recruiter generated. Those whose source was PPC or
walk-/call-in had no statistically significant differences in their attrition
compared to those whose source was recruiter generated. We also investigated
a conventional adage that a higher percentage of women have a contract
source of walk-/call-in than men, and found that the percentages were quite
similar. For FY05-08, 6.6 percent of women and 6.1 percent of men were walk-
/call-ins, and in FY09-13, 7.8 percent of women and 7.6 percent of men were
walk-/call-ins.
Recruiter and recruiter/recruit interaction
characteristics
Table 6 shows the relationship between recruiter and recruiter/recruit interaction
characteristics and female recruit training attrition.15, 16
15 Each recruit’s MCRISS record includes his or her recruiter’s identifying information, which
allowed us to match the recruit’s record to recruiter characteristics from the TFDW.
16 We also explored recruiter rank (as a proxy for leadership experience) and recruiter PFT score
(as a proxy for setting an example) but found that variation in these factors did not have
reliable or stable relationships to variation in female recruit training attrition. Further, we
explored the relationship between the distribution of a recruiter’s contract type and female
recruit training attrition. Discussions with several current and previous district commanders
revealed some conjecture that the best recruiters tend to focus on the primary contract type:
regular component, tier I, AFQT score category I-IIIA men. They further conjectured that less
effective recruiters tend to focus more on other contract types and that perhaps recruits
enlisted by these recruiters have less success in recruit training. Our analysis does not support
this conjecture and, thus, we have not included the associated variable in our final regression
results.
17
Table 6. Recruiter and recruiter/recruit interaction characteristics and female
recruit training attrition (FY05-FY13)
Recruiter and
recruiter/
recruit
interaction
characteristic Category
Percentage
(FY05-08)
Actual
attrition
rate
(FY05-08)
Marginal
effect
(FY05-08)
Percentage
(FY09-13)
Actual
attrition
rate
(FY09-13)
Marginal
effect
(FY09-13)
Recruiter
race/ethnicity
and gender =
recruit
race/ethnicity
and gender
Yes 1.7% 18.7% 0.9%(N) 1.5% 9.9% -2.7%(N)
No 98.3% 17.6% BC 98.5% 13.6% BC
Recruiter has
detectability
code historya
Yes 32.1% 18.1% 1.4%(N) 45.7% 15.2% 2.9%
No 67.9% 17.4% BC 54.3% 12.3% BC
Pool "orphan"
(recruiter
transfer date
before recruit
accession
date)
Yes 11.3% 14.3% -1.3%(N) 17.1% 12.1% -1.4%(N)
No 88.7% 18.0% BC 82.9% 13.9% BC
Source: CNA Marine Corps manpower files, TFDW, and MCRISS.
a. Chapter 7, section F-012 of the Marine Corps’ Guidebook for Recruiting Station Operations
(Volume III) requires that a detectability code be assigned to each recruit who is discharged
from recruit training. The code indicates whether the reason for discharge should have been
detected before the recruit shipped to recruit training. There are three such codes.
Detectability Code 1 means that the reason for the discharge existed prior to enlistment and
should have been detected by the recruiting station which processed the recruit for enlistment.
This is the code of major concern for a recruiting station and requires an investigation.
Detectability Code 2 indicates that the reason for the discharge existed prior to enlistment and
should have been detected by the medical examining facility that processed the recruit for
enlistment. Detectability Code 3 means that the reason for the discharge existed prior to
enlistment but would have been difficult for the recruiting station or military entrance processing
station to detect.
Following are the highlights from the relationships shown in Table 6:
Recruiter and recruit race/ethnicity and gender: For women in FY05-08 and
FY09-13 and men in FY05-08, we found no statistically significant differences
in attrition for recruits whose race/ethnicity and gender were the same as the
recruiter’s. For men in FY09-13, we found that when the race/ethnicity and

18
gender were the same, attrition was slightly (less than 0.3 percentage points)
higher.
Recruiter detectability code history: For FY05-08, women whose recruiter had a
detectability code history did not have statistically significant attrition
differences; however, in FY09-13, those whose recruiter had a detectability
code history had 2.9 percentage points higher attrition. For men in both time
periods, attrition was slightly higher for those men whose recruiter had a
detectability code history (1.7 and 0.6 percentage points, respectively, for the
two periods).
Pool orphan: Although the DEP discharge rate for pool orphans is particularly
high for women (and men),17 those who do ship to recruit training do not have
statistically significant differences in attrition from those who are not pool
orphans. For men, we found differences in attrition only in FY05-08: pool
orphans had 1.0 percentage point lower attrition than non-orphans. These
findings suggest that pool orphans who do not attrite from the DEP may have
higher levels of commitment that transcend the recruiter/recruit relationship.
RSS leadership/management metrics
The Marine Corps has long emphasized that “leadership matters.” Therefore, we
attempted to measure the relationship between metrics that indicate how well an RSS
is being led/managed and female recruit training attrition. Our hypothesis is that
effective RSS leadership and management result in persistent effects that can be
observed throughout the recruit training process. We estimate RSS
leadership/management effects associated with the following recruiting
activities/processes and the metrics we have constructed to measure them:18
RSS quality prospecting: We measure this by computing the RSS’s percentage
of waivered recruits that enlisted in the year prior to the recruit’s contract
date. Lower percentages of waivered recruits suggest that recruiters are
17 Preliminary analysis of FY05 through FY13 DEP discharge rates (not controlling for other
factors) shows that female pool orphans had a 38.4-percent DEP attrition rate, compared to
24.5 percent for non-orphans. Male pool orphans had a 25.8-percent DEP attrition rate,
compared to 17.8 percent for non-orphans.
18 Although Marine Corps Recruiting Command uses many metrics to measure RSS
performance, we were limited to metrics that we could create by aggregating individual recruit
information at the RSS level (i.e., the recruit’s record includes the RSS from which he or she was
recruited).

19
prospecting for high-quality applicants, which we would expect to reduce
female recruit training attrition.
RSS pool leadership, sales effectiveness, and service after the sale: We measure
this by computing the RSS’s DEP discharge rate for the year preceding the
recruit’s contract date. Lower DEP discharge rates suggest good pool
leadership and sales training, which we would expect to reduce female recruit
training attrition.
RSS adherence to systematic recruiting: We measure this by computing the
percentage of the RSS’s recruits that enlisted in the year prior to the enlistment
of the recruit whose contract source is recruiter generated.19 Lower percentages
suggest that recruiters are effectively using the full array of supporting
systematic recruiting programs (pool referrals, command recruiters, PPCs, etc.)
to generate prospects. Thus, we expect lower recruit training attrition when the
percentage of recruits with a recruiter-generated source is lower.
RSS focus on the female recruiting mission: We measure this by computing the
RSS’s percentage of total enlistment contracts that were women over the year
prior to the recruit’s contract date. Lower percentages may suggest inadequate
focus on female recruiting missions, which we would expect to increase female
recruit training attrition.20 It also may be that women perform better in recruit
training if they are accompanied by a larger percentage of women in the DEP.
RSS recruits’ improvement in IST scores: We measure this by computing the
average difference between the score for the first IST taken in the DEP and the
score for the IST taken just prior to accession for all recruits who accessed
from the RSS in the year preceding the recruit’s accession date.21 Greater
positive differences could suggest a stronger focus on recruit physical
conditioning, which may reduce female recruit training attrition.
Table 7 shows the relationships between these RSS-level leadership/management
metrics and female recruit training attrition without controlling for other factors.
When we controlled for other factors in an otherwise already-crowded regression
equation (significant number of independent variables), the differences shown in
Table 7 were not statistically significant. Thus, we did not include the RSS-level
19 Recruiter-generated contract sources include: (1) area canvassing, (2) list canvassing, and (3)
local mail.
20 The percentage of total contracts that are women will naturally be low, as women account for
only about 7 to 8 percent of the overall recruiting mission.
21 Recruits typically take an IST near the date on which they enlist into the DEP and then take
the IST monthly thereafter until they are accessed.

20
leadership/management variables in our final regression equations. We believe,
however, that there are some interesting attrition differences in the uncontrolled
relationships that could be further explored in future analyses. In Table 7, those
attrition rates that are statistically different in a simple test of proportion means are
in italics.
Table 7. RSS leadership/management metrics and female recruit training attrition
(FY05-FY13)
RSS metric Category Actual attrition rate
(FY05-08) Actual attrition rate
(FY09-13)
RSS contract waiver percentage > 50
Yes 19.1% 17.0%
No 16.9% 13.4%
RSS DEP attrition percentage > 25
Yes 18.0% 14.1%
No 17.5% 13.5%
RSS percentage of recruiter-generated contracts > 50
Yes 17.3% 13.9%
No 17.6% 13.5%
RSS percentage of contracts that are women < 5
Yes 18.4% 15.7%
No 17.5% 13.3%
RSS average IST improvement > 20 points
Yes 18.6% 12.7%
No 17.4% 14.4%
Source: CNA Marine Corps manpower files and MCRISS.
The attrition rates in italics have differences that are statistically significant at the 5 percent
level of significance in a two-tail, two-sample test of proportion means which requires a z-
statistic with an absolute value of at least 1.96.

21
The following highlights are provided for the RSS-level leadership/management
metrics in Table 7.
RSS quality prospecting: In both periods, female recruits from RSSs that
enlisted at least 50 percent of their applicants with waivers had roughly 2 to 3
percentage points higher recruit training attrition than those from RSSs with
less than 50 percent waivers.
RSS pool leadership, sales effectiveness, and service after the sale: In both
periods, female recruits from RSSs that had at least 25 percent DEP attrition
had recruit training attrition that was marginally higher (but not statistically
significant) than those from RSSs with less than 25 percent DEP attrition.
RSS adherence to systematic recruiting: For FY05-08 and FY09-13, we had
mixed results. For FY05-08, female recruits from RSSs that had at least 50
percent recruiter-generated contracts had slightly lower attrition than those
from RSSs with less than 50 percent recruiter-generated contracts. In FY09-13,
however, female recruits from RSSs that had at least 50 percent recruiter-
generated contracts had slightly higher attrition. In both periods, the
differences were not statistically significant.
RSS focus on the female recruiting mission: For FY05-08, female recruits from
RSSs that enlisted no more than 5 percent female applicants had slightly
higher attrition than those from RSSs that enlisted greater than 5 percent
female applicants, but the difference is not statistically significant. For FY09-
13, female recruits from RSSs that enlisted greater than 5 percent females had
2.4 percentage points lower attrition, which is statistically significant.
RSS recruits’ improvement in IST scores: In FY05-08, female recruits from RSSs
whose recruits had 20 points or more improvement on the IST had slightly
higher attrition than female recruits from RSSs whose recruits had less than 20
points improvement, but the difference is not statistically significant. In FY09-
13, however, those from RSSs with 20 points or more improvement had 1.7
percentage points lower (statistically significant) recruit training attrition.
We are unaware of any previous research that has attempted to relate unit-level
recruiting performance metrics to recruit training attrition and, thus, we have no
basis of comparison for these results from the literature. The results in Table 7 are
not unique to women (we found similar but more statistically significant results for
men—see appendix B); however, we believe these results could be particularly
relevant for female recruiting due to the small number of women that a recruiting
station accesses each year. Although our findings in this regard are quite preliminary
and more work is needed to further explore these leadership/management metric
effects, they could ultimately suggest policies that could limit which RSSs within a
recruiting station are assigned female recruiting missions.

22
Shipping timing factors
Table 8 shows the relationship between shipping factors and female recruit training
attrition.
Table 8. Shipping timing factors and female recruit training attrition (FY05-FY13)
Shipping
timing
factors Category
Percentage
(FY05-08)
Actual
attrition
rate
(FY05-08)
Marginal
effect
(FY05-08)
Percentage
(FY09-13)
Actual
attrition
rate
(FY09-13)
Marginal
effect
(FY09-13)
Accession
trimester
ONDJ 30.4% 19.4% 3.4% 31.3% 14.7% 2.7%
FMAM 25.5% 21.7% 4.8% 28.0% 15.3% 2.8%
JJAS 44.1% 14.0% BC 40.7% 11.5% BC
We also included control variables for each contract year (excluding the base case year) in each equation.
Source: CNA Marine Corps manpower files and MCRISS.
From Table 8, we see that recruits who ship in the spring (FMAM) attrite at the
highest rates; those who ship in the fall (ONDJ) attrite at the next highest rates; and
those who ship in the summer (JJAS) attrite at the lowest rates. These attrition
differences are consistent with those for men; however, we note that the shares of
women that were shipped in the summer (when attrition is lower) are smaller than
the corresponding shares of men. In FY05-08, 44.1 percent of women were shipped
in the summer; in FY09-13, 40.7 percent were shipped in the summer. For men, the
shares were 49.7 in FY05-08 and 49.1 percent in FY09-13. These differences could be
related to constraints on the capacity for female recruit training at Marine Corps
Recruit Depot Parris Island, but nevertheless could be one reason that recruit
training attrition is higher for women than for men.
In addition, we see that female recruit training attrition was higher in FY05-08 than it
was in FY09-13. As previously discussed, this is most likely related to markedly
different macroeconomic conditions. Men also had higher recruit training attrition in
FY05-08 than in FY09-13.

23
Recommendations and Conclusions
Our findings suggest that to reduce recruit training attrition, the Marine Corps
should continue to recruit women who: (1) are at least tier I high school diploma
graduates, (2) score well on the AFQT, and (3) are in good physical condition.
Recruiters also should be made aware that non-citizen women graduate from recruit
training at a significantly higher rate than those who are citizens.
Our analysis also suggests that retention height and weight standards may need
validation. Although women who are under standards have higher recruit training
attrition, those who are above standards had 3.8 percentage points (statistically
significant) lower recruit training attrition in FY09-13 than those who met standards.
This could suggest that women with larger statures are more capable of enduring the
physical challenges of recruit training.
In addition, our findings suggest that recruiters can improve female recruit training
success if they ensure that recruits are not shipped with open contracts. Although we
found that women with less than three months of DEP time do not attrite at higher
rates than those with more than three months when all other factors are held
constant, we believe that there is sufficient evidence throughout the literature and
across time to indicate that preparation time in the DEP is important for both men
and women. Of course, a recruiter’s ability to ship women with at least three months
of DEP time depends on whether the recruiting station achieves sufficient pool
development levels so that applicants who might have been successful in recruit
training with sufficient DEP time are not prematurely forced to ship. One area that
requires additional analysis but could help improve female pool development is the
leadership and management of “pool orphans.” Curbing the high DEP discharge rate
for these female recruits could help to markedly conserve DEP strength and reduce
the need to ship female recruits with less than three months in DEP.
We also recommend further examination of recruiter and recruiter/recruit
interaction characteristics and RSS-level leadership/management metrics and their
relationship to recruit training attrition. Our work should be considered preliminary
in this regard, but we do believe that there is some promising evidence in these
variable categories that could expand traditional explanations for recruit training
attrition. The average recruiting station ships only about 50 women to recruit
training each year (3 to 5 per month). With such small female shipping missions,
commanders may be able to curb high attrition by ensuring that only recruiters and

24
RSSs with characteristics/performance related to female recruit training success are
assigned female recruiting missions. More analysis is required to inform such a
policy option, however.

25
Appendix A: Regression Results
Table 9 and Table 10 are the complete logit regression results for female and male
recruit training attrition for FY05-08 and FY09-13. For each factor, we include the
mean (the percentage of the sample in that factor when multiplied by 100), the logit
regression coefficient with an indicator of the level of statistical significance (see
table footnotes), and the factor’s derivative. The derivative is the percentage-point
change (when multiplied by 100) in recruit training attrition rate for a given factor
relative to the base case (i.e., omitted variable category) when all other factors are
held constant.
Table 9. Logit regression results for female recruit training attrition (FY05-08 and
FY09-13)
Factor
FY05-08
FY09-13
Mean Coeff Derivative
Mean Coeff Derivative
(z)
(z)
Some college 0.011 -0.994** -0.100
0.016 -0.192 -0.020
[2.62]
[0.74]
Tier I other 0.055 0.153 0.022
0.044 0.224+ 0.027
[1.29]
[1.79]
Tier II/III 0.019 0.394* 0.061
0.003 0.792* 0.115
[2.21]
[2.13]
AFQT IIIB/IV 0.359 0.145* 0.020
0.311 0.104+ 0.012
[2.34]
[1.69]
Age 19-23 0.445 0.106+ 0.015
0.479 -0.01 -0.001
[1.66]
[0.17]

26
Factor
FY05-08
FY09-13
Mean Coeff Derivative
Mean Coeff Derivative
(z)
(z)
Age > 24 0.046 0.309* 0.045
0.050 -0.021 -0.002
[2.18]
[0.15]
Hispanic 0.210 -0.527** -0.068
0.252 -0.570** -0.061
[6.51]
[7.69]
Asian 0.035 -0.051 -0.008
0.036 -0.394* -0.045
[0.33]
[2.44]
Black 0.139 -0.131 -0.019
0.142 -0.320** -0.037
[1.53]
[3.82]
Other race 0.025 -0.256 -0.036
0.023 -0.327+ -0.038
[1.40]
[1.77]
DEP months
> 3 0.571 -0.096 -0.013
0.658 -0.058 -0.007
[1.51]
[0.92]
First IST
score < 154 0.391 0.388** 0.059
0.297 0.298** 0.037
[5.79]
[4.45]
First IST
score
>201<300
0.280 -0.475** -0.055
0.367 -0.220** -0.023
[5.64]
[3.00]
First IST run >
13:00 0.660 0.144* 0.020
0.631 0.424** 0.046

27
Factor
FY05-08
FY09-13
Mean Coeff Derivative
Mean Coeff Derivative
(z)
(z)
[2.05]
[6.07]
Non-citizen 0.037 -0.631** -0.073
0.031 -0.566** -0.053
[3.34]
[2.77]
Over
retention
weight
standard
0.063 -0.143 -0.019
0.057 -0.384** -0.038
[1.23]
[2.95]
Under
retention
weight
standard
0.060 0.391** 0.060
0.057 0.467** 0.061
[3.49]
[4.36]
Open
contract 0.087 0.206* 0.030
0.086 0.245* 0.030
[2.12]
[2.56]
Enlistment
waiver 0.413 0.154** 0.022
0.252 -0.005 -0.001
[2.62]
[0.07]
Married or
dependents 0.059 0.149 0.022
0.032 0.225 0.027
[1.28]
[1.55]
Source is
command 0.190 -0.176* -0.024
0.148 -0.135 -0.015

28
Factor
FY05-08
FY09-13
Mean Coeff Derivative
Mean Coeff Derivative
(z)
(z)
recruiter
[2.17]
[1.58]
Source is DEP
referral 0.250 -0.112 -0.016
0.239 -0.183* -0.020
[1.48]
[2.46]
Source is
other 0.047 -0.265+ -0.036
0.060 -0.313* -0.033
[1.84]
[2.41]
Source is PPC 0.108 0.028 0.004
0.114 0 0.000
[0.29]
[0.00]
Source is
walk-/call-in 0.066 -0.313* -0.042
0.078 0.168 0.021
[2.53]
[1.64]
Recruiter and
recruit race/
gender same
0.017 0.063 0.009
0.015 -0.256 -0.027
[0.29]
[1.01]
Recruiter has
detectability
code history
0.321 0.101 0.014
0.457 0.253** 0.029
[1.64]
[4.51]
Pool orphan 0.113 -0.093 -0.013
0.171 -0.124 -0.014
[0.93]
[1.55]

29
Factor
FY05-08
FY09-13
Mean Coeff Derivative
Mean Coeff Derivative
(z)
(z)
Shipped Oct.-
Jan. 0.304 0.252** 0.034
0.313 0.242** 0.027
[3.56]
[3.52]
Shipped Feb.-
May 0.255 0.348** 0.048
0.280 0.253** 0.028
[4.57]
[3.46]
Constant
-1.744**
-2.015**
[14.58]
[17.20]
Observations 9,077
11,775
Chi square (df = 33 & 34)
Source: CNA Marine Corps personnel files and MCRISS.
Absolute value of z statistics in brackets: + significant at 10%; * significant at 5%; **
significant at 1%. Note: These regressions also controlled for accession FY.
Derivatives are converted to percentage-point changes and referred to as marginal
effects in Table 2 through Table 5.

30
Table 10. Logit regression results for male recruit training attrition (FY05-08 and FY09-
13)
Factor
FY05-08
FY09-13
Mean Coeff Derivative
Mean Coeff Derivative
(z)
(z)
Some college 0.005 -0.615** -0.038
0.009 -0.465** -0.023
[3.68]
[3.01]
Tier I other 0.055 0.149** 0.013
0.040 0.134* 0.009
[3.55]
[2.45]
Tier II/III 0.044 0.421** 0.039
0.005 0.439** 0.032
[10.21]
[3.49]
AFQT IIIB/IV 0.330 0.215** 0.018
0.269 0.151** 0.010
[9.88]
[5.87]
Age 19-23 0.495 0.111** 0.009
0.511 0.089** 0.005
[4.71]
[3.41]
Age > 24 0.050 0.490** 0.045
0.048 0.261** 0.017
[11.21]
[4.78]
Hispanic 0.161 -0.376** -0.028
0.188 -0.342** -0.019
[11.60]
[9.94]
Asian 0.030 -0.376** -0.028
0.033 -0.436** -0.024
[5.42]
[5.63]
Black 0.078 -0.006 -0.001
0.090 -0.054 -0.003
[0.16]
[1.33]

31
Factor
FY05-08
FY09-13
Mean Coeff Derivative
Mean Coeff Derivative
(z)
(z)
Other race 0.013 -0.04 -0.003
0.009 0.116 0.008
[0.45]
[1.07]
DEP months
> 3 0.570 -0.093** -0.008
0.826 -0.067* -0.004
[3.97]
[2.16]
First IST score
< 154 0.337 0.364** 0.033
0.205 0.267** 0.019
[14.71]
[8.66]
First IST score
>201<300 0.306 -0.386** -0.026
0.443 -0.357** -0.020
[13.11]
[12.98]
First IST run >
13:00 0.146 0.336** 0.030
0.117 0.249** 0.016
[12.43]
[7.26]
Non-citizen 0.031 -0.285** -0.021
0.024 -0.275** -0.015
[4.15]
[3.15]
Over
retention
weight
standard 0.213 -0.019 -0.001
0.149 -0.154** -0.009
[0.75]
[4.68]
Under
retention
weight 0.040 0.446** 0.042
0.034 0.549** 0.042

32
Factor
FY05-08
FY09-13
Mean Coeff Derivative
Mean Coeff Derivative
(z)
(z)
standard
[9.79]
[10.74]
Open
contract 0.047 0.280** 0.025
0.060 0.261** 0.018
[6.61]
[6.03]
Enlistment
waiver 0.438 -0.008 -0.001
0.264 0.060* 0.004
[0.37]
[2.33]
Married or
dependents 0.037 0.089+ 0.007
0.034 0.097+ 0.006
[1.78]
[1.66]
Source is
command
recruiter 0.162 -0.099** -0.008
0.127 -0.105** -0.006
[3.27]
[2.80]
Source is DEP
referral 0.258 -0.058* -0.005
0.268 -0.068* -0.004
[2.15]
[2.32]
Source is
other 0.036 -0.06 -0.005
0.046 -0.098+ -0.006
[1.07]
[1.69]
Source is PPC 0.113 -0.039 -0.003
0.115 -0.02 -0.001
[1.10]
[0.52]

33
Factor
FY05-08
FY09-13
Mean Coeff Derivative
Mean Coeff Derivative
(z)
(z)
Source is
walk-/call-in 0.061 -0.02 -0.002
0.076 -0.016 -0.001
[0.47]
[0.35]
Recruiter and
recruit race/
gender same 0.555 0.013 0.001
0.549 0.046+ 0.003
[0.61]
[1.94]
Recruiter has
detectability
code history 0.321 0.201** 0.017
0.440 0.092** 0.006
[6.91]
[3.89]
Pool orphan 0.120 -0.130** -0.010
0.219 -0.04 -0.002
[3.60]
[1.37]
Shipped Oct.-
Jan. 0.289 0.228** 0.018
0.308 0.055* 0.003
[9.07]
[1.99]
Shipped Feb.-
May 0.214 0.236** 0.019
0.201 0.177** 0.011
[8.44]
[5.63]
Parris Island 0.479 0.214** 0.017
0.490 0.211** 0.013
[7.69]
[8.93]
Constant
-2.614**
-2.640**
[55.35]
[52.91]

34
Factor
FY05-08
FY09-13
Mean Coeff Derivative
Mean Coeff Derivative
(z)
(z)
Observations 119,231
125,574
Chi square (df = 35 & 37)
Source: CNA Marine Corps personnel files and MCRISS.
Absolute value of z statistics in brackets: + significant at 10%; * significant at 5%; **
significant at 1%. Note: These regressions also controlled for accession FY.

35
Appendix B: RSS Metrics and Male
Recruit Training Attrition
Table 11 provides male recruit training attrition rates by RSS-level metrics categories.
Table 11. RSS leadership/management metrics and male recruit training attrition
(FY05-FY13)
RSS metric Category Actual attrition rate
(FY05-08) Actual attrition rate
(FY09-13)
RSS contract waiver percentage > 50
Yes 9.4% 8.4%
No 9.0% 6.6%
RSS DEP attrition percentage > 25
Yes 10.1% 6.5%
No 8.9% 7.2%
RSS percentage of recruiter-generated contracts > 50
Yes 9.4% 6.4%
No 9.1% 6.7%
RSS percentage of contracts that are women < 5
Yes 9.1% 6.5%
No 9.2% 7.1%
RSS average IST improvement > 20 points
Yes 8.4% 5.9%
No 9.3% 7.3%
Source: CNA Marine Corps manpower files and MCRISS.
The attrition rates in italics have differences that are statistically significant at the 5 percent
level of significance in a two-tail, two-sample test of proportion means which requires a z-
statistic with an absolute value of at least 1.96.

36
References
[1] Aline O. Quester. 2010. Marine Corps Recruits: A Historical Look at Accessions
and Bootcamp Performance. CNA Corporation. CAB D0023537.A1/Final.
[2] Robert P. Trost et al. 2014. Assessing How Delayed Entry Program Physical
Fitness is Related to In-Service Attrition, Injuries, and Physical Fitness. CNA
Corporation. DRM-2014-U-007869-Final.
[3] Clay E. Pandorf et al. “Correlates of Load Carriage Performance Among
Woman.” In Soldier Mobility: Innovations in Load Carriage System Design and
Evaluation. North Atlantic Treaty Organization Research and Technology
Organization Meeting Proceedings 56. Jun. 2000.
[4] Anita Hattiangadi and David Strauss. 2012. Women in Service Restrictions: Key
Issues and Initial Analysis. CNA Corporation. DSI-2012-U-000572-Final.

The CNA Corporation
This report was written by CNA Corporation’s Resource Analysis Division
(RAD).
RAD provides analytical services—through empirical research, modeling,
and simulation—to help develop, evaluate, and implement policies,
practices, and programs that make people, budgets, and assets more
effective and efficient. Major areas of research include health research
and policy; energy and environment; manpower management;
acquisition and cost; infrastructure; and military readiness.

DRM-2014-U-008824-Final
www.cna.org ● 703-824-2000
3003 Washington Boulevard, Arlington, VA 22201
CNA Corporation is a not-for-profit research organization
that serves the public interest by providing
in-depth analysis and result-oriented solutions
to help government leaders choose
the best course of action
in setting policy and managing operations.
Nobody gets closer—
to the people, to the data, to the problem.