Embed Size (px)
Citation preview
An Analysis of How HR
Policies and Procedures
Impact on Employees’
Performance in New
Zealand Organizations
By
PARWINDER KAUR SABARWAL Student Id: 1416726
A thesis submitted in partial fulfillment of the
requirements for the degree of
Master of Business
Unitec
New Zealand
2014

ii
DECLARATION Name of candidate : Parwinder Kaur Sabarwal
Student ID Number : 1416726
This thesis is submitted in partial fulfillment for the requirements for the Unitec, New
Zealand, degree of Master of Business.
Candidate’s Declaration:
I confirm that:
This thesis is my own work.
The contribution of supervision and others to this thesis is consistent with the
Unitec‟s Regulations and Policies.
The research for this thesis has been conducted in approval with the Unitec,
Research Ethics Committee Policy and Procedure, and has fulfilled any
requirements set for this thesis by the Unitec Ethics Committee. The Research
Ethics Committee Approval Number is: 2014-1006
Candidate Signature:
Date:

iii
Abstract A major challenge for human resource personnel has been establishing a clear and
definitive employees‟ behavior with the organization strategy. A new scientific model,
Ongoing Profession Development (OPD) simplifies this process and enables human resource
personnel to achieve greater performance gain by virtue of better alignment of employees‟
behavior with the strategy. This research study examines the OPD model efficacy in
improving Strategic Human Resource Management (SHRM) outcomes.
The study was conducted in only eleven New Zealand service based organizations due
to the limited nature of the research project being undertaken. The result from this research
study is based on the responses collected from interviews of one HR manager from each
organization and survey responses from five employees of each organization.
The study assesses the effectiveness of SHRM in relation to the extent of the presence
of OPD model elements in the organizations‟ SHRM processes. The study utilizes statistical
procedures and mathematically ascertains that a direct relationship exists between SHRM
outcomes and the presence of OPD model elements.
This research study reveals that a better performing SHRM in an organization has a
higher degree of presence of OPD elements. Organizations can experience an increase of
12% in performance with the incorporation of the OPD model in their SHRM process.
Although the findings are in conjunction with existing empirical evidence, they are obtained
mainly from service organizations which is a limitation of this study, but this decision was
made because people are extremely critical to the success of this type of organizations in any
economy in the world. However better results could perhaps be obtained if a larger and more
diverse sample of different industries is researched by future research scholars.
iv
Acknowledgement I would like to express my profound gratitude to my supervisor, Professor Pieter Nel,
Department of Management and Marketing, Unitec. His academic expertise and clear
instructions helped me sharpen and clarify what I was trying to say. His professional attitude,
tireless guidance and encouragement kept me going and helped me finally produce this
research work. Without his supervision and continual advice this dissertation would not have
been possible. Daunting though this undertaking has been, I am eternally grateful to him for
smoothing the way.
I wish also to express my warm gratitude to my associate supervisor, Mr. Alan
Lockyer, Department of Management and Marketing, Unitec, for his valuable input and
thorough feedback on this research study.
Special thanks must go to Mr. Jeff Marriot, Associate Head of Department,
Programme Leader, Postgraduate Diploma in Business / Master of Business, Department of
Management & Marketing, Unitec, who showed confidence in me and encouraged me to
complete this research study.
There are many people who come to my mind when I am writing this section. Ms.
Julie Stevens, Business Engagement Manager, Unitec, who provided me with the opportunity
to connect with representatives of many New Zealand organizations at the event „Speed
Networking‟, which proved immensely useful in seeking potential participant organizations
for my research study. Ms. Naomi Twigden, Team Leader, International Student Advisor,
Unitec, who patiently listened to my every query and always helped me to her fullest extent
and Ms. Cindy Wee at Unitec, who patiently read my dissertation and provided her feedback
to improve my dissertation. All the organizations‟ HR managers, who took an interest in my
research, provided their time and attention and participated in this research study. I wish to
thank all of them and also would like to extend my thanks to all interviewees and respondents
of the online survey for giving their valuable time and contributions to this research study.
I owe my gratitude to all my teachers, the administrative staff and my colleagues at
Unitec with whom my experience at Unitec has been so wonderful.
And the one I have saved for the last is my family. I express my deepest affection and
appreciation to my parents for their unconditional love and faith in me and for always being
beside me in my decisions. Last but not least, I am indebted to my husband who lives every

v
moment of my happiness and sorrow and helped me with every step in my study at Unitec
and this research study.

vi
Table of Contents
DECLARATION ....................................................................................................................... ii
Abstract .................................................................................................................................... iii
Acknowledgement .................................................................................................................... iv
Table of Contents ...................................................................................................................... vi
List of Figures and Tables......................................................................................................... ix
Figures................................................................................................................................... ix
Tables ..................................................................................................................................... x
Abbreviations ............................................................................................................................ xi
Chapter 1: Introduction .............................................................................................................. 1
1.1 Background ................................................................................................................. 1
1.1.1 Production/Production Capacity (P/PC) balance for sustained and mutual
benefits .............................................................................................................................. 1
1.1.2 Continual change in HR practices and HR practitioner‟s roles ........................... 2
1.1.3 Strategic Human Resource Management is a mix of three variables .................. 3
1.1.4 Resource based and control based SHRM ........................................................... 4
1.1.5 Resource Based View (RBV) model ................................................................... 4
1.1.6 Ongoing Professional Development for effective human capital leverage ......... 6
1.1.7 Ongoing Professional Development model evolution ......................................... 6
1.2 Research aim and objectives ....................................................................................... 7
1.3 The research question .................................................................................................. 8
1.4 Limitations of research ................................................................................................ 9
1.5 Outline of thesis .......................................................................................................... 9
1.6 Summary ................................................................................................................... 10
Chapter 2: Literature Review ................................................................................................... 12
2.1 Introduction ............................................................................................................... 12
2.2 Strategic Human Resource Management .................................................................. 12
2.3 Evolution of Strategic Human Resource Management ............................................. 13
2.4 Shortcomings of Strategic Human Resource Management....................................... 14
2.4.1 Strategic Human Resource Management is looked upon by researchers as
doubtful as a link to organization performance ............................................................... 15
2.4.2 Strategic Human Resource Management overlooking the ethical perspective .. 16
2.5 Ongoing Professional Development - Strategic Human Resource Management; a
breakthrough, a new ground of study .................................................................................. 17
2.6 Ongoing Professional Development – Strategic Human Resource Management
theory explained ................................................................................................................... 23
2.7 Ongoing Professional Development – Strategic Human Resource Management; a
manager‟s role ...................................................................................................................... 27

vii
2.8 Success lies in proper implementation ...................................................................... 28
2.9 Performance effect of OPD-SHRM .......................................................................... 29
2.9.1 What makes OPD-SHRM work? ....................................................................... 29
2.9.2 Easy and clear identification of performance lapses and controls ..................... 30
2.9.3 Illustration of impact on organization profit with OPD theory.......................... 32
2.9.4 OPD addresses human capital development and reaps many benefits .............. 34
2.10 Summary ................................................................................................................ 34
Chapter 3: Methodology .......................................................................................................... 36
3.1 Introduction ............................................................................................................... 36
3.2 Sampling.................................................................................................................... 36
3.2.1 Participant selection ........................................................................................... 38
3.3 Primary data .............................................................................................................. 40
3.4 The methods for primary data collection: ................................................................. 43
3.4.1 Interviews ........................................................................................................... 43
3.4.2 Questionnaires.................................................................................................... 43
3.4.3 Data analysis ...................................................................................................... 45
3.5 Ethical considerations ............................................................................................... 48
3.6 Summary ................................................................................................................... 48
Chapter 4: Results .................................................................................................................... 50
4.1 Introduction ............................................................................................................... 50
4.2 Quantitative data: Online survey questionnaire ........................................................ 50
4.2.1 Type 1 (Questions 1 to 10)................................................................................. 51
4.2.2 Type 2 (Questions 11 to 21)............................................................................... 57
4.2.3 Type 3 (Questions 22 to 26)............................................................................... 63
4.3 Qualitative data: Interviews ...................................................................................... 69
4.4 Summary ................................................................................................................... 86
Chapter 5: Analysis and Discussion of the Research Findings ............................................... 87
5.1 Introduction ............................................................................................................... 87
5.2 Quantitative analysis on SHRM vs. OPD-SHRM ..................................................... 87
5.2.1 Multiple Regression ........................................................................................... 88
5.2.2 Linear equation of line of regression for X1 ...................................................... 91
5.2.3 Analysis of effect of OPD elements on SHRM effectiveness ........................... 96
5.2.4 Measuring employees‟ behavior in hypothetical OPD scenarios .................... 106
5.2.5 Measuring the extent of the presence of OPD-SHRM elements ..................... 108
5.3 Qualitative analysis ................................................................................................. 111
5.4 Summary ................................................................................................................. 113
Chapter 6: Conclusions and Recommendations .................................................................... 115
viii
6.1 Introduction ............................................................................................................. 115
6.2 Findings ................................................................................................................... 116
6.3 Limitations of the research ...................................................................................... 119
6.4 Recommendation for future work ........................................................................... 121
6.5 Overall Conclusion .................................................................................................. 122
Bibliography .......................................................................................................................... 123
Appendix 1: Research Information Sheet .............................................................................. 133
Appendix 2: Participants‟ Consent Form ............................................................................... 135
Appendix 3: Organization Consent Form .............................................................................. 136
Appendix 4: Survey Questionnaire ........................................................................................ 137
Appendix 5: HR Interview Questions .................................................................................... 142
Appendix 6: SPSS Numerical Coding for Variable Values................................................... 144
ix
List of Figures and Tables
Figures
Figure 1: The Three Traditional Poles of a Strategic Plan ......................................................... 3 Figure 2: Organization Structure and Identification of Elements that influence Behavior of
Personnel in the Organization .................................................................................................. 24 Figure 3: Simplified Model ...................................................................................................... 25 Figure 4: Linking the Details of the Role Structure to Define Psychological Targets ............ 27
Figure 5: Impact on Profit with OPD theory ........................................................................... 33 Figure 6: Job Satisfaction......................................................................................................... 51 Figure 7: Work-life Balance .................................................................................................... 52 Figure 8: Rewarding ................................................................................................................ 52 Figure 9: Acknowledgement of Good Work ........................................................................... 53
Figure 10: Professional Development ...................................................................................... 53
Figure 11: Success at Work ..................................................................................................... 54 Figure 12: Performance Rating by Supervisor......................................................................... 55
Figure 13: Frequency of Supervisor Underestimating the Employees Performance ............... 55 Figure 14: Frequency of Supervisor Overestimating the Employees Performance ................. 56 Figure 15: Frequency of Supervisor Rating Correctly the Employees Performance ............... 56
Figure 16: Employees Knowing How to Be Successful .......................................................... 57 Figure 17: Clear on KPI ........................................................................................................... 58 Figure 18: Knowledge of KPI .................................................................................................. 58
Figure 19: Knowledge of KPIs ................................................................................................ 59 Figure 20: Measuring Employees Performance ....................................................................... 59
Figure 21: Emphasis on KPI or on Process ............................................................................. 60 Figure 22: Frequency of Mentoring and Guidance .................................................................. 61 Figure 23: Realistic Expectation .............................................................................................. 61
Figure 24: Determining Ideal Actions for Success .................................................................. 62
Figure 25: Social Rewarding ................................................................................................... 62 Figure 26: One on One Meeting .............................................................................................. 63 Figure 27: Celebrating Success ................................................................................................ 64 Figure 28: Periodic One on One Meeting ................................................................................ 65
Figure 29: Importance of Success at Work .............................................................................. 65 Figure 30: Successful delivery with Manager's Support ......................................................... 66 Figure 31: KPI as Only Performance Parameter...................................................................... 67 Figure 32: Gender .................................................................................................................... 67 Figure 33: Age Group .............................................................................................................. 68
Figure 34: Level of Education ................................................................................................. 69 Figure 35: Interview - Clear on KPIs ....................................................................................... 70 Figure 36: Interview - Clear on Ideal Actions ......................................................................... 71 Figure 37: Interview - Inclined to be the Manager's way ........................................................ 73
Figure 38: Interview - Manager's Support and Guidance ........................................................ 74 Figure 39: Interview - Role of Business Process ..................................................................... 75 Figure 40: Interview - Organization‟s Goals ........................................................................... 78
Figure 41: Interview - Employees Adding Value to Organization .......................................... 79 Figure 42: Interview - Positive attitude towards Organization Goals...................................... 80 Figure 43: Interview - Professional Development coupled to Organization Goals ................. 81 Figure 44: Interview - Professional Development Helping Organizational Goals .................. 83 Figure 45: Interview - Periodic Assessment ............................................................................ 84

x
Figure 46: Interview - Professional Development ................................................................... 85
Tables
Table 1: Interview - Clear on KPIs .......................................................................................... 70 Table 2: Interview - Clear on Ideal Actions ............................................................................. 71 Table 3: Interview - Inclined to be the Manager's way ............................................................ 72 Table 4: Interview - Manager's Support and Guidance ........................................................... 74 Table 5: Interview - Role of Business Process ........................................................................ 75
Table 6: Interview – Organization‟s Goals .............................................................................. 78 Table 7: Interview - Employees Adding Value to Organization ............................................. 79 Table 8: Interview - Positive attitude towards Organization Goals ......................................... 80 Table 9: Interview - Professional Development coupled to Organization Goals .................... 81 Table 10: Interview - Professional Development Helping Organizational Goals ................... 82
Table 11: Interview - Periodic Assessment ............................................................................. 84
Table 12: Interview - Professional Development .................................................................... 85 Table 13: Pearson Correlation Coefficient Matrix................................................................... 89
Table 14: Regression variables (Y1, X1) ................................................................................. 91 Table 15: Model Summary (Y1, X1) ....................................................................................... 91 Table 16: Coefficients (Y1, X1) .............................................................................................. 91 Table 17: Model Summary (Y1, X2) ....................................................................................... 92
Table 18: Coefficients (Y1, X2) .............................................................................................. 92 Table 19: Regression Linear Equations (Y1, Xi)..................................................................... 93
Table 20: Model Summary (Y1, Xi) ........................................................................................ 95 Table 21: Coefficients (Y1, Xi) ............................................................................................... 95 Table 22: Variable Y1 numerical coding for SPSS ................................................................. 98
Table 23: Variable X1 numerical coding for SPSS ................................................................. 98 Table 24: Frequency Distribution (Y1, Xi).............................................................................. 99
Table 25: Multiple Regression Equations (Yi, Xi) ................................................................ 102
Table 26: Predicted Yi for OPD-SHRM ................................................................................ 105
Table 27: Frequency Distribution of Type 3 Questions......................................................... 107 Table 28: Frequency Distribution of Type 2 Questions......................................................... 110

xi
Abbreviations CEO Chief Executive Officer
CPA Certified Public Accountants
HR Human Resource
HR-KPI Human Resource - Key Performance Indicator
HRM Human Resource Management
KPIs Key Performance Indicator(s)
KSI Key Success Indicator
MR Multiple Regression
MRC Multiple Regression and Correlation
OPD Ongoing Professional Development
OPDPPL Ongoing professional development profit profile link
OPD-SHRM Ongoing Professional Development – Strategic Human Resource
Management
P/PC Production/ Production Capacity
PIM Performance Information Market
PPMC Pearson Product Moment Correlation
RBV Resource Based Model
RHS Right Hand Side
SHRM Strategic Human Resource Management
SPSS Statistical Package for the Social Sciences
UREC Unitec Research Ethics Committee
VP Vice President
1
Chapter 1: Introduction
1.1 Background
The researcher aims to explore the possibility of change in existing Strategic Human
Resource Management (SHRM) procedures and practices within the organization to enhance
it further by improving employee productivity, work satisfaction and work-life balance in
order to obtain their required commitment to the accomplishment of goals, thereby increasing
organizational profitability. The research explores the possibility for implementation of
Ongoing Professional Development (OPD) theory and assesses the efficacy of OPD theory in
enabling the best balance of HR policies. The research uses one to one interviews and a
questionnaire as the principal research methodology.
An effective framework of Human Resource (HR) policy involves balancing three
key factors. The first key factor is having an effective framework of hygiene factors
(Herzberg, 1986) including compliance. The second one is the application of the best
organizational design strategy whereby the key actions required for organizational success
are the central focus of the person‟s mind and effort. The OPD theory is the third key factor
which offers an alternative organizational design. Implementation of Ongoing Professional
Development – Strategic Human Resource Management (OPD-SHRM) is fully aware of
Hertzberg‟s motivational factors and combined with the hygiene factors represents an
integrated motivation system.
1.1.1 Production/Production Capacity (P/PC) balance for sustained and
mutual benefits
There is a well-known story of “the goose that lays golden eggs”. The goose that laid
the golden eggs was killed by a farmer and his wife because they were greedy to have more
eggs all at once. In his famous book, “The 7 Habits of Highly Effective People”, the author,
Covey (2013) takes the illustration of the above story, “the goose laying golden eggs” and
explains the recipe for “True Effectiveness.”
He explains that “True Effectiveness” is determined by two variables, 1) What is
being produced and 2) Production Asset or Production Capacity. In order to consistently and
continually keep exhibiting “True Effectiveness”, one must take care of both the variables
that are: 1) What is being Produced, which is the golden eggs in the illustrated story and 2)
Production Asset or Production Capacity that is the “goose” in the context of the illustrated
story. Covey (2013) calls it a P/PC balance, i.e. Production/Production Capacity balance.

2
Had the farmer taken good care of the goose, the Production Capacity, he would have
continued getting the benefits of the golden eggs, the Product.
The effectiveness thus lies in the balance, the P/PC balance. The same holds true in an
organizational context. In a typical organization, the P/PC balance is particularly important as
it equally applies to the human assets of the organization. The human assets are the
Production Capacity in an organization. As long as this is being taken care of properly and is
kept in well maintained and polished order, the organization will continue reaping its benefits
in terms of organizational profits. There are organizations that do a whole lot of activities in
order to please their customers and keep them happy. But they completely ignore their own
people, the employees who deal with their customers, and they thereby run the risk of
suffering the same misery like that of the farmer of the „the goose laying golden eggs‟ story
(Covey, 2013).
Covey (2013) says, “You can buy a person's hand, but you can't buy his heart. His
heart is where his enthusiasm, his loyalty is. You can buy his back, but you can't buy his
brain. That's where his creativity is, his ingenuity, his resourcefulness” (p. 28). The role of
Human Resource Management in an organization should be to achieve the same and thus it
becomes critical. Its role is to buy the heart of the people, to get them enthusiastic, being
creative, motivated and engaged in their roles and organizational activities (Covey, 2013).
1.1.2 Continual change in HR practices and HR practitioner’s roles
Human resource experts are expected to introduce changes in policies that will bring
positive changes to the organization with respect to its profitability as well as employee
work-life balance. Ultimately employees are concerned with having both a good job and a
life beyond work. There is a need for HR experts to implement policies and practices that will
increase employees‟ commitment (Du Plessis, 2006). Increasing competitive pressures and
tougher business environments initiated the HR functions to be gradually perceived as a
„specialist‟ role (Macky, 2008). The role of HR is critical as they need to continuously
monitor and assess the policies to evaluate how effective they are in providing employees
with their much-needed work-life balance and work satisfaction, while at the same time
ensuring that in an attempt to accomplish this, the organization is not taking a toll on itself.
The culture and economy do not remain the same over time. A set of policies that might have
been useful in the past can no longer stay equally effective in current time. That is what
makes the role of an HR practitioner so crucial. According to Monks and McMackin (2001),

3
“The human resources–business strategy alignment cannot necessarily be characterized in the
logical and sequential way suggested by some writers; rather, the design of the Human
Resource Management system is a complex and iterative process” (Bratton, 2007, p. 37). HR
practitioners need to facilitate organizational change and implement the necessary HR
practices to guarantee success (Joerres, 2006). They are required to carefully analyze the
current policies in the organization and in collaboration with employees‟ opinion introduce
changes that can be in the best interest of the organization and of employees at the same time.
1.1.3 Strategic Human Resource Management is a mix of three variables
Strategic Human Resource Management came into existence some years ago and
since then it has evolved through many forms and is driven by many theories (Lengnick-Hall,
Lengnick-Hall, Andrade, & Drake, 2009). Hill and Jones (2001) described SHRM as an
action a company takes to attain superior performance. The Strategic Plan in the
organizational context is determined by the right mix of three variables also called
interdependent poles.
Figure 1: The Three Traditional Poles of a Strategic Plan
Source: Aktouf (1996 ) as cited in Bratton (2007, p. 38)
The three variables are the senior management which determines the top level
decisions, the external environment which typically can be considered as market conditions
and the third variable is the resource available to the company (Bratton, 2007). This research
is more concerned about the third variable, „Resource‟. More specifically, this research
concentrates on human capital adding value to the organization‟s result. With human resource
strategy, the emphasis is on strategic decisions taken by management regarding HR policies

4
and practices which influence the employees‟ effectiveness such as roles formulation,
selection and training, development, appraisal, motivation and controlling the employees
(Bratton, 2007).
1.1.4 Resource based and control based SHRM
During the early 1990s, three different models of HR strategies evolved from the HR
literature. The initial predominant model was control-based which was based on the view of
HR in which management monitors the human resource and controls them to churn out the
performance or required behavior. Another model was the resource-based view and was
based on a relationship of exchange between employer and employee. In other words, this
model was grounded on employees‟ behavior, attitude and on the quality of manager and
subordinate relationship. The third model, an integrative model as cited by Bratton (2007)
was provided by Bamberger and Meshoulam (2000). They proposed that the resource based
model and the control based model, were both two main dimensions of SHRM. The
integrative model had characteristic attributes of both the resource based and control based
models (Bratton, 2007).
1.1.5 Resource Based View (RBV) model
As cited by Carraresi, Mamaqi, Albisu, and Banterle (2012), the traditional model of
the RBV was theorized in 1991 and is still acknowledged, after 20 years as one of the most
useful models for studying and analyzing managerial relationships (Barney et al., 2011;
Crook et al., 2008). This RBV formed an important and crucial basis for the evolution of
SHRM. Although today's Strategic HRM did not actually result from RBV alone, RBV
shifted the attention of strategic literatures and HR theorists towards organization resources.
It endorsed human capital as a potential scope for gaining competitive advantage by
leveraging it rather than just being dependent on tweaking, manipulating and responding to
external factors like industry position, market scenario, government policies, etc.
(Hoskisson, Hitt, Wan, & Yiu, 1999). Increased acceptance of human capital as
organizational resources for competitive advantage enabled HR theorists to legitimately
assert that people must be considered in strategic decisions while formulating organization
success plans. As a result, the RBV model helped turn the spotlight on „people‟, and human
capital came onto the radar in the strategic literatures of SHRM. Concepts like knowledge
management, training, development and leadership started to emerge to further substantiate
the importance of human capital as an internal resource of the organization (Wright,
Dunford, & Snell, 2001). A compelling statement from Barney (1991) suggested that

5
competitive advantage can be sustained by transforming the human resource into a
heterogeneous and immobile capital. It implicitly meant to look for the scope of competitive
advantage by nourishing and cherishing the human capital. The heterogeneity and
immobility of resources meant having a varied range of expertise and skill sets and
maintaining the knowledge just within the organization. Maintaining the knowledge within
the organization was a guarantee that these resources cannot be easily bought, transferred,
or copied, and would simultaneously add value to the organization while being rare to the
competitor organizations. There was strong evidence in favor of the RBV model (Crook,
Ketchen, Combs, & Todd, 2008). Resource based SHRM oriented the strategic HRM
towards concentrating the attention of HR theorists towards finding means for further
improving and leveraging the human capital. The resource-based SHRM model outlined the
emphasis on the quality of human resource as a strategy for sustained competitive
advantage.
Despite the resource-based SHRM model becoming a general trend to train
employees in the workplace, there is little evidence or empirical data to suggest that many
firms actually started adopting this HR strategic model (Bratton, 2007). This research study
tries to explore this area of SHRM. The purpose of this research study is therefore to analyze
the SHRM of today and determine whether organizations practice this HR strategic model. It
also examines how effective it has been to improve employees‟ performance to produce
better throughput while letting the employees enjoy their work-life balance. This research is
also primarily focused on the new OPD theory, in the context of current SHRM, known as
OPD-SHRM.
Resource-based SHRM lead to an alternative leadership paradigm labeled in different
ways as „transformational leadership‟ by Tichy and Devanna (1986) and as „charismatic
leadership‟ by Conger and Kanungo (1988) and it became a prerequisite for a resource-based
SHRM model. Leadership is a process by which an individual can exert influence on others
in the organizational context (Bratton, 2007). The scope of a manager has widened in today‟s
organizational scenario, as now they are expected to possess leadership ability so they can
foster the right attitude in organization human capital. They have the role of a leader to play
and influence their employees to get them motivated, engaged and committed and produce
innovations and change in organization work culture (Bratton, 2007; Guest, 1997). In the
organizational context, the managerial leadership is mostly defined by the HR literature as a

6
process for the manager to exercise in order to influence its employees to transform them into
idealistic behaviors. Kotter (1996) emphasizes the criticality of leadership in an
organizational context and says it is the core of any revolutionary organizational change. As
cited by Bratton (2007) the work of many writers (Agashae & Bratton, 2001; Barney, 1991;
Senge, 1990) have suggested a strong linkage between learning, leadership and
organizational change and also there are examples of failures of organizational re-engineering
due to lack of leadership competencies in influencing employees to adapt to the
organizational change (Hammer & Champy, 2009). This all makes it quite evident that
leadership is a key constraint on the development of resource-based SHRM (Bratton, 2007).
1.1.6 Ongoing Professional Development for effective human capital leverage
OPD-SHRM is in a way more detailed and a methodology on a microscopic level for
organizations‟ leaders to achieve greatest staff performance. OPD theory makes the HR to
play significant role in strategy rollout. It is the most thoroughly grounded intellectual
foundation for HR available globally. It is being proved in clients and needs validation by
research. OPD is slowly gaining popularity ( Little & Nel, 2008; OPD International Limited,
2014b).
1.1.7 Ongoing Professional Development model evolution
Consequently, the leadership model drives its followers to work beyond their mere
contractual agreement of employment. As Bratton (2007) says, “To go beyond the rhetoric,
however, such popular leadership models shift the focus away from managerial control
processes and innate power relationships towards the psychological contract and the
individualization of the employment relationship” (p. 60).
In 1920, an experiment was conducted known as the Hawthorne experiment. It was
particularly intended to find a theoretical solution to a leadership question, “How does a
leader achieve greatest staff performance” (Nel & Little, 2010, p. 43).
The research findings by Dr. Little regarding the key to achieving human performance
succeeded in formulating a framework for this. Researchers put their best efforts into finding
the underlying issues and factors which affect and reduce the efficacy of performance, but
even after ninety years of extensive research and numerous literatures generated, they could
not agree on a scientific, systematic answer to the question (Nel & Little, 2010). Dr. Little
took the research forward and explored the underlying issues and was able to formulate a
7
theory that scientifically explains and provides a logical reasoning to the question “How does
a leader achieve greatest staff performance?” (Nel & Little, 2010)
Dr. Little‟s proposition is the firm answer to the question, “How does a leader achieve
greatest staff performance?” and named the formulated theory OPD-SHRM (Ongoing
Professional Development - SHRM) (Nel & Little, 2010). This theory was based on the
leadership attributes of the manager in encouraging and influencing the employees for the
mutual advantage of both the employee and the organization. The outcome of OPD-SHRM is
significant, and many New Zealand organizations have benefitted by implementing the OPD
model in their SHRM and are experiencing a substantial performance boost with their
employees in terms of their effectiveness, efficiency and as well as in terms of their improved
satisfaction level with the organization ( Little, n.d.; Nel & Little, 2014).
This research project will focus on the awareness of OPD-SHRM in New Zealand
Organizations and whether organizations are positive towards its adoption. A comparative
analysis of SHRM and OPD-SHRM will also be undertaken to find out if there is any
commonality in existing SHRM being practiced in organizations and the elements of OPD-
SHRM theory, and if the researcher finds some degree of OPD-SHRM already present then it
will be established how effective that SHRM of the organization has been in terms of
employees‟ performance and their work-life satisfaction.
1.2 Research aim and objectives
The aim of this research is to analyze SHRM in New Zealand organizations to
identify the relationship between OPD-SHRM and SHRM effectiveness.
The research study entails some objectives to fulfill the aim of this research. The
objectives for this research project are:
1. To assess SHRM in New Zealand organizations for its effectiveness in achieving
SHRM outcomes.
2. To measure the extent of the presence of OPD elements in SHRM in New Zealand
organizations.
3. To measure the conformance of the behavior of employees with OPD as a model.

8
4. To contrast the existing SHRM practices in New Zealand organizations with the OPD
model.
1.3 The research question
This research attempts to identify the HR practices implemented within an
organization and analyze their effectiveness and also to understand how close it is to the OPD
model. More explicitly it examines what it will take to implement an OPD-SHRM model in
the existing HRM system. Times have changed and now employees see the organization
differently. The employees, while working for the organization, expect in turn, organization
commitment towards offering its employees a work-life balance such as offers that allow
them to lead a life outside work. In this way they could pursue their personal life along with
working for the organization. Their demands are not just limited to a better salary, but they
expect the organization to take care of them. Now there is a new generation of employees
born after 1980 called Generation Y. They need to be handled and treated differently by HR
practitioners. The same old HR strategies and practices do not fit perfectly with the
Generation Y employees. Hence, a need arises for a new set of HR policies and practices that
could make the employees feel that the organization is equally concerned about them and
gaining their commitment to the organization (Du Plessis, Paine, & Botha, 2012).
HR practitioners thus need to keep assessing the policies periodically to identify the
ways they can be changed to suit employees and to help them achieve their goal of work-life
balance. Open communication is required between HR and employees. It is important to
know which policy affects them adversely and how their work and throughput can be
increased.
Based on the aim and objectives of this research, the researcher will thus seek answers
to two research questions:
Research Question 1: Does SHRM in New Zealand organizations contain elements of
OPD-SHRM?
Research Question 2: Is the OPD-SHRM model better than existing Human Resource
Management practices?

9
The second and fourth research objectives will help the researcher answer research
question one and the first, second and third objectives will help the researcher answer
research question two.
1.4 Limitations of research
It may be that employees might not furnish exact and correct information
because of loyalty to their company, and not wanting to share facts about their
company that may not pose a positive picture of their organization.
Even though explicitly informed of maintaining their anonymity, an employee
may not feel safe to always furnish correct information.
HR personnel would be the group that may be most reluctant to reveal their
way of handling employees, which might affect the findings.
Only a very limited number of organizations are researched in this project and
may not be representative of New Zealand industry in its totality as it is
exploratory only. A more in depth study is therefore appropriate to get a more
representative response on OPD.
1.5 Outline of thesis
This thesis is organized into six chapters. A summary of each chapter is presented
below:
Chapter One is the Introduction to the thesis. It details the background of the research.
Opening with explaining the core role of HRM from an employee‟s performance perspective,
the chapter emphasizes the management of people for the continual benefit of both people
and the organization. The background presents a very brief overview of traditional HRM
transiting to Strategic HRM and discusses OPD-SHRM, a new model of SHRM as an
effective approach for augmenting human resource. This chapter further outlines the research
questions, objectives and limitation of the research.
Chapter Two is the Literature Review and presents a review of SHRM development
and its shortcomings which were observed. A new approach, OPD-SHRM, is presented as a
better way for linking people and the organization. This chapter presents a description of the
OPD-SHRM model showing how the new model is different from SHRM and can be an
10
efficient model. The chapter explains this new theory in the backdrop of current SHRM
practices.
Chapter Three is the Methodology and lists all the aspects used to conduct this
research study. The chapter presents the sampling technique and participants‟ selection
procedures used during this research. It also presents the methods of primary data collection
used in this research and discusses how the procedures and the data collected will be utilized
for answers to the research questions. At the end, the chapter explains the ethical
considerations observed during the research study.
Chapter Four is the Results and presents all the data collected during the research
study. The chapter separately presents the qualitative and quantitative data. The quantitative
data are presented and illustrated with charts, bar graphs and tables whereas qualitative data
are presented as a collated summary of all interview respondents. There is also a quantitative
representation of qualitative data on the basis of respondents being in favor, against or neutral
in their response to a proposition.
Chapter Five is the Analysis and Discussion of the Research Findings and presents a
statistical analysis of the resulting data. The chapter illustrates statistical derivations for
finding answers to the research questions. The statistical figures and calculated numbers are
presented in forms of tables and equations.
Chapter Six is the Conclusions and Recommendations and presents the synthesis of
this research study. The chapter provides answers to the research questions and cites the
limitations of this particular research study along with providing recommendations for future
research.
1.6 Summary
This introduction presents the research topic and provides a glimpse of what is ahead
in this research. It offers a brief outline of OPD-SHRM, which is a relatively new approach in
HR management in the organization and is still under scrutiny, though many organizations
have already adopted it and are confirming better outcomes. This chapter contains an outline
of the evolution of HRM from primitive HRM to SHRM and introduces OPD theory, a
relatively new theory, based on scientific experiment. OPD theory provides an answer to the
leadership problem of achieving greatest staff performance in the SHRM of an organization.

11
The next chapter is Literature Review. It presents an in depth investigation of the
literature relevant to the field of SHRM and OPD theory.

12
Chapter 2: Literature Review
2.1 Introduction
This chapter details the developments in the literature about Strategic HRM and
contrast of the relatively new OPD theory mainly regarding the performance effect of SHRM
and OPD-SHRM. The focus is on presenting the literature on the OPD theory and SHRM
practices currently used in organizations which are relevant to the research aim and
objectives of this research study. Starting with Section 2.2, this chapter presents the literature
describing SHRM and varied opinions of theorists on SHRM effectiveness in aligning people
with the organization‟s strategy.
Sections 2.5, 2.6 and 2.7 present the literature on OPD theory with emphasis on the
literature about OPD theory as a new approach which addresses the shortcomings of
traditional SHRM in a better and more scientific way. Section 2.9.1 illustrates OPD theory
relative to SHRM practices in its approach to simplifying and better aligning the link between
strategy and people in an organization in an SHRM context.
Section 2.9 details the evidence of clients with better results with OPD theory and
presents an illustration from the literature of OPD theory which shows the potential profit
gain an organization can have by incorporating OPD theory in their SHRM.
2.2 Strategic Human Resource Management
SHRM is a set of HR processes that evolved from studying people behaviors in an
organization where they work together to achieve organization goals. There have been
tremendous changes during the past hundred years. The way an organization works and does
business, the change of vision and goals that an organization pursued 100 years back, the way
social structures and societies have evolved over time, people‟s lifestyles, priorities and needs
have changed to an enormous extent. As people, organizations and businesses have changed
so much in the last 100 years, this implies the same old HR practices and procedures must not
hold true in today‟s scenario. HR practices are science based on empirical evidence (Ravand,
2014).
As defined by Graetz, Rimmer, Lawrence and Smith (2006), SHRM is “The design
and implementation of internally consistent policies and practices, which are aligned with the
organization strategy, to ensure employees contribute to the achievement of business
objectives” (p. 218). This interpretation of the definition of SHRM from Graetz et al. (2006)

13
looks as if merely the implementation of smartly designed policies would get the employee
contributing towards the business objectives. The question is how the employees‟ perspective
would change with the introduction of a system however smart it is. Employees themselves
are separate entities from the organization systems. They are influenced to act differently, and
there must be a mechanism in place to get them engaged and involved in the new system
however smart it is. In contrast to this, we have another definition by Little (2011) which
accounts for employee behavior indicating that the design of the policy alone is not sufficient
but SHRM requires an alignment of staff behavior with the annual goals and targets. The
emphasis is more on getting the consent of the staff to their willingness to follow through the
strategic policies. An administrative consent would be inefficient and would serve no purpose
without having the alignment of the minds of staff ( Little, 2011). There are many different
presentation of SHRM suggested by HR theorist which failed to explores strategy and link it
judicially with HRM. There has been many different presentation of SHRM from HR theorist
which presents HRM as exploring strategy in different dimensions in an attempt to link HRM
with the strategy ( Boxall & Purcell, 2011).
Too many different presentations of SHRM begin and end with HRM exploring
strategy in shallow and superficial ways, and probably only in so far as the concepts directly
link to HRM ( Boxall & Purcell, 2011).
2.3 Evolution of Strategic Human Resource Management
There has been a numerous change in the HR profession in the last 100 years. With
ever changing business and the rapidly changing economy and market, the HR profession has
been continuously evolving and has its scope broadened with new and different roles and
responsibilities. Looking back at the time of the industrial revolution during the period from
1820 to 1840, one will realize that there has been much development in HRM and the
concern was to increase profitability in businesses. The decade of 1980s was a period when
the economic growth was most chaotic, and there was an intense need for HR functions to be
more proactive. HR professionals were looked upon for their significant contributions in
looking beforehand for any human resource crisis and being equipped with the ability to
prevent or at least mitigate them (Gilbertson, 1984). This was the period when the validity
and existence of HR was looked upon as doubtful. Ulrich, Younger, Brockbank and Ulrich
(2012) admit this and say, “HR has not done a viable job of communicating to non-HR
observers the value that HR creates” (p. 5). This lead to a significant amount of research on

14
HR practices enabling HR to actually participate and play crucial roles in effecting
organization profitability and performance.
Major development in SHRM practices happened during the last two decades. During
the last two decades human resource management (HRM) has attracted considerable attention
for being perceived as a distinct approach to dealing with issues related to management of
people (Guest, 1997). In the literature of HRM, a significant development occurred regarding
management of people and issues pertaining to it. The roles of the HR practitioner are
expanding. Besides just strategically dealing with leveraging human capital and delivering
administrative services on a day to day basis, HR functions are expected to do a lot more. HR
practitioners are now looked upon as strategic business partners and considered leaders of
change (Haggerty & Wright, 2009) cited in (Nel, de Wet Fourie, & du Plessis, 2013). As a
consequence of a volley of criticism and questions on the validity of HR functions in the last
decade, a significant amount of research on HR functions followed. It eventually magnified
the scope of HR which is now reflected as the effect of their practices in organization
performance (Ulrich et al., 2012). The competitive industry and demanding market pushed
HR practitioners to go beyond their boundary and restructure themselves to expand their
functional areas (Bryson & Ryan, 2012).
2.4 Shortcomings of Strategic Human Resource Management
According to Guest (1997), there has still not been enough development in SHRM to
appropriately define it as a theory with a theoretical construct. Despite this, SHRM seemed to
have gained the interest of HR practitioners and was making sense in the organizational
context. The then underlying theoretical foundation of SHRM was severely criticized, and
many theorists called for the formulation of a concrete theoretical construct for SHRM (Dyer,
1985; Bacharach, 1989) as cited in (Alcazar, Fernandez, & Gardey, 2005). There were two
main reasons for this severe criticism. Firstly, HRM, which is believed to have formed the
basis of SHRM, had not any defined theoretical framework (Keenoy, 1990; Noon, 1992;
Legge, 1994 as cited in Harris & Ogbonna, 2001). The second reason was perhaps the more
important one. The concept of SHRM was formulated by many researchers who approached
it from different perspectives. There was not any account or attempt to identify the common
thread between different perspectives while laying the theoretical formulation of SHRM
(Delery & Doty, 1996). An appropriate approach would have been first to assess the viability
and adoption of the ideas that came from diverse perspectives and situations and then address

15
them appropriately in the resulting derived construct of the SHRM framework. In many
presentations of SHRM, it was shown to be based on HRM but in a shallow and superficial
way of incorporating strategy. SHRM could not yet be presented as a distinct and direct
concept (Boxall & Purcell, 2003).
2.4.1 Strategic Human Resource Management is looked upon by researchers
as doubtful as a link to organization performance
Although there is a general conception that SHRM is linked with organizational
performance, there is comparatively less understanding of the kind of linkage that there is
between SHRM and organization performance. SHRM implementation has been really
effective in improving organizational performance yet has not been well supported by enough
empirical evidence (Harris & Ogbonna, 2001). Whatever research has been conducted on it
seems not to satisfy the HR theorists and many have argued that linkage between SHRM and
performance requires greater conceptual development and further empirical research (Guest,
1997; Huselid, Jackson, & Schuler, 1997). Perhaps not all factors and variables are being
considered; they need to be identified and should be accounted for in evaluating the degree of
impact of SHRM on performance. Identifying all organizational variables and factors is
important in researching the linkage between the two entities SHRM and Performance (Harris
& Ogbonna, 2001).
Researchers seem to have developed SHRM from HRM in order to emphasize the
importance of the concept of effective functioning of the organization. Many HR authors
have written about the direct association and linkage of SHRM with organizational
performance. High performing organizations have been observed to have adopted some HRM
policies which they can link to organizational strategies. Harris and Ogbonna (2001) say that
regardless of SHRM becoming very popular there is very little evidence of SHRM being
associated with organizational performance. There is not much systematic evaluation of
research to analyze the linkage between SHRM and organizational performance.
During the evolution of SHRM, the emphasis was on finding strategies and ways to
improve organizational performance. There was not much development and research into
methods which could adequately determine the efficacy and outcome of SHRM
implementation. There arose a need for the ability to evaluate SHRM. The call for an
effective method to determine the outcome of SHRM started taking center stage only in
recent times.

16
While examining the relationship of HRM and organizational performance, Rogers
and Wright (1998) proposed a Performance Information Market (PIM) system. PIM provided
a mechanism for researchers to evaluate the objective fulfillment of stakeholders in different
market conditions and enabled stakeholders to evaluate how well an organization is
progressing towards achieving its organizational goal. It was somewhat similar to a balanced
scorecard approach as suggested by Kaplan and Norton (1996).
This approach of a PIM system as suggested by Rogers and Wright (1998) was
appraised and accepted by many authors over time. However, this approach and method of
determination of SHRM effectiveness only holds good for non-profit and public sector
organizations, as here traditional financial measures of success are deficient in criteria.
SHRM still lacked a more generic, broader and global methodology for determination of its
effectiveness on organizational performance.
2.4.2 Strategic Human Resource Management overlooking the ethical
perspective
So far, research only emphasized enabling SHRM for improving organizational
performance. Kaye (1999) raised concerns regarding the ethical perspective of SHRM.
SHRM had only been researched from an organizational or managerial perspective and
probably less had been done to observe its effect on employees of the organization. Kaye
raised questions as to whether SHRM development was ethically right for the employee as
well. The author suggested that SHRM might be improving the bottom line but at the expense
of employees. It actually may have been hurting the employees because they were viewed
only as a „commodity‟ variable among many other variables while factoring in the
determination of SHRM. Kaye emphasized the need for a broader scope of SHRM which also
includes concerns for an organization‟s employees too and indicated the need for SHRM to
be researched from an ethical perspective of employees as well and not just from managerial
and organizational perspectives.
Surprisingly SHRM is not yet believed to be able to harness human capital, the most
primary component in an organization‟s success and performance. According to Hatch and
Dyer (2004); Hitt, Biermant, Shimizu and Kochhar (2001); Kor and Leblebici (2005)
leveraging human capital is one promising area where SHRM needs to concentrate and
improve.

17
Perhaps researchers see the scope for further improvement in the way SHRM
addresses the utilization of human capital. Leveraging human capital represents a means by
which organizations can achieve competitive advantage through their human resources
(Sirmon, Hitt, & Ireland, 2007). Hamel and Prahalad (1993) identify six techniques to
leverage human capital: (1) Concentrating: concentrating the efforts of individuals, a unit and
finally the entire organization on a single strategic central point so the effort from
togetherness can produce magnificent results which otherwise would not be possible
individually. (2) Accumulating: building up a reservoir of knowledge and expertise in the
organization and preserving it over time. (3) Complementing: Applying a strategy to blend
diverse skillset resources in balanced proportion to augment their mutual value. (4)
Enhancing: Improving resource capabilities, keeping them sharp and developing them for
broad applications. (5) Conserving: conserving resources, reutilizing them and shielding
them. (6) Recovering: Implementing strategies that would help in expediting the rate at which
benefits are experienced. Though they are six techniques to leverage human resources,
researchers have explored only one technique which is „Complementing‟. Other techniques
are yet to be explored in order to be able to utilize human capital fully (Lengnick-Hall et al.,
2009). This is one area where SHRM needs to improve and have strategic means which could
leverage human capital in full from all the six facets of human capital leveraging construct.
2.5 Ongoing Professional Development - Strategic Human Resource
Management; a breakthrough, a new ground of study
After all the research and advents in SHRM and despite its shortcomings and gaps, it
has come a long way and has proved its worth in employees' engagement. During its
evolution, there has been a need to target areas which have been overlooked in the
construction phase and address them properly. A breakthrough in required to investigates
how organizations link HR to strategy in SHRM context to SHRM impact on organizational
performances (Cascio & Aguinis as cited in (Lengnick-Hall et al., 2009).
Within an organizational SHRM context, when a strategy is planned, relevant
processes are created for the roll out of the strategy within the organization. After a new
strategy is designed, the role of HR then kicks in, and HR implements the processes within
the organization which enables the employees to become committed and engaged with the
new strategy for the success of organizational goals. OPD-SHRM is a new scientific
approach that redefines this traditional process in an SHRM context which HR has been using
to implement for the rollout of new organizational strategy. This traditional approach or

18
process for the rollout of strategy is based on thinking about the linkage between people and
the organization that has not changed in about 100 years of evolution of SHRM and hence it
gives rise to a question, whether there could be a better way to link people and the
organization in a more integrated and focused way than has been done in the past (OPD
International Limited, 2014b)
Innovations in science have proved that whenever there was a discovery or
formulation of a new intellectual theory, it led to inventions of new technologies and gadgets
greatly improved from the then existing one. The OPD theory is such an improved scientific
foundation of the linkage between people and organizations. It is an invention of a set of
processes, OPD-SHRM, which comprises a new scientific approach for managing linkage
between people and organizations (OPD International Limited, 2014b). This theory
empowers HR to roll out a strategy in a better perceived way to have greater organizational
success. It empowers HR to have SHRM produce better results via OPD-SHRM. It provides
HR with a new improved scientific set of processes for strategy roll out which is more
manageable, measurable and portable in the sense that it enables HR to delegate its
responsibilities among managers and team leaders for strategy implementation and even post-
implementation monitoring. This definitely simplifies the activities of HR for formulation of
the process for strategy rollout, implementation, post-implementation monitoring and finally
the assessment of success thus obtained. With OPD-SHRM, HR can experience even better
results in an SHRM environment in comparison to what HR has been experiencing by
following the traditional process of strategy rollout.
OPD-SHRM concentrates on human psychological thinking and behavior to
understand them and identify scenarios and environments in which human capital can be
more efficient and productive in an SHRM environment. The best thing about OPD is its
approach. It looks from the psychological perspective of human behavior. It concentrates
more on channeling human capital efforts towards working with increased performance and
throughput. OPD-SHRM enables HR personnel to achieve greater efficiency of human
capital and a higher degree of alignment of employees with the organizational strategy. This
eventually results in employee performance throughput which could be many times higher
than what could have been achieved with the traditional process for strategy rollout. OPD-
SHRM is a new dimension of linkage between people and the organization, and it aids

19
SHRM in more successfully setting a direction for employees to align with organizational
strategy. This will further augment the success rate of SHRM.
The possibilities are great. A large quantity of human capital is currently idle and
requires stimulation which can produce magnificent results. For instance, work-life balance is
one paramount theme of SHRM. It has been a buzz word in the SHRM arena for more than
the last 25 years. However, has SHRM really been able to provide for the employees the
much needed work-life balance? Perhaps it has to do with the way SHRM addresses this.
Nowadays technology is so much infused in everybody‟s life that the employee is available
all day. They are always involved; they read emails at night and can send emails while
shopping. The increased demand of technology is making them burn out quicker than ever.
They now have an increased need for work-life balance so they do not wear out and become
drained. Has the encroachment of technology into employee energy and time been accounted
for or does SHRM still use its traditional approach for addressing employees‟ work-life
balance? These are all just examples of the increased demands of work-life balance in the
current workforce (Jackson, 2009).
According to Jackson (2009), it is inefficient to look at work and life as separate
entities. Work is such an integral part of our life that trying to separate them is like trying to
separate sand and beach. On a bad day at the office, the employee carries this home mentally,
physically, emotionally and biochemically. He/she can be more successful if he/she is
allowed to bring more of him/her to work. Rather than trying to separate work from life, a
more fruitful option would be to find how the employee can bring his/her joy, enthusiasm and
his/her fun part to work so he/she enjoys his/her work and work would feel like play. The
words, „child‟ and „play‟ have the same meaning as „education‟ in ancient Greece. Successful
people like Prime Minister John Key did not feel their work was exactly like work but what
they did on a daily basis was their play (Jackson, 2009).
As cited in Tuttle-Yoder and Fraser-Nobbe (1996), Hans Selye, the discoverer of the
General Adaptation Syndrome (GAS), is a researcher in the field of stress. According to Hans
Selye, there are two types of stress. When employees are faced with a situation where they
are expected to perform more than what their skill set is, they will suffer from distress. In a
situation where they face a challenge very easy for them, they would not feel stressed but
then they will lose interest and this would not bring out their peak performance. Another
good type of stress is eustress. This is a good type of stress which employees experience only

20
when they are given a challenge that is just hard enough for them to tackle with their skill set.
This kind of stress will encourage employees to push their limits. Such a challenge will entice
them, and they will tend to get absorbed and become involved in working on the challenge to
experience the ultimate satisfaction once they come through the challenge successfully.
Eustress is good, and that is what HR practice should be trying to achieve in the employees‟
environment. Now this whole discussion concentrates to a single point which is to identify
the assignment which is just difficult enough to product eustress in the employees (Jackson,
2009).
In an OPD-SHRM approach, one can see this human physiological phenomenon as a
basis for achieving improved employee efficiency. Typically in an SHRM environment, the
idea revolved around not stressing the employees and just leaving them satisfied and working
on their own. It was believed that an employee performs best when not under stress. With this
approach of SHRM, the employee never has an opportunity to deal with challenges that can
set the necessary eustress in them and that can drive the employee‟s performance to the peak.
However with an OPD approach in SHRM, the employee faces challenges. The employees
are asked the ideal actions that they can pursue and choose for themselves. Ideal actions are
actions that the employees must perform in order to succeed in an employee‟s role. This is
this best thing about OPD-SHRM. The manager sits down with the employees to decide on
their ideal actions. By letting the employees chooses their ideal action, the manager is
allowing the employees to accept the challenges which are complex and hard enough, but
they think they can handle. They can choose a very easy challenge for themselves, but that is
why the manager is there. The risk of employees selecting actions that would be too difficult
and could create unnecessary stress in the employees is thus ruled out as the employees
themselves have chosen the right actions. The employees have accepted a challenge that is
just difficult enough to be tackled by their skill set. Even if the employees have some
thoughts that they are attempting a difficult task, they have prepared themselves to take that
on and to bring it upon themselves. This sets the stage for necessary eustress in the
employees to achieve peak performance. Scientifically, biologically and physiologically
OPD-SHRM in this way seems to enable employees to stretch themselves to their
performance limits.
This is just one example supporting and justifying the OPD-SHRM model as an
approach that brings out the best of the employees. Besides just the justification, there is

21
empirical evidence of performance effect of OPD-SHRM model that supports arguments of
Nel (n.d.) that “Given the current intellectual development which culminated in the OPD
model, it is noteworthy that the model has been proven with clients in New Zealand who
adopted it, since 2008. It is therefore apparent that the OPD approach also entails practical
solutions and is probably 10 years ahead of current thinking in this field” (p. 1).
The question of the exact causal link between organization strategy and employees‟
behavior formed the foundation for the formulation of the OPD model and the system of
organizational design. Improved social science tools were developed in order to determine
answer to the question of the exact causal link between organization strategy and employees‟
behavior which led to the formulation of the OPD model. OPD model details an organization
design and management where the role of HR overlaps with that of the team leader to work
mutually in guiding staff behavior for a high motivational state of mind to achieve high
performance. Consequently, the introduction of an OPD-SHRM model revises the definition
of SHRM and critics' focus is once again on questioning the role of HR in organizational
strategy making. Little (2011) says, "Typically SHRM was relating human resources to
business strategy; SHRM was then a function of finding and defining the links, effectively
the place of HR within the strategic mix, which in turn tended to define the place of HR and
the VP HR (Vice President Human Resource) at the executive top table" (p. 11).
The SHRM approach with regard to Human Resources is more of an effort to link HR
with organization strategy. Little (2011) is not convinced by the definition of SHRM which
says that HR plays role in strategy making. According to Little (2011), it was an attempt of
many HR thinkers to see HR involvement in the strategy mix of the organization. Patrick M.
Wright, professor of Human Resource Studies in his review of the book „Strategy and Human
Resource Management‟ of Boxall and Purcell (2003) says, "I believe that it is impossible to
study SHRM without a relatively deep knowledge of strategy, and the authors of this book
have demonstrated such knowledge" (p. 146) Though Boxall and Purcell (2011) do not rule
out the possibility that HR can be involved in strategy, Little (2011) disagrees and says that
HR can only occasionally be involved in strategy but then perhaps to a very minor extent. HR
only counts as a cost like many other costs during strategic considerations. In Little's (2011)
own words, "There is nothing usually to place the Vice President of Human Resource in the
team defining strategy, unless the person himself or herself is a solid visionary sort of person.
There is no real HR reason to have him or her present during strategy making" (p. 11). HR
22
primary function and use comes after strategy has been rolled out or during roll out such as
considering a case where there is a shortage of human capital and which is hindering the roll
out or execution of a strategic decision. HR consultation is for those times of need. They
primarily and basically should determine governance of various departments resulting from
strategic roll out by the C-team, for example CEO, CFO and COO of the organization. After
the C-team are ready with strategic decisions, OPD-SHRM processes immediately come into
the picture to manage and figure out best ways to utilize the human capital for an effective
rollout of the strategic decision. What are the goals implied in the strategic decision, what and
how should similar goals be grouped to form a role and further grouped to form teams and
further to a division. Doing so, OPD-SHRM would take care of being realistic and ensure a
role does not have goals too high or complex to be practically achievable. A well laid out
organizational structure is what the OPD-SHRM process addresses which in turn would aid it
in the efficient execution of a strategy ( Little, 2011).
The viewpoints on HR‟s role in strategy are arguable and are against the thinking and
practice of many HR academics and HR practitioners. However these viewpoints miss the
point of the HR-business partnership role in place today that reflects contemporary HRM and
more modern HRM practices, and whether HR should be represented in the top management
team. These arguments have been going on for the last 30 years (since the evolvement of
HRM itself) on which OPD-SHRM has different stances ( Little, 2011).
The current underlying concept and understanding of HR does not actually relate to
the scientific paradigm of social science. This means it does not have a linkage back in social
science for understanding the physiological behavior of organizational capital which HR
were meant to deal with. This is one primary area which OPD theory addresses well in an
SHRM environment.

23
2.6 Ongoing Professional Development – Strategic Human Resource
Management theory explained
OPD-SHRM is an improved science of HR practices which redefines the link between
people and organizations and that best matches and deals with the people‟s behavior in an
organization. This new scientific approach of HR defines a new set of processes which is
called OPD-SHRM (Ongoing Professional Development Strategic Human Resource
Management).
SHRM is based on the psychological assumption that when people are provided with
the freedom to plan their actions and choose by themselves their way of achieving the goal,
they are more independent and motivated. Because people have been provided with freedom
to plan and carry out their actions on their own, they are more satisfied and enjoy a work-life
balance and tend to be more motivated and thus more productive. More productive people in
the organization are more likely to achieve their goals and thus attain a higher rate of success
in the market (Little, 2013).
The existing SHRM is based on the assumption that satisfied people yield success.
Whereas in contrast, OPD theory puts success before satisfaction and says satisfaction
follows success.
OPD theory is based on a scientific and unconventional binding between employees'
behavior and organizational goals. OPD theory enables the team leader to identify the ideal
actions based on KPIs or goals, which are clear, concise and of the nature that accomplishing
them ensures a maximum chance of success. The team leader ensures that the ideal actions
are clearly understood by the team. The employees agree on performing ideal actions with
full commitment based on prior agreement to commitment for success. As the employees are
committed and determined on what they must do, they seek to be more precise in the delivery
of ideal actions. As a result of precision in delivery, when employees are eventually
successful, they feel satisfied. The employees are motivated by achieving their goal with the
execution of the ideal actions derived from the KPIs or goals with their self-discipline and
perseverance (Little, 2013)

24
Figure 2: Organization Structure and Identification of Elements that influence
Behavior of Personnel in the Organization
Source: Nel and Little (2010, p. 49)
The psychological assumptions underlying OPD theory are as follows:
If a person is clear about what they need to do to be successful, he/she can do it more
efficiently;
The person‟s performance then depends on him/her choosing to be self-disciplined
and to do what is required with his/her full commitment and appropriate intensity.
The key psychological aspects of OPD-SHRM:
The OPD-SHRM process is to have the people themselves choose to be successful.
The OPD-SHRM process comprises the following activities:
Agreement for success: Ask the people if they want to be successful and get their
agreement for that.
Psychological insight: They will drive themselves for success as they themselves have
chosen so.
Clear conveying of ideal actions: They should have a clear understanding of ideal
actions in the role assigned to them: ideal actions that they are expected to deliver for
their own success.
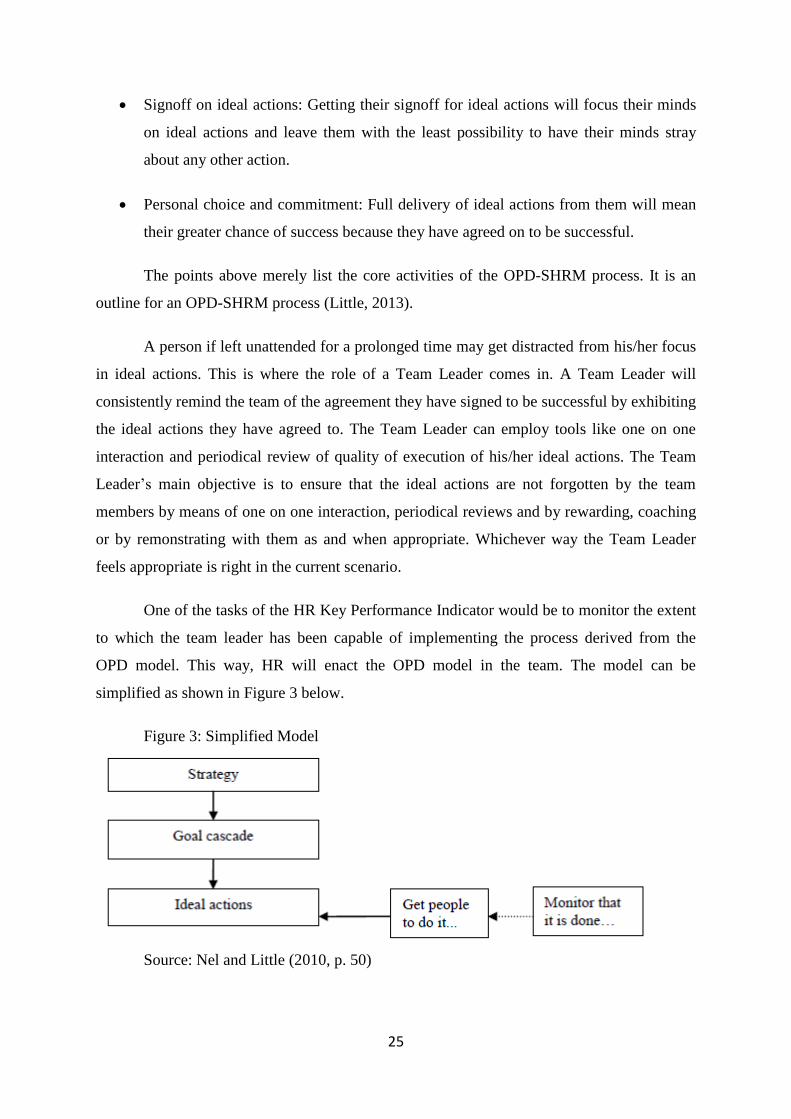
25
Signoff on ideal actions: Getting their signoff for ideal actions will focus their minds
on ideal actions and leave them with the least possibility to have their minds stray
about any other action.
Personal choice and commitment: Full delivery of ideal actions from them will mean
their greater chance of success because they have agreed on to be successful.
The points above merely list the core activities of the OPD-SHRM process. It is an
outline for an OPD-SHRM process (Little, 2013).
A person if left unattended for a prolonged time may get distracted from his/her focus
in ideal actions. This is where the role of a Team Leader comes in. A Team Leader will
consistently remind the team of the agreement they have signed to be successful by exhibiting
the ideal actions they have agreed to. The Team Leader can employ tools like one on one
interaction and periodical review of quality of execution of his/her ideal actions. The Team
Leader‟s main objective is to ensure that the ideal actions are not forgotten by the team
members by means of one on one interaction, periodical reviews and by rewarding, coaching
or by remonstrating with them as and when appropriate. Whichever way the Team Leader
feels appropriate is right in the current scenario.
One of the tasks of the HR Key Performance Indicator would be to monitor the extent
to which the team leader has been capable of implementing the process derived from the
OPD model. This way, HR will enact the OPD model in the team. The model can be
simplified as shown in Figure 3 below.
Figure 3: Simplified Model
Source: Nel and Little (2010, p. 50)

26
Most importantly, as OPD-SHRM imparts in the person a perspective of working for
his/her own professional success, it thus becomes an eminent step for the Team Leader to
celebrate the person's success in a grand enough way to glorify his/her success, so the person
can have the ultimate satisfaction of having finally achieved his/her professional goal that
he/she had previously agreed. Rewarding is a crucial practice to be exercised in this phase of
celebration (Nel & Little, 2010) .
The OPD-SHRM Elements ensures:
• Focus (Are people clear on goals/KPIs?)
• Accuracy: (Are people clear on the ideal actions to achieve those KPIs?)
• Commitment (Are people inclined to do it?)
• Team leader support (Do people feel their team leader is providing the support
and guidance for them to achieve their KPIs?)
• Business processes (Do people think the business processes assist them to do a
good job (Du Plessis et al., 2012)?)

27
Figure 4: Linking the Details of the Role Structure to Define Psychological Targets
Source: Nel and Little (2010, p. 49)
2.7 Ongoing Professional Development – Strategic Human Resource
Management; a manager’s role
The most powerful benefit of using the model in an organization is for HR personnel.
HR has a KPI to quantify managers' efficiency in the execution of OPD processes within
his/her team. The execution of OPD process is more the responsibility of the manager rather
than HR personnel. However, the HR personnel have to ensure that supervisors and managers
have the expertise to implement strategic HR processes. HR personnel observe that the
procedures are being applied correctly. If the OPD-SHRM processes and procedures are not
being implemented then the HR should present a report to the divisional managers to steer
them to take remedial action in order to reinforce the ongoing success of employees. HR‟s
essential role thus remains to supervise and direct ways of improving human performance
that strategically drives the organization toward better results (Nel & Little, 2010).
In OPD-SHRM, the managers‟ responsibility is reduced to just management. They
need to just ensure that the link between staff behavior and organizational goals and outputs
are accurate. The manager can concentrate on his/her other activities like preparing and
28
sending reports to divisions and superiors. Whenever a new strategy to plan is introduced,
such as a new marketing campaign, the manager is simply required to review and identify
changes in the staff‟s behavior necessary to make the new plan or tactic a success. The OPD
model provides the managers with the understanding of how to identify the required behavior
change. The OPD model takes all the guess work out of how to get the best results from the
team. The OPD model works best wherever people are a strategic factor in deciding the
success (OPD International Limited, 2014a).
2.8 Success lies in proper implementation
The processes of SHRM are derived by forward thinking, planning and analyzing the
decision-making process and keeping focus on long term, top-level management actions and
decisions. It is calculated to keeping it aligned with the general strategic management of the
organization. It means the SHRM has to be synchronized with the organization‟s strategic
business needs and plans with all the aspects arising from and related to the organization‟s
personnel (Hartel & Fujimoto, 2010; Kearns, 2012).
Even after careful implementation of selected processes and procedures within the
organization, sometimes returns might not be as anticipated. Does this always indicate flaws
with the SHRM? Alternatively, was it properly implemented? Sometimes the implementation
of a new process fails just because it was not suitably communicated to the employees or if it
was, employees might not have fully comprehended it and actually felt reluctant to raise
questions about it. Miller and Gordon (2014) emphasize the quality of managers‟
communication and say, “If communication is unclear or inconsistent, the employees receive
confused signals. When employees receive confused signals, they are likely to rely on their
own subjective interpretation of what is offered in terms of HRM” (p. 21). A clear
communication is mandatory for proper implementation of a process for all affected
stakeholders. An excellent process can fail in implementation just because there was a lack of
good communication practice. As cited by the Society for Human Resource Management
(U.S.) (2006), research conducted in 2003 by Watson Wyatt, an HR consulting firm, states in
the conclusion that communication drives business performance and is a key factor of
organization success. Everyone appreciates clear, concise communication that is easy to
understand, and everyone appreciates it when someone takes the time to check their
understanding. All employees benefit when good communication practices are put in place.
29
Good communication practice is that one essential component of the infrastructure an
organization will always require for proper process implementation.
There are numerous debates on whether HR personnel should be held responsible for
inadequate HR outcomes. Some looming questions on the validity of HR function are;
Firstly, how can HR add value? Secondly, does HR possess the abilities of being a strategic
partner? Thirdly, how can HR managers ensure HR personnel remain committed during times
of turbulence (Larsen & Brewster, 2003)? The aforesaid limitations, suggest that
organizations‟ strategic planning process should be reconsidered in terms of how HR
management contributes to accomplishing the required output as part of an overall strategic
objective achievement (Holbeche, 2009).
Delahaye (2005) observed that SHRM forces managers to embrace traditional mind-
set of looking at and thinking about the management of employees. The failure of managers
to manage employees effectively leads to failure in getting the desired results from the
implementation of SHRM. The answer lies in measuring HR-KPI. SHRM appears as a
significant and critical factor in organizational success. The Human Resource – KPIs keep a
check on whether managers are implementing the significant and appropriate strategic HR
procedures and processes within their teams. If HR processes are properly implemented, only
then would the psychological and architectural structure be in place to confirm that the
organization would actually achieve its strategic goal and success (Nel & Little, 2010).
In some cases the KPIs are estimated to be significantly high, but still the organization
does not come out relatively successful. This is an indication to the principal leadership that
the problem has initiated from other external factors, which could be any of the economy,
market, product or selection. So, if employees are trying harder but do not produce the
desired result, the failure should not always be suspected to be a lack in the leadership or
employee performance (Nel & Little, 2010).
2.9 Performance effect of OPD-SHRM
2.9.1 What makes OPD-SHRM work?
OPD is an intellectual principle that enables clear identification of leadership and HR
processes that drive an organization‟s strategies and eventually improves results thereby

30
increasing profits, employee engagement and creating satisfaction(OPD International
Limited, 2014b).
The fundamental principle of OPD-SHRM is that for each goal, specific clear actions
must be executed in order to achieve the goals. In OPD-SHRM terminology such specific
clear actions are called „ideal actions‟ and defined as those actions which when executed,
offer the greatest chance of greatest success (OPD International Limited, 2014b).
The task is limited to identification of clear ideal actions for each goal within different
roles. Once the ideal actions are identified and clearly understood, it will be acted upon with
more precision, skill and commitment which must improve the result (OPD International
Limited, 2014b).
As mentioned by Nel (2010) in a testimonial, OPD is judged 10 years ahead of the
field as a result of intellectually thorough foundations, and the tested and proven processes
enabling easy implementation.
2.9.2 Easy and clear identification of performance lapses and controls
Within OPD-SHRM, identification of performance lapses and its controls is relatively
easy. The basic principle is to monitor the business by monthly results and from that identify
which ideal actions need improvement and then coach people in the better delivery of those
ideal actions.
The team leader will keep a check of performance lapses and take measures to control
it by four different ways.
Performance Management: The team leader will manage the team performance on a
daily basis. The team leader will ensure that ideal actions are distinct and clearly written on
paper. The ideal actions are clear in the mind of the staff as the best and only way to ensure
the greatest success.
Performance Review: The second activity of the team leader is Performance Review.
The team leader will meet with the staff every few weeks and review their success. The team
leader will discuss the ideal actions, what the staff finds difficulty in delivering and ideal
actions, and what the staff feels went well which enabled the success. As required the team
leader will either coach the staff to improve on the delivery of that ideal action or may review

31
the ideal actions. The objective is to maintain the ideal action at the forefront of the minds of
the staff.
Management by Wandering Around: The Manager walks around in the team and
watches people delivering ideal actions and ensures they are doing it correctly. If required,
the manager provides assistance and mentoring to correct them. He/she watches ideal actions
acted upon and if anything appears wrong with an ideal action, takes note so it can be revised.
Fun at Work: Last but not least, it is important to incorporate fun in the job. People
must enjoy what they are doing and have fun doing it.
The performance effect of OPD-SHRM is estimated from the results obtained from
clients where ODP-SHRM has been implemented.
To estimate the increase in results, two crucial aspects within the organization under
observation are to be assessed.
1. The link between ideal actions and the profit profiles which is also called Ongoing
Professional Development Profit Profile Link (OPDPPL).
Profit profiles are the main components which participate in evaluating profit and are
directly related to KPIs achieved. Ideal actions as defined relate to KPIs such as the link
between ideal actions and KPIs is a causal link. This means, if the ideal actions are delivered
more efficiently with an increase of quality then goal achievement will increase with the
greatest possibility that under the conditions all external factors remain the same (Little, n.d.;
Nel & Little, 2014).
So, in term of questions, the first aspect which is to be assessed is:
“For every 1% increase in effectiveness of delivery of ideal actions what will be the
increase in the goal achievement” (p. 23)?
Based on the resulting data obtained from clients with OPD-SHRM, the different
OPDPPL has been assessed for change due to improved effectiveness of delivery of ideal
actions.
• For sales revenues OPDPPL, there is a 0.3 to 0.4 increase.

32
• For direct costs OPDPPL, there is a 0.2 to 0.3 reduction.
• For overheads OPDPPL, there is a 0.1 to 0.2 reduction.
OPD-SHRM has maximum impact on sales revenue OPDPPL because Sales has a
direct relation with performance. As performance increases, the sales OPDPPL are impacted
the most. Overhead OPDPPL has the least improvement because it depends upon the
overhead costs required for sales or production and comprises costs such employees‟ salaries.
This OPDPPL will only show a significant impact when there is a cut down of number of
employees.
2. The second aspect to be assessed is the potential increase in delivery of ideal
actions within a team, unit or entire organization.
“What percentage increase in delivery and effectiveness of ideal actions is possible
with this person (group of people, team, division, or whole organization” (p.23)?
Within OPD-SHRM, the team leader process enables the team leader to develop
improved delivery of ideal actions in the individual. The team leader works each month with
each staff member and develops the improvement in delivery of ideal actions.
From empirical evidence and data collected to date from organizations with
traditional SHRM, even well performing organizations, the OPD-SHRM model can bring 8%
increase in aptness, accuracy of ideal actions and efficiency in delivery of idea actions. In
organizations with low SHRM and low performing organizations, the potential increase is
about 20% ( Little, n.d.).
2.9.3 Illustration of impact on organization profit with OPD theory
Based on the above two points, how much OPDPPL improves with 1% increase in
delivery of ideal actions and how much potential increase in delivery of ideal actions is
possible with an organization, the increase in profit can be estimated.
Below is an illustration of an organization, assuming it has revenue of $200,000,000
with 80+ staff members. The organization makes a profit of 8% of the revenue, i.e.
$16,000,000. The organization‟s SHRM is reasonably good and hence its potential gain in
people performance is assessed to be 10%.
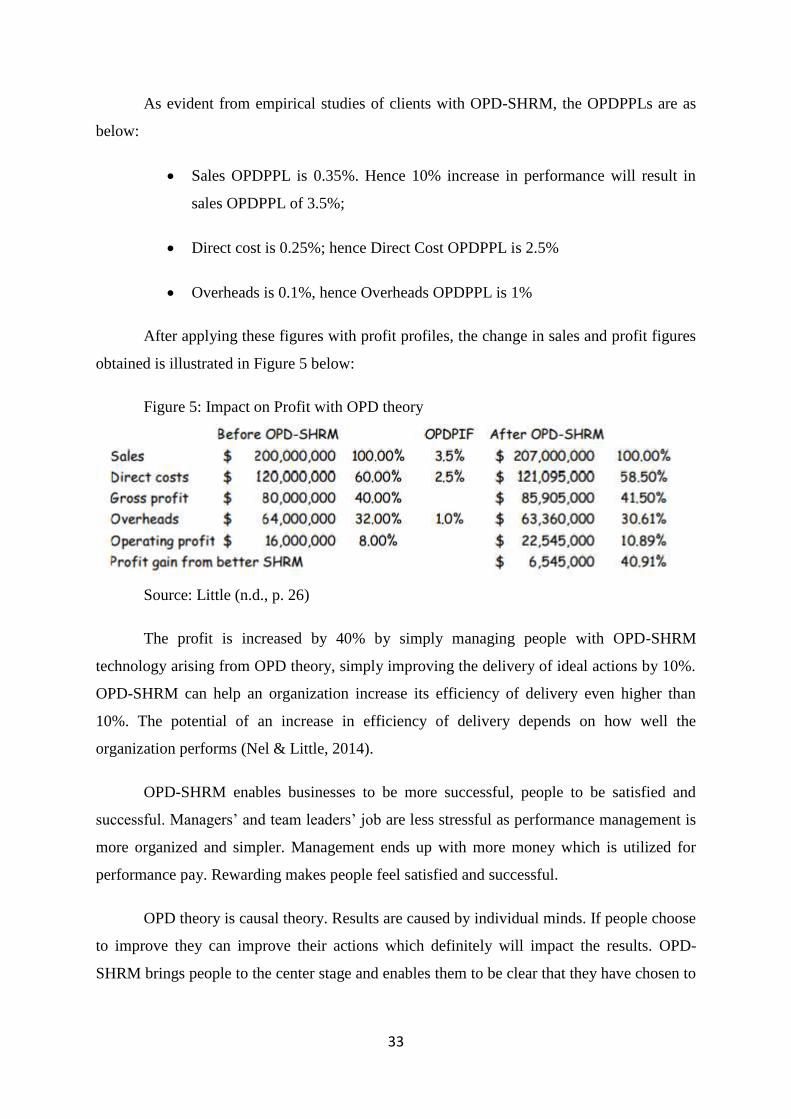
33
As evident from empirical studies of clients with OPD-SHRM, the OPDPPLs are as
below:
Sales OPDPPL is 0.35%. Hence 10% increase in performance will result in
sales OPDPPL of 3.5%;
Direct cost is 0.25%; hence Direct Cost OPDPPL is 2.5%
Overheads is 0.1%, hence Overheads OPDPPL is 1%
After applying these figures with profit profiles, the change in sales and profit figures
obtained is illustrated in Figure 5 below:
Figure 5: Impact on Profit with OPD theory
Source: Little (n.d., p. 26)
The profit is increased by 40% by simply managing people with OPD-SHRM
technology arising from OPD theory, simply improving the delivery of ideal actions by 10%.
OPD-SHRM can help an organization increase its efficiency of delivery even higher than
10%. The potential of an increase in efficiency of delivery depends on how well the
organization performs (Nel & Little, 2014).
OPD-SHRM enables businesses to be more successful, people to be satisfied and
successful. Managers‟ and team leaders‟ job are less stressful as performance management is
more organized and simpler. Management ends up with more money which is utilized for
performance pay. Rewarding makes people feel satisfied and successful.
OPD theory is causal theory. Results are caused by individual minds. If people choose
to improve they can improve their actions which definitely will impact the results. OPD-
SHRM brings people to the center stage and enables them to be clear that they have chosen to

34
be successful. OPD-SHRM simplifies success for them and by merely delivering improved
actions, they become successful.
Research is underway for refining the profit profile links so assessment of results
from OPD theory can be more measurable and more accurate. OPD theory is validated by
science and proven in clients (Little, n.d.).
In eight months, a retail electric chain experienced an increase of profit by 22%
which equates to $700,000 of annual profits.
In ten months, sales gross profit of a food manufacturing business grew by 5%.
In fifteen months, a small foundry business with 20 staff experienced a rise of
gross profit from 42% to 58% ( Little, n.d.).
2.9.4 OPD addresses human capital development and reaps many benefits
A clear improvement in profit of up to 5% of revenue with a working average of
3% has been observed.
People engagement is significantly improved.
Because individual success increases, satisfaction automatically follows.
Fun at work is ensured by the team manager.
A culture of professionalism and focus on performance is built.
People become self-responsible with their commitment for being successful.
Performance management becomes simpler and it improves talent identification.
Theoretically any business that depends upon people for strategy delivery will benefit
from OPD-SHRM. It applies equally with any social culture. If it works for one group of
people, it applies similarly to all people if and only if the individual chooses to apply it (OPD
International Limited, 2014b).
2.10 Summary
One of the primary functions of HR is to rollout any new strategy in an SHRM
organization. The HR process should assist HR to align people to the organization‟s strategy.

35
There is no theoretical framework of SHRM which proves the validity of HR for really being
able to associate people with strategy thereby creating better results in achieving organization
goals. Strategic Human Resource Management has been doubted as truly being able to link
people with organizational strategies. The role of HR was once under the scanner for whether
they really contribute to organizational profits. Their validity was questioned. Many theorists
see SHRM as HRM with some implementation of processes for aligning people with the
organization‟s strategy. The main psychological assumption on which SHRM is based is that
satisfied people produce better results and hence in an SHRM environment, all efforts go into
keeping a satisfied workforce. The OPD theory is a relatively new theory, scientifically
proven and supported by empirical evidence obtained from the clients. They are experiencing
better results with OPD theory incorporated into their SHRM. OPD theory has a reverse
finding to SHRM, according to which satisfaction follows success. The OPD theory begins
with working from the minds of individuals. If the mind of the individual is committed and
guided, success will follow.
The next chapter is Research Methodology which presents the various methods of
data collection utilized as well as the overall approach for investigating the research problem.

36
Chapter 3: Methodology
3.1 Introduction
Methodology is a systematic approach, and the methods utilized to collect information
for a research study. Chapter Three outlines the general methodology involved in this study
and discusses the population, sampling procedures, the tools and approaches employed for
data collection for the research study. Section 3.2 outlines the role of sampling techniques in
a research study and relates to the kind of sampling used in this research study. The actual
method and approach followed for sampling in this research study is discussed in Section
3.2.1. This research is based on the primary data collected. Section 3.3 details the mixed
method approach utilized for this research in terms of primary data collection and Section 3.4
describes the various primary data collection methods utilized, whilst the various primary
data collection approaches are discussed in Section 3.4.3. Both methods of qualitative and
quantitative methods of data collection for the research have been discussed. This chapter
also details the design and appropriateness of the data collection methodology utilized for this
research study.
The chapter concludes with Section 3.5, ethical considerations and guidelines
observed for the conduct of the research study for data collection and is followed by a
summary in Section 3.6.
3.2 Sampling
It is impractical to investigate the whole population to obtain useful and valid
information about the population. Sampling is a method to reduce the number of individuals
or entities of a population under investigation. It has many advantages. Sampling reduces the
cost and time for gathering the information from the population. Often high-quality
information and a high response rate are possible with a small number of participants from
the population. Good quality information is preferred over bad quality information
irrespective of it being collected from the whole population. As long as the entities included
in the sample genuinely represent the population, the result obtained will symbolize the
whole population (Vetter & Matthews, 1999).
The sampling process can be described as a three step process. The first step of the
sampling process is the identification of the sample population. The population includes all
the people and subjects that the research study intends to study. The unit of sample
population can be people, organizations, groups, countries, objects or any entity which the

37
research study needs to analyze. The second step in the sampling process is choosing a
sample frame. A sample frame is an available and accessible portion of the sample population
(usually geographically located in the vicinity of the researcher or whose contact information
is available) which can be contacted or made easily available for surveying or analysis. The
third and last step in the sampling process is selecting the sample from the sampling frame
that will actually be analyzed, studied or surveyed in the research using a well defined
sampling technique (Bhattacherjee, 2012).
There are several different sampling techniques available. Sampling techniques are
broadly classified into two groups 1) Probability Sampling and 2) Non-probability sampling.
In Non-probability sampling techniques, the sample is created out of sample elements
which have been chosen without any equal chance of selection (Explorable.com, 2009a).
Whereas, in a probability sampling, all qualifying elements have a known probability of
being present in the sample or each qualifying element has an equal probability of being
chosen in the sample (Explorable.com, 2009b).
If random selection is done properly, it is a true representation of the whole
population and research results will be a true representation of data from individual
participants. The advantage with probability sampling is that it eliminates the chance of both
systematic and sampling bias, but it comes with a cost. The drawback with the non-
probability sampling method is that it does not sample the entire popullation and thus the
sample may not be an accurate representation of the entire population. Therefore, the results
cannot be generalized for the entire popullation. As almost all researches have a limitation of
time and resource, often the non-probability sampling techniques is a more viable option than
the probability sampling techniques (Explorable.com, 2009a).
Some types of probability sampling are simple random, stratified random, systematic
random, cluster random, mixed/multi-staged random samplings, and some types of non-
probability samplings are convenience, consecutive, quota, judgmental, snowball sampling.
The sampling technique involved in this research is a mix of both simple random
probability sampling and non-probability convenience sampling.
Simple random sampling is the purest form of probability sampling. Each member of
the population has an equal or known chance of being selected. It can be as simple as first

38
including all the members of population in the list and then randomly selecting the desired
number of participants for the research (StatPac Inc., 2014).
The second approach used in the research for sampling is convenience sampling. In
this case, participants are not selected at random, but are normally recruited through soliciting
volunteers from a population or appeals to community groups such as clubs or churches. In
this research, the researcher attended events similar to job fairs, which have various
organizations‟ representatives as invitees. Often an effort is made to obtain quotas of
individuals with particular demographic characteristics to achieve equal or nearly equal cell
sizes (Hultsch, MacDonald, Hunter, Maitland, & Dixon, 2002)
The advantages of this convenience sampling include easy availability of subjects and
faster accrual of samples with less cost. The disadvantages are the risks that the sample might
not represent the population as a whole, and volunteers might create a bias. For example, if
an study is conducted to determine average sex and age of coffee drinkers at Starbucks during
four hours of weekday afternoons, the study is very much likely to be have
overrepresentation of elderly people who are retired and do not pursue any occupation. The
study will be underrepresented by the young people, who rarely would be seen at Starbucks
during afternoon as they are more likely to be at school or at work during weekday afternoons
(WebFinance Inc, 2014).
3.2.1 Participant selection
The eligible participants for this research were all service organizations of Auckland,
who have more than 25 employees and have at least five years of establishment. A cap on the
years of establishment was required to filter out organizations that were relatively new and
most likely to be in a construction phase or a too early stage of HRM to be considered to have
a mature HRM in place. The researcher‟s intention was to select organizations which have a
mature SHRM process in place and have experienced diverse situations in regard to its
employees and HRM in the organization.
As this researcher intended to assess SHRM in New Zealand organizations, it was
important to exclude those organizations from the sample which do not yet have a fully
operational SHRM. The researcher therefore sampled only those organizations that have
come through diverse situations for at least 5 years, so as to have a functional, operational
and mature SHRM in the organization.

39
The cap on the number of employees was required to exclude small organizations
from the research study. Small organizations have a limited budget for management expense
and they normally do not have a Human Resource Management department or SHRM
processes (Nel & Simpson, 2013). In a country with a population of over 4 million people,
enterprises with 20 or fewer employees are classified as small to medium-sized enterprises
(SMEs) (Ministry of Economic Development New Zealand, 2011; Nel & Simpson, 2013).
Also, as OPD theory impacts organizations‟ SHRM effectiveness via improvement in
employees‟ performance, the study of this effect was thus pertinent only for organizations
with a large enough number of employees where OPD theory affects SHRM in significant,
observable and measurable magnitude. In the same vain this research study is limited to a
sample which mainly focuses on service organization in New Zealand.
The sampling technique involved is a mix of convenience sampling and random
sampling whereby the participating organizations were chosen.
The research project needed to study ten New Zealand organizations. The researcher
visited a number of events held within Auckland to find the research participants. Events like
CPA Career Fair, held at The Pullman, Auckland and „Speed Networking with Industry‟
event held at Unitec, Auckland proved a hub for connecting with New Zealand organizations.
The researcher attended those events primarily to connect with the representatives from
various Auckland organizations. These events proved to be an initial source of potential
participants for the research. Almost all eligible organizations present at the events were
contacted and the research project was explained. Following these events, after some follow-
ups, many organizations showed their interest in participation and some expressed their
inability to participate due to their current workload. All eligible interested organizations
were then readily selected in the research sample.
Some organizations were taken onboard by contacting them via personal contacts
already working in those organizations and some were searched for on the Internet and
LinkedIn for their contact information and then were contacted and asked for participation in
the research study.
The sampling frame includes organizations which could be reached in events like
career fairs and networking held across Auckland, New Zealand. Other organizations which
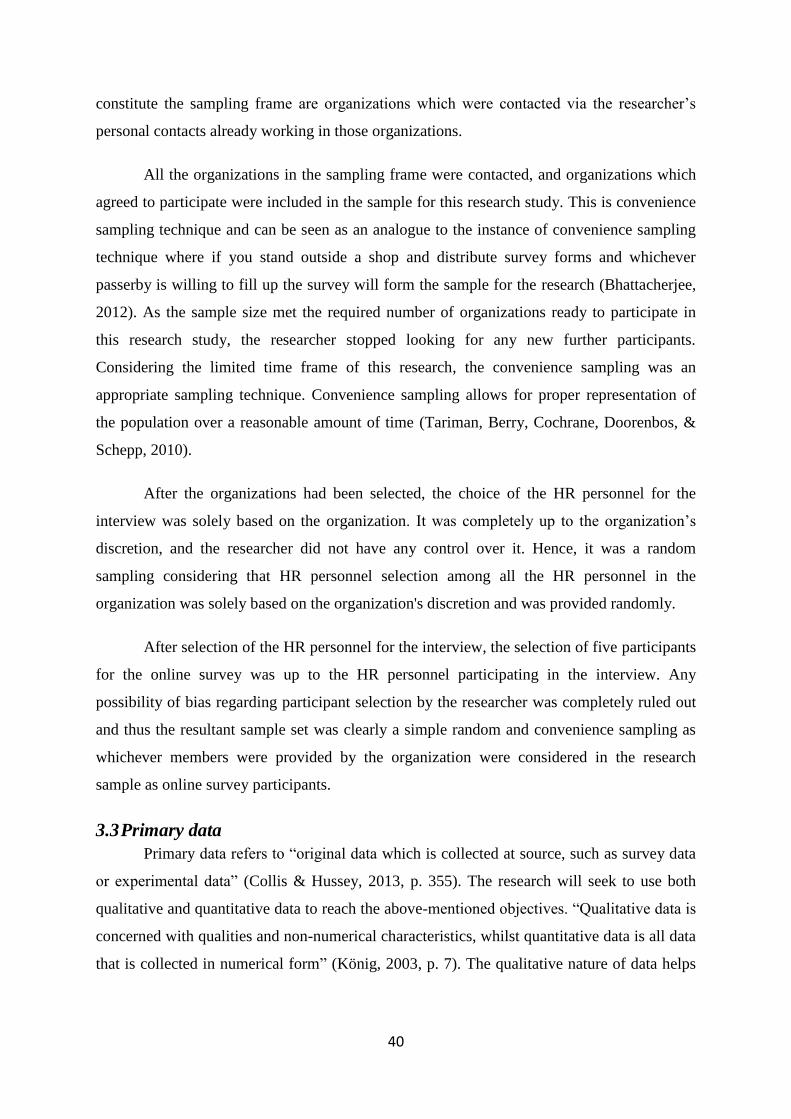
40
constitute the sampling frame are organizations which were contacted via the researcher‟s
personal contacts already working in those organizations.
All the organizations in the sampling frame were contacted, and organizations which
agreed to participate were included in the sample for this research study. This is convenience
sampling technique and can be seen as an analogue to the instance of convenience sampling
technique where if you stand outside a shop and distribute survey forms and whichever
passerby is willing to fill up the survey will form the sample for the research (Bhattacherjee,
2012). As the sample size met the required number of organizations ready to participate in
this research study, the researcher stopped looking for any new further participants.
Considering the limited time frame of this research, the convenience sampling was an
appropriate sampling technique. Convenience sampling allows for proper representation of
the population over a reasonable amount of time (Tariman, Berry, Cochrane, Doorenbos, &
Schepp, 2010).
After the organizations had been selected, the choice of the HR personnel for the
interview was solely based on the organization. It was completely up to the organization‟s
discretion, and the researcher did not have any control over it. Hence, it was a random
sampling considering that HR personnel selection among all the HR personnel in the
organization was solely based on the organization's discretion and was provided randomly.
After selection of the HR personnel for the interview, the selection of five participants
for the online survey was up to the HR personnel participating in the interview. Any
possibility of bias regarding participant selection by the researcher was completely ruled out
and thus the resultant sample set was clearly a simple random and convenience sampling as
whichever members were provided by the organization were considered in the research
sample as online survey participants.
3.3 Primary data
Primary data refers to “original data which is collected at source, such as survey data
or experimental data” (Collis & Hussey, 2013, p. 355). The research will seek to use both
qualitative and quantitative data to reach the above-mentioned objectives. “Qualitative data is
concerned with qualities and non-numerical characteristics, whilst quantitative data is all data
that is collected in numerical form” (König, 2003, p. 7). The qualitative nature of data helps

41
the researcher to understand subjective aspects of the objectives. That is, this data can be used
to explore possibilities, causes and generate new ideas.
A qualitative approach for data analysis becomes essential in dealing with subjects
like Human Resources. Human Resource is an entity which responds to external and as well
as internal environments like emotions, habits, moods, and many different human biological
sensorial emotions. It is a rather unpredictable subject and to analyze a generalized theory
relating to human resources, study of behavior from qualitative aspects becomes
indispensable.
This research study has utilized both kinds of data collection methodology, qualitative
and quantitative and thus can be termed as mixed method research. A mixed method research
approach can use both qualitative and quantitative methods in the same research analysis in
order to fully understand the various phenomena of interests of the research study. As
Tashakkori and Teddlie (2003) define mixed method, at its core, it involves the use of
multiple research methods or more than one world view (i.e., qualitative and quantitative
approaches). Ridenour and Newman (2008) and Tashakkori and Teddlie (2003, 2009) named
mixed methods as a third paradigm of research methodology with the first and second
research methodology paradigm being the quantitative and qualitative research methodology.
Proponents of mixed methods research equally emphasize the importance of both the
qualitative and quantitative research methodology paradigm for deep analysis of subjects of
interest.
A mixed method research can utilize the qualitative and quantitative methods in
different ways. It can be used either concurrently (or independently), when findings from one
method are separate from other methods and represents information regarding the separate
interests of the research study or sequentially, when findings from one method are used to
support or infer findings from the other method (Venkatesh, Brown, & Bala, 2013). Creswell
and Clark (2007) further refined the mixed research method into four major research methods
designs. Based on the different ways a qualitative and quantitative study can support a
research proposition, Creswell and Clark (2007) broadly classified mixed method research
into 4 different categories; 1) Triangulation: a mixed research method where the research
question is answered based on both the quantitative and qualitative data; 2) Embedded: The
research study involves a broad range of data collection through both the methods, qualitative
and quantitative where either qualitative or quantitative data is used in answering the research

42
question. 3) Explanatory: The qualitative study helps support the findings of quantitative
study and helps understand the cause of quantitative result. 4) Exploratory: quantitative data
is collected to understand different aspects observed in qualitative study.
A mixed method research approach has the advantage, for example, that interviews as
a qualitative data collection approach can provide the researcher with the depth of
information regarding a research study. Open questions in interviews can enable deep
understanding and information on subjects of interest, whereas the quantitative data
collection approach helps the researcher to gather a breadth of information regarding a study,
whereby the researcher collects information from a wide number of respondents over a fixed
range of aspects of the research study. Both approaches utilized together in a research study
can provide a more accurate and better result in a research study (Venkatesh et al., 2013).
However similar research questions can arguably be answered from both qualitative
and quantitative analysis. Qualitative study has been predominantly used in typical areas like
social sciences primarily in order to perform exploratory research which may induce some
deep understanding and related inductive theoretical concept which may trigger other aspects
related to the study (Punch, 2013; Walsham, 2006). As the subject of this research also deals
with people, the study of managing people for guided behavior can be considered a subset of
the study of social science. Thus, it is essential to employ a qualitative approach in this
research study along with quantitative methods for data collection.
A mixed method approach can arguably be advocated to have many advantages.
According to Teddlie and Tashakkori (2009), the meta-inference is one big advantage of
mixed method research. Meta in a literal sense means, „of higher order‟ and Teddlie and
Tashakkori (2009) call it an essential component of mixed method research. With meta-
inference, Teddlie and Tashakkori (2009) mean inference that represents an integrated
viewpoint of research of interest from both the qualitative and the quantitative strands of
mixed research methods.
The researcher used „Personal Interview‟ as a method for qualitative data collection
and interviewed HR personnel from different service organizations of Auckland. The
interview was a structured interview. The interview questions were given to the participants
many days before the actual interview so that they could be ready with the answers. The
researcher expected them to come after having brainstormed the questions regarding SHRM

43
and OPD-SHRM. Perhaps some had also had thoughts on some aspects of Human Resource
Management, which they planned to put forward during the interview. The researcher was
interested in knowing the feelings and experience of HR practitioners, which they have
realized over these many years working as HR practitioners.
3.4 The methods for primary data collection:
3.4.1 Interviews
Interviews are one-on-one question and answer sessions and provide much
information from a small number of people besides being useful when one wants to get an
expert or opinion on a subject. The researcher assumes that in one on one interviews, people
discuss their ideas openly.
The researcher‟s task is to interview the HR managers. As they specialize in HR
practices, they are the best people to discuss HR strategies and the new OPD theory. They
can actually contrast their HR practices with the modern OPD-SHRM model and can express
useful information for the research. The objective of interviewing HR people is to have an
open discussion with them. The researcher has them expound beyond what the researcher had
planned to ask them. The researcher is able to get more subjective answers to the questions,
which would not be possible with questionnaire forms. The interview questions for HR
managers are included in Appendix 5.
In addition, interviews with HR managers give the researcher first-hand information
about their employees and their work culture before sending out questionnaire forms to them.
The interviews were recorded to enable the researcher to listen to them later to
analyze and extract information.
3.4.2 Questionnaires
As cited by Collis and Hussey (2013) questionnaires are a popular method for
collecting data. A questionnaire survey is an inexpensive and less time consuming method
than interviews, and very large samples can be investigated. The questionnaire can reflect
open-ended, closed, multiple choice questions and use rating scales, as these help the
researcher to pursue both aspects of data. The questionnaire provides exact information and
can be utilized to study respondents‟ opinion, views, believes preferences and attitude.
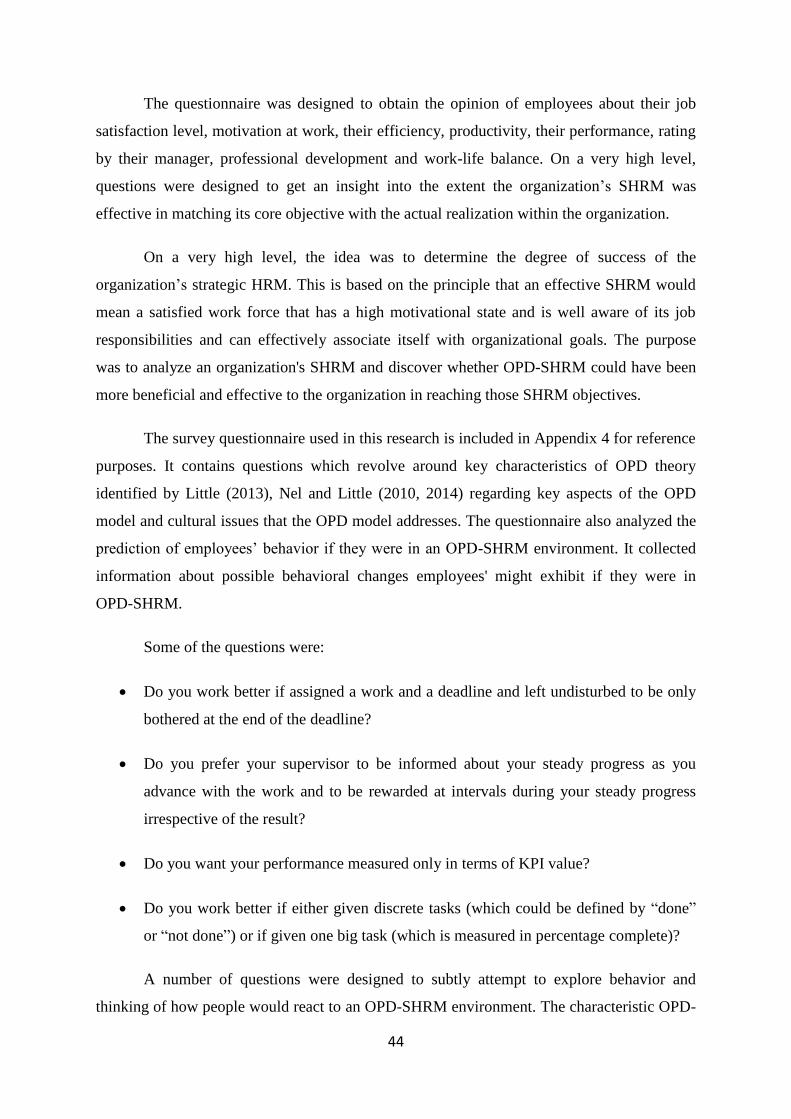
44
The questionnaire was designed to obtain the opinion of employees about their job
satisfaction level, motivation at work, their efficiency, productivity, their performance, rating
by their manager, professional development and work-life balance. On a very high level,
questions were designed to get an insight into the extent the organization‟s SHRM was
effective in matching its core objective with the actual realization within the organization.
On a very high level, the idea was to determine the degree of success of the
organization‟s strategic HRM. This is based on the principle that an effective SHRM would
mean a satisfied work force that has a high motivational state and is well aware of its job
responsibilities and can effectively associate itself with organizational goals. The purpose
was to analyze an organization's SHRM and discover whether OPD-SHRM could have been
more beneficial and effective to the organization in reaching those SHRM objectives.
The survey questionnaire used in this research is included in Appendix 4 for reference
purposes. It contains questions which revolve around key characteristics of OPD theory
identified by Little (2013), Nel and Little (2010, 2014) regarding key aspects of the OPD
model and cultural issues that the OPD model addresses. The questionnaire also analyzed the
prediction of employees‟ behavior if they were in an OPD-SHRM environment. It collected
information about possible behavioral changes employees' might exhibit if they were in
OPD-SHRM.
Some of the questions were:
Do you work better if assigned a work and a deadline and left undisturbed to be only
bothered at the end of the deadline?
Do you prefer your supervisor to be informed about your steady progress as you
advance with the work and to be rewarded at intervals during your steady progress
irrespective of the result?
Do you want your performance measured only in terms of KPI value?
Do you work better if either given discrete tasks (which could be defined by “done”
or “not done”) or if given one big task (which is measured in percentage complete)?
A number of questions were designed to subtly attempt to explore behavior and
thinking of how people would react to an OPD-SHRM environment. The characteristic OPD-

45
SHRM environment is based on the propositions by Little(2013) and Nel and Little (2010,
2014) for the OPD-SHRM model. Readers must note that one cannot delve into the psyche of
respondents and therefore this research merely seeks their opinions which could perhaps be
indicative of possible behavior changes attributable to the use of the OPD-SHRM model.
3.4.3 Data analysis
As mentioned by Ulrich, Younger and Brockbank (2008), the SHRM objective from
employees‟ perspective is to provide them with work-life balance, job satisfaction, good
employment relations and adequate and fair rewards. The SHRM objectives are not just about
the organization‟s objectives to fully utilize its employee base but also to respond to
employees‟ demands from the organization. The research questions were designed to learn
directly from the employees to what extent they felt their company SHRM was able to
successfully fulfill those demands.
The questionnaire has three types of questions. Type 1 questions are questions to
ascertain how successful the existing SHRM was in achieving its objectives. Type 2
questions were to assess the extent of OPD-SHRM already present in the existing SHRM.
This type of question sought to determine the characterizing attributes of OPD-SHRM
already present and being exercised in the existing SHRM of the organization. The purpose
was to find the correlation between the extent of the presence of OPD-SHRM and the extent
of HRM objectives being met in terms of employees' performance, their satisfaction level and
general HRM objectives. Type 3 questions presented the respondents with some hypothetical
scenarios of an OPD-SHRM environment and asked about their hypothetical behavior in such
an environment. Do they feel they would be performing better, more productive and would be
leading a happier life? Would they be feeling more coupled to the organization and would
realize their value for the organization? Type 3 questions sought to understand the behavior
of employees in an OPD-SHRM environment. Would their behavior be more inclined
towards meeting the SHRM objectives?
This research project has used the statistical methods of multiple regression and
Pearson correlation coefficient to find the correlation between the OPD elements present in
SHRM in New Zealand organization and effectiveness of SHRM. Although there are many
other methods of determining the correlation between two variables, Pearson product-
moment correlation coefficient is the most widely used method and is said Pearson
correlation coefficient(Dewberry, 2004).

46
The value obtained for type 1 question represents the extent of OPD elements in the
SHRM of New Zealand organization. The value of Type 2 questions represents the measure
of effectiveness of SHRM in New Zealand organizations.
“Correlation coefficient is a number that summarizes the nature of relationship
between two variables” (Hatcher, 2003, p. 290). The larger the correlation coefficient number
is (absolute value), the stronger the relationship would be. Two variables with higher
correlation coefficient mean that the two variables are related and it though does not
determine any causality between the variables (Weinberg & Abramowitz, 2002). However, a
positive correlation means that the extent of OPD element is directly proportional to SHRM
efficiency whereas a negative correlation would mean exactly the opposite. At the same time
the magnitude of correlation coefficient indicates the degree of relationship between the two
sets of variables, one set indicating the extent of an OPD element and the other, SHRM
efficiency (Hatcher, 2003).
Multiple regression correlation (MRC) technique is an extended form of bivariate
linear regression statistical method. It is used to evaluate the value of one or more variables
from the values of another set of 2 or more variables. The variable that is to be predicted is
also called dependent, target, outcome or criterion variable. The variables that are used to
predict the values for dependent variables are called independent, the predictor, repressor or
the explanatory variables (Lund Research Ltd, 2013) . The researcher uses the MRC
technique for predicting the effect of the presence of OPD elements in the SHRM in New
Zealand organizations on SHRM outcomes.
Multiple regression statistical technique is used for forming equations for linearly
related variables. However, it has broadly been used to describe complex relationships in
fields of social science, behavioral science, business, health and education (Cohen, Cohen,
West, & Aiken, 2013). These relationships are not patently rectilinear, yet MRC can be used
to describe complex relationship in these fields. Cohen et al. (2013) say, “The critical point is
the capacity of MRC to represent any degree or type of shape – complexity is yet another of
important feature which make it truly a general data-analytic system” (p. 9). As this research
study investigates businesses‟ strategic ways of management of people that influence
people‟s behavior favorable to the business and as well as themselves, this technique very
well fits in this case also.

47
The last section of the survey questionnaire is the demographic section where the
participants are asked their age group, level of education and gender. Generally younger
workers are more adaptive and probably striving more to achieve their professional goals in
comparison to their older more experienced colleagues. Finding the difference between the
opinions of these two groups of people based on the number of years of industry experience,
would be interesting. Variables like age, level of education and gender play an enormous role
in how an employee perceives an HR strategy. Hence, it can also be an interesting area to
look for a pattern, more precisely the difference in the pattern based on these demographic
variables. Further, this can open up another dimension of discussion, which may reflect that
different HR policies may have different relevance and impact on employees based on these
demographic variables.
However, the questionnaire was distributed irrespective of age/experience; the
responses collected were later collated based on the above mentioned demographic variables.
This study analyzes a theoretical principle, which must influence human behavior in general
in all individuals irrespective of any demographic difference among employees in an
organizational context. The categorization of results based on demographic differences
allows the researcher to discover whether there is any pattern of change in opinion when
results from different demographic sets are compared.
The questionnaire was distributed by means of an online survey. The survey was
compiled to be executed via SurveyMonkey. This is an online tool to create, manage and
distribute the survey to participants through various media, for example through social
networking sites like Facebook, website code snippet, web-links and emails. As the survey
was intended for a limited audience, it was distributed only via web-links sent in emails to the
participants
SurveyMonkey is an external agency for conducting online surveys. Hence, data
privacy and confidentiality is a concern. SurveyMonkey ensures the same privacy policy that
it has cited on the website. It endorses Trustee‟s Privacy Seal, which signifies that
SurveyMonkey privacy policy and privacy practices have been reviewed by Trustee. Trustee
is an independent third party for compliance with TRUSTe‟s program requirements, which
include accountability, transparency and selection regarding the collection and use of survey
participants‟ personal information. In addition, SurveyMonkey Inc. is in compliance with the
US-EU and US-Swiss Safe Harbor Frameworks. This framework has been developed by the
48
U.S. Department of Commerce regarding any collection of personal information, its use and
retention from EU member countries and Switzerland. It has been certified, and has been
verified by Trustee that SurveyMonkey adheres to the principles of Safe Harbor Privacy for
notice, choice, onward transfer, security, data integrity, access and enforcement
(SurveyMonkey Inc., 2014).
3.5 Ethical considerations
This research project only commenced after obtaining approval from UREC (Unitec
Research & Ethics Committee) via submitting a Unitec Research Ethics Committee (UREC)
application to the committee. The application defines and specifies the norms of conduct
which the researcher will maintain during the research study and exhibit the acceptable
behavior set by UREC for the conduct of research. Strict adherence to the guidelines
specified is essential in order to avoid potential conflicts and any displeasure for the research
audience or any social community. The UREC Registration number for this research is 2014-
1006 and duration allowed to conduct research is from 20.3.14 to 20.3.15.
The researcher employed both qualitative and quantitative means of data collection,
which were interview and online survey respectively. All participants were formally provided
with research information and their consent was obtained via standard template before their
involvement in the research study. The anonymity and confidentiality of participants and data
were ensured. Any participating organization name, interview and online survey respondent
names have not been mentioned anywhere in the research. Raw data obtained through
interviews and online survey is kept securely in the researcher's private locker.
The template of research information sheets, participant consent form and
organization consent form used in this research project are included in Appendices 1, 2 and 3
respectively.
3.6 Summary
The methodology was discussed in this chapter. It focused on sampling techniques
outlining the value of a mix of both simple random probability sampling and convenience
non-probability sampling techniques. Eleven organizations selected were Auckland service
organizations with 25 or more employees and established for five or more years. The
methodology used for primary data collection for both qualitative and quantitative data was
via interview and an online survey respectively. This research study was conducted under

49
strict adherence to norms of conduct specified by UREC and after obtaining approval from
UREC.
The next chapter focuses on the result data obtained through the qualitative and
quantitative methods of data collections described in this chapter.

50
Chapter 4: Results
4.1 Introduction
This chapter presents the research data obtained from the online survey and the
interviews conducted across eleven organizations in New Zealand. The online survey data is
presented in Section 4.2, and the interview results are in Section 4.3. The collected data is
presented in the form of frequency tables and bar charts for easy illustration of the data. As
mentioned in the methodology chapter, the survey questionnaire comprised three types;
Therefore Section 4.2 has been divided into three subsections; one for each Type 1, Type 2
and Type 3 question sets and is followed by questions regarding the demographic data of the
respondents. The qualitative research data is in Section 4.3. Each question is represented in
the form of a frequency table, and a histogram chart is followed by a summary of collated
responses of HR managers of the eleven organizations which are all based in New Zealand.
4.2 Quantitative data: Online survey questionnaire
The questionnaire was distributed by means of an online survey which was sent to
participants via emails. Five respondents from each of the eleven organizations of
organization in New Zealand completed the survey and were mainly from the service sector
(that is 75%).
An equal number of participants were obtained from each organization. Because
every organization had different SHRM processes with different levels of impact and
effectiveness, an equal number of participants from each organization ensured an equal
weightage in results. The result thus obtained reflected the average overall state of SHRM in
all New Zealand organizations. However, if an uneven number of participants were selected
from each organization, a higher number of participants from one organization would mean
more dominance of its SHRM effect on the overall result. The researcher therefore ensured
an equal number of participants from each organization for the survey. The sampling
involved here is analogue to stratified sampling where each organization is analogue to a
stratum which contributes an equal number of elements (participants) in the research sample
(Särndal, Swensson, & Wretman, 2003).
The survey questionnaire consisted of 21 questions. Questions were of three types.
Results for each type are in separate subsections.

51
4.2.1 Type 1 (Questions 1 to 10)
Type 1 questions measure the effectiveness of SHRM in the organization in terms of
work-life balance, job satisfaction and other different parameters.
Q1. Do you experience job satisfaction in your current work role?
Figure 6: Job Satisfaction
This is a key question to measure the effectiveness of SHRM. The question measures
how satisfied an employee is working in his/her role? The result shows that only 36.4% of
respondents have always experienced job satisfaction. The majority of respondents at 50.9%
percent have often experienced job satisfaction, and 12.7% respondents experienced it just
sometimes. None of the respondents said that they never experienced job satisfaction.
Q2. Do you experience a work-life balance?
As shown in Figure 7 on page 52, like the previous question, 56.4% of the
respondents agreed to have experienced a work-life balance. 20% of respondents strongly
agreed that they experienced a work-life balance, whereas the same number of respondents
disagreed about experiencing a work-life balance. 3.6% of the respondents strongly disagreed
about experiencing a work-life balance.
0.0%
10.0%
20.0%
30.0%
40.0%
50.0%
60.0%
Re
spo
nse
Pe
rce
nt
Do you experience job satisfaction in your current work role?
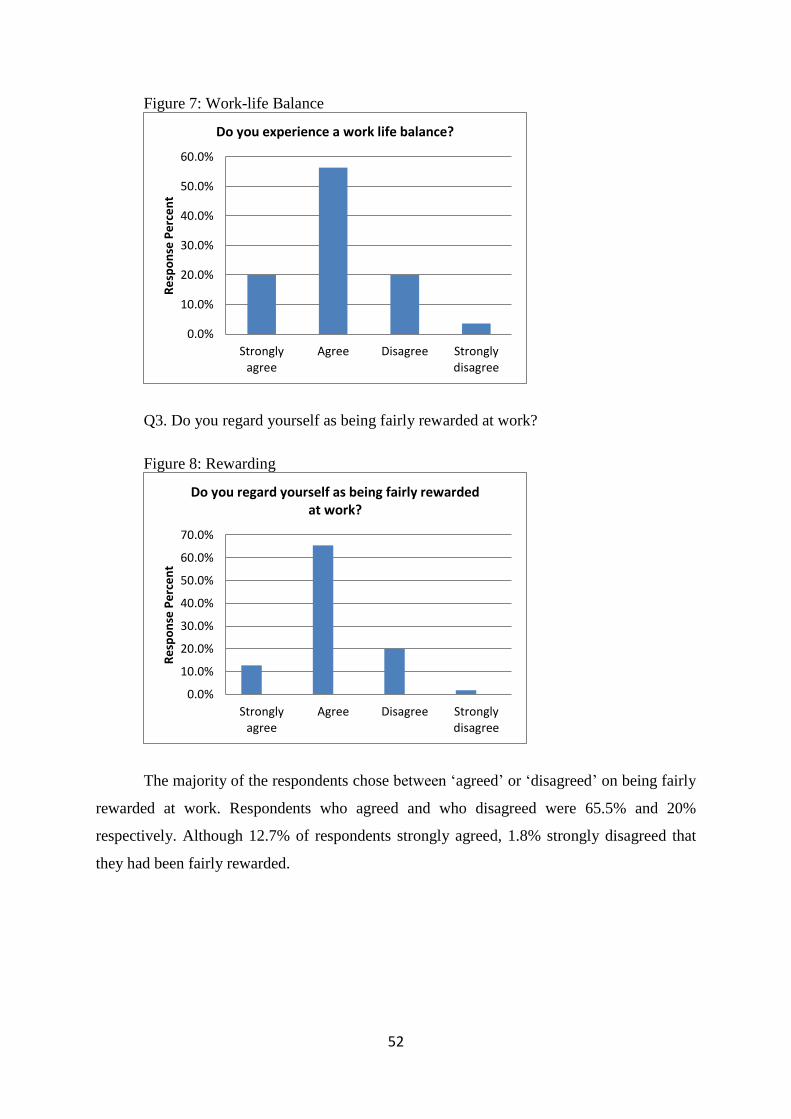
52
Figure 7: Work-life Balance
Q3. Do you regard yourself as being fairly rewarded at work?
Figure 8: Rewarding
The majority of the respondents chose between „agreed‟ or „disagreed‟ on being fairly
rewarded at work. Respondents who agreed and who disagreed were 65.5% and 20%
respectively. Although 12.7% of respondents strongly agreed, 1.8% strongly disagreed that
they had been fairly rewarded.
0.0%
10.0%
20.0%
30.0%
40.0%
50.0%
60.0%
Stronglyagree
Agree Disagree Stronglydisagree
Re
spo
nse
Pe
rce
nt
Do you experience a work life balance?
0.0%
10.0%
20.0%
30.0%
40.0%
50.0%
60.0%
70.0%
Stronglyagree
Agree Disagree Stronglydisagree
Re
spo
nse
Pe
rce
nt
Do you regard yourself as being fairly rewarded at work?
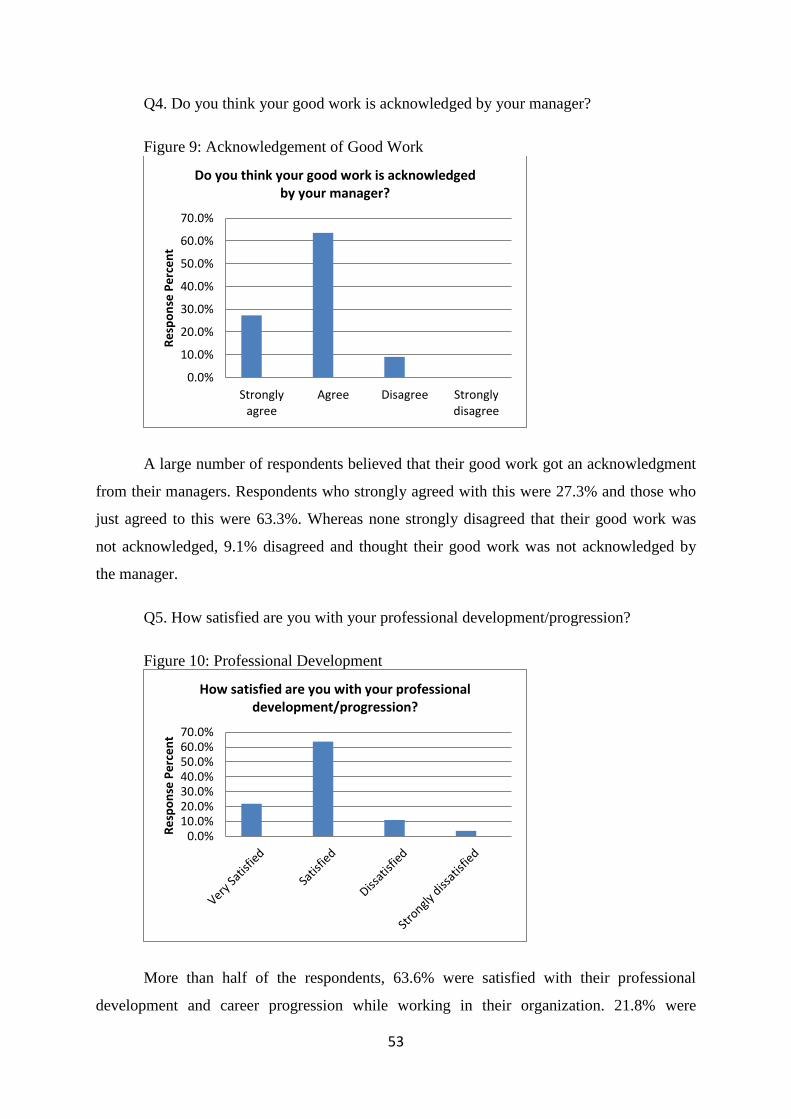
53
Q4. Do you think your good work is acknowledged by your manager?
Figure 9: Acknowledgement of Good Work
A large number of respondents believed that their good work got an acknowledgment
from their managers. Respondents who strongly agreed with this were 27.3% and those who
just agreed to this were 63.3%. Whereas none strongly disagreed that their good work was
not acknowledged, 9.1% disagreed and thought their good work was not acknowledged by
the manager.
Q5. How satisfied are you with your professional development/progression?
Figure 10: Professional Development
More than half of the respondents, 63.6% were satisfied with their professional
development and career progression while working in their organization. 21.8% were
0.0%
10.0%
20.0%
30.0%
40.0%
50.0%
60.0%
70.0%
Stronglyagree
Agree Disagree Stronglydisagree
Re
spo
nse
Pe
rce
nt
Do you think your good work is acknowledged
by your manager?
0.0%10.0%20.0%30.0%40.0%50.0%60.0%70.0%
Re
spo
nse
Pe
rce
nt
How satisfied are you with your professional development/progression?

54
strongly satisfied with their professional development and career progression. Of all the
respondents, 10.9% and 3.6% were dissatisfied and strongly dissatisfied respectively and felt
they did not have as much career progression and development as they deserved.
Q6. Do you think you are successful in your job?
Figure 11: Success at Work
Except for 10.9% of the respondents, the rest all either strongly agreed or just agreed
that they feel successful at work. Respondents who strongly agreed and who just agreed were
25.5% and 63.6% respectively. The remaining 10.9% disagreed that they were successful in
their job, whereas none of the respondents strongly disagreed with it.
The next four questions are non-objective questions and required respondents to
specify their answers as a percentage in order to get very precise answer.
0.0%
10.0%
20.0%
30.0%
40.0%
50.0%
60.0%
70.0%
Stronglyagree
Agree Disagree Stronglydisagree
Re
spo
nse
Pe
rce
nt
Do you think you are successful in your job?

55
Q7. How well does your supervisor rate your performance in your current role?
Figure 12: Performance Rating by Supervisor
The respondents were asked to fill in a percentage to rate how well they thought their
supervisors rated their performance in their current role. The average percentage from all the
responses was 79.11%.
Q8. How often do you feel the supervisor underrates you?
Figure 13: Frequency of Supervisor Underestimating the Employees Performance
Similarly to the previous questions, respondents were asked to specify in a percentage
their supervisors‟ underrating of their performance in their current role. The average response
from all 55 respondents was 17.31%. This means on a scale of 100 points, the supervisors of
all 55 respondents rated their performance on an average of 17.31 points.
.00
10.00
20.00
30.00
40.00
50.00
60.00
70.00
80.00
90.00
Please specify in %
Re
spo
nse
Ave
rage
How well does your supervisor rate your
performance in your current role?
.00
5.00
10.00
15.00
20.00
Please specify in %
Re
spo
nse
Ave
rage
How often do you feel the supervisor underrates you?

56
Q9. How often do you feel the supervisor overrates you?
Figure 14: Frequency of Supervisor Overestimating the Employees Performance
On an average, all the respondents felt the supervisor overrated them on 15.58% of
occasions.
Q10. How often do you feel your supervisor rates you at the level you rate yourself?
Figure 15: Frequency of Supervisor Rating Correctly the Employees Performance
On average, all the respondents felt the supervisor rated them at the same level as they
rated themselves on 66.82% of the occasions.
.00
2.00
4.00
6.00
8.00
10.00
12.00
14.00
16.00
18.00
Please specify in %
Re
spo
nse
Ave
rage
How often do you feel the supervisor overrates
you?
.00
10.00
20.00
30.00
40.00
50.00
60.00
70.00
80.00
Please specify in %
Re
spo
nse
Ave
rage
How often do you feel your supervisor rates you at the level you rate yourself?

57
4.2.2 Type 2 (Questions 11 to 21)
Type 2 questions measured the extent of the presence of OPD-SHRM elements. OPD-
SHRM has an emphasis on more frequent manager-employee interactions, help and support
from the manager, more employees‟ engagement, inclination towards success and emphasis
on actions over results. These questions measured the degree to which these elements of
OPD-SHRM were present.
Q11. Do you know how to be successful in your current role?
Figure 16: Employees Knowing How to Be Successful
A large number of respondents affirmed that they knew how to be successful in their
current role. Those who said „Yes‟ for knowing how to be successful, made up 80% of all the
respondents. Just one respondent, which was 1.8% of all respondents, did not know how to be
successful in his/her current role and 18.2% were unsure.
Q12. Are the key performance activities that are relevant to your role clear to you for
you to be successful in your role?
As shown in Figure 17 on page 58, nearly half the respondents were either unsure or
did not have their key performance activities made clear to them to be successful in their
roles. 20% of respondent did not have their key performance activities clear to them to be
successful in their roles. 20% of respondents were not clear about their key performance
activities, and 23.6% were unsure. Over half of the respondents, 56.4%, said they were clear
on the key performance activities to be successful in their roles.
0.0%
10.0%
20.0%
30.0%
40.0%
50.0%
60.0%
70.0%
80.0%
90.0%
Yes No May be
Re
spo
nse
Pe
rce
nt
Do you know how to be successful in your current role?

58
Figure 17: Clear on KPI
Q13. Do you know your “key performance indicators” (KPIs)?
Figure 18: Knowledge of KPI
Well over half of the respondents, 67.3%, are aware of their KPIs. Of the remainder,
14.5% of respondents did not know what their KPIs were and 18.2% of the respondents were
unsure.
0.0%
10.0%
20.0%
30.0%
40.0%
50.0%
60.0%
Yes No May be
Re
spo
nse
Pe
rce
nt
Are the key performance activities relevant to
your role clear to you for you to be successful in your role?
0.0%
10.0%
20.0%
30.0%
40.0%
50.0%
60.0%
70.0%
80.0%
Yes No May be
Re
spo
nse
Pe
rce
nt
Do you know your “Key Performance Indicators” (KPIs)?

59
Q14. Is your performance measured in terms of KPIs achieved?
Figure 19: Knowledge of KPIs
Normally in an SHRM environment, Key Performance Indicator (KPI) is the principal
determinant for performance of an employee. 63.6% of respondents said that their
performance was measured in terms of KPIs achieved. 20% were unsure of whether or not
KPI was a parameter to measure their KPIs, and 16.4% said that their performance was not
measured in terms of KPI achieved.
Q15. How does your manager measure your performance?
Figure 20: Measuring Employees Performance
Nearly a quarter of the respondents said that their managers measured their
performance by analyzing the efforts they put into their deliveries of the work they do. For
0.0%
10.0%
20.0%
30.0%
40.0%
50.0%
60.0%
70.0%
Yes No May be
Re
spo
nse
Pe
rce
nt
Is your performance measured in terms of KPI
achieved?
0.0%
10.0%
20.0%
30.0%
40.0%
50.0%
60.0%
70.0%
80.0%
By analyzing yourefforts you put
in.
By measuringyour KPI
achieved.
Using bothmethods
Re
spo
nse
Pe
rce
nt
How does your manager measure your performance?

60
67.3% of respondents, their manager measured their performance based on their KPIs
achieved as well as the effort they put in. And, just 7.3% of the respondents' performance was
measured in terms of only KPIs by their managers.
Q16. What does your manager emphasize in your job?
Figure 21: Emphasis on KPI or on Process
Nearly half of the respondents‟ managers emphasized both the process to achieve the
KPIs and achieving the KPIs anyhow. Of the rest, 27.3% of respondents‟ managers
emphasized the process to achieve the KPI, and 18.2% of respondents‟ managers emphasized
achieving the KPI anyhow.
Q17. How often does your manager provide you with mentoring and guidance?
As shown in Figure 22 on page 61, the frequency of managers mentoring and guiding
employees, „Fortnightly‟ was the most chosen option by 38.2% of the respondents. Next was
„Any period longer than a month‟ selected by 25.5% of the respondents followed by
„Weekly‟ and „Monthly‟ chosen by 23.6% and 12.7% of the respondents respectively.
0.0%
10.0%
20.0%
30.0%
40.0%
50.0%
60.0%
On process toachieve your KPI.
On achievingyour KPI anyhow.
Both of theabove.
Re
spo
nse
Pe
rce
nt
What does your manager emphasize in your job?

61
Figure 22: Frequency of Mentoring and Guidance
Q18. Do you think the expectations of your manager of you are realistic?
Figure 23: Realistic Expectation
Just over half of the respondents, 50.9% believed that the expectation of their
managers from them is realistic. 34.5% thought the expectation was somewhat realistic, and
14.5% thought mostly the expectations were not realistic. None of the respondents chose the
fourth option which was that the expectations were not realistic at all and practically not
possible.
0.0%5.0%
10.0%15.0%20.0%25.0%30.0%35.0%40.0%45.0%
Re
spo
nse
Pe
rce
nt
How often does your manager provide you mentoring and guidance?
0.0%
10.0%
20.0%
30.0%
40.0%
50.0%
60.0%
Yes, they arerealistic
To someextent theyare realistic
Mostly theyare notrealistic
They are notrealistic at all
andpractically
not possible.
Re
spo
nse
Pe
rce
nt
Do you think the expectations of your manager from you are realistic?
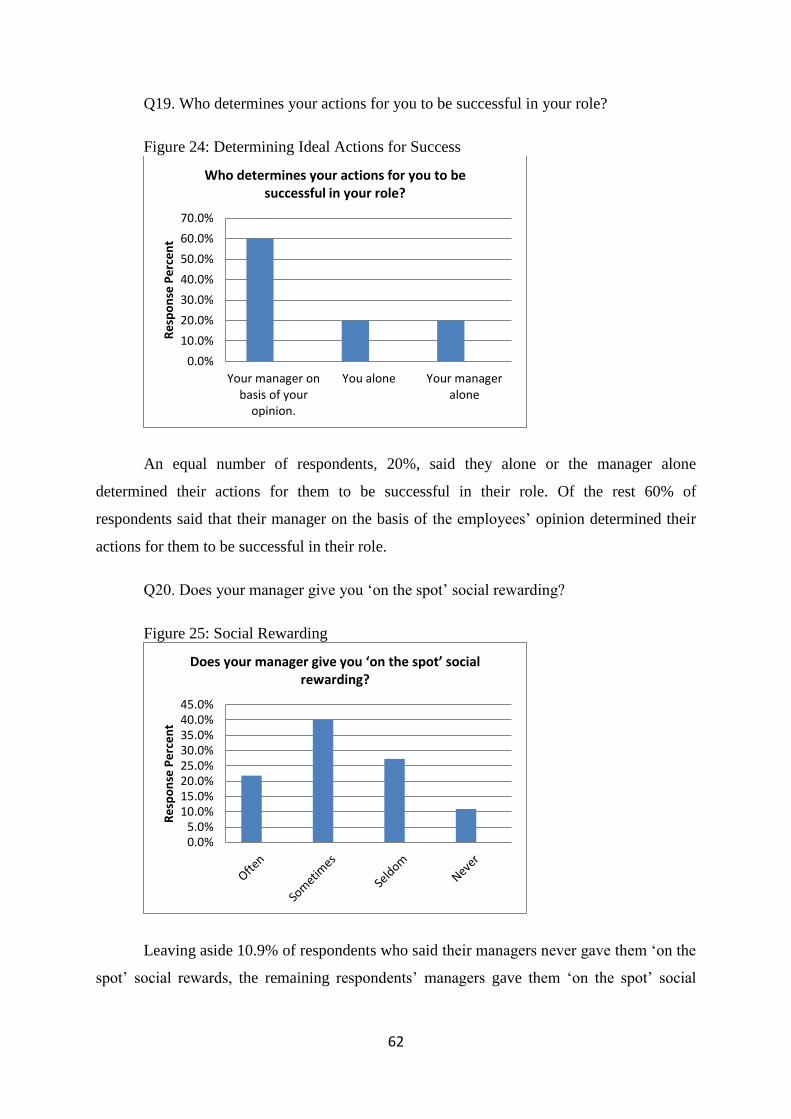
62
Q19. Who determines your actions for you to be successful in your role?
Figure 24: Determining Ideal Actions for Success
An equal number of respondents, 20%, said they alone or the manager alone
determined their actions for them to be successful in their role. Of the rest 60% of
respondents said that their manager on the basis of the employees‟ opinion determined their
actions for them to be successful in their role.
Q20. Does your manager give you „on the spot‟ social rewarding?
Figure 25: Social Rewarding
Leaving aside 10.9% of respondents who said their managers never gave them „on the
spot‟ social rewards, the remaining respondents‟ managers gave them „on the spot‟ social
0.0%
10.0%
20.0%
30.0%
40.0%
50.0%
60.0%
70.0%
Your manager onbasis of your
opinion.
You alone Your manageralone
Re
spo
nse
Pe
rce
nt
Who determines your actions for you to be
successful in your role?
0.0%5.0%
10.0%15.0%20.0%25.0%30.0%35.0%40.0%45.0%
Re
spo
nse
Pe
rce
nt
Does your manager give you ‘on the spot’ social rewarding?

63
rewards on some occasions. 21.8% often received it; 40% received it sometimes, and 27.6%
seldom received it.
Q21. How often does your supervisor do a one-on-one meeting with you?
Figure 26: One on One Meeting
More frequent interactions of supervisors with the employees are encouraged in the
OPD-SHRM model. A more frequent meeting indicates greater likelihood of an SHRM
environment where the employee is clear on his/her role, is getting frequent support and
guidance from his manager and is constantly reminded of his/her role and responsibilities, by
his/her manager. 14.5% of the respondents had their managers doing one-on-one meetings
with them every week. 32.7% fortnightly; 25.5% monthly and the remaining 27.3% had one-
on-one meetings with their managers at intervals greater than a month.
4.2.3 Type 3 (Questions 22 to 26)
Type 3 questions concern OPD-SHRM hypothetical environment. Participants had to
answer about their behavior in those hypothetical situations. Based on the participants‟
responses for those questions, the employee's behavior was evaluated as to whether it was
positive in those OPD-SHRM scenarios. A positive result indicates OPD-SHRM to be more
efficient in comparison to current SHRM practices across New Zealand organizations.
0.0%5.0%
10.0%15.0%20.0%25.0%30.0%35.0%
Re
spo
nse
Pe
rce
nt
How often does your supervisor do one on one meeting with you?

64
Q22. If your success in an assignment is celebrated and acknowledged, does this
motivate and encourage you to be successful in your next assignment?
Figure 27: Celebrating Success
This is a hypothetical scenario, and the respondents were asked whether they would
be motivated and encouraged to be successful in their next assignment when their success in
an assignment would be celebrated and acknowledged. 69.1% of the respondent said yes to it
and that it would encourage them to do even better in next assignment whereas 25.5% simply
said that it would motivate them. 3.6% of the respondents felt it would sometimes motive
them whereas 1.8% believed that it would not make any difference to their motivation level.
Q23. Do periodic one-on-one meetings with the manager help you to improve your
performance?
As shown in Figure 28 on page 65, the majority, namely 94.5% of the respondents
agreed that periodic one-on-one meetings with the managers helped them improve their
performance. 54.5% strongly agree with it, and 40% just agreed with it. 3.6% and 1.8% of
respondents disagreed and strongly disagreed respectively that managers doing periodic one
to ones with them improved their performance.
0.0%
20.0%
40.0%
60.0%
80.0%
Yes, it stronglymotivates me
to do evenbetter in nextassignment
Yes, itmotivates me
It sometimesmotivates me.
It does notmake anydifference
Re
spo
nse
Pe
rce
nt
If your success in an assignment is celebrated and acknowledged, does this motivate and encourage you to be successful in your next
assignment?
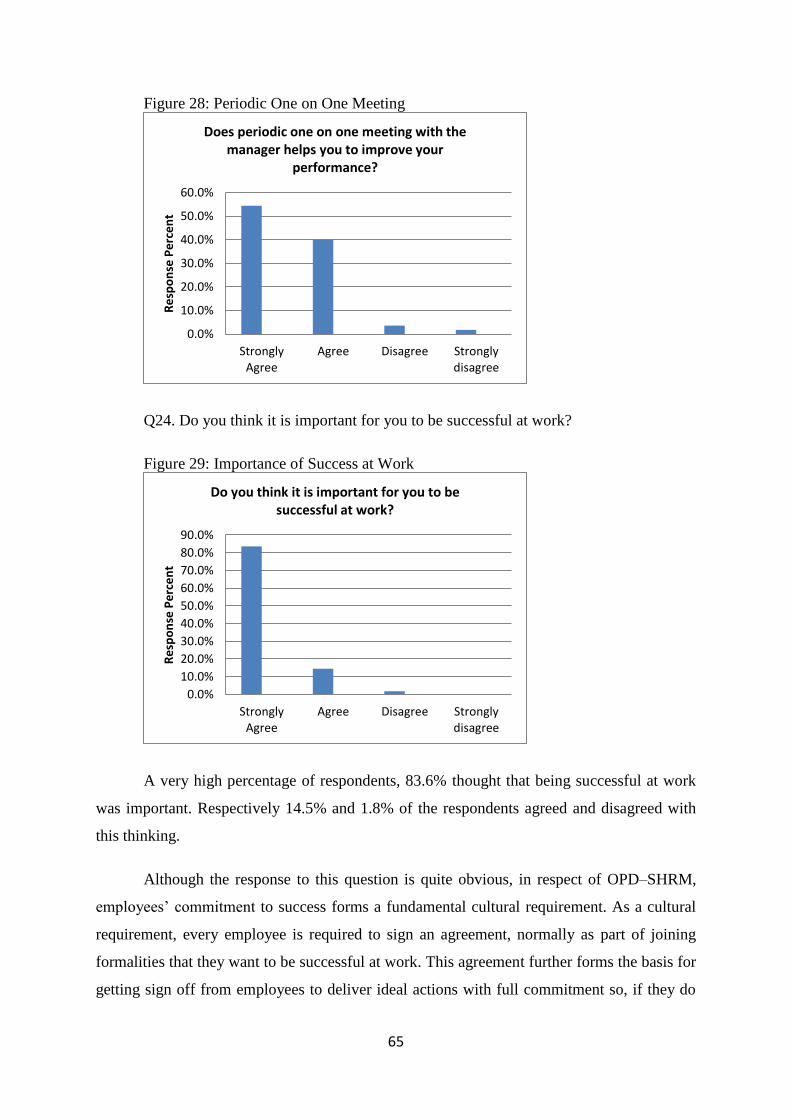
65
Figure 28: Periodic One on One Meeting
Q24. Do you think it is important for you to be successful at work?
Figure 29: Importance of Success at Work
A very high percentage of respondents, 83.6% thought that being successful at work
was important. Respectively 14.5% and 1.8% of the respondents agreed and disagreed with
this thinking.
Although the response to this question is quite obvious, in respect of OPD–SHRM,
employees‟ commitment to success forms a fundamental cultural requirement. As a cultural
requirement, every employee is required to sign an agreement, normally as part of joining
formalities that they want to be successful at work. This agreement further forms the basis for
getting sign off from employees to deliver ideal actions with full commitment so, if they do
0.0%
10.0%
20.0%
30.0%
40.0%
50.0%
60.0%
StronglyAgree
Agree Disagree Stronglydisagree
Re
spo
nse
Pe
rce
nt
Does periodic one on one meeting with the manager helps you to improve your
performance?
0.0%
10.0%
20.0%
30.0%
40.0%
50.0%
60.0%
70.0%
80.0%
90.0%
StronglyAgree
Agree Disagree Stronglydisagree
Re
spo
nse
Pe
rce
nt
Do you think it is important for you to be successful at work?

66
so, it guarantees their success at work (see Section 2.6). Hence as per OPD-SHRM, those
1.8% employees who chose „Disagree‟ would immediately get rejected for employment with
the organization for not considering it important to be successful at work.
Q25. You deliver an assignment after working rigorously for 10 days. You feel
satisfied having delivered the assignment because?
Figure 30: Successful delivery with Manager's Support
The majority of the respondents, 76.4%, would feel satisfied on delivering an
assignment with 100% success with the help and support from their managers. 14.5% of
respondents would feel satisfied even with partial success of their assignment if they had not
been bugged by their managers and had been left alone to work independently. The
remaining 9.1% of respondents, would prefer being dissatisfied with results but would have
the manager hover over them and push for at least a second rate result.
Q26. Do you want your performance to be measured in terms of KPI value?
As shown in Figure 31on page 67, an overwhelming majority of respondents did not
want their performance to be measured in terms of KPIs. They were 85.5% of the
respondents who wanted their managers to consider equally their efforts and discipline and
dedication towards their efforts to achieve the KPI. Nearly an equal number of participants,
7.3%, either were unsure or wanted their managers to be only concerned about the KPIs and
leave it to them about how they are achieving those KPIs.
0.0%
20.0%
40.0%
60.0%
80.0%
100.0%
You delivered it with100% success with allhelp and support from
your manager. Onemore laurel to your
cap.
You delivered it with let’s say 70% of success
but at least you were not bothered by the
manager and was left on your own to work on the assignment.
If none of above.(please specify)
Re
spo
nse
Pe
rce
nt
You deliver an assignment after working rigorously for 10 days. You feel satisfied having
delivered the assignment because?

67
Figure 31: KPI as Only Performance Parameter
Questions from 27 to 29 are about background information of the participants to
collect their age, sex and level of education.
Q27. What is your gender?
Figure 32: Gender
The respondents included more females with 56.4% of females over 43.6% of males.
0.0%10.0%20.0%30.0%40.0%50.0%60.0%70.0%80.0%90.0%
No, I expect mymanager to equallyconsider my efforts,
discipline anddedication towards
my attempt toachieve the KPI.
Yes, manager concernshould only be theKPI and not how I
achieve them.
Not sure
Re
spo
nse
Pe
rce
nt
Do you want your performance to be measured in terms of KPI value?
0.0%
10.0%
20.0%
30.0%
40.0%
50.0%
60.0%
Male Female
Re
spo
nse
Pe
rce
nt
What is your gender?

68
Q28. What is your age group?
Figure 33: Age Group
The respondents were from all the age groups with the maximum number of
respondents; 30.9% were between age 32 and 37. The number of respondents from age
groups 26 to 31 and 38 to 43 were nearly the same at 20% and 21.8% respectively. The next
age group which followed these three age groups was 20 to 25 and 44 to 49 with 14.5% of
respondents and 7.3% of respondents belonging to those age groups respectively. Just three
respondents were aged 50 and above and comprised 5.5% of all respondents.
Q29. What is your level of education?
As shown in Figure 34 on page 69, of all the respondents, 61.8% had completed their
graduation with bachelor degree/diploma, followed by 12.7% of respondents with Post
Graduate Diploma. 10.9% achieved secondary school level followed by 9.1% of respondents
with High Secondary level education. The highest level of education was Master Degree
completed by 5.5% of respondents and none at the Ph.D. level.
0.0%
5.0%
10.0%
15.0%
20.0%
25.0%
30.0%
35.0%
20-25 26-31 32-37 38-43 44-49 50 andabove
Re
spo
nse
Pe
rce
nt
What is your age group?

69
Figure 34: Level of Education
4.3 Qualitative data: Interviews
The interview consisted of 15 questions. The purpose of conducting interviews with
HR managers in New Zealand organizations was to assess the effectiveness of SHRM in their
organizations. The intent was to find whether the SHRM implemented in their organization
had any similarity with the OPD-SHRM model.
Each question had three choices, „Yes‟, „No‟ and „Maybe‟. Furthermore each
participant was encouraged to provide reasoning for their choice. This was to encourage them
to talk and explain their rationale for their answer given for a particular question. The choice
set (Yes No, Maybe) was different from the choice set (Strongly Agree, Agree, Disagree,
Strongly Disagree), which was mostly asked in the survey questions. The intention for survey
questions was different from the interview questions as here the researcher objective was not
to measure something on a scale of five points. Asking a question with Yes, No, Maybe allow
the participant to first clarify his point. The participant then discusses the topic broadly after
having clarified whether he/she is discussing it in favor of or against the topic, or being
neutral when he/she has selected 'Maybe'.
Below are the collated responses of all HR managers for each interview question.
0.0%
10.0%
20.0%
30.0%
40.0%
50.0%
60.0%
70.0%R
esp
on
se P
erc
en
t
What is your level of education?
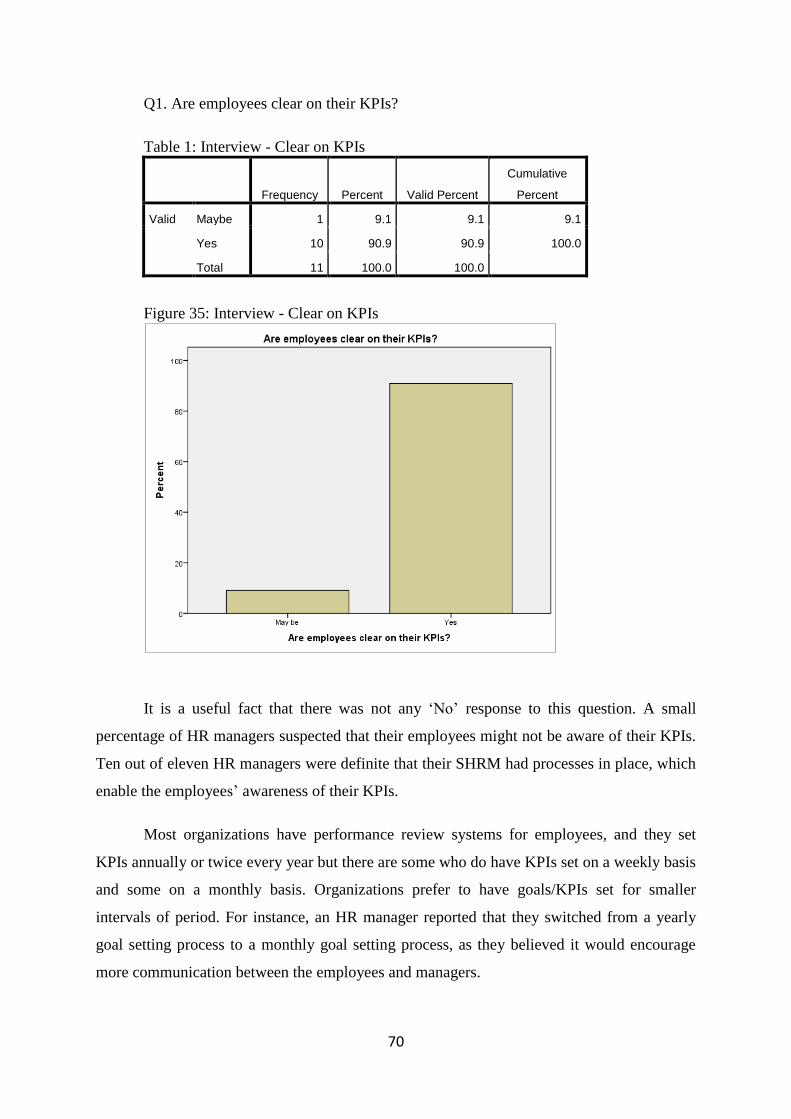
70
Q1. Are employees clear on their KPIs?
Table 1: Interview - Clear on KPIs
Frequency Percent Valid Percent
Cumulative
Percent
Valid Maybe 1 9.1 9.1 9.1
Yes 10 90.9 90.9 100.0
Total 11 100.0 100.0
Figure 35: Interview - Clear on KPIs
It is a useful fact that there was not any „No‟ response to this question. A small
percentage of HR managers suspected that their employees might not be aware of their KPIs.
Ten out of eleven HR managers were definite that their SHRM had processes in place, which
enable the employees‟ awareness of their KPIs.
Most organizations have performance review systems for employees, and they set
KPIs annually or twice every year but there are some who do have KPIs set on a weekly basis
and some on a monthly basis. Organizations prefer to have goals/KPIs set for smaller
intervals of period. For instance, an HR manager reported that they switched from a yearly
goal setting process to a monthly goal setting process, as they believed it would encourage
more communication between the employees and managers.

71
HR managers related the manager-employee communication with employees being
clear on KPIs, assuming more communication would mean clear conveyance of KPIs to the
employees. For KPIs set for longer duration like a year, the employees are periodically
reviewed for how they are going about their annual goals or achieving KPIs. Organizations
also keep track of the performance by comparing KPIs achieved during a period with KPIs
achieved during the same period of last year or last month.
The single „Maybe‟ response from an HR manager was because of the nature of
business of the organization. KPIs are not necessarily always valid in certain roles.
Sometimes it is only applicable to some employees, and hence the HR manager responded
with „Maybe‟.
Q2. Are employees clear on the ideal actions to achieve those KPIs?
Table 2: Interview - Clear on Ideal Actions
Frequency Percent Valid Percent
Cumulative
Percent
Valid Maybe 4 36.4 36.4 36.4
Yes 7 63.6 63.6 100.0
Total 11 100.0 100.0
Figure 36: Interview - Clear on Ideal Actions

72
Again, none of the HR managers answered „No.' However, many who responded with
'Maybe', in this case were reluctant in saying that their employees knew the ideal actions they
should pursue to achieve the set KPIs. Their system emphasis was on KPI rather than on
Ideal Actions. The HR managers responding by saying „Maybe‟ were 36%. The remaining
64% of HR manager responses were 'Yes‟, which indicates that they had a system in place
that equally emphasized Ideal Actions. They were aware that their SHRM system had a
process of conveying „Ideal Actions‟ to the employees.
Sometimes, the ideal actions are so obvious that explicitly defining them is not
necessary. This happens due to the nature of the business. The KPIs are simple and ideal
action obvious. In contrast to this, an HR manager from a creative industry reported that
because they were a creative industry, it was difficult for them to have a prescribed way of
doing most of the things. Everybody was encouraged to have their own style and put their
own stamp on things he or she did. They relied on the creativity of the employees and had to
provide freedom for the employees to do their work with their own way. The HR manager
said, “We cannot use the same cookies kind of approach all the time”.
Q3. Are employees inclined to execute ideal actions as their manager requested them
to do in order to achieve their KPIs?
Table 3: Interview - Inclined to be the Manager's way
Frequency Percent Valid Percent
Cumulative
Percent
Valid Maybe 5 45.5 45.5 45.5
Yes 6 54.5 54.5 100.0
Total 11 100.0 100.0
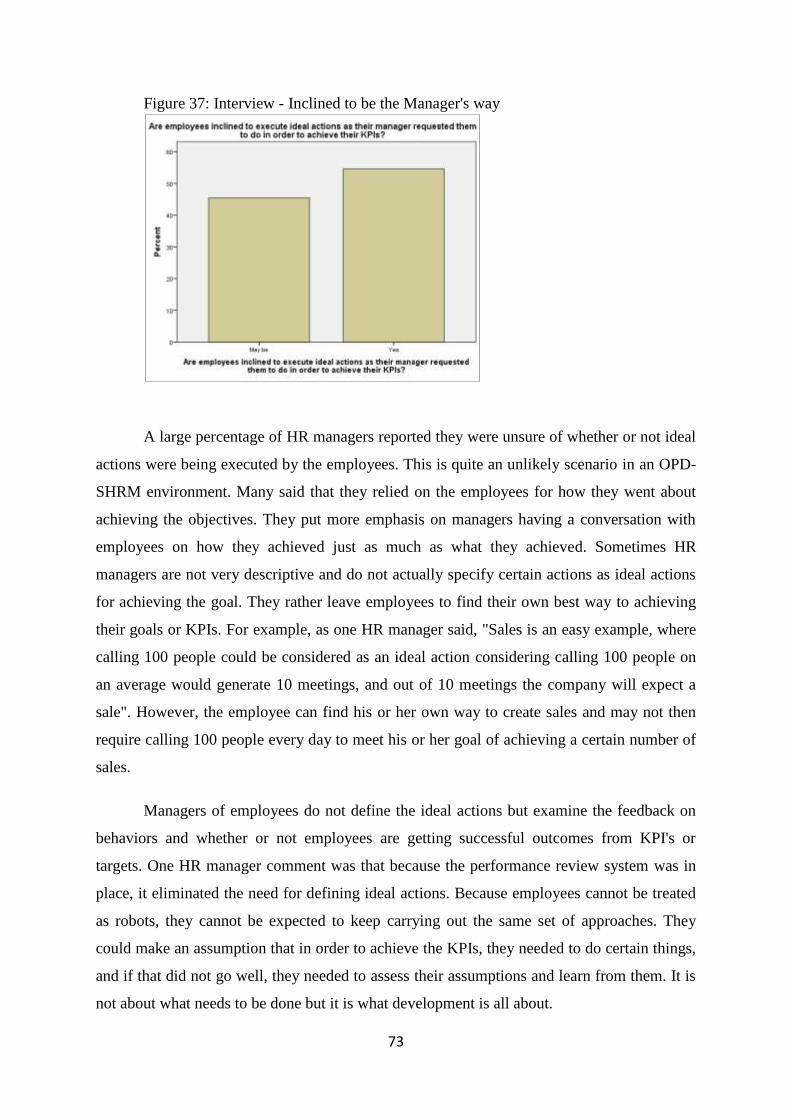
73
Figure 37: Interview - Inclined to be the Manager's way
A large percentage of HR managers reported they were unsure of whether or not ideal
actions were being executed by the employees. This is quite an unlikely scenario in an OPD-
SHRM environment. Many said that they relied on the employees for how they went about
achieving the objectives. They put more emphasis on managers having a conversation with
employees on how they achieved just as much as what they achieved. Sometimes HR
managers are not very descriptive and do not actually specify certain actions as ideal actions
for achieving the goal. They rather leave employees to find their own best way to achieving
their goals or KPIs. For example, as one HR manager said, "Sales is an easy example, where
calling 100 people could be considered as an ideal action considering calling 100 people on
an average would generate 10 meetings, and out of 10 meetings the company will expect a
sale". However, the employee can find his or her own way to create sales and may not then
require calling 100 people every day to meet his or her goal of achieving a certain number of
sales.
Managers of employees do not define the ideal actions but examine the feedback on
behaviors and whether or not employees are getting successful outcomes from KPI's or
targets. One HR manager comment was that because the performance review system was in
place, it eliminated the need for defining ideal actions. Because employees cannot be treated
as robots, they cannot be expected to keep carrying out the same set of approaches. They
could make an assumption that in order to achieve the KPIs, they needed to do certain things,
and if that did not go well, they needed to assess their assumptions and learn from them. It is
not about what needs to be done but it is what development is all about.

74
About 55% of the respondents said that they believed their employees were inclined
towards executing ideal actions the way their managers requested them. Having the HR
managers said that, it can be assumed that 55% of the organizations did believe that the
manager communicated with the employees about the way to go about doing something and
the employees‟ emphasis was on performing the way suggested by the manager and not just
on the KPIs. An HR manager said that not all ideal actions were defined, but maximum time
general guidelines were defined, so employees could perform actions in compliance and
under the constraints of the defined guidelines.
Q4. Do employees feel their managers are providing sufficient support and guidance
for them to achieve their KPIs?
Table 4: Interview - Manager's Support and Guidance
Frequency Percent Valid Percent
Cumulative
Percent
Valid Maybe 4 36.4 36.4 36.4
Yes 7 63.6 63.6 100.0
Total 11 100.0 100.0
Figure 38: Interview - Manager's Support and Guidance
A manager is meant to not just manage his or her team but also if an employee needs
some advice or help, the manager should be the first point of contact for his/her support. So,
obviously none of the HR managers responded with a „No‟ for this question. Managers‟ main
responsibility should be to listen to their team and understand all their issues that could be
hampering their performance. Despite this, a large number of HR managers doubted that the

75
managers were supportive to their teams. The HR managers answering this question as
„Maybe‟, held managers responsible. They said, "Some managers are not as good as others,
and sometimes the employee might also be unhappy with their manager." The HR managers
did not articulate whether their SHRM system had anything in place to avoid such instances.
A good thing is that a higher number of HR managers responded with „Yes‟. That is
because they have processes like 360 degree feedback where an employee can put his
comments as well, which later can be reviewed by the manager. They ensure periodic
meetings and conversations of managers and employees on a quarterly or fortnightly basis.
One HR manager mentioned that the discussion sessions with employees were also
documented for later review as well.
Q5. Do employees think the business processes assist them in doing a good job?
Table 5: Interview - Role of Business Process
Frequency Percent Valid Percent
Cumulative
Percent
Valid Maybe 4 36.4 36.4 36.4
Yes 7 63.6 63.6 100.0
Total 11 100.0 100.0
Figure 39: Interview - Role of Business Process
36% of respondents reported that they were unsure whether their business process was
sufficiently assisting employees in doing a good job. Almost all HR managers, who
responded as „Maybe‟, did so because, they said, they were large organizations. A large

76
organization has many numbers of different business units. Every unit is different and due to
this they lacked uniformity across different units in terms of business processes to assist the
employee to do a good job. One HR manager cited an example of his/her organization and
said that a large number of employees did not feel that there was any proper process in place
to help them do their jobs well. They had recently merged sub-divisions into one and had
been working hard to consolidate their systems and processes, which was a time intensive
and very expensive task. Many sub-divisions which did not have any information systems
were the biggest challenge.
Besides organization size and diverse business units, the other reason which was
observed is rapid change in businesses. Sometimes when the nature of business is such that it
changes rapidly, an adequate training plan is tough to create in the short time of transition.
A higher number of HR managers (64%) reported that their business process facilities
employees did a good job. They think this because they have a system of maintaining a
training database, which has training manuals and business process documents. Employees
can access the training database anytime and learn by themselves. Periodic examinations of
the business process also keep business knowledge at the forefront of the heads of the
employees. Classroom type training and e-training are a few different ways for business
processes to assist employees to perform well. Many organizations provide full-time training
during initial months before a new employee starts his/her job.
Q6. What good or bad feelings do employees have about the organization which could
influence their performance?
Employees have good feelings on a diverse range of practices within the organization.
For example, wellness programs so people can stay fit and healthy, flexible work hours,
rewards for achieving KPIs, celebration of success with employees, work from home,
training and development are some good practices within the organizations. Besides all these,
there are some specific practices in some organizations. There was one organization which
never laid off its employees and hired employees for entry level positions only. All higher
positions were hired from within. This practice provided the employee with a high level of
job security. Organizational success was celebrated with employees. In another organization,
the CEO periodically communicated to the employees their vision, business directions,
ventures and current performance, so employees felt connected with the business.
77
Certain general and common practices about which employees might have bad
feelings are long work hours, being asked to work more and to stretch their abilities and high
expectations. A particular issue as reported by one HR manager of a large organization is that
they lacked communication and collaboration between different business units. People were
disconnected and business units lacked relationship among themselves which often led to
employees getting frustrated when working with other business units. Another HR manager
said that big businesses could accommodate ups and downs of deliveries but small
organizations needed to be more careful as they were always a lot closer to the line of success
and failure in comparison to a large business.
Q7. What approach do you use to execute SHRM, for example OPD-SHRM?
The development plan is mainly discussed during the performance review process.
Along with goal and KPI setting, employee development plans are discussed. The
performance review process has two parts, one which looks at the KPIs and objectives and
another which looks mostly at people development programs. The performance process has
Talent Matrix, to identify where people sit in the Talent Matrix. Competencies of the
employees determine the career path. Employee suitability is assessed based on their
competencies required by the role. There are open trainings that any employee can
voluntarily attend. The majority of employees take care of their own development aided by
the systems and processes which are in place. Organizations also have role specific training
and some organizations only have training for particular teams, i.e. for particular roles.
Q8. What approach do you use to motivate employees to improve their outputs?
Bonuses are the key part for motivation. Pay rises, promotions and other benefits like
free health insurance coverage is some of the perks for employees to motivate them. Certain
teams/groups like sales teams are kept motivated by stated incentives, for example, when
they hit 90% to 100% of target sales and even higher. Some organizations give people time
and flexibility to perform well, and if they are still not able to hit targets, they are
performance managed out from the organization. One HR manager said that they work on
identifying people‟s strengths; rather than emphasizing their weaknesses, they work on
harnessing their strengths. Other ways to motivate employees are to do regular celebrations
like „branch of the year or month‟, give kudos and Christmas parties and giving out an extra
week‟s salary during Christmas.

78
Q9. Are employees aware of the organization‟s goals?
Table 6: Interview – Organization‟s Goals
Frequency Percent Valid Percent
Cumulative
Percent
Valid Maybe 1 9.1 9.1 9.1
Yes 10 90.9 90.9 100.0
Total 11 100.0 100.0
Figure 40: Interview - Organization‟s Goals
The majority of HR managers‟ answer to this question was „Yes‟. Having employees
always aware of the organization‟s goals and vision is one of the prime elements and a
fundamental requirement to have employees feeling engaged and valuable to the
organization. The employee knowing how he/she is adding value to the organization by
working in his/her role is one major way to feel valued, satisfied and happy. Organizations
employ different ways to keep their employees aware of their organization goals and vision.
Largely, they send newsletters and emails from the Chief Executive Officer (CEO) to all
employees. These newsletters and CEO emails keep them notified of the organization‟s
progression toward its goal. They hold meetings with employees and run programs like
„Launch Vision and Value‟, which actively require employee involvement. Apart from all
these ways, from time to time, they can organize road shows and different events across the
city and country. These functions propagate the organization‟s goal to the employees. The
chief executive members of the organization discuss the business plan, goals, how they are
going, what their plans are with each employee present at those events. Employees are also

79
told about the organization‟s goals and plans during orientation at the time of joining the
organization.
Q10. Do employees understand how they are helping the organization to achieve its
goals via their work role?
Table 7: Interview - Employees Adding Value to Organization
Do employees understand how they are helping the organization to
achieve its goals via their work role?
Frequency Percent Valid Percent
Cumulative
Percent
Valid Yes 11 100.0 100.0 100.0
Figure 41: Interview - Employees Adding Value to Organization
A total of 100% responded with „Yes‟. HR managers emphasized that each role is
designed to be carefully aligned with the organization‟s goals. When the goal is designed, it
is the responsibility of the manager to take care that the role is being served appropriately by
the employees. Regular one-on-one sessions of manager with employees are part of this. The
manager is expected to address any issues and support required by the employees,
immediately. One HR manager also said that they had leadership development programs,
which coached managers to lead their team effectively. The key message of these programs
was to impart knowledge to the employees about how they connect at organizational level,
which they could do via their role. General Managers and CEOs visiting a branch and talking
to people and creating a good understanding of what the organization is trying to do and
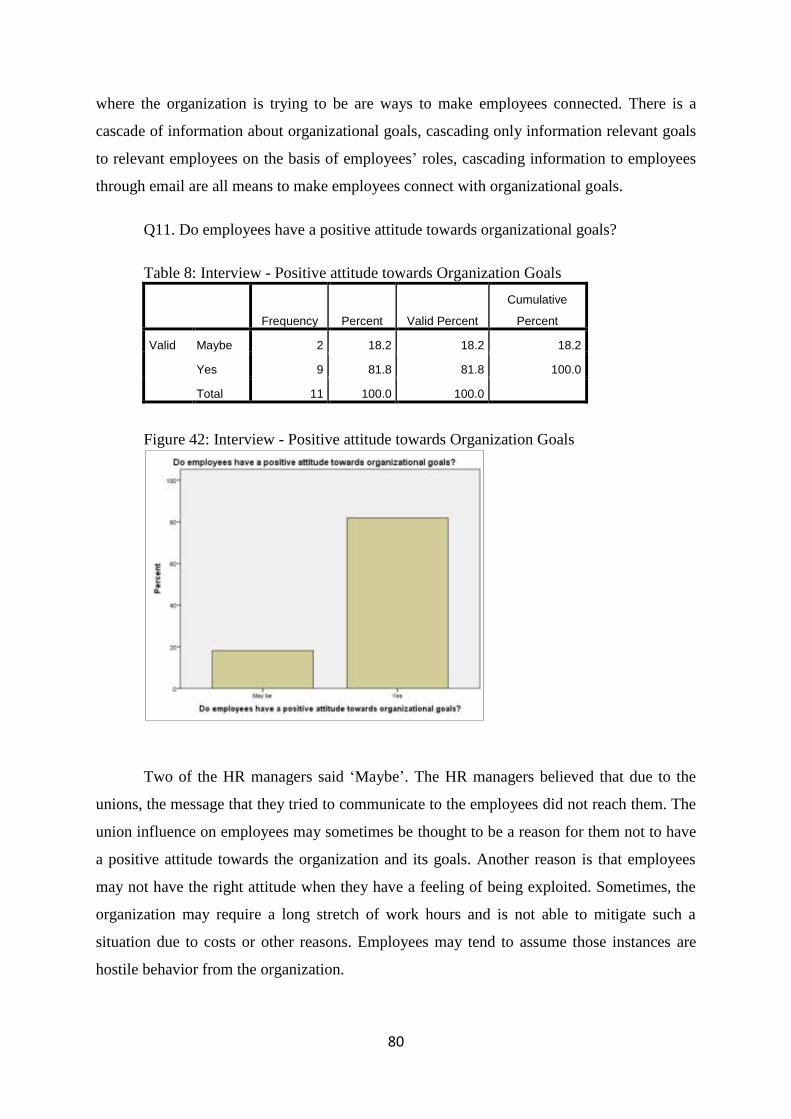
80
where the organization is trying to be are ways to make employees connected. There is a
cascade of information about organizational goals, cascading only information relevant goals
to relevant employees on the basis of employees‟ roles, cascading information to employees
through email are all means to make employees connect with organizational goals.
Q11. Do employees have a positive attitude towards organizational goals?
Table 8: Interview - Positive attitude towards Organization Goals
Frequency Percent Valid Percent
Cumulative
Percent
Valid Maybe 2 18.2 18.2 18.2
Yes 9 81.8 81.8 100.0
Total 11 100.0 100.0
Figure 42: Interview - Positive attitude towards Organization Goals
Two of the HR managers said „Maybe‟. The HR managers believed that due to the
unions, the message that they tried to communicate to the employees did not reach them. The
union influence on employees may sometimes be thought to be a reason for them not to have
a positive attitude towards the organization and its goals. Another reason is that employees
may not have the right attitude when they have a feeling of being exploited. Sometimes, the
organization may require a long stretch of work hours and is not able to mitigate such a
situation due to costs or other reasons. Employees may tend to assume those instances are
hostile behavior from the organization.

81
Again, a large number of HR managers (82%) responded with a „Yes‟. This was
certainly an achievement of the SHRM of the organization. Employees are only inclined to
work honestly in their roles when they have a positive attitude towards the organization‟s
goals. There are some organizations which are not for making a profit and are for helping
people live a better life in some way. Working in those organizations itself makes employees
feel good to be associated with such an organization which is of a philanthropic nature or in
some way associated with improving the lives of people. Similarly, having a sense in
employees of being part of a family working together can make them feel committed to doing
good work and being fair to the organization. Bringing up organizational achievements,
signage of new business or assignments, when celebrated with employees, helps bolster their
attitude towards organization goals. A few other ways that HR departments assess
employees‟ attitude towards organization goals is through employee survey results, and from
the organization‟s CEO Sessions with the employees.
Q12. Is employees‟ professional development coupled to organizational goals?
Table 9: Interview - Professional Development coupled to Organization Goals
Frequency Percent Valid Percent
Cumulative
Percent
Valid No 1 9.1 9.1 9.1
Maybe 3 27.3 27.3 36.4
Yes 7 63.6 63.6 100.0
Total 11 100.0 100.0
Figure 43: Interview - Professional Development coupled to Organization Goals

82
Many HR managers admitted that they did not have an efficient system in regard to
employee professional development. They showed the need for development in this area.
Even when professional development of employees was being take care of, not all employees
could have the career progression that suited their future needs. However, career progressions
of the employees were taken care of in line with the business needs and requirements.
HR managers responding with „Yes‟ emphasized the need for choosing the next
business leaders among themselves. According to the HR managers interviewed, fostering
talent among existing employees had its benefits. Employee career progression is a long term
goal and involves training and course programs tailored to his/her next role, which employees
must come through successfully in order to be promoted to the next successive role. A wide
scope of professional development is essential to the employees. Employees will thus have
job security and career progression and can rest assured that they will not be restructured or
made redundant.
Q13. Is employees‟ professional development coupled to organizational goals in
helping the organization achieve its goals?
Table 10: Interview - Professional Development Helping Organizational Goals
Is employees’ professional development coupled to organizational goals in
helping the organization achieving its goals?
Frequency Percent Valid Percent
Cumulative
Percent
Valid No 1 9.1 9.1 9.1
Maybe 3 27.3 27.3 36.4
Yes 7 63.6 63.6 100.0
Total 11 100.0 100.0

83
Figure 44: Interview - Professional Development Helping Organizational Goals
Only one HR manager responded with a „No‟ to this question. The HR managers
answering this question as „No‟ said that they did not have a way to find out whether
employees had achieved individual goals. The HR managers‟ emphasis was on systems like
360-degree feedback, where the manager was able to get feedback from the employees. The
HR managers did not feel that one-on-one discussions and feedback sessions were efficient
enough to collect employees‟ feedback in a managed way.
Exactly the same percentage of HR managers responded with „Yes‟ to this question,
who responded with a „Yes‟ to the question, “Is employees‟ professional development
coupled to organizational goals?” perhaps because the primary objective for enabling
employees‟ professional development must be in line with efforts to help reach organizational
goals. One HR manager said that they believed in hiring from within, because it expedited the
organization‟s growth. New recruitments were only at graduate, school teens and receptionist
levels. Primary operation staff positions were filled from within.
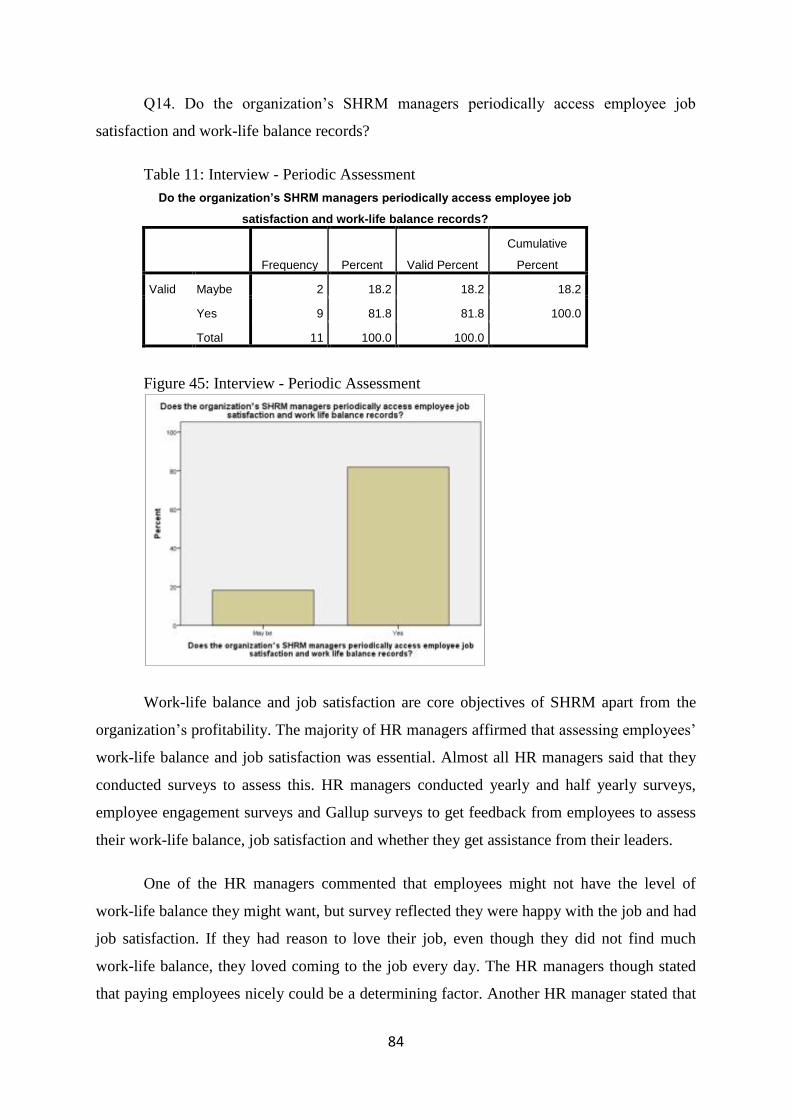
84
Q14. Do the organization‟s SHRM managers periodically access employee job
satisfaction and work-life balance records?
Table 11: Interview - Periodic Assessment
Do the organization’s SHRM managers periodically access employee job
satisfaction and work-life balance records?
Frequency Percent Valid Percent
Cumulative
Percent
Valid Maybe 2 18.2 18.2 18.2
Yes 9 81.8 81.8 100.0
Total 11 100.0 100.0
Figure 45: Interview - Periodic Assessment
Work-life balance and job satisfaction are core objectives of SHRM apart from the
organization‟s profitability. The majority of HR managers affirmed that assessing employees‟
work-life balance and job satisfaction was essential. Almost all HR managers said that they
conducted surveys to assess this. HR managers conducted yearly and half yearly surveys,
employee engagement surveys and Gallup surveys to get feedback from employees to assess
their work-life balance, job satisfaction and whether they get assistance from their leaders.
One of the HR managers commented that employees might not have the level of
work-life balance they might want, but survey reflected they were happy with the job and had
job satisfaction. If they had reason to love their job, even though they did not find much
work-life balance, they loved coming to the job every day. The HR managers though stated
that paying employees nicely could be a determining factor. Another HR manager stated that

85
having a caring attitude towards the employees contributed to their job satisfaction.
Accommodating employees‟ urgent needs such as when they were sick or were working
mothers, adjusting a bit for them, gave them reasons to love the job even more. The HR
manager said, “We try to embrace them as much as we can as long as no silliness is involved
in it”. One of the HR managers even said that he did not record employees' time sheets and
expects people would not be working at nights. The wellness programs also aided in having
happy employees.
Q15. Do employees undergo professional development while working in the
organization?
Table 12: Interview - Professional Development
Frequency Percent Valid Percent
Cumulative
Percent
Valid Maybe 2 18.2 18.2 18.2
Yes 9 81.8 81.8 100.0
Total 11 100.0 100.0
Figure 46: Interview - Professional Development
According to the HR managers interviewed, most SHRMs in organizations believed
and preferred promoting employees from within rather than hiring from outside. Different
methods of professional development used by organizations were conducting workshops, e-
learning modules and business process modules on an organization portal. Job shadowing
was also part of training for professional development. One organization also trains their

86
employees in soft skills. Leadership training is for senior members. Some training is job
specific and only applies to relevant roles.
4.4 Summary
The data collected for this research thesis represents measures for current SHRM
concerning its effectiveness in several aspects concerning employees‟ work-life, job
satisfaction, rewards, mentoring and guidance, professional development and work
efficiency. Also, current SHRM in New Zealand organizations were explored in order to find
commonality between it and the OPD-SHRM model.
The results of quantitative and qualitative survey questions are illustrated by means of
bar diagrams and tables. Respondents to survey questions were asked to specify answers on a
five point scale and for some questions on a three point scale. All except three interview
questions asked the respondent to specify whether they would be speaking in favor, against or
just be neutrally discussing the question. Each interview question covered the central theme
of the discussions from all respondents of the interviews. There is a rationale behind
categorizing the survey questionnaire into three different types. This approach forms the basis
for analyzing the resulting data in drawing useful inferences for determining the answers to
the research questions.
The findings presented in this chapter are statistically analyzed in Chapter Five for
inferring answers to the research questions.
87
Chapter 5: Analysis and Discussion of the Research Findings
5.1 Introduction
This chapter presents the different approaches used to analyze the research data and
discusses the research findings from data obtained via a survey as well as interviews. The
analysis was conducted to find answers to the research questions. The chapter is divided into
four sections. Beginning with an introduction section, the chapter has successive sections,
5.2, 5.3 and 5.4 for quantitative analysis, qualitative analysis and a summary of the chapter
respectively.
There are four different approaches described to find the answers to the research
questions. Section 5.2 is a quantitative analysis and describes three different approaches to
find answers to the research questions. Section 5.2.3 and 5.2.4 provide answers to the
research question, “Is the OPD-SHRM model better than existing Human Resource
Management practices?” Section 5.2.3 analyzes the effect of OPD-SHRM on SHRM
effectiveness and Section 5.2.4 measures employee behavior in hypothetical scenarios.
Section 5.3 is a qualitative analysis and the fourth approach to finding an answer to
the research question, “Does SHRM in New Zealand organizations contain elements of OPD-
SHRM?”
The chapter uses the statistical method for data analysis through the SPSS
programme.
5.2 Quantitative analysis on SHRM vs. OPD-SHRM
As discussed in Chapter 3, Section 3.4.3, p. 45 the survey question set has Type 1 and
Type 2 questions.
Type 1 questions measure the effectiveness of SHRM and ask employees about their
work-life balance, job satisfaction, professional development etc.
Type 2 questions measure the extent of the presence of OPD-SHRM elements and ask
employees whether or not they know their KPIs, whether their success is measured in terms
of KPIs or in terms of delivering ideal actions only, how frequently they get support from
their managers etc. These are some core practices within an OPD-SHRM Model and these
survey questions identify whether the current SHRM of New Zealand organizations has those
core practices.
88
This approach of having two different types of questions is to determine the
relationship between the effectiveness of SHRM and the extent of the presence of OPD-
SHRM elements in the SHRM of New Zealand Organizations.
5.2.1 Multiple Regression
Multiple regression is a statistical concept for assessing relationships between two
sets of variables. “The general purpose of multiple regressions (the term was first used by
Pearson, 1908) is to learn more about the relationship between several independent or
predictor variables and a dependent or criterion variable" (Graham, 2009, p. 49). The
researcher utilized the SPSS programme to generate the multiple regression linear equations
in terms of independent variables (predictors) to evaluate the dependent variables.
Each survey question is a variable. In this case, as the impact of OPD-SHRM is to be
determined on the effectiveness of SHRM, the Type 1 questions are dependent variables and
Type 2 questions are independent variables.
Another statistical concept which is worth mentioning here is the Pearson correlation
coefficient. It is a statistical method to investigate the relationship between two quantitative
variables. It describes the linear relationship between two variables. The correlation
coefficient got its name from its inventor, Karl Pearson and is also referred to as Pearson
Product Moment Correlation or PPMC. In simple terms, if two variables when plotted on a
graph represent a line, the variables are said to be perfectly correlated (see Section 3.4.3, p.
46) (Russo, 2004).
Person correlation coefficient is represented by Greek alphabet rho (ρ) and its value
ranges from -1 to 1 through 0. A value of 1 or -1 would mean perfect linear correlation
whereas 0 would mean no correlation between two variables. A graph of perfectly correlated
variables would be a straight line. A positive correlation would mean, when one variable
increases, there is a linear increase in the other variable and vice versa. Similarly, a negative
correlation means when the value of one variable increases, the value of the other variable
decreases linearly. A correlation of value between 0.3 and 0.5 is a medium correlation and
0.5 to 1.0 is a high correlation (see Section 3.4.3, p. 46) (Russo, 2004).
Table 13 on page 89 is the Pearson Correlation Coefficient matrix of Type 1 and Type
2 variables sets.
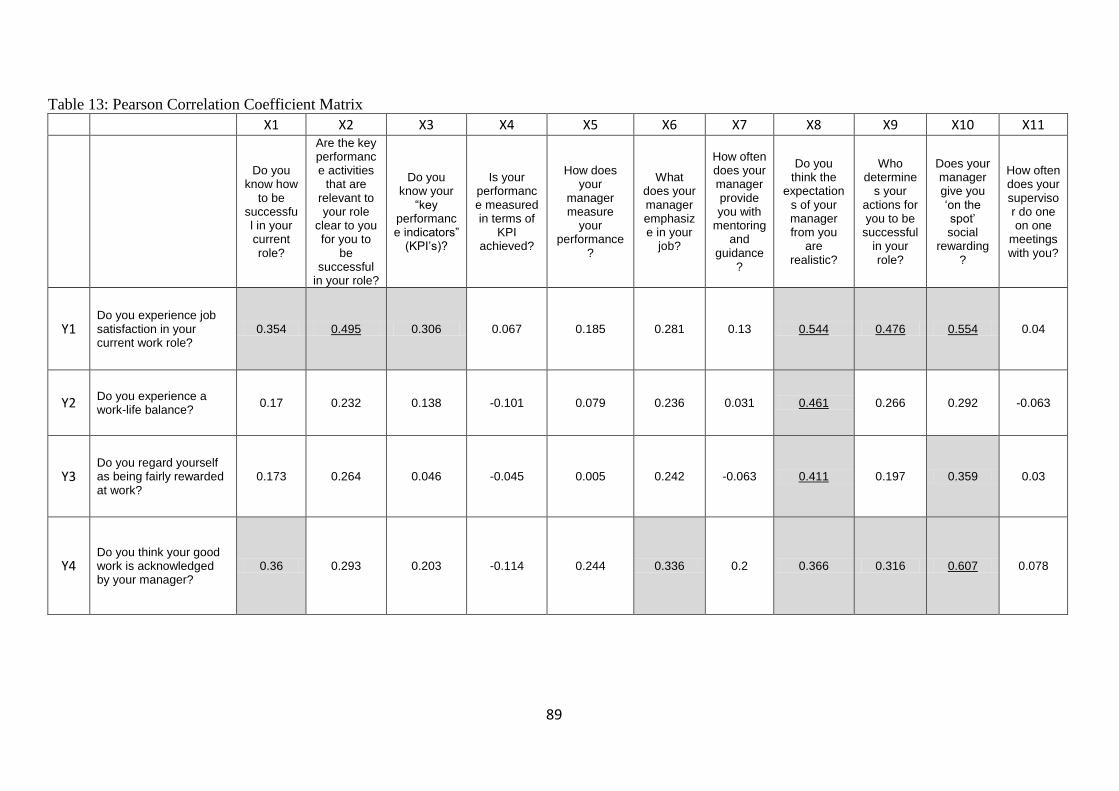
89
Table 13: Pearson Correlation Coefficient Matrix
X1 X2 X3 X4 X5 X6 X7 X8 X9 X10 X11
Do you know how
to be successful in your current role?
Are the key performance activities
that are relevant to your role
clear to you for you to
be successful
in your role?
Do you know your
“key performance indicators”
(KPI‟s)?
Is your performance measured in terms of
KPI achieved?
How does your
manager measure
your performance
?
What does your manager emphasize in your
job?
How often does your manager provide you with
mentoring and
guidance?
Do you think the
expectations of your manager from you
are realistic?
Who determine
s your actions for you to be
successful in your role?
Does your manager give you „on the spot‟ social
rewarding?
How often does your supervisor do one on one
meetings with you?
Y1 Do you experience job satisfaction in your current work role?
0.354 0.495 0.306 0.067 0.185 0.281 0.13 0.544 0.476 0.554 0.04
Y2 Do you experience a work-life balance?
0.17 0.232 0.138 -0.101 0.079 0.236 0.031 0.461 0.266 0.292 -0.063
Y3 Do you regard yourself as being fairly rewarded at work?
0.173 0.264 0.046 -0.045 0.005 0.242 -0.063 0.411 0.197 0.359 0.03
Y4 Do you think your good work is acknowledged by your manager?
0.36 0.293 0.203 -0.114 0.244 0.336 0.2 0.366 0.316 0.607 0.078
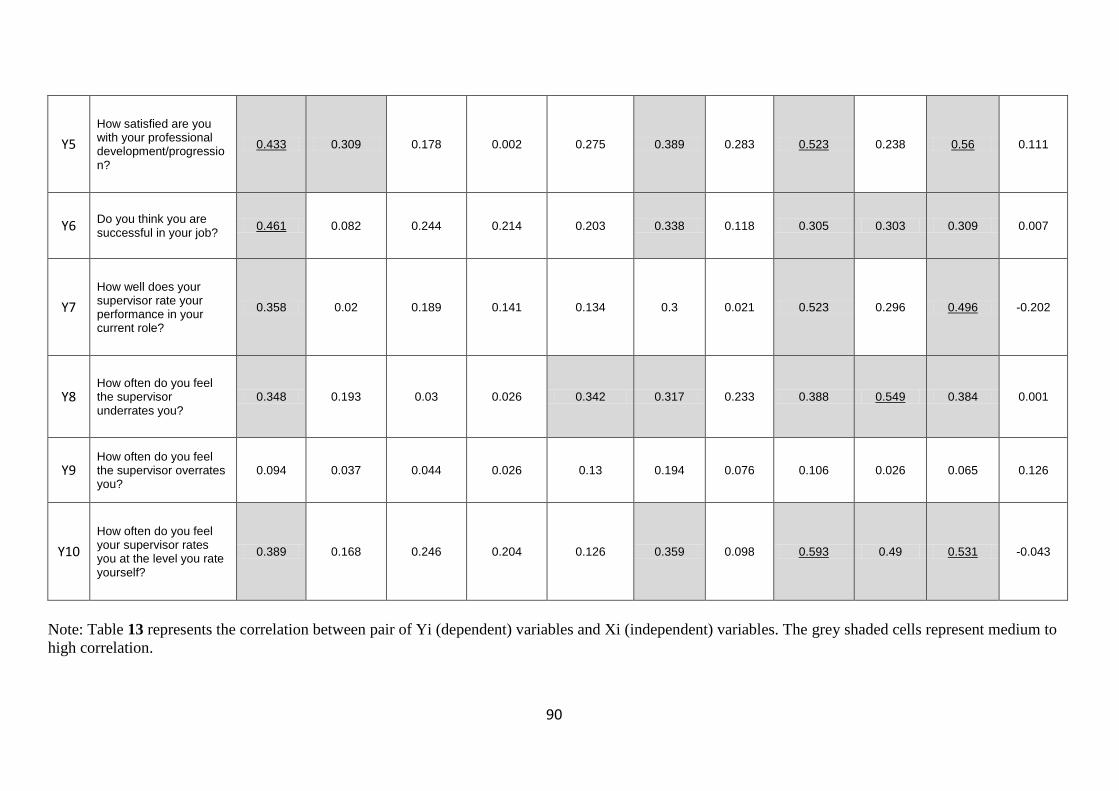
90
Y5
How satisfied are you with your professional development/progression?
0.433 0.309 0.178 0.002 0.275 0.389 0.283 0.523 0.238 0.56 0.111
Y6 Do you think you are successful in your job?
0.461 0.082 0.244 0.214 0.203 0.338 0.118 0.305 0.303 0.309 0.007
Y7
How well does your supervisor rate your performance in your current role?
0.358 0.02 0.189 0.141 0.134 0.3 0.021 0.523 0.296 0.496 -0.202
Y8 How often do you feel the supervisor underrates you?
0.348 0.193 0.03 0.026 0.342 0.317 0.233 0.388 0.549 0.384 0.001
Y9 How often do you feel the supervisor overrates you?
0.094 0.037 0.044 0.026 0.13 0.194 0.076 0.106 0.026 0.065 0.126
Y10
How often do you feel your supervisor rates you at the level you rate yourself?
0.389 0.168 0.246 0.204 0.126 0.359 0.098 0.593 0.49 0.531 -0.043
Note: Table 13 represents the correlation between pair of Yi (dependent) variables and Xi (independent) variables. The grey shaded cells represent medium to
high correlation.
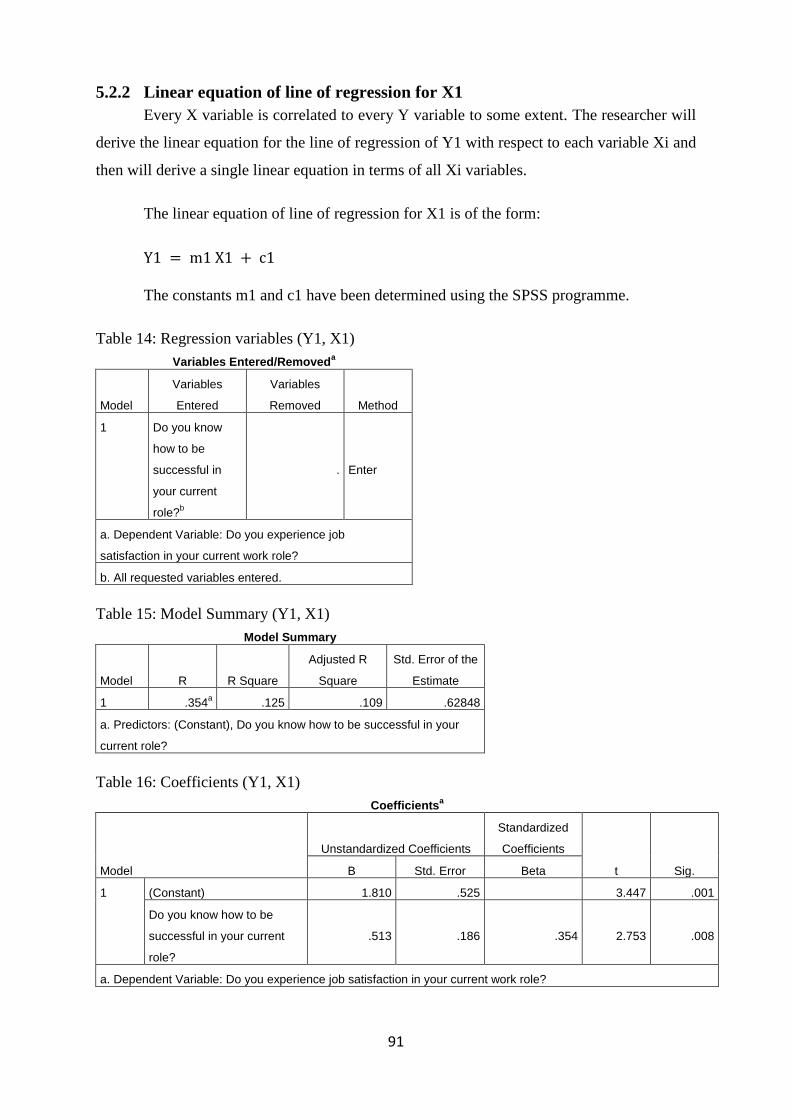
91
5.2.2 Linear equation of line of regression for X1
Every X variable is correlated to every Y variable to some extent. The researcher will
derive the linear equation for the line of regression of Y1 with respect to each variable Xi and
then will derive a single linear equation in terms of all Xi variables.
The linear equation of line of regression for X1 is of the form:
The constants m1 and c1 have been determined using the SPSS programme.
Table 14: Regression variables (Y1, X1)
Variables Entered/Removeda
Model
Variables
Entered
Variables
Removed Method
1 Do you know
how to be
successful in
your current
role?b
. Enter
a. Dependent Variable: Do you experience job
satisfaction in your current work role?
b. All requested variables entered.
Table 15: Model Summary (Y1, X1)
Model Summary
Model R R Square
Adjusted R
Square
Std. Error of the
Estimate
1 .354a .125 .109 .62848
a. Predictors: (Constant), Do you know how to be successful in your
current role?
Table 16: Coefficients (Y1, X1)
Coefficientsa
Model
Unstandardized Coefficients
Standardized
Coefficients
t Sig. B Std. Error Beta
1 (Constant) 1.810 .525 3.447 .001
Do you know how to be
successful in your current
role?
.513 .186 .354 2.753 .008
a. Dependent Variable: Do you experience job satisfaction in your current work role?

92
From the above Table 16: Coefficients (Y1, X1), the linear equation of Y1 variable
can be determined in terms of predictor X1 as:
The above equation yields the value of Y1 from a given value of X1 with a Standard
error of estimate of 0.62848. The standard error of estimate is error in prediction. A standard
error of estimate of 0.62848 means the difference between the predicted value of Y1 and the
actual value of Y1 is less than or equal to 0.62848.
In similar way, the equation for the line of regression for Y1 and X2 variables has
been derived. In this case the Y1 is “Do you experience job satisfaction in your current work
role?” and X2 variables is “Are the key performance activities that are relevant to your role
clear to you for you to be successful in your role?”
Table 17 and Table 18 below are Model Summary and Coefficients2
tables
respectively obtained from running “Analyze Regression” command in SPSS programme.
Table 17: Model Summary (Y1, X2)
Model Summary
Model R R Square
Adjusted R
Square
Std. Error of the
Estimate
1 .495a .245 .231 .58376
a. Predictors: (Constant), Are the key performance activities that are
relevant to your role clear to you for you to be successful in your role?
Table 18: Coefficients (Y1, X2)
Coefficientsa
Model
Unstandardized Coefficients
Standardized
Coefficients
t Sig. B Std. Error Beta
1 (Constant) 2.265 .247 9.169 .000
Are the key performance
activities that are relevant to
your role clear to you for you
to be successful in your
role?
.411 .099 .495 4.149 .000
a. Dependent Variable: Do you experience job satisfaction in your current work role?
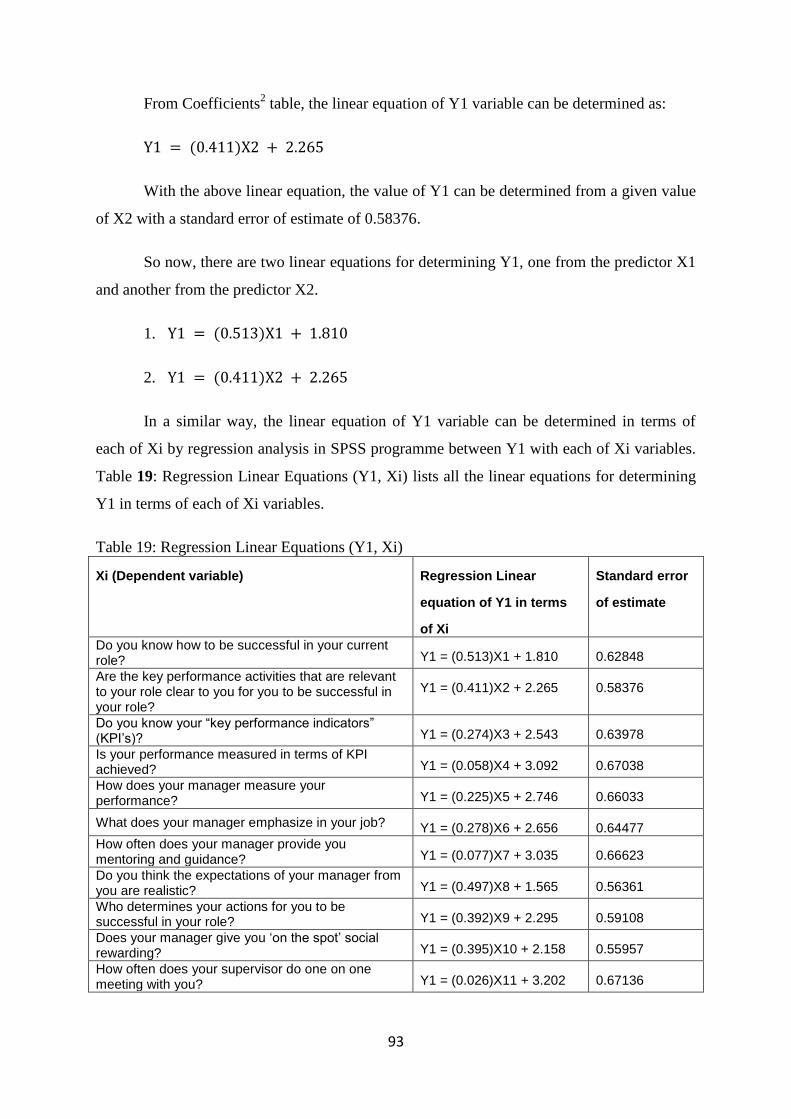
93
From Coefficients2 table, the linear equation of Y1 variable can be determined as:
With the above linear equation, the value of Y1 can be determined from a given value
of X2 with a standard error of estimate of 0.58376.
So now, there are two linear equations for determining Y1, one from the predictor X1
and another from the predictor X2.
1.
2.
In a similar way, the linear equation of Y1 variable can be determined in terms of
each of Xi by regression analysis in SPSS programme between Y1 with each of Xi variables.
Table 19: Regression Linear Equations (Y1, Xi) lists all the linear equations for determining
Y1 in terms of each of Xi variables.
Table 19: Regression Linear Equations (Y1, Xi)
Xi (Dependent variable) Regression Linear
equation of Y1 in terms
of Xi
Standard error
of estimate
Do you know how to be successful in your current role? Y1 = (0.513)X1 + 1.810 0.62848
Are the key performance activities that are relevant to your role clear to you for you to be successful in your role?
Y1 = (0.411)X2 + 2.265 0.58376
Do you know your “key performance indicators” (KPI‟s)? Y1 = (0.274)X3 + 2.543 0.63978
Is your performance measured in terms of KPI achieved? Y1 = (0.058)X4 + 3.092 0.67038
How does your manager measure your performance? Y1 = (0.225)X5 + 2.746 0.66033
What does your manager emphasize in your job? Y1 = (0.278)X6 + 2.656 0.64477
How often does your manager provide you mentoring and guidance? Y1 = (0.077)X7 + 3.035 0.66623
Do you think the expectations of your manager from you are realistic? Y1 = (0.497)X8 + 1.565 0.56361
Who determines your actions for you to be successful in your role? Y1 = (0.392)X9 + 2.295 0.59108
Does your manager give you „on the spot‟ social rewarding? Y1 = (0.395)X10 + 2.158 0.55957
How often does your supervisor do one on one meeting with you? Y1 = (0.026)X11 + 3.202 0.67136

94
From the above, the standard error of estimate is different for different Xi. This makes
sense as a different dependent variables Xi has a different correlation coefficient with Y1
variable. The more correlated a variable is with Y1, the better predictor it is of the dependent
variable, Y1.
The „Standard error of estimate‟ is also an indicator of correlation between the
dependent and independent variable. The more they are correlated, the more accurately the
independent variable can be determined in terms of dependent variable; thereby the „Standard
error of estimate‟ will be lesser (Chaudhary, 2009).
By looking at the Table 19 on page 93, it can be found that the „Standard error of
estimate‟ is lowest when Y1 is represented in terms of X10. This means that X10 is the best
predictor of Y1 among all other independent variables, Xi.
Before selecting the above equation as the final one to calculate a value for Y1, the
researcher have to first determine linear equations for the line of regression between the
independent variable, Y1 and all dependent variables, Xi taken together. This is also known
as the multiple regression equation.
A Multiple Linear Regression Equation represents the dependent variable in terms of
all the predictors (independent variables). In this case, we will find an equation for Y1 in
terms of all Xi and will check whether the standard error of estimate in this case is even less
than the case when the equation is in terms of Y1 and X10. A less standard error of estimate
will indicate that Y1 is better predicted with all dependent variables, Xi taken together
(Chaudhary, 2009).
Now, to find how all variables Xi collectively related to Y1, a multiple regression
analysis between Y1 and all independent variables, Xi has been run using the SPSS
programme.
Table 20 and Table 21 on page 95 show the Model Summary and Coefficient2 tables
respectively for multiple regression analysis between Y1 and Xi (where i range from 1 to 11).

95
Table 20: Model Summary (Y1, Xi)
Model Summary
Model R R Square Adjusted R Square Std. Error of the Estimate
1 .776a .602 .500 .47071
a. Predictors: (Constant), How often does your supervisor do one on one meeting with you?, How does your
manager measure your performance?, Do you think the expectations of your manager from you are realistic?,
Is your performance measured in terms of KPI achieved?, What does your manager emphasize in your job?,
Are the key performance activities that are relevant to your role clear to you for you to be successful in your
role?, Do you know how to be successful in your current role?, Does your manager give you „on the spot‟ social
rewarding?, How often does your manager provide you mentoring and guidance?, Who determines your actions
for you to be successful in your role?, Do you know your “key performance indicators” (KPI‟s)?
Table 21: Coefficients (Y1, Xi)
Coefficientsa
Model
Unstandardized
Coefficients
Standardized
Coefficients
t Sig. B Std. Error Beta
1 (Constant) 1.349 .519 2.600 .013
Do you know how to be successful in your current
role? .028 .215 .019 .128 .898
Are the key performance activities that are relevant
to your role clear to you for you to be successful in
your role?
.467 .120 .563 3.891 .000
Do you know your “key performance indicators”
(KPI‟s)? -.132 .152 -.147 -.866 .391
Is your performance measured in terms of KPI
achieved? -.034 .118 -.039 -.287 .776
How does your manager measure your
performance? .058 .159 .047 .362 .719
What does your manager emphasize in your job? -.115 .120 -.116 -.955 .345
How often does your manager provide you
mentoring and guidance? -.206 .082 -.345
-2.505
.016
Do you think the expectations of your manager from
you are realistic? .147 .135 .161 1.084 .285
Who determines your actions for you to be
successful in your role? .194 .115 .236 1.690 .098
Does your manager give you „on the spot‟ social
rewarding? .301 .095 .422 3.157 .003
How often does your supervisor do one on one
meeting with you? -.005 .077 -.008 -.065 .949
a. Dependent Variable: Do you experience job satisfaction in your current work role?
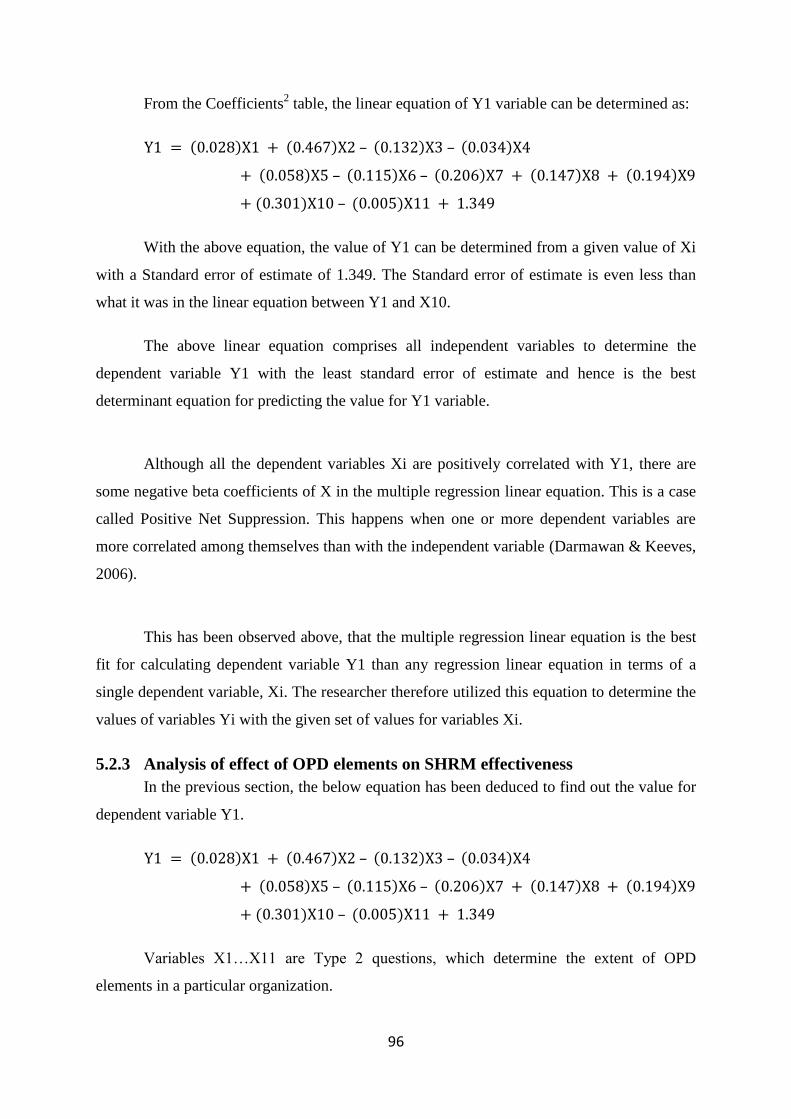
96
From the Coefficients2 table, the linear equation of Y1 variable can be determined as:
With the above equation, the value of Y1 can be determined from a given value of Xi
with a Standard error of estimate of 1.349. The Standard error of estimate is even less than
what it was in the linear equation between Y1 and X10.
The above linear equation comprises all independent variables to determine the
dependent variable Y1 with the least standard error of estimate and hence is the best
determinant equation for predicting the value for Y1 variable.
Although all the dependent variables Xi are positively correlated with Y1, there are
some negative beta coefficients of X in the multiple regression linear equation. This is a case
called Positive Net Suppression. This happens when one or more dependent variables are
more correlated among themselves than with the independent variable (Darmawan & Keeves,
2006).
This has been observed above, that the multiple regression linear equation is the best
fit for calculating dependent variable Y1 than any regression linear equation in terms of a
single dependent variable, Xi. The researcher therefore utilized this equation to determine the
values of variables Yi with the given set of values for variables Xi.
5.2.3 Analysis of effect of OPD elements on SHRM effectiveness
In the previous section, the below equation has been deduced to find out the value for
dependent variable Y1.
Variables X1…X11 are Type 2 questions, which determine the extent of OPD
elements in a particular organization.
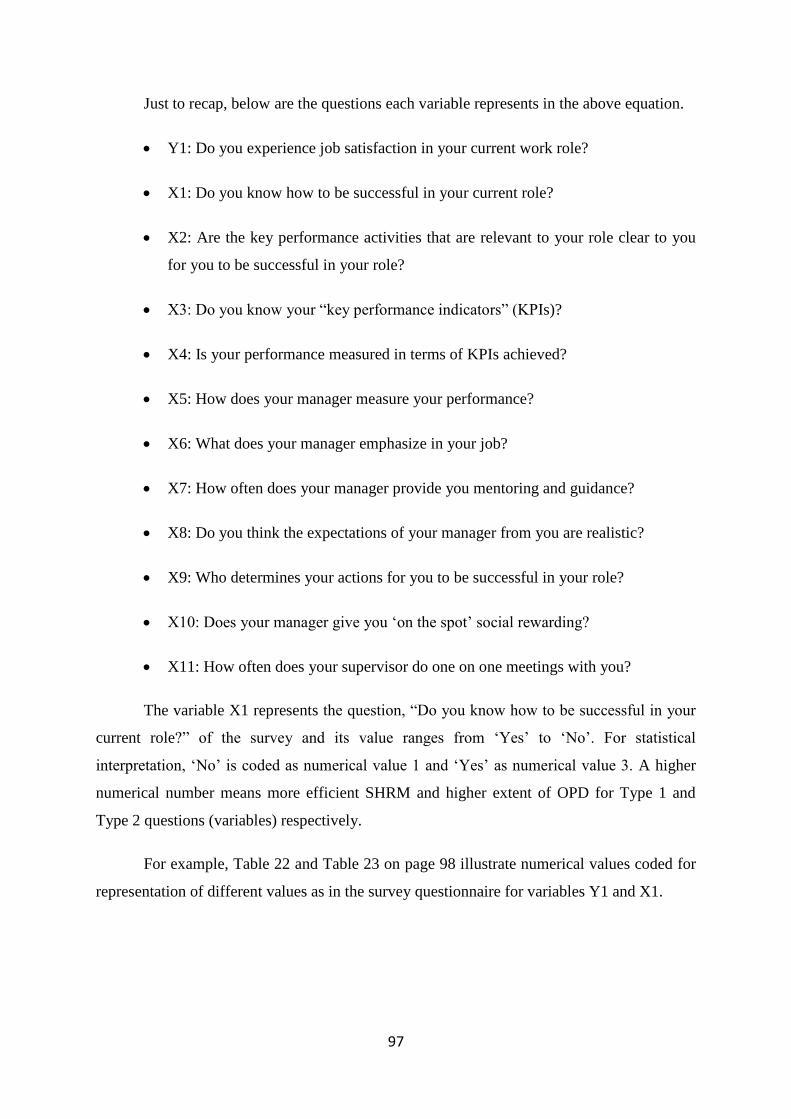
97
Just to recap, below are the questions each variable represents in the above equation.
Y1: Do you experience job satisfaction in your current work role?
X1: Do you know how to be successful in your current role?
X2: Are the key performance activities that are relevant to your role clear to you
for you to be successful in your role?
X3: Do you know your “key performance indicators” (KPIs)?
X4: Is your performance measured in terms of KPIs achieved?
X5: How does your manager measure your performance?
X6: What does your manager emphasize in your job?
X7: How often does your manager provide you mentoring and guidance?
X8: Do you think the expectations of your manager from you are realistic?
X9: Who determines your actions for you to be successful in your role?
X10: Does your manager give you „on the spot‟ social rewarding?
X11: How often does your supervisor do one on one meetings with you?
The variable X1 represents the question, “Do you know how to be successful in your
current role?” of the survey and its value ranges from „Yes‟ to „No‟. For statistical
interpretation, „No‟ is coded as numerical value 1 and „Yes‟ as numerical value 3. A higher
numerical number means more efficient SHRM and higher extent of OPD for Type 1 and
Type 2 questions (variables) respectively.
For example, Table 22 and Table 23 on page 98 illustrate numerical values coded for
representation of different values as in the survey questionnaire for variables Y1 and X1.
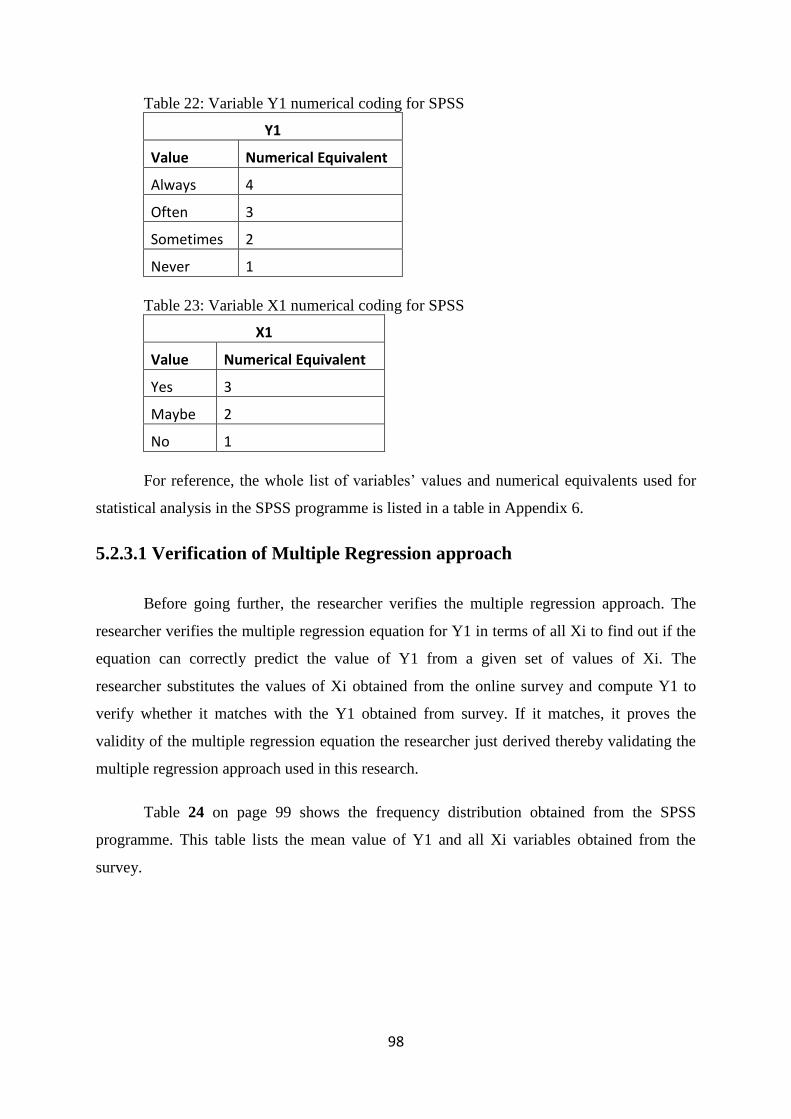
98
Table 22: Variable Y1 numerical coding for SPSS
Y1
Value Numerical Equivalent
Always 4
Often 3
Sometimes 2
Never 1
Table 23: Variable X1 numerical coding for SPSS
X1
Value Numerical Equivalent
Yes 3
Maybe 2
No 1
For reference, the whole list of variables‟ values and numerical equivalents used for
statistical analysis in the SPSS programme is listed in a table in Appendix 6.
5.2.3.1 Verification of Multiple Regression approach
Before going further, the researcher verifies the multiple regression approach. The
researcher verifies the multiple regression equation for Y1 in terms of all Xi to find out if the
equation can correctly predict the value of Y1 from a given set of values of Xi. The
researcher substitutes the values of Xi obtained from the online survey and compute Y1 to
verify whether it matches with the Y1 obtained from survey. If it matches, it proves the
validity of the multiple regression equation the researcher just derived thereby validating the
multiple regression approach used in this research.
Table 24 on page 99 shows the frequency distribution obtained from the SPSS
programme. This table lists the mean value of Y1 and all Xi variables obtained from the
survey.

99
Table 24: Frequency Distribution (Y1, Xi)
Y1 X1 X2 X3 X4 X5 X6 X7 X8 X9 X10 X11
Do you
experience job
satisfaction in your curre
nt work role?
Do you
know how to be successful in
your curre
nt role?
Are the key
performanc
e activiti
es that are
relevant to your role clear
to you for
you to be
successful
in your role?
Do you
know your “key
performanc
e indicators”
(KPI‟s)?
Is your
performanc
e measured
in terms
of KPIs achieved?
How does your
manager
measure your performance
?
What does your manager emphasize in your job?
How often does your manager provide you with mentoring and guidance
?
Do you think the
expectations of your
manager
from you are
realistic?
Who determine
s your actions for you
to be successful in
your role?
Does your
manager give you „on the
spot‟ socia
l rewarding?
How often does your supervisor do one on
one meetings with you?
N Valid
55 55 55 55 55 55 55 55 55 55 55 55
Missing
0 0 0 0 0 0 0 0 0 0 0 0
Mean 3.2364
2.7818
2.3636
2.5273
2.4727
2.1818 2.09
09 2.60
00 3.363
6 2.400
0 2.727
3 1.34
55
Median 3.0000
3.0000
3.0000
3.0000
3.0000
2.0000 2.00
00 3.00
00 4.000
0 3.000
0 3.000
0 1.00
00
Mode 3.00 3.00 3.00 3.00 3.00 2.00 2.00 3.00 4.00 3.00 3.00 2.00
Std. Deviation
.66566
.45910
.80193
.74173
.76629
.54742 .674
20 1.11555
.72937
.80737
.93203
1.04027
Range 2.00 2.00 2.00 2.00 2.00 2.00 2.00 3.00 2.00 2.00 3.00 3.00
Minimum
2.00 1.00 1.00 1.00 1.00 1.00 1.00 1.00 2.00 1.00 1.00 0.00
Maximum
4.00 3.00 3.00 3.00 3.00 3.00 3.00 4.00 4.00 3.00 4.00 3.00
In the multiple regression equation below, the researcher has substituted Xi variables
with their mean values.

100
The mean value for the question Y1, “Do you experience job satisfaction in your
current work role?” as obtained from the survey is 3.2345, which means in the current SHRM
in New Zealand organizations the job satisfaction level in employees is 3.2345 on a scale
ranging from 1 to 4, with 1 being „Never‟ and 4 being „Always‟. The current SHRM in New
Zealand organization is effective as much as to make employees experience job satisfaction
somewhere between „Always‟ and „Often‟ but inclined more towards „Often‟.
5.2.3.2 Measuring the impact of increase in extent of OPD-SHRM
To measure the impact of OPD-SHRM on SHRM effectiveness, the value of each Xi
variable is increased to its maximum. And, the value of Yi is predicted with this increased
value of Xi. The maximum value for each variable can be found in Appendix 6, which lists
the numerical equivalent of each choice of the survey questions. With the help of multiple
regression equations for Y1 in terms of Xi, the researcher predicts the value of Y1 to know
how an increase in OPD characteristics within SHRM impacts on employee job satisfaction.

101
Replacing Xi with its maximum values, the researcher has RHS as:
= 3.693451
So, with all Xi increased to its maximum value, an increase in the value of Y1 can be
seen. The value of Y1 soared from 3.2364 to 3.69345. This implies that the job satisfaction
level increases with an increase in the extent of OPD-SHRM elements.
This is now measured in percentages:
Current Y1 (job satisfaction level):
Increased Job satisfaction level
Clearly, there is an increase of about 15% in job satisfaction with the increase in the
extent of OPD-SHRM elements.
Similarly, the multiple regression equations for other Yi variables are derived by
running the multiple regression command “Analyze Regression” command in the SPSS
programme. Table 25 on page 102 shows all Yi variables.

102
Table 25: Multiple Regression Equations (Yi, Xi)
Dependent Variable(Yi) Multiple Regression Linear Equation Current Y (%)
Predicted Y In Absolute OPD Environment
(%)
Net Difference(Predicted
Y - Current Y)
Do you experience job satisfaction in your current work role?
74.55 89.78 15.24
Do you experience a work-life balance?
64.24 63.95 -0.29
Do you regard yourself as being fairly rewarded at work?
63.03 67.04 4.01
Do you think your good work is acknowledged by your manager?
72.73 86.50 13.77
How satisfied are you with your professional development/progression?
67.88 87.88 20.00
Do you think you are successful in your job?
71.52 81.21 9.70

103
How well does your supervisor rate your performance in your current role?
78.93 78.08 -0.85
How often do you feel the supervisor underrates you?
17.31 10.71 -6.60
How often do you feel the supervisor overrates you?
15.58 5.21 -10.37
How often do you feel your supervisor rates you at the level you rate yourself?
66.82 75.01 8.20

104
The negative value of net improvement for variables Y9 and Y10 may appear as if
there is a decline in them in the absolute environment of OPD but actually this is not the case.
For variables Y9 and Y10, a negative value indicates a more effective SHRM. In a perfectly
efficient and ideal SHRM environment, a supervisor will accurately estimate the performance
of the team. The more often the supervisor underrates or overrates the employees‟
performance, the less efficient SHRM will be. Hence, a negative value for „Net difference
(Predicted Y - Current Y)‟ for variables Y9 and Y10 actually shows improvement in an
absolute OPD-SHRM environment.
5.2.3.3 Predicting efficiency of SHRM after increasing the degree of OPD-
SHRM already present
The researcher has identified 10 different variables to measure the SHRM
effectiveness in New Zealand organizations. Which variable weighs more than another for
measuring overall SHRM effectiveness could be another topic for research, but for the sake
of simplicity, the researcher has assumed all 10 variables are of equal weight and are
equivalent parameters for the assessment of SHRM.
Overall effectiveness can thus be measured by simply calculating the average of all
parameters‟ values. Parameters, Y8 and Y9 as they are represented as negative values, have
been adjusted to reflect a higher value for more efficient SHRM. Table 26 on page 105 shows
the last two columns of the table listed above.

105
Table 26: Predicted Yi for OPD-SHRM
Dependent Variable(Yi) Current
Y (%)
Predicted Y in absolute OPD
environment (%)
Do you experience job satisfaction in your current work role?
74.55 89.78
Do you experience a work-life balance? 64.24 63.95 Do you regard yourself as being fairly rewarded at work?
63.03 67.04
Do you think your good work is acknowledged by your manager?
72.73 86.50
How satisfied are you with your professional development/progression?
67.88 87.88
Do you think you are successful in your job? 71.52 81.21 How well does your supervisor rate your performance in your current role?
78.93 78.08
How often do you feel the supervisor underrates you?
82.69 89.29
How often do you feel the supervisor overrates you? 84.42 94.79
How often do you feel your supervisor rates you at the level you rate yourself?
66.82 75.01
Average 72.68 81.35
On a scale of 0 to 100, the effectiveness of SHRM currently in New Zealand
organizations is 72.68 as evaluated from the survey results. This is a good score but with the
introduction of an absolute OPD-SHRM model in the existing SHRM, this score can be
augmented to 81.35. This is an increase of 12%. Though this is not a small increase, it may
appear not very significant and can look as if the introduction of the OPD-SHRM model does
not make a significant change. This can be explained. The OPD-SHRM and SHRM are not
altogether different; theoretically they cannot be represented as two separate non intersecting
sets. Both the systems are HRM with a difference. They are not entirely separate entities with
distinct boundaries which do not touch or overlap each other. This is why the researcher has
measured the extent of OPD-SHRM present in the existing SHRM of New Zealand
Organizations in the first place. The existing SHRM has already some degree of OPD-SHRM
present (the extent has been evaluated later in this chapter) and with that it is 72.68%
efficient. A 12% increase indicates an increase in efficiency with an increase of OPD-SHRM
to its fullest from the level that already exists in the SHRM of New Zealand organizations.

106
The result obtained from this research study conforms to the empirical findings from
organizations where OPD-SHRM was implemented. As mentioned in the literature review in
Section 2.9.2, p. 32, OPD-SHRM can bring an improvement in an organization‟s
performance from 8% to 20% depending upon how well the existing SHRM is performing in
the organization. The result from this research study predicts an improvement of 12% lies
well in between 8% and 20% and also indicates the SHRM in New Zealand organizations in
this sample population to be of a moderate level.
5.2.4 Measuring employees’ behavior in hypothetical OPD scenarios
Type 3 questions in the online survey consist of hypothetical OPD scenarios. The
purpose is to record the opinions of employees on how they would behave in such scenarios.
A positive behavior would mean a higher chance of efficiency increase thereby indicating
that OPD-SHRM could prove more effective than SHRM, if the OPD-SHRM procedures are
adopted in the SHRM of New Zealand organizations (see Section 3.4.3, p. 45).
Table 27 on page 107 is the frequency distribution of Type 3 questions. Each question
had a different number of options for respondents to choose from and thus they differ on the
scale from one another. In order to measure each of the questions on the same scale, a scale
of 100 points has been chosen to uniformly represent values obtained from the online survey.
The last row of Table 27 on page 107 contains the collective answers to the respective survey
question on a scale of 100 points.

107
Table 27: Frequency Distribution of Type 3 Questions
Q1 Q2 Q3 Q4 Q5
If your success in an
assignment is celebrated and acknowledged,
does this motivate and
encourage you to be
successful in your next
assignment?
Does periodic one on one
meetings with the manager help you to
improve your performance?
Do you think it is important for you to be successful at
work?
You deliver an
assignment after working rigorously for 10 days. You feel satisfied
having delivered the assignment because?
Do you want your
performance to be
measured in terms of KPI
value?
N Valid 55 55 55 55 55
Missing 0 0 0 0 0
Mean 3.6182 3.4727 3.8182 1.6727 2.7818
Median 4.0000 4.0000 4.0000 2.0000 3.0000
Mode 4.00 4.00 4.00 2.00 3.00
Std. Deviation .65237 .66261 .43423 .63987 .56735
Minimum 1.00 1.00 2.00 0.00 1.00
Maximum 4.00 4.00 4.00 2.00 3.00
Equivalent value of mean on a 100 point scale 87.27 82.42 93.94 83.64 89.09
It is interesting to note that with a value of 94, being successful at work is given the
most emphasis by the employees. In other words, employees do want to be successful in their
work role. Having a desire in employees is the most crucial factor for an SHRM to be
successful. There is just the need for the right process which enables them to drive their own
success. With a value of 89, many employees‟ emphasis goes not on measuring their
efficiency by KPIs achieved alone. Rather, the efforts they put in also should be accounted
for measuring their efficiency. This is what an OPD-SHRM scenario involves, where
managers‟ emphasis is on the execution of ideal actions, not just on achieving the KPI (see
Section 2.9.2, p. 30). In an OPD-SHRM environment, celebrating the success of employees is
encouraged. According to this result, the employees feel the same up to 87 points on a 100
point scale. Employees feel that celebrating their quality of delivery motivates them.
Motivation is an important parameter in deciding the effectiveness of SHRM within the
organization. Questions 2 and 4 measure the extent to which the employees give importance
to the interactions with their managers: whether they do not want to be bothered by their
managers and want to be left alone to do their work until they finish it or they feel the
periodic one-on-one meeting helps them deliver better. The values of questions 2 and 4 are
nearly the same and are 82.4 and 83.6 respectively. Periodic one-on-one interactions are
108
given the least emphasis by the respondents but it is higher when managers‟ interactions
contribute to supporting the employees to deliver their assignment with 100% successes. The
main idea is that for employees the interaction is more worthy when it enables them to
perform better.
This analysis provides an answer to the Research Question, “How is the OPD model
better than the existing SHRM practices.” To get an overall score and consolidate individual
values of the questions, the mean of all values can be taken as an indicator for measuring
employees‟ behavior in OPD-SHRM scenarios.
Clearly, it has been observed that in the OPD-SHRM scenarios presented via the
survey questionnaire, the employees have their opinion inclined positively towards it with up
to 87.27 points on a 100 point scale. This is a significant amount and an indicator that
employees do feel celebrating their success motivates them, periodic interaction with
managers helps them do their job better, they do not mind their managers interfering to
provide them with support and help, so they deliver with 100% success. They desire to be
successful and feel their actions should be considered over KPI‟s achieved for measuring
their efficiency.
5.2.5 Measuring the extent of the presence of OPD-SHRM elements
Type 2 questions set in the online survey are designed around questions regarding
some characteristic attributes of the OPD-SHRM model to find its presence in the current
SHRM in New Zealand organizations (see Section 3.4.3). Though this is not an exhaustive
and enumerated list of OPD-SHRM attributes it has been designed to be relevant to
employees belonging to an organization with any HRM system. Responses collected for
those survey questions can thus be an indicator of the extent of OPD-SHRM elements already
present in the SHRM of New Zealand organizations. Responses to the Type 2 question set
have been consolidated into a numerical equivalence to measure the extent of the presence of
OPD-SHRM elements. This analysis answers the first research questions, “Does the SHRM
in New Zealand organizations have a presence of OPD-SHRM elements?”
The approach used for this analysis is similar to the approach utilized in the previous
section to measure employees‟ behavior in absolute OPD-SHRM.

109
Similarly to the previous approach, each question‟s response has a numerical value,
typically from 1 to 4. A low value means a low measure for OPD-SHRM presence and
similarly a high value indicates a high measure of OPD-SHRM presence in the SHRM of
New Zealand organizations. Based on the numerical values assigned to the questions‟
responses, the Frequency Distribution table for Type 2 survey questions is shown in Table 28
on Page 110.
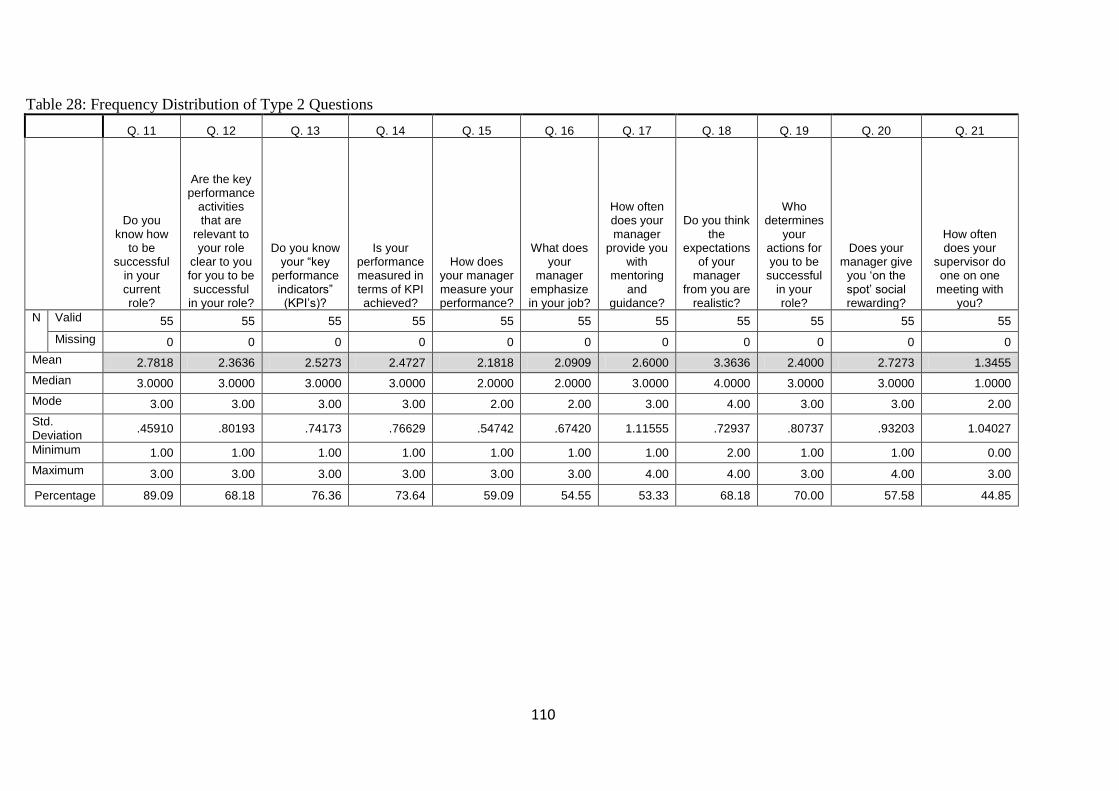
110
Table 28: Frequency Distribution of Type 2 Questions
Q. 11 Q. 12 Q. 13 Q. 14 Q. 15 Q. 16 Q. 17 Q. 18 Q. 19 Q. 20 Q. 21
Do you know how
to be successful
in your current role?
Are the key performance
activities that are
relevant to your role
clear to you for you to be successful
in your role?
Do you know your “key
performance indicators” (KPI‟s)?
Is your performance measured in terms of KPI achieved?
How does your manager measure your performance?
What does your
manager emphasize in your job?
How often does your manager
provide you with
mentoring and
guidance?
Do you think the
expectations of your
manager from you are
realistic?
Who determines
your actions for you to be
successful in your role?
Does your manager give
you „on the spot‟ social rewarding?
How often does your
supervisor do one on one
meeting with you?
N Valid 55 55 55 55 55 55 55 55 55 55 55
Missing 0 0 0 0 0 0 0 0 0 0 0
Mean 2.7818 2.3636 2.5273 2.4727 2.1818 2.0909 2.6000 3.3636 2.4000 2.7273 1.3455
Median 3.0000 3.0000 3.0000 3.0000 2.0000 2.0000 3.0000 4.0000 3.0000 3.0000 1.0000
Mode 3.00 3.00 3.00 3.00 2.00 2.00 3.00 4.00 3.00 3.00 2.00
Std. Deviation
.45910 .80193 .74173 .76629 .54742 .67420 1.11555 .72937 .80737 .93203 1.04027
Minimum 1.00 1.00 1.00 1.00 1.00 1.00 1.00 2.00 1.00 1.00 0.00
Maximum 3.00 3.00 3.00 3.00 3.00 3.00 4.00 4.00 3.00 4.00 3.00
Percentage 89.09 68.18 76.36 73.64 59.09 54.55 53.33 68.18 70.00 57.58 44.85

111
The last row of Table 28 on page 110 contains values on a scale of 100 points. The
value on a scale of 100 has been calculated utilizing the mathematical formula below.
Upper Bound and Lower Bound is the maximum and the minimum value designated
to an option of the question. The row header „Minimum‟ should not be confused with „Lower
Bound‟. A Minimum of 2.00 for example, as in case of question 18 only means none of the
respondents answered that question with the option having 1 as its numerical value. In an
ideal OPD-SHRM environment, the above questions will always have an answer with
numerical equivalence, 4. Considering this, values for the above questions have been
assessed for measuring the extent of OPD-SHRM present in the current SHRM in New
Zealand organizations. An average of all values or rather the extent of the presence of OPD-
SHRM can be computed as below:
By using this technique, the obtained value, 65 (approximated), is an indicative extent
of the presence of OPD elements on a scale of 100 points. This is just a fair estimate and
serves the purpose of numerical estimation of the extent of OPD in SHRM in New Zealand
organizations.
5.3 Qualitative analysis
In the qualitative research, eleven HR managers were questioned regarding the
effectiveness of current SHRM in New Zealand organizations.
To the question “Are employees clear on ideal actions to achieve those KPIs?”, 7 out
of 11 HR managers said “Yes”. While saying "Yes", they did not mention any system they
had implemented in their organization which ensured the ideal actions to be at the top of the
mind of the employees. Except for 2 HR managers, none articulated whether, in their
organizations, ideal actions were derived or not or at least were discussed for achieving the
KPIs. Although they had systems to set annual goals and KPIs, managers did the regular
catch ups with teams about how they were going about to achieve the KPIs set in the system.
Some organizations had standards set to define the KPIs to create smart KPIs for different
112
roles. Employees‟ roles have key competencies associated with them on the basis of which
KPIs are linked.
One of the HR managers said, "The supervisors guide employees how to do it in the
proper way." Guiding helps but laying out a clear, concise list of discrete actions is what
OPD-SHRM is (see Section 2.6, p. 23). So, those respondents who answered „Yes‟ formed a
majority but did not have a system of defining „ideal actions‟ but rather supported it as
managers' responsibility and mostly employees‟ responsibility. The emphasis has always
been more on KPIs than on ideal actions. The responses of two HR managers suggested
similarity with the OPD-SHRM model in regard to emphasis on actions to achieve KPI rather
than on achieving the KPI anyhow. One of the HR managers said, “There are also the key
actions that they need to undertake to achieve those KPI‟s. We do whole sessions with
managers on how to write KPIs. When you come up with a KPI then they have up to 3 key
actions to support those and they are very specific and we talk about how they need to be
specific and we also outline that they need to be specific and measurable.” Another HR
manager‟s response was close to OPD-SHRM in a sense. The HR manager said, "Throughout
the year, they would communicate with employees on one on one forums and make sure that
employees are clear on what they need to achieve and how they are going to go about doing
it." To have an emphasis on how the employee is going to go about achieving the KPIs,
suggests an OPD-SHRM attribute (see Section 2.6, p. 23). The remaining HR managers, who
responded with „Maybe‟, either did not seem to be aware of the „ideal action‟ or it did not
make any sense in their business context because sometimes there is no specific way of doing
certain things. For example, in the case of a creative industry, there cannot be the same
stereotyped approach for working on different creative tasks.
In an OPD-SHRM environment, the actions are defined and confirmed to the
employees. The employees are then expected to be inclined to execute those ideal actions as
their managers requested them. Six of the HR managers said „Yes‟ when asked whether their
employees are inclined to execute ideal actions as their manager requested them to do. The
rest of all HR managers were unsure of this. One of the HR managers, who said, "Yes",
believed that it was facilitated by the system they had in place. The HR manager said, "In
their performance management system, if they find someone not willing to work on things as
their manager wanted because the employee may feel he/she has a better way of doing
something but the manager may have a reason why they want them to do it in a certain way,
113
we always try to create an alignment and agreement about how they are going to deliver it."
Others‟ answers were more about ideal actions rather than an inclination towards the
manager‟s way of executing ideal actions. As one of the HR managers said, “We try to put
more emphasis on managers having conversations with their teams about how they achieve
just as much as what they achieve.” And another said, “There are certain processes that we
have to follow. There are fundamentals in how we deliver in a timely manner and damage
free.” The HR manager is seen here emphasizing manager–employee communication and as
well emphasis is on the way the employees are achieving their KPIs. There may not be ideal
actions defined explicitly for each employee but a fundamental set of ideal actions for doing
the work is defined to ensure delivery in a timely and damage free manner. Another HR
manager said, “We do not have job descriptions here but we do have quality manuals which
say how to do things around here.”
Many HR managers emphasized that communication between managers and
employees were encouraged which would help them keep the KPIs or the ideal actions on the
top of the mind of the employees (see Section 2.6). An HR manager said, “We tell managers
to make sure they revisit their KPIs on a regular basis to check.”
Rewarding and recognition are ways of keeping a high motivational state in the
employees (see Section 2.6). In the same way, there are some similar practices being
followed in SHRM in New Zealand organizations. These practices include giving incentives,
bonuses and promotions. In the words of an HR manager, “We do „employee of the year,‟ we
do kudos, lots of money and things like that. Sharing those aspects when we give a bonus at
the end of the year. We do Christmas parties, and people make money and get a week‟s
salary." In some organizations, incentives are for some specific teams, for example the sales
team. An HR manager said, “We start the commission at 90% of the target.” Besides
rewarding and giving recognition, many organizations have other perks and benefits for the
employees, for example, organizations do wellness programs and different fun events.
5.4 Summary
The statistical method employed explores the correlation between different variables
to measure OPD-SHRM elements and SHRM effectiveness from employees‟ as well as the
employers‟ perspective. According to 55 participants of the survey, the results show that an
increase in OPD-SHRM elements has a positive impact on SHRM effectiveness. This
statistical analysis of the survey predicts an increase of 12% in the SHRM effectiveness in

114
New Zealand organizations with an OPD-SHRM model. This prediction is based on the
assumption that the current SHRM in New Zealand organizations already has some extent of
OPD-SHRM elements. This assumption is supported by the qualitative analysis of interviews
of eleven respondents. The analysis shows the presence of OPD-SHRM elements although
not exactly in the way it happens to be in OPD-SHRM, in the current SHRM of New Zealand
organizations.
The result showing an increase in SHRM effectiveness with OPD-SHRM is in
compliance with the result obtained from the part of the survey that assesses employees'
behavior in a hypothetical OPD-SHRM scenario. The respondents are affirmative to 87.27%
on exhibiting positive behavior in an OPD-SHRM context.
The next chapter presents a synthesis of results of this research study and
recommendations for future research.

115
Chapter 6: Conclusions and Recommendations
6.1 Introduction
This research study was conducted to analyze SHRM in New Zealand organizations,
the majority of which are service organizations, and to discover whether OPD-SHRM could
have been more effective in organizations in reaching SHRM objectives. As cited in Wright,
Dunford and Snell (2001), the SHRM evolution started in the early 1980s with the article of
Devanna, Fombrum and Tichy (1984) extensively exploring the linkage between HR and
strategy. An increasing consensus is emerging among researchers that employees‟ behavior is
an important independent component of SHRM. Organizations must adequately utilize its
valuable human capital, or else, mismanagement of employees and poor work design can fail
the organization to deploy the human capital in achieving its strategic goals (Wright et al.,
2001). Even today, as this study explored, HR personnel are not very definite about the
results of SHRM processes implemented in their organizations. OPD theory is a relatively
new and seamlessly plugs into an organization‟s existing SHRM systems. It is a result of
Hawthorne experiments of the 1920s and theoretically is a causal theory of science which
explains how organizational strategies can be better linked with people behavior thereby
benefiting the organization (Nel & Little, 2010). As OPD theory implementation has shown
positive results in organizations, it is a critical area requiring further research to explore and
ascertain its validity as improved SHRM in organizations.
The research study has accomplished the objectives listed below and have discovered
the answers to the research questions.
1. To assess SHRM in New Zealand organizations for its effectiveness in achieving
SHRM outcomes.
2. To measure the extent of the presence of OPD elements in SHRM in New Zealand
organizations.
3. To measure the conformance of the behavior of employees with the OPD
environment.
4. To interview HR managers in order to contrast the existing SHRM practices in
New Zealand organizations with the OPD model.

116
Based on the outcomes of the research objectives, this research study sought to
answer two questions by analyzing SHRM in New Zealand organizations.
1. Does SHRM in New Zealand organizations contain elements of OPD-SHRM?
2. Is the OPD-SHRM model better than existing Human Resource Management
practices?
Section 6.2 synthesizes the research findings which answer the research questions of
this study. Like any research study, this study also has some limitations. Section 6.3 lists all
those limitations of this research study and is followed by Section 6.4 presenting suggestions
for further research which can augment the purposefulness of this research study.
6.2 Findings
This section synthesizes the findings to answer the study‟s two research questions.
The first research question the study addressed was:
1. Does SHRM in New Zealand organizations contain elements of OPD-SHRM?
The second and fourth objectives of the research led to the answer to this research
question. As the second objective of the research, this study has utilized a quantitative
approach to measure the extent of the presence of OPD elements in New Zealand SHRM (see
Section 5.2.5). In Section 5.2.5, all the responses on all OPD elements have been collated and
averaged on a uniform scale to measure the extent of the presence of OPD elements. The
quantitative analysis thus shows an extent of 65% presence of OPD elements in the New
Zealand organizations‟ SHRM practices. As the fourth research objective, SHRM in New
Zealand organizations was contrasted with the OPD model from the interview data (see
Section 4.3). The qualitative data, detailed in Section 4.3 of Chapter 4, presents individual
responses of HR managers to question regarding their organizations‟ SHRM processes. The
HR managers‟ responses reveal that though organizations have some OPD elements in their
SHRM they differ in the implementation of those OPD elements in their SHRM. The
implementation is more crucial than the process itself as that is what determines successful
outcomes from the process.

117
Similar practice different implementation
SHRM in New Zealand organizations has certain practices in commonality with the
OPD-SHRM framework. However, they differ in their implementations. For instance, in both
the methodologies, „rewarding‟ is one way of motivating employees. (See collated responses
of HR managers in Section 4.3 to Question no. 6, “What good or bad feelings do employees
have about the organization which could influence their performance”?) In SHRM in New
Zealand organizations, the employee is rewarded based on the achievement of KPIs. The
emphasis is on KPIs, whereas in an OPD-SHRM environment, rewarding is part of the
celebration of an employee‟s success with the emphasis on the employee‟s success as a
consequence of him/her being disciplined and clear. Another difference is in the timing of the
reward. As mentioned in Section 2.6, the timing when rewarding is very crucial in OPD-
SHRM and has to be such that it forms the basis for reinforcing a cycle of effort and reward
whereas in New Zealand organizations‟ SHRM, no specific significance for timing of
rewarding has been observed.
Another commonality found is that both the systems, SHRM in New Zealand
organizations and OPD-SHRM, try to achieve focused employees towards their goals. The
majority of New Zealand organizations have a goal setting system which is reviewed bi-
yearly or yearly. The employees set the goals (or KPIs) for themselves in accordance with
their managers. The manager reviews the employees‟ goals during the assessment time which
is normally six months or a year (see Section 4.3; Question no. 1: Are employees clear on
their KPIs?). However in an OPD-SHRM framework (as mentioned in Section 2.6 under the
heading, “The key psychological aspect of OPD-SHRM”), the team leader has a duty to
constantly remind the employees of their goals (or ideal actions) thereby maintaining the
goals always being at the top of the mind of the employee.
Both the systems of HRM, SHRM and OPD-SHRM have approaches to ensure
employees‟ commitment. In SHRM in New Zealand organizations, motivation is the main
driving strategy for imparting commitment in employees towards successful results. In
Section 4.3, page 69, in response to Question no. 8: “What approach do you use to motivate
employees to improve their outputs”?, it is evident from the responses of HR managers that
the common practices in New Zealand organizations for motivating employees are to
distribute bonuses, incentives and also commissions on sales to the employees. Some
organizations even offer wellness programs and other benefits like health insurance. On the

118
other hand, the OPD-SHRM framework specifies a very direct approach to employees‟
commitment. In the very first place, as part of the joining formalities, the employee is
explicitly asked to sign an agreement for their commitment to be successful. On the basis of
this agreement, their sign off is sought for their commitment in full delivery of ideal actions
relevant to their role (see Section 2.6).
The second research question, which this research study sought to answer, is:
2. Is the OPD-SHRM model better than existing Human Resource Management
practices?
The first, second and third research objectives form the basis for answering the second
research question.
The research results are in favor of OPD-SHRM. The first and second research
objectives to measure SHRM effectiveness and measure the extent of OPD elements led to
the result which clearly shows a positive correlation between OPD-SHRM elements and
SHRM effectiveness. Table 13: Pearson Correlation Coefficient Matrix in Section 5.2.1
illustrates a medium to high correlation between OPD-SHRM elements and SHRM
effectiveness. Nearly 35% of the combinations of OPD-SHRM elements and SHRM
effectiveness variables are correlated from medium to high range.
The analysis with multiple regression technique in Section 5.2.3 predicts an increase
in OPD-SHRM elements with an increase in SHRM efficiency. The quantitative analysis in
Section 5.2.3 indicates that a 12% increase in employee performance is predicted with the
implementation of OPD theory in the SHRM of New Zealand organizations. This result also
conforms to the results obtained about the behavior of respondents in hypothetical OPD-
SHRM scenarios. The third research objective was to assess the conformity of employees‟
behavior with the OPD environment. The analysis in Section 5.2.4 measures the employees‟
behavior in an OPD-SHRM scenario, where employees have expressed an expectation of
better outcomes to an extent of 87.27%.
SHRM in New Zealand is, however, continuously evolving. The fourth objective to
interview HR managers revealed an interesting phenomenon in New Zealand organizations.
A spontaneous transitioning is observed in the SHRM in New Zealand organizations towards
practices which OPD theory already emphasizes. The practices of yearly goal (or KPI)

119
settings are now being considered to be conducted more frequently. One organization
reported considering changing it to as frequently as monthly (see Section 4.3; Question
number 1). A high need for more and more employees-manager communication is being felt
(see Section 4.3; Question nos. 1, 3 and 14). Another transition observed is that the emphasis
is no longer just on the KPIs but now there is a shift towards considering how KPIs are being
achieved (see Section 4.3, Question nos. 3 and 5). The shift towards how to achieve the KPIs
is analogous to the emphasis on ideal actions to achieve the KPIs in an OPD-SHRM
environment. Apparently these transitions seem related to characteristic attributes already
present in the backdrop of OPD-SHRM.
Besides the answers to the research questions, this research study also reveals a
deficiency in SHRM. SHRM in New Zealand organizations lacks tools to assess its
effectiveness in some aspects. In the qualitative study of this research many HR personnel
have been found to be unsure on various interview questions. Section 4.3 presents the
qualitative data with bar graphs to illustrate the percentage of HR managers responding with
„Yes‟, „No‟ and „Maybe‟ for each interview question. The HR personnel expressed their
inability to answer some crucial questions about their SHRM such as whether they know 1)
whether employees are clear on ideal actions to achieve their KPIs, 2) whether employees are
inclined to look to their managers for execution of their roles, 3) whether employees are
getting sufficient support and guidance from their managers and 4) whether business
processes are effective enough in assisting the employees to do a good job. These were the
questions where the HR personnel had to choose among „Yes‟, „No‟, and „Maybe‟. The
majority of HR personnel responded with „Maybe‟ to the above mentioned questions. In all,
23% of answers are „Maybe‟. Although this is not a large number, it is significant enough to
imply the lack of sufficient tools for measuring various aspects of SHRM in the organization.
Lack of assessment tools has already claimed by many theorists, and this research study bares
the same. HR personnel lack tools that enable them to measure the efficacy of different HR
processes by accurately measuring the outcomes.
6.3 Limitations of the research
Due to the limited nature of this research study (being 90 credits only), the survey
question does not represent an exhaustive list of all the parameters for evaluating SHRM
efficiency and OPD-SHRM elements. Thus not all aspects of SHRM and OPD-SHRM could

120
be covered in assessing SHRM in New Zealand organizations and not every aspect of the
New Zealand economy was addressed either.
This study like any research study depends upon the truthfulness of the respondents.
As the survey and interviews involved questions regarding the employees, HR and its
organization‟s effectiveness in different aspects, participants could have been tempted to
present a falsely good image about themselves and the organization they belong to. The
influence of socially desirable bias in this research study is thus not ruled out.
The study involves multiple regression statistical techniques to investigate relations
between OPD-SHRM elements and SHRM outcome. A multiple regression technique is
based on assumptions of the nature of data types of the variables and relationships between
the dependent and independent variables. This study however lacks any analysis of
appropriateness of the data used with this statistical technique for this research study. Shalev
(2007) says, “even though technical means are available to deal with many of the limitations
of MR (Multiple Regression), these solutions are either unconvincing or else require such
advanced technical skills that they offer questionable returns on scholarly investment” (p.
261). Application of Multiple Regression and Correlation (MRC) technique with more
sophistication could guarantee more accuracy in results but with additional costs invested.
Assessing the various assumptions like linearity, homoscedasticity and multicollinearity
requires a large sample size and a considerable amount of time for careful selection of sample
data.
The results of this research study should therefore take into account the limitation of
MRC as a statistical method in analysis of social science or psychological human behavior
and accordingly be used for application or contrasting to practical scenarios.
This research study only covers eleven Auckland based organizations which are
mainly in the service sector. The sample size included 55 employees and 11 HR personnel.
As mentioned in the research methodology, the sampling is a convenience sampling and
organizations which were geographically easy to reach and interested in participation were
selected in the sample for this research study. The sample size selected is too small to be truly
representative of all New Zealand organizations. It will require a larger study with a bigger
sample size and participation of organizations from varied geographical locations and
industries to yield a result for more accurate representation of all New Zealand organizations.

121
Also as the study is limited to New Zealand organizations, a larger research study
could cover organizations across different countries and cultures. Such a study will yield
results which would help to interpret whether or not the OPD theory works consistently and
neutrally regardless of type of organization, country and culture. The result thus obtained will
provide a more accurate answer to the second research question.
6.4 Recommendation for future work
The result of this research study is based on data collected from two groups, HR
personnel and employees. OPD theory success mainly depends upon the team
leaders/managers. Although employees separately can be analyzed as in this research study
for prediction of their behavior in OPD-SHRM, opinions of team leaders can bring out useful
information. A team leader is required to identify factors and execute models which influence
the people most and help him/her achieve greatest team performance (Nel & Little, 2010). A
team leader is thus in a better position and a better analyst to see drawbacks in the SHRM of
the organization and can contrast it with the OPD theory to tell whether or not OPD theory
would be useful in mitigating those drawbacks. Surveying team leaders could add significant
value to the research.
This research study is a cross sectional study. The impact of OPD theory could be
more prominently observed in a longitudinal study wherein OPD theory could be
implemented practically within a team of a reasonable size, being about 5-10 employees. The
researcher would need to educate the team leader/ manager of the team and help him or her
implement the OPD theory within the team. The study could be carried on for 3-5 months or
till 1-2 projects are delivered. The team could be observed on performance, quality of
delivery, satisfaction levels and other parameters of HR outcomes with respect to both the
team members and the team leader. The longitudinal practical study would enable researchers
to better assess the effect of OPD theory in contrast to the organization‟s SHRM. Did
managers and team leaders experience more control with this new approach? Both team
leaders and team members could be surveyed and interviewed. Having experienced the actual
OPD environment, the team leader and team as well could better provide an opinion on the
new style of work culture in comparison to their traditional SHRM.
This research study did not provide much literature on the Hawthorne experiments
neither did it explain the theory of leadership principles which forms the basis for the OPD

122
theory as it falls outside the scope of this research project. The study mainly focuses on the
literature on the HR role in strategy in organizations‟ SHRM. The OPD theory is contrasted
with SHRM as an efficient approach in linking strategy with people and simultaneously being
more constructive to the employees as well. The qualitative study of this research revealed
some issues and challenges in todays‟ SHRM that HR managers face. This study, however,
only shows an overall influence of OPD theory in organizations‟ SHRM but not the
individualistic impact of OPD theory on issues in today‟s SHRM. A broader study is
therefore recommended to explore OPD theory by examining its underlying principles of
leadership and perhaps the Hawthorne experiments and analyze whether or not OPD theory
addresses today‟s issues of SHRM and can mitigate their impacts. This will help understand
the scope of OPD theory in an HRM context in a broader sense and also uncover areas which
still remain to be tapped in order to have an all rounded system of HRM.
6.5 Overall Conclusion
Ever since the evolution of SHRM, HR theorists have doubted the role of HR in
strategy and seeking alignment of peoples‟ behavior with the strategy. HR practitioners have
been struggling to get it right with the existing processes of traditional SHRM. OPD-SHRM
is seen emerging as a solution to the problem. This research study strengthens the validity of
OPD theory in organizations‟ SHRM by theoretically testing for a link between SHRM
outcomes and OPD elements in organizations‟ SHRM. It is evident from the results of this
research study that the presence of a higher concentration of OPD elements in an
organization‟s SHRM relates to a better result and thereby implies the capability of the OPD
theory in enabling HR to link people with strategy in an efficient manner for greater results.
This research study will be helpful in strengthening the confidence of the HR
practitioner for the trial or adoption of the OPD model. Although the explanations for an
OPD model are rooted in the Hawthorne experiments and the leadership question, “How does
a leader achieve greatest staff performance?” here its validity is strengthened via results
reached from within the existing SHRM with which the HR practitioners are quite familiar.
This study thus provides another perspective to help HR practitioners to appreciate the
policies and procedures contained in the OPD-SHRM model, in order to enhance an
organization‟s performance of its most important asset, namely its human capital.

123
Bibliography
Alcazar, F. M., Fernandez, P. M. R., & Gardey, G. S. (2005). Researching on SHRM: An
analysis of the debate over the role played by human resources in firm success.
Management Revue, 16(2), 213–241.
Barney, J. (1991). Firm Resources and Sustained Competitive Advantage. Journal of
Management, 17(1), 99–120. doi:10.1177/014920639101700108
Bhattacherjee, A. (2012). Social Science Research: Principles, Methods, and Practices (2nd
ed.). Tampa, Florida: Anol Bhattacherjee.
Boxall, P. F., & Purcell, J. (2003). Strategy and Human Resource Management. Houndmills,
Basingstoke, Hampshire ; New York: Palgrave Macmillan. Retrieved from
http://books.google.com.au/books?id=AWNpQgAACAAJ
Boxall, P., & Purcell, J. (2011). Strategy and Human Resource Management: Third Edition.
Palgrave Macmillan. Retrieved from
http://books.google.com.au/books?id=mtbbbwAACAAJ
Bratton, J. (2007). Strategic human resource management. Human Resource Management
Icinde, Der: John Bratton,-Gold, Jeffrey, London: Palgrave Macmillan, London, 37–71.
Bryson, J., & Ryan, R. (2012). Human resource management in the workplace. New Zealand:
Pearson Education New Zealand Limited.
Carraresi, L., Mamaqi, X., Albisu, L. M., & Banterle, A. (2012). Strategic capabilities and
performance: an application of resource-based view in Italian food SMEs.
Proceedings in Food System Dynamics, 186–209.
Chaudhary, D. K. K. S., Dr Arun Kumar, Dr Alka. (2009). Statistics in Management Studies
(10th ed.). Meerut, India: Krishna Prakashan Media.

124
Cohen, J., Cohen, P., West, S. G., & Aiken, L. S. (2013). Applied Multiple
Regression/Correlation Analysis for the Behavioral Sciences (3rd ed.). London, UK:
Routledge.
Collis, J., & Hussey, R. (2013). Business Research: A Practical Guide for Undergraduate and
Postgraduate Students (4th ed.). Houndmills, Basingstoke, Hampshire: Palgrave
Macmillan. Retrieved from http://books.google.co.nz/books?id=O3zUnQEACAAJ
Conger, J. A., & Kanungo, R. N. (1988). Charismatic leadership: The elusive factor in
organizational effectiveness. San Francisco: Jossey-Bass.
Covey, S. R. (2013). The 7 Habits of Highly Effective People: Powerful Lessons in Personal
Change. New York, NY 10020: Simon and Schuster.
Creswell, J. W., & Clark, V. L. P. (2007). Designing and conducting mixed methods research.
Creswell, J. W., & Plano Clark, V. L. (2007). Designing and conducting mixed methods
research. Thousand Oaks, Calif: SAGE Publications.
Crook, T. R., Ketchen, D. J., Combs, J. G., & Todd, S. Y. (2008). Strategic resources and
performance: a meta-analysis. Strategic Management Journal, 29(11), 1141–1154.
doi:10.1002/smj.703
Darmawan, I., & Keeves, J. P. (2006). Suppressor variables and multilevel mixture modelling.
Retrieved from http://dspace2.flinders.edu.au/xmlui/handle/2328/3134
Delahaye, B. L. (2005). Human Resource Development: Adult Learning and Knowledge
Management. Milton, Qld.: John Wiley & Sons Australia, Limited. Retrieved from
http://books.google.co.nz/books?id=NUw0kgEACAAJ
Delery, J. E., & Doty, D. H. (1996). Modes of Theorizing in Strategic Human Resource
Management: Tests of Universalistic, Contingency, and Configurational Performance

125
Predictions. The Academy of Management Journal, 39(4), 802–835.
doi:10.2307/256713
Dewberry, C. (2004). Statistical Methods for Organizational Research: Theory and Practice.
Milton Park, Abingdon, Oxon OX14 - 4RN: Psychology Press.
Du Plessis, A. J. (2006). Human Resource’s Role in Future Priorities and Current Capabilities
in New Zealand Organisations: Some Research Findings, 69–78.
Du Plessis, A. J., Paine, M. S., & Botha, C. J. (2012). The role of human resource practitioners
maintaining sustainability in organisations: some empirical evidence of expectations,
challenges and trends. Contemporary Business Studies. Retrieved from
http://www.researchgate.net/publication/224952514_Is_Outward_Bound_Training
_(OBT)_An_Effective_Tool_for_Human_Resource_Development_(HRD)_A_Case_Stu
dy_from_Sri_Lanka/file/e0b4952da65b828931.pdf#page=16
Explorable.com. (2009a, May 17). Non-Probability Sampling. Retrieved November 19, 2014,
from https://explorable.com/non-probability-sampling
Explorable.com. (2009b, October 10). Probability Sampling and Randomization. Retrieved
November 19, 2014, from https://explorable.com/probability-sampling
Gilbertson, D. (1984). Personnel’s path to organisational effectiveness. In Proceedings of the
National Conference of the New Zealand Institute of Personnel Management,
October (pp. 48–51).
Graetz, F., Rimmer, M., Lawrence, A., & Smith, A. (2006). Managing organisational change.
Milton, Qld.: John Wiley & Sons Australia.
Graham, B. (2009). Middle School Teacher and Parent Perceptions of Parental Involvement.
ProQuest.
126
Guest, D. E. (1997). Human resource management and performance: a review and research
agenda. International Journal of Human Resource Management, 8(3), 263–276.
Hamel, G., & Prahalad, C. K. (1993). Strategy as Stretch and Leverage. Harvard Business
School Reprint. Retrieved from http://books.google.co.nz/books?id=Z0kJRAAACAAJ
Hammer, M., & Champy, J. (2009). Reengineering the Corporation: A Manifesto for Business
Revolution. NY, USA: HarperCollins.
Harris, L. C., & Ogbonna, E. (2001). Strategic human resource management, market
orientation, and organizational performance. Journal of Business Research, 51(2),
157–166.
Hartel, C. E. J., & Fujimoto, Y. (2010). Human resource management (2nd ed.). Frenchs
Forest, N.S.W.: Pearson Australia.
Hatcher, L. (2003). Step-by-Step Basic Statistics Using SAS: Student Guide. SAS Institute.
Herzberg, F. (1986). One more time: how do you motivate employees? New York: The
Leader Manager, 433–448.
Hill, C. W. L., & Jones, G. R. (2001). Strategic Management Theory: An Integrated Approach.
Houghton Mifflin. Retrieved from
http://books.google.co.nz/books?id=XWWHGAAACAAJ
Holbeche, L. (2009). Aligning Human Resources and Business Strategy. Taylor & Francis.
Retrieved from http://books.google.co.nz/books?id=aLTFENGTpQEC
Hoskisson, R. E., Hitt, M. A., Wan, W. P., & Yiu, D. (1999). Theory and research in strategic
management: Swings of a pendulum. Journal of Management, 25(3), 417–456.
Hultsch, D. F., MacDonald, S. W., Hunter, M. A., Maitland, S. B., & Dixon, R. A. (2002).
Sampling and generalisability in developmental research: Comparison of random and

127
convenience samples of older adults. International Journal of Behavioral
Development, 26(4), 345–359.
Huselid, M. A., Jackson, S. E., & Schuler, R. S. (1997). Technical and strategic human
resources management effectiveness as determinants of firm performance.
Academy of Management Journal, 40(1), 171–188.
Jackson, W. (2009, November). myth busting: destoying the work-life balance myth and how
to have more fun at work. Human Resources, 14(4), 28–29.
Joerres, J. A. (2006). Engaging the total workforce. Human Resources, 11(2), 2–7.
Kaplan, R., & Norton, D. P. (1996). The Balanced Scorecard: Translating Strategy into Action.
Harvard Business Review Press. Retrieved from
http://books.google.com.au/books?id=0tjRLqFH830C
Kaye, L. (1999). Strategic human resources management in Australia: The human cost.
International Journal of Manpower, 20(8), 577–587.
Kearns, P. (2012). HR Strategy: Business Focused Individually Centred. Taylor & Francis.
Retrieved from http://books.google.co.nz/books?id=VqGmwGM24ioC
Konig, R. (2003). Mergers & Acquisitions: Successful in managing integration processes.
diplom.de.
Kotter, J. P. (1996). Leading change. USA: Harvard Business Press.
Larsen, H. H., & Brewster, C. (2003). Line management responsibility for HRM: what is
happening in Europe? Employee Relations, 25(3), 228–244.
Lengnick-Hall, M. L., Lengnick-Hall, C. A., Andrade, L. S., & Drake, B. (2009). Strategic human
resource management: The evolution of the field. Human Resource Management
Review, 19(2), 64–85.

128
Little, G. (2013). OPD theory: a new way of thinking about HR. Employment Today, (July
2013), 31–34.
Little, G. (n.d.). Advancing impact and status of HR: Applying technology that ensures HR the
driver of strategy. Retrieved from
http://www.opdcoach.com/Advancing_impact_and_status_of_HR.pdf
Little, G., & Nel, P. S. (2008). 21st Century HR: An Integrated Model to Achieve Organisation
Objectives. In 22nd Annual ANZAM Conference, Held at Auckland New Zealand (pp.
2–5). Retrieved from http://svr1.opdcoach.com/article1.pdf
Little, G. R. (2011). The role of human resources management in the modern organization.
Auckland, N.Z.: Self Help Guides.
Lund Research Ltd. (2013). How to perform a Multiple Regression Analysis in SPSS Statistics
| Laerd Statistics. Retrieved November 28, 2014, from
https://statistics.laerd.com/spss-tutorials/multiple-regression-using-spss-
statistics.php
Macky, K. (2008). Managing human resources in New Zealand (2nd ed.). Australia: McGraw-
Hill.
Miller, V. D., & Gordon, M. E. (2014). Meeting the Challenges of Human Resource
Management: A Communications Perspective. Routledge.
Ministry of Economic Development New Zealand. (2011). SMEs in New Zealand: Structure
and Dynamics 2011. Retrieved from http://www.med.govt.nz/business/business-
growth-internationalisation/pdf-docs-library/small-and-medium-sized-
enterprises/structure-and-dynamics-2011.pdf
Monks, K., & McMackin, J. (2001). Designing and aligning an HR system. Human Resource
Management Journal, 11(2), 57–72.

129
Nel, P. (2010). Retrieved from
http://www.opdcoach.com/testimonials/Professorial%20testimonial.pdf
Nel, P., de Wet Fourie, L., & du Plessis, A. (2013). A LONGITUDINAL COMPARISON OF
ASPECTS OF DIVERSITY IN TWO COMMONWEALTH COUNTRIES. Asia Pacific Journal
of Business and Management, 4(1), 14–26.
Nel, P., & Little, G. (2010). Sustainable leadership: The fundamental solution to lasting
superior staff performance.
Nel, P., & Little, G. (2014). The Future of Organizational Design. Retrieved from
http://www.wbiworldconpro.com/uploads/new-zealand-conference-
2014/management/1392796500_428-Pieter.pdf
Nel, P., & Simpson, K. (2013). Small business management capability development in the
home furnishings industry. New Zealand Journal of Applied Business Research, 11(1),
37.
OPD International Limited. (2014a). OPD Articles - What makes OPD unique and different?
Retrieved November 27, 2014, from http://www.opdcoach.com/article6.php
OPD International Limited. (2014b). Strategic Human Resource Management System for
improving profits in business by improved alignment of staff behavior with strategy
and goals. Retrieved November 27, 2014, from http://www.opdcoach.com/
Punch, K. F. (2013). Introduction to Social Research: Quantitative and Qualitative
Approaches. SAGE.
Ravand, D. M. (2014). Human Resource Professionalism:A Panacea for Public Organizations.
Author House.
Ridenour, C. S., & Newman, I. (2008). Mixed Methods Research: Exploring the Interactive
Continuum. SIU Press.

130
Rogers, E. W., & Wright, P. M. (1998). Measuring organizational performance in strategic
human resource management: Problems, prospects and performance information
markets. Human Resource Management Review, 8(3), 311–331.
Russo, R. (2004). Statistics for the Behavioural Sciences: An Introduction. Psychology Press.
Särndal, C.-E., Swensson, B., & Wretman, J. (2003). Model Assisted Survey Sampling.
Springer Science & Business Media.
Shalev, M. (2007). Limits and alternatives to multiple regression in comparative research.
Comparative Social Research, 24, 261–308. doi:10.1016/S0195-6310(06)24006-7
Sirmon, D. G., Hitt, M. A., & Ireland, R. D. (2007). Managing firm resources in dynamic
environments to create value: Looking inside the black box. Academy of
Management Review, 32(1), 273–292.
Society for Human Resource Management (U.S.). (2006). The essentials of corporate
communications and public relations. Boston, Mass. : Alexandria, Va: Harvard
Business School Press ; Society for Human Resource Management.
StatPac Inc. (2014). Survey Sampling Methods. Retrieved November 19, 2014, from
https://www.statpac.com/surveys/sampling.htm
SurveyMonkey Inc. (2014, December 10). Privacy Policy | SurveyMonkey. Retrieved
November 19, 2014, from https://www.surveymonkey.com/mp/policy/privacy-
policy/
Tariman, J. D., Berry, D. L., Cochrane, B., Doorenbos, A., & Schepp, K. (2010). Preferred and
actual participation roles during health care decision making in persons with cancer:
a systematic review. Annals of Oncology, 21(6), 1145–1151.
doi:10.1093/annonc/mdp534

131
Tashakkori, A., & Teddlie, C. (2003). Handbook of mixed methods in social & behavioral
research.
Teddlie, C., & Tashakkori, A. (2009). Foundations of mixed methods research: integrating
quantitative and qualitative approaches in the social and behavioral sciences. Los
Angeles: SAGE.
Tichy, N. M., & Devanna, M. A. (1986). The transformational leader. Training & Development
Journal.
Tuttle-Yoder, J. A., & Fraser-Nobbe, S. A. (1996). Stat! Medical Office Emergency Manual.
Cengage Learning.
Ulrich, D., Younger, J., & Brockbank, W. (2008). The twenty‐first‐century HR organization.
Human Resource Management, 47(4), 829–850.
Ulrich, D., Younger, J., Brockbank, W., & Ulrich, M. (2012). HR from the outside in. New York:
McGraw.
Venkatesh, V., Brown, S. A., & Bala, H. (2013). Bridging the qualitative-quantitative divide:
Guidelines for conducting mixed methods research in information systems. Mis
Quarterly, 37(1), 21–54.
Vetter, N., & Matthews, I. (1999). Epidemiology and public health medicine.
Walsham, G. (2006). Doing interpretive research. European Journal of Information Systems,
15(3), 320–330.
WebFinance Inc. (2014). What is convenience sampling? definition and meaning. Retrieved
November 19, 2014, from
http://www.businessdictionary.com/definition/convenience-
sampling.html#ixzz380kI1mIz

132
Weinberg, S. L., & Abramowitz, S. K. (2002). Data Analysis for the Behavioral Sciences Using
SPSS. Cambridge University Press.
Wright, P. M., Dunford, B. B., & Snell, S. A. (2001). Human resources and the resource based
view of the firm. Journal of Management, 27(6), 701–721.

133
Appendix 1: Research Information Sheet
Information for participants
Research Project Title: Analysis of HR Policies and Procedures and its impact on performance
of employees
Synopsis of project:
The role of HR in an organization is critical as they need to continuously monitor and assess policies to
evaluate how effective they are in providing employees with much needed work-life balance. The
culture of an organization does not remain the same over time. A set of policies that might have been
useful in the past can no longer stay the same and be effective in current times. This introduces the role
of an HR practitioner. They are required to carefully analyse the current policies in an organization that
can simultaneously be in the best interest of the organization and the employees. The research with the
help of opinions gathered from employees and HR personnel will attempt to uncover possible
limitations of current HR model in organizations and will try to identify how the OPD-SHRM (Ongoing
Professional Development – Strategic Human Resource Management) model can minimize those
limitations.
What we are doing:
We are executing research on current HR models in organizations. How the OPD-SHRM model, a new
scientific approach of HR practices, could bring better results in comparison to existing HR model in
organizations.
What it will mean for you:
1) You may be asked to fill in a questionnaire regarding your organization‟s HR policies and
practices and your opinion about work culture/appraisal/performance/rewards.
2) You may be interviewed one on one by the researcher.
Your name and information that may identify you will be kept completely confidential. All information
collected from you will be stored on a password protected and only available to the researchers.

134
Please contact us if you need more information about the project. At any time if you have any concerns
about the research project you can contact our supervisor:
My supervisor is Prof. Pieter Nel, phone 815 4321 ext.7026 or email [email protected]
UREC REGISTRATION NUMBER: 2014-1006
This study has been approved by the UNITEC Research Ethics Committee from 20.3.14 to
20.3.15. If you have any complaints or reservations about the ethical conduct of this research, you
may contact the Committee through the UREC Secretary (ph: 09 815-4321 ext 6162. Any issues
you raise will be treated in confidence and investigated fully, and you will be informed of the
outcome.

135
Appendix 2: Participants’ Consent Form
Participant Consent Form
Research Project Title: Analysis of HR Policies and Procedures and its impact on
performance of employees
I have had the research project explained to me and I have read and understand the information
sheet given to me.
I understand that I don't have to be part of this if I don't want to and I may withdraw at any time prior to
the completion of the research project.
I understand that everything I say is confidential and none of the information I give will identify me and
that the only persons who will know what I have said will be the researchers and their supervisor. I also
understand that all the information that I give will be stored securely on a computer at Unitec for a
period of 5 years.
I understand that my discussion with the researcher will be taped and transcribed.
I understand that I can see the finished research document.
I have had time to consider everything and I give my consent to be a part of this project.
Participant Signature: ………………………….. Date: ……………………………
Participant Name: ………………………………………………………………………..
Project Researcher: ………………………………. Date: ……………………………
UREC REGISTRATION NUMBER: 2014-1006
This study has been approved by the UNITEC Research Ethics Committee from 20.3.14 to
20.3.15. If you have any complaints or reservations about the ethical conduct of this research, you
may contact the Committee through the UREC Secretary (ph: 09 815-4321 ext 6162). Any issues
you raise will be treated in confidence and investigated fully, and you will be informed of the
outcome.
136
Appendix 3: Organization Consent Form
Organisational Consent
I, ___________________ of _________________ give consent for Ms. Parwinder Kaur
Sabarwal to undertake research in this organisation as discussed with the researcher.
The consent is subject to the research ethics application no 2014-1006 by the Unitec Research
Ethics Committee. A copy of the approval letter will be forwarded to the organisation if
requested.
UREC REGISTRATION NUMBER: 2014-1006
This study has been approved by the UNITEC Research Ethics Committee from 20.3.14
to 20.3.15. If you have any complaints or reservations about the ethical conduct of this
research, you may contact the Committee through the UREC Secretary (ph: 09 815-
4321 ext 6162. Any issues you raise will be treated in confidence and investigated fully,
and you will be informed of the outcome.
Signature:
Date:
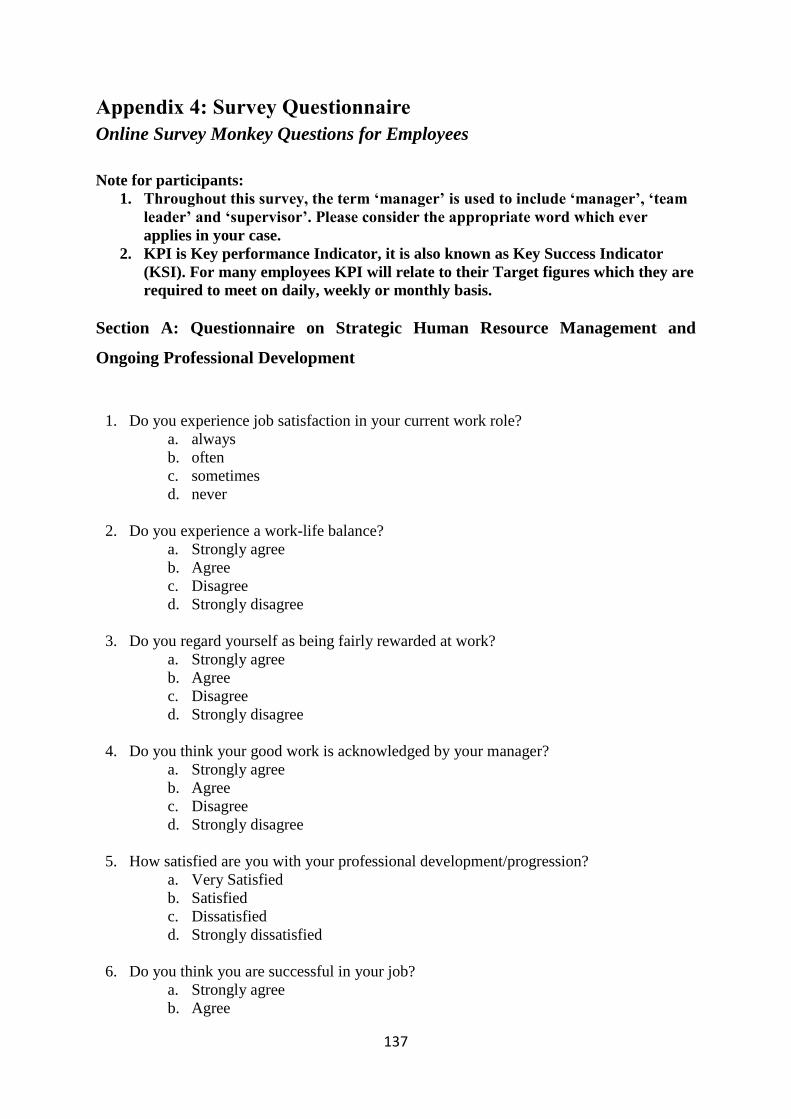
137
Appendix 4: Survey Questionnaire
Online Survey Monkey Questions for Employees
Note for participants:
1. Throughout this survey, the term ‘manager’ is used to include ‘manager’, ‘team
leader’ and ‘supervisor’. Please consider the appropriate word which ever
applies in your case.
2. KPI is Key performance Indicator, it is also known as Key Success Indicator
(KSI). For many employees KPI will relate to their Target figures which they are
required to meet on daily, weekly or monthly basis.
Section A: Questionnaire on Strategic Human Resource Management and
Ongoing Professional Development
1. Do you experience job satisfaction in your current work role?
a. always
b. often
c. sometimes
d. never
2. Do you experience a work-life balance?
a. Strongly agree
b. Agree
c. Disagree
d. Strongly disagree
3. Do you regard yourself as being fairly rewarded at work?
a. Strongly agree
b. Agree
c. Disagree
d. Strongly disagree
4. Do you think your good work is acknowledged by your manager?
a. Strongly agree
b. Agree
c. Disagree
d. Strongly disagree
5. How satisfied are you with your professional development/progression?
a. Very Satisfied
b. Satisfied
c. Dissatisfied
d. Strongly dissatisfied
6. Do you think you are successful in your job?
a. Strongly agree
b. Agree

138
c. Disagree
d. Strongly disagree
7. How well does your supervisor rate your performance in your current role? (Please
specify in %)
8. How often do you feel the supervisor underrates you? (Please specify in %)
9. How often do you feel the supervisor overrates you? (Please specify in %)
10. How often do you feel your supervisor rates you at the level you rate yourself? (Please
specify in %)
11. Do you know how to be successful in your current role?
a. Yes
b. No
c. Maybe
12. Are the key performance activities that are relevant to your role clear to you for you to
be successful in your role?
a. Yes
b. No
c. Maybe
13. Do you know your “key performance indicators” (KPI‟s)?
a. Yes
b. No
c. Maybe
14. Is your performance measured in terms of KPI achieved?
a. Yes
b. No
c. Maybe
15. How does your manager measure your performance?
a. By analyzing your efforts you put in.
b. By measuring your KPI achieved.
c. Using both methods.
16. What does your manager emphasize in your job?
a. On process to achieve your KPI.
b. On achieving your KPI anyhow.
c. Both of above.
17. How often does your manager provide you mentoring and guidance?
a. Weekly
b. Fortnightly
c. Monthly
d. Any period longer than a month

139
18. Do you think the expectations of your manager from you are realistic?
a. Yes, they are realistic
b. To some extent they are realistic
c. Mostly they are not realistic
d. They are not realistic at all and practically not possible.
19. Who determines your actions for you to be successful in your role?
a. Your manager on basis of your opinion.
b. You alone
c. Your manager alone
20. Does your manager give you „on the spot‟ social rewarding?
a. Often
b. Sometimes
c. Seldom
d. Never
21. How often does your supervisor do one on one meeting with you?
a. Weekly
b. Fortnightly
c. Monthly
d. Others _____________
22. If your success in an assignment is celebrated and acknowledged, does this motivate and
encourage you to be successful in your next assignment?
a. Yes, it strongly motivates me to do even better in next assignment
b. Yes, it motivates me
c. It sometimes motivates me.
d. It does not make any difference
23. Does periodic one on one meeting with the manager helps you to improve your
performance?
a. Strongly Agree
b. Agree
c. Disagree
d. Strongly disagree
24. Do you think it is important for you to be successful at work?
a. Strongly Agree
b. Agree
c. Disagree
d. Strongly disagree
25. You deliver an assignment after working rigorously for 10 days. You feel satisfied
having delivered the assignment because?
a. You delivered it with 100% success with all help and support from your
manager. One more laurel to your cap.

140
b. You delivered it with let‟s say 70% of success but at least you were not
bothered by the manager and was left on your own to work on the assignment.
c. If none of above. Please comment : _________________________
26. Do you want your performance to be measured in terms of KPI value?
a. No, I expect my manager to equally consider my efforts, discipline and
dedication towards my attempt to achieve the KPI.
b. Yes, manager concern should only be the KPI and not how I achieve them.
c. Not sure
Section B: Background Information
27. What is your gender?
a. Male
b. Female
28. What is your age group?
a. 20-25
b. 26-31
c. 32-37
d. 38-43
e. 44-49
f. 50 and above
29. What is your level of education?
a. Secondary School
b. Higher Secondary
c. Bachelor or Diploma
d. PG Diploma
e. Master Degree
f. PhD
Note: The questions asked in the questionnaire are meant to evaluate the efficacy of
traditional HR policies implemented in organizations. To check whether the traditional
SHRM (Strategic Human Resource Management) implemented is lacking in addressing
SHRM objectives and can those be addressed by the new scientific Ongoing Professional
Development – Strategic Human Resource Management (OPD-SHRM) model.
The questions are built keeping in mind to directly know from the employees, supervisors
and managers, what they feel, to what degree different objectives of traditional SHRM are
achieved.
Employee Work-life Balance, Organization goal and motivation are like few most common
general objectives of an HR Strategy. There are direct questions to know if these common
general objectives are being achieved or not.

141
Also, questions have been designed to know if the „Strategic Human Resource Management‟
model is an „Ongoing Professional Development – Strategic Human Resource Management‟
model and if it is, then how effective „Ongoing Professional Development – Strategic Human
Resource Management‟ is addressing objectives which „Strategic Human Resource
Management‟ failed at doing effectively. The questions would put employees in a
hypothetical situation to predict their behavior and actions, had it been „Ongoing Professional
Development – Strategic Human Resource Management‟ model in their organization. This
would enable us to know if „Ongoing Professional Development – Strategic Human Resource
Management‟ model would bring out a better employee, better leader or a better manager in
them.
Thank You

142
Appendix 5: HR Interview Questions
Interview Questions for participants
[Note: Although the majority of questions are subjective, the researcher wishes to
know the participants’ comments on their choice made.]
1. Are employees clear on their KPIs?
a. Yes
b. No
c. Maybe
2. Are employees clear on the ideal actions to achieve those KPIs?
a. Yes
b. No
c. Maybe
3. Are employees inclined to execute ideal actions as their manager requested them to do
in order to achieve their KPIs?
a. Yes
b. No
c. Maybe
4. Do employees feel their managers are providing sufficient support and guidance for
them to achieve their KPIs?
a. Yes
b. No
c. Maybe
5. Do employees think the business processes assist them in doing a good job?
a. Yes
b. No
c. Maybe
6. What good or bad feelings do employees have about the organization which could
influence their performance?
7. What approach do you use to execute SHRM, for example OPD-SHRM?
8. What approach do you use to motivate employees to improve their outputs?
9. Are employees aware of organization goals?
a. Yes
b. No
c. Maybe

143
10. Do employees understand how they are helping the organization to achieve its goals
via their work role?
a. Yes
b. No
c. Maybe
11. Do employees have a positive attitude towards organizational goals?
a. Yes
b. No
c. Maybe
12. Are employees‟ professional development coupled to organizational goals?
a. Yes
b. No
c. Maybe
13. Are employees‟ professional developments coupled to organizational goals in helping
the organization achieving its goals?
a. Yes
b. No
c. Maybe
14. Does the organization‟s SHRM managers periodically access employee job
satisfaction and work-life balance records?
a. Yes
b. No
c. Maybe
15. Do employees undergo professional development while working in the organization?
a. Yes
b. No
c. Maybe
Note: The questions asked in the interviews are meant to evaluate the efficacy of traditional
HR policies implemented in the organization. To check whether the traditional „Strategic
Human Resource Management‟ SHRM implemented is lacking in addressing SHRM
objectives and can those be addressed by the new scientific OPD-SHRM (Ongoing
Professional Development – Strategic Human Resource Management) model.
Employees Work-life Balance, Organization goals and motivation are a few of the most
common general objectives of HR strategies. There are direct questions to reveal whether
these common general objectives are being achieved or not.

144
Appendix 6: SPSS Numerical Coding for Variable Values
Choices Numerical Equivalent
Always 4
Often 3
Sometimes 2
Never 1
Strongly Agree 4
Agree 3
Disagree 2
Strongly Disagree 1
Very Satisfied 4
Satisfied 3
Dissatisfied 2
Very Dissatisfied 1
Yes 3
No 1
Maybe 2
By analyzing your efforts you put in. 3
By measuring your KPI achieved. 1
Using both methods. 2
On process to achieve your KPI. 3
On achieving your KPI anyhow. 1
Both of the above. 2
Weekly 4
Fortnightly 3
Monthly 2
Any period longer than a month 1
Yes, they are realistic 4
To some extent they are realistic 3
Mostly they are not realistic 2
They are not realistic at all and practically not possible. 1
Your manager on basis of your opinion. 3
You alone 1
Your manager alone 2
Often 4
Sometimes 3
Seldom 2
Never 1
Yes, it strongly motivates me to do even better in next assignment 4
Yes, it motivates me 3
It sometimes motivates me. 2
It does not make any difference 1

145
You delivered it with 100% success with all help and support from your manager.
One more laurel to your cap. 3
You delivered it with let‟s say 70% of success but at least you were not bothered
by the manager and was left on your own to work on the assignment. 1
If none of above. (please specify) 2
No, I expect my manager to equally consider my efforts, discipline and dedication
towards my attempt to achieve the KPI. 3
Yes, manager concern should only be the KPI and not how I achieve them. 1
Not sure 2