Embed Size (px)
Citation preview

1
An African Power Development Company
General Update - July 2021

2
DISCLAIMER
This document, which is personal to the recipient, has been issued by Ncondezi Energy Limited (the “Company”). This document does notconstitute or form part of any offer or invitation to sell or issue, or any solicitation of any offer to purchase or subscribe for, any securitiesof the Company, nor shall any part of it nor the fact of its distribution form part of or be relied on in connection with any contract orinvestment decision relating thereto, nor does it constitute a recommendation regarding the securities of the Company. In particular, thisdocument and the information contained herein does not constitute an offer of securities for sale in the United States.
This document is being supplied to you solely for your information. The information in this document has been provided by the Companyor obtained from publicly available sources. No reliance may be placed for any purposes whatsoever on the information or opinionscontained in this document or on its completeness. No representation or warranty, express or implied, is given by or on behalf of theCompany or any of the Company’s directors, officers or employees or any other person as to the accuracy or completeness of theinformation or opinions contained in this document and no liability whatsoever is accepted by the Company or any of the Company’smembers, directors, officers or employees nor any other person for any loss howsoever arising, directly or indirectly, from any use of suchinformation or opinions or otherwise arising in connection therewith.
Nothing in this document or in the documents referred to in it should be considered as a profit forecast. Past performance of the Companyor its shares cannot be relied on as a guide to future performance.
Certain statements, beliefs and opinions in this document are forward-looking, which reflect the Company’s or, as appropriate, theCompany’s directors’ current expectations and projections about future events. By their nature, forward-looking statements involve anumber of risks, uncertainties and assumptions that could cause actual results or events to differ materially from those expressed orimplied by the forward-looking statements. These risks, uncertainties and assumptions could adversely affect the outcome and financialeffects of the plans and events described herein. Forward-looking statements contained in this document regarding past trends oractivities should not be taken as a representation that such trends or activities will continue in the future. The Company does notundertake any obligation to update or revise any forward-looking statements, whether as a result of new information, future events orotherwise, except as required by applicable regulation. You should not place undue reliance on forward-looking statements, which speakonly as of the date of this document.
This document has been prepared in compliance with English law and English courts will have exclusive jurisdiction over any disputesarising from or connected with this document.

3
INTRODUCTIONNcondezi is an emerging southern African power development company focused on providingcompetitive, reliable and accessible energy generation solutions
• Focused on two core energy sectors:
– Baseload power for the Mozambican grid
– Distributed (or on site generation) power for Commercial & Industrial (“C&I”) companies across thesouthern African region
• Ncondezi Project – Advanced development stage 300MW integrated power plant and coal mine
– 25 year offtake with Mozambique state power utility under negotiation
– China Machinery Engineering Corporation (“CMEC”) JDA partner
– US$1.1bn capex project
• Ncondezi Green Power – provides solar PV & storage solutions for the African C&I sector
– High growth sector
– Maiden project to generate first power in July 2021
– JV term sheet signed with leading South African (“SA”) player to form regional C&I renewable energyand battery storage champion
– Right to fund US$5.5m development pipeline secured with opportunity to increase by over 12x timesthrough proposed JV
– Exclusive opportunity to acquire operational solar PV and storage portfolio across 66 sites in SA
• Experienced management team & board with over 40 years experience of power project development inAfrica

4
Board of Directors
Michael HaworthNon Executive Chairman
• Founding Ncondezi investor in 2008• Senior Partner at Greenstone Resources, a private equity fund in the mining and metals sector• Previously Head of Mining and Metals Corporate Finance in London for JPMorgan
Hanno PengillyChief Executive Officer
• Led power project and mine development programmes• Joined March 2010
Scott FletcherNon Executive Director
• One of the UK’s leading entrepreneurs and received an MBE for services to business and community in the north of England as well as an honorary Doctorate in Business Administration
• Founded ANS Group in 1996, growing it to become a leading cloud services provider in the UK today• Mr Fletcher is also an active investor in smaller companies both private and public.
Aman SachdevaNon Executive Director
• President CEO of Synergy Consulting, a global infrastructure advisory and project finance company which has closed projects worth over US$12bn
• Clients include the World Bank as well as a number of state owned power utilities • 27 years’ experience in infrastructure industry, specialising in the energy sector
Corporate Information
Listing: AIM Market, London Stock Exchange (ticker NCCL)
Sector: Power development
Shares in issue: 370,714,119
Share price: GBp 2.75 (as at 9 July, 2021)
Market Cap: GBP 10.2m as of 9 July 2021
Nomad & Joint Broker: Liberum Capital
Joint Broker: Novum Securities
Shareholder Breakdown
Scott Fletcher17%
Africa Finance Corporation14%
Polenergia8%
Michael Haworth (Chairman)4%
Mr & Mrs Weatherhead4%
Free Float53%
CORPORATE OVERVIEW
5
NCONDEZI PROJECT OVERVIEW

6
Ncondezi Power Project
(300 MW)
Note: 1 Australasian Joint Ore Reserves Committee Code, 2Air dried basis Source: EDM
✓ 2x 150W units✓ CFB technology
300MW coal-fired power project
✓ Negotiations ongoing to exclusively supply Electricity of Mozambique (“EDM”)
25 year offtake contract
✓ 1.5Mtpa open pit mine✓ 4.0Bt of coal (JORC2 indicated and inferred resource)
Integrated coal mine
✓ Northern Grid Mozambique✓ Direct connections into South Africa and Zimbabwe✓ Potential expansion plans into Malawi and Zambia✓ Line route optimization underway
Region energy transmission hub
✓ Financial Close targeted for H1 2022✓ 36 month target construction
CoD target H2 2025
✓ US$1.1bn total capital cost✓ US$175m million average annualized EBIDTA✓ US$1.9bn net equity cash over life of Project✓ US$799m net equity cashflows to Ncondezi over life of
Project
Projected Project Economics
PROJECT SUMMARY
❶
❷
❸
❹
❺
❻

7
Project is in line with stated energy policy of Mozambique
• Universal energy access by 2030 through new generation projects
• Diversification of energy mix for greater energy security
• Coal generation a key potential baseload power supply option for Mozambique, particularly for theenergy transition period
One of the most advanced baseload power projects in Mozambique
• Permitting and approvals in place - Mining Concession, land use rights, ESIAs
• Formal tariff offer submitted to Electricity of Mozambique (“EDM”) – Mar 2020
• Submitted updated Project Feasibility Study and Electricity Market Study to EDM – Dec 2020
Significant support from China at all levels – Government & Financial Institutions
• Ncondezi Project identified as a key infrastructure project at the 2nd China-MozambiqueInternational Cooperation Summit – May 2019
• Joint Development Agreement (“JDA”) with CMEC (EPC and O&M Contractor) and GE (MainTechnology Provider) for co-development, construction and operation the Project – Jul 2019
• Indicative debt terms from Industrial and Commercial Bank of China (“ICBC”) – Dec 2019
• Letter of Interest from China Export & Credit Insurance Corporation (“Sinosure”) – Jan 2020
• Shareholders Agreement Term sheet confirming CMEC’s intention as lead investor for 60% of theequity investment at financial close – Aug 2020
Meeting the strictest emission requirements
• Plans to equip with state-of-the-art emissions controls technologies that will comply with the moststringent emission standards from the IFC and World Bank
JDA Partner & intended 60% lead
investor
Credit Support
Main Power Offtaker
KEY PARTNERS
PROJECT HIGHLIGHTS

8
KEY NCONDEZI PROJECT MILESTONES
Phase I
• Agree development programme with EDM and Mozambique Govt.
• EPC agreements signed with CMEC
Phase II
• Finalise project tariff
• Finalise Power Purchase Agreement with EDM
• Finalise Power Concession Agreement with Mozambique Govt.
Phase III• Financial Close

9

10Source: 1 EIA “Renewables 2020”. 2 Brookfield, Bloomberg NEF 2019. 3 IEA “Africa Energy Outlook 2019”. 4 Power Optimal “2019 update: Eskom tariff increases vs inflation since
1988 (with projections to 2022)”. 5 BloombergNEF, “1H 2020 Corporate Energy Market Outlook”. 6 BloombergNEF, “Corporate Clean Energy Buying Grew 18% in 2020, Despite
Mountain of Adversity”. 7Engineering News, “100 MW reform ‘precursor’ to new market-driven electricity supply industry”
Robust investor appetite for renewables
• 7% growth in 2020 despite COVID and 5%
global energy demand decline1
• US$2 trillion invested in the last 5 years2
• US$5 trillion to US$10 trillion projected
expenditure over the next decade2
Driven by Global commitment to combat
climate change
• Ambitious 30 year renewable energy &
carbon emissions targets
Now the lowest cost energy supply option
• Driven by significant progress in technology
& production economies
• Storage systems becoming increasingly
important for deeper renewables
penetration
Macro
Lowest energy access rates in the world –
45%3
• 80% of companies suffered frequent
electricity disruptions leading to economic
losses in 20183
• 595m people without access to electricity in
20183
Perfect conditions for renewables – one of the
richest solar resources in the world plus land
availability
South Africa a unique opportunity
• Continent’s largest power producer &
consumer – 30% of total energy demand3
• Heavily reliance on outdated coal plants –
90% of generation capacity3
• Declining energy availability factor &
crippling tariff increases - 460% real price
increases since 20074
Sub Saharan Africa
Corporates taking a growing interest in
generating own renewable power
• 23.7GW clean energy purchased in 2020 –
3.8x growth in last 3 years6
• US$20-30bn estimated investment
expenditure in 20195
Increasingly making sense
• Security of supply
• Lower energy costs
• Directly delivers on corporate ESG goals
Sub Saharan Africa poised for significant
growth
• 3x over next 5 years1
• Currently using 40GW3 of back up
generation (diesel/HFO) – potential
US$96bn market
South Africa cap on C&I increased from 1MW to
100MW in June 2021
• 15 000 MW expected over next 5-7 years7
• R100bn in new investment7
C&I Sector
COMPELLING MARKET DYNAMICS

11
African power market primed for change
• High energy costs and low access rates prolific across the region
• Dominated by state power monopolies characterised with declining
supply and limited balance sheets to expand generation or adopt new
technologies
Disruptive technology has arrived at the opportune time
• Falling costs of renewables and energy storage systems
• Growing demand from corporates & households to generate own
renewable power
Significant advantages over traditional power generation
• Multiple offtakers – not reliant on state power offtakes
• Easier to finance – average project size US$0.5m to US$2.0m (vs
+US$20m)
• Quick turnaround – projects cash generative within as little as 12 months
(vs 2-5 yrs)
Exponential growth potential
• Ability to scale quickly
• Access to capital the main limitation to a larger pipeline
Need to move fast• Corporate transition to self generation solutions accelerating
• New entrants moving into the market
WHY THE C&I SECTOR?
12
Eritrea
Sudan
Egypt
Niger
Mauritania
Mali
Nigeria
Libya
Chad
Algeria
CentralAfricanRepublic
Togo
Benin
IvoryCoast
Sierra Leone
GuineaBurkina Faso
Gambia
WesternSahara
Djibouti
Senegal
Guinea Bissau
Tunisia
Morocco
Kenya
EthiopiaSomalia
Tanzania
AngolaMozambique
Zambia
Gabon
Malawi
Burundi
Rwanda
Cameroon
Republic of The Congo
DemocraticRepublic ofThe Congo
Uganda
Namibia
South Africa
Botswana
Swaziland
Lesotho
GhanaLiberia
Zimbabwe
Equatorial Guinea
Madagascar
Comoros
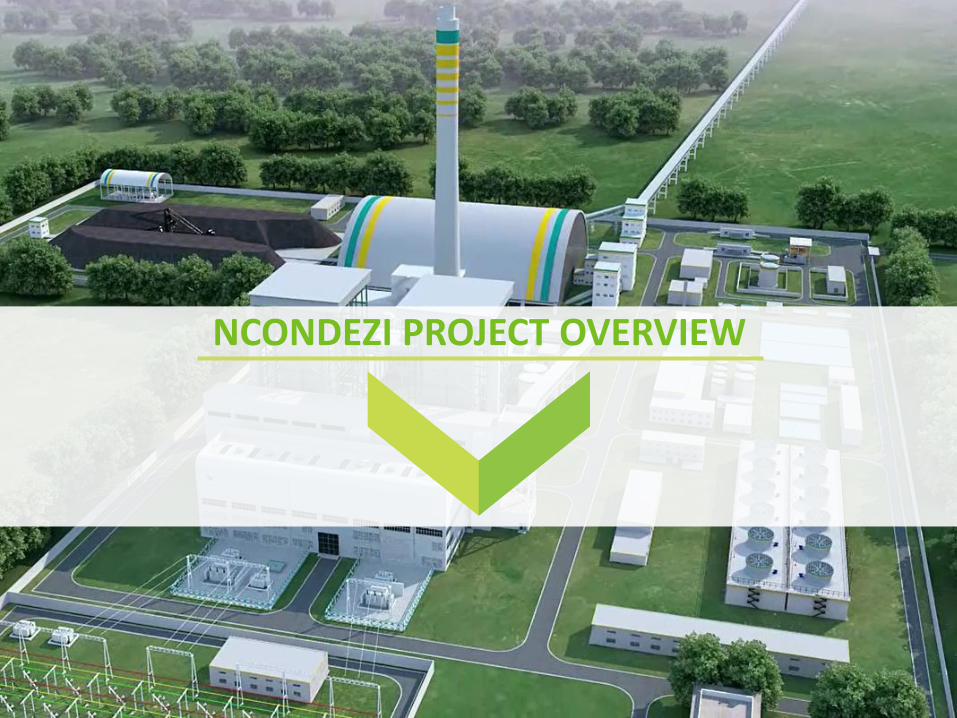
US$40m raised to scale C&I solar expansion17 November 2020
African Rainbow and Power acquires 40% stake in Sola29 January 2021
Pledges net zero emissions by 204021 February 2021
Africa’s largest telecoms company
US$70m Solar Energy Transformation Fund closed8 March 2021
40MWp solar PV approved5 May 2021
Global gold producer
New solar PV plus net zero by 204010 December 2020
75MWp Solar PV + carbon neutral by 204022 February 2021
10-20MWp Solar PV + 1-2MWh storage tender issued17 November 2020
Confirmed 12.3GWh generated from 19 sites in SA & Namibia18 February 2021
US$20m debt facility from Finnfund & Norfund14 January 2021
C&I player activity
Corporate renewables activity
AFRICAN C&I MARKET HEATING UP30MWp solar + 7.5MWh storage announced4 May 2021
US$20m debt facility from IFC9 July 2021
US$38m series B investment12 January 2021
US$9m 13.5MWp solar PV13 November 2020
12MWp solar PV announced7 October 2020
11.2MWp solar PV plus 8.5MWh battery announced22 December 2020
Graphite miner
Source: Public information
13
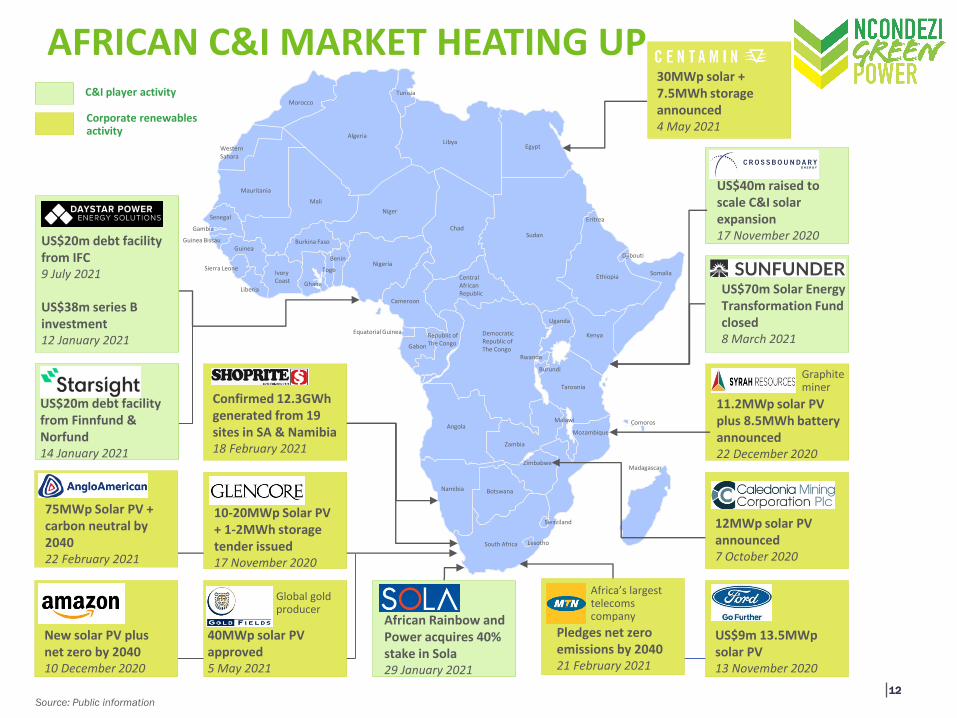
Path to future growth with entry into C&Irenewable energy sector
• Wholly owned subsidiary formed following entryinto C&I sector in 2019
• Focused on the fast growing African Commercial& Industrial solar PV and battery storage sector
• Provide full turnkey solutions to corporate powerofftakers
– Design, construction and operation
– Fully funded, no upfront capitalcommitment for offtaker
– Lower energy bills over 15 to 20 years
• Maiden project due to generate first power inJuly 2021
– Believed to be the first of its type inMozambique
• Right to fund US$5.5m pipeline of developmentprojects in Mozambique through RelationshipAgreement with Captive Power
• Proposed JV with Nesa Group to form regionalchampion in the sector
NCONDEZI GREEN POWER OVERVIEW
600 MWhforecast annual renewable energy generation
517tCO2 avoided per year
HIGHLIGHTS:
• 1st project of its type in Mozambique
• 1st Tesla storage project in Mozambique
• Over 25% energy cost saving
Maiden C&I Project Overview
Location: Inhambane Province, Mozambique
Type: Fully offgrid system
Capacity: 400kWp Solar PV + 912kWh battery storage
Term: 15 years, US$ denominated
Investment: US$1.1m (fully funded)
Contracted income: US$3.1m
14
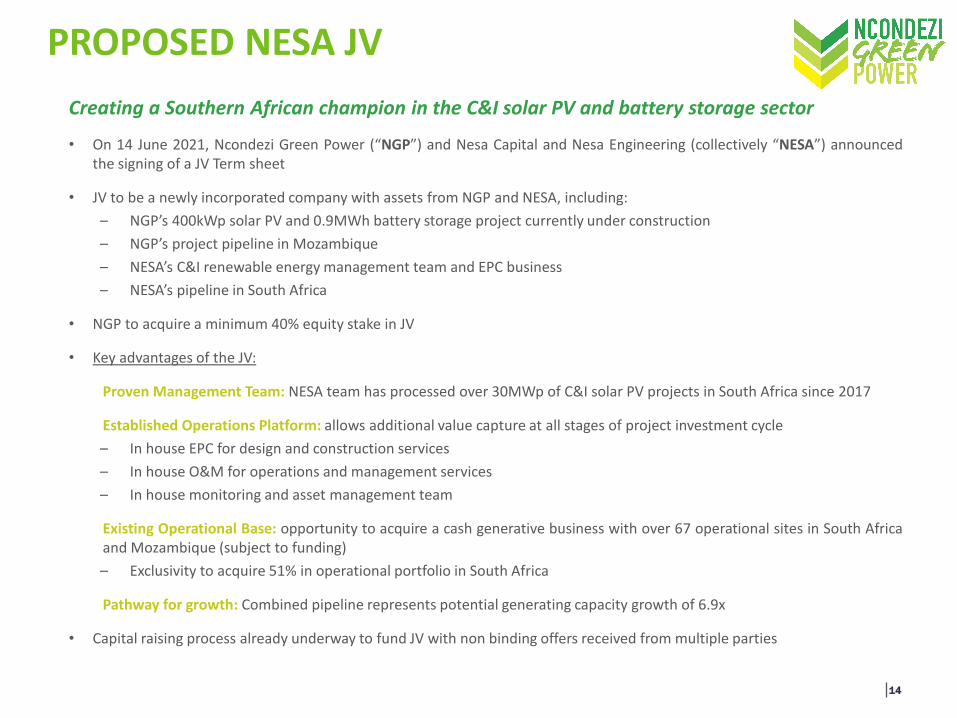
PROPOSED NESA JV
Creating a Southern African champion in the C&I solar PV and battery storage sector
• On 14 June 2021, Ncondezi Green Power (“NGP”) and Nesa Capital and Nesa Engineering (collectively “NESA”) announcedthe signing of a JV Term sheet
• JV to be a newly incorporated company with assets from NGP and NESA, including:
– NGP’s 400kWp solar PV and 0.9MWh battery storage project currently under construction
– NGP’s project pipeline in Mozambique
– NESA’s C&I renewable energy management team and EPC business
– NESA’s pipeline in South Africa
• NGP to acquire a minimum 40% equity stake in JV
• Key advantages of the JV:
Proven Management Team: NESA team has processed over 30MWp of C&I solar PV projects in South Africa since 2017
Established Operations Platform: allows additional value capture at all stages of project investment cycle
– In house EPC for design and construction services
– In house O&M for operations and management services
– In house monitoring and asset management team
Existing Operational Base: opportunity to acquire a cash generative business with over 67 operational sites in South Africaand Mozambique (subject to funding)
– Exclusivity to acquire 51% in operational portfolio in South Africa
Pathway for growth: Combined pipeline represents potential generating capacity growth of 6.9x
• Capital raising process already underway to fund JV with non binding offers received from multiple parties

15
ABOUT NESA
0
2000
4000
6000
8000
10000
12000
14000
16000
18000
-
10
20
30
40
50
60
70
Gen
erat
ing
Cap
acit
y (k
Wp
)
No
. In
vest
men
ts
No. Investments WIP + Signed Mandates
Installed Capacity (kWp)
NIH Installed Solar PV Capacity• NESA comprises:
– Nesa Capital (Pty) Ltd (“Nesa Capital”), anindependent impact investment manager; and
– Nesa Engineering (Pty) Ltd (“Nesa Engineering”), anEPC engineering firm (formerly Creovision (Pty) Ltd).
• Provides turnkey renewable energy solutions and servicesin SA:
– Development stage: project procurement, design,engineering
– Investment stage: due diligence, financing
– Operational stage: O&M, monitoring services
• Nesa Capital and Nesa Engineering have jointly providedmanagement services to Nesa Investment Holdings(“NIH”) and its portfolio of C&I investments since itsinception in 2017
• To date, the NESA team has, for NIH, processed over 30MWp of solar PV projects, of which 9.8MWp has been commissionedacross 55 separate sites and 5.8MWp is currently under construction across 11 separate sites.
• US$2.4m (R32.4m) – NESA unaudited proforma consolidated revenues in the financial year ending February 28, 2021
• Existing C&I project pipeline with an estimated generating capacity of 91.6MWp solar PV and 7.3MWh battery storage
• 14 professional staff and is currently 100% owned by management.
Source: NESA Capital

16
NESA INVESTMENT HOLDINGS SA SOLAR PV & BATTERY STORAGE PORTFOLIO
Source: NESA Capital. Note: 2 Acquisition to be through the proposed JVCo and subject to funding
Sumitomo Rubber
Location: Ladysmith, KZN
System Size: 1,245 kWp
iDube Cold Storage
Location: Durban, KZN
System Size: 285 kWp
Flora Farm, M&F Giuricich
Location: Johannesburg, GP
System Size: 400 kWp
Makro SA
Location: National
System Size: 3,571 kWp
Daniel Pienaar School
Location: Port Elizabeth, EC
System Size: 624 kWp
Location in South AfricaLive sites
WIP1 + Mandates won
TOTAL
Size (kWp) No. Sites Size (kWp) No. Sites Size (kWp) No. Sites
North West 67 2 - - 67 2
Gauteng 5,379 26 3,667 5 7,456 31
Kwa-Zulu Natal 2,511 5 - - 2,511 5
Eastern Cape 2,917 23 1,043 5 3,913 28
TOTAL 10,874 56 4,710 10 15,583 66
Portfolio Overview
1 Work in Progress
NESA & NGP have binding agreement granting exclusive rights to agree terms to acquire minimum 51% interest in the NIH Portfolio by 30 November 2021 with a subsequent option to acquire up to 100% within a 5 year period2
Key project highlights:

17
ESG & SUSTAINABILITY AT THE CORE OF THE JV
Indicators NESA Performance to Date1 2026 Target2
CO2 greenhouse gas emissions saved to date 5,222t 152,000t
Renewable Energy Generated for Sale 13.3GWh 166GWh
Energy Savings from Services Sold US$ 1.1m3 US$10m
Focus on clean & green investments – Renewable energy & energy storage
Reduce CO2 emissions by replacing dirtier sources of energy – fossil fuel power and diesel generation
Accelerate adoption of renewables
Provide investors access to combatting climate change
Contributing directly to 4 of the United Nations Sustainability Development Goals:
Goal 9Build resilient infrastructure, promote inclusive & sustainable industrialization & foster innovation
Goal 13Take urgent action to combat climate change and its impacts
Goal 17Strengthen the means of implementation & revitalize the global partnership for sustainable development
Goal 7Ensure access to affordable, reliable, sustainable & modern energy for all
Envi
ron
men
tal
Affordable electricity – Reduce businesses’ operating costs by offering clean reliable electricity cheaper than the grid or backup generators
Energy security – take advantage of Africa’s high solar irradiation with proven technologies to replace ageing grid infrastructure
Create jobs – hire locally & partner with local solar development companies and installers and accelerate the local green economies to promote job creation
Local community consultation & engagement
Prioritise health & safety
Soci
al
KEY ESG Indicators
Co
rpo
rate
G
ove
rnan
ce
Enhance diversity – Board and management team hiring programmes focused on women and previously disadvantaged people
Code of ethics
Adhere to best governance practices
Note: 1 As at 28 February 2021, 2 Annual performance targets, 3 ZAR to US$ FX rate of 14.46:1.

18
PROPOSED JV OPERATIONAL ASSETS OVERVIEW1
Countries included on immediate pipeline
Countries identified for future pipeline
Note: 1 Proforma numbers assume 100% acquisition of NIH Operational Portfolio. 2 Breakdown based on project capital committed. 3As at February 28, 2021
Sites in operation & under
construction
63
Solar PV installed & under construction
15.9 MWpAverage portfolio
PPA duration
17 years
Full time staff
15
Storage installed & under construction
1.1MWh
Number of sites
67Green energy
produced
13.3GWh
CO2 greenhouse gas emissions saved to
date from NESA Portfolio
5,222t3
EPC / development partners
8
Contracted EBITDA
US$40m
By Sector: By Country:
34%
30%
22%
8%5% 1%
Retail CommercialIndustrial HotelsDistributed Residential
92%
8%
South Africa Mozambique
Portfolio Breakdown2
Target Territories
Ḁ

19
PROPOSED JV PROJECT PIPELINE OVERVIEW
Opportunities identified through partner network
Potential clients already engaged with positive traction. Indicative
proposals submitted for consideration
Total ± US$ 67.7m
OPPORTUNITIES± US$55.0 million
QUALIFIED± US$12.8 million
Note: 1 Subject to funding 2 Potential full year EBITDA of pipeline in 2021 prices. ZAR to US$ FX rate of 14.46:1
Energy Storage
13.5MWh
Number of sites
47
Solar PV
94.5MWp
CO2 metric tonnes avoided per year
130 000
Estimated annual EBITDA2
US$6.6m
Pipeline Breakdown
By Sector: By Country:
Capital Commitment Breakdown1
36%
20%13%
8%
6%5%
5%3%2% 2%
Mining IndustrialRetail ManufacturingReal Estate HotelsHealthcare CommercialCommunity Other
89%
11%
South Africa Mozambique

20
KEY NESA JV MILESTONES
Phase I
• Finalise acquisition price for SA solar PV operational portfolio
• Finalise NGP equity stake in JV
Phase II
• Finalise JV equity fund raise
• Finalise optimal debt structure
Phase III
• Complete JV
• Implement pipeline roll out
21
Focused on providing reliable, affordable and accessible power whilst meeting the most stringent emission standards
One of the most advanced baseload power projects in Mozambique
World leading co-development partners and strong support from Mozambique and Chinese governments
Proposed JV to create regional champion in C&I renewable energy sector
Experienced management team
C&I set to be a high growth market for next 5 to 10 years
Early mover into new rapidly growing C&I renewable energy sector with clear visibility on first income
CONCLUSION

22
APPENDIX

23
COAL REMAINS A LEADER IN GLOBAL POWER GENERATION
Coal remains the largest generation fuel source3
Note: 1Carbon Brief “Mapped: The world’s coal power plants”, 26 March 2020. 2 IEA “Electricity Market Report”, December 2020. 3 BP “Statistical Review of World Energy”, June 2020. 4 CNN “Asian Banks are failing on climate by channelling billions into coal”, 28 February, 2021
58%42%
Asia Pacific
29%71%
Africa
21%79%
North America
18%82%
CIS
17%83%
Europe
36%64%
World
Significant financing across the coal value chain is still in place4
US$1.2 trillion – value of institutional investments in the global coal industry as at Jan 2021 (USA 58%, Japan 7%)
US$808 billion – underwritten by 427 commercial banks in last 2 years (China 58%, USA 13%)
US$315 billion – lent by 380 commercial banks in last 2 years (Japan 24%, USA 21%)
Coal Power generation Other Power generation
Key coal capacity growth markets2
30
52 2 1.1
20
35
52.4
China South East
Asia
India Japan UAE Germany
Annual Growth 2020 Commissioned Under Construction
Coal Power Generation -
GW added
Global coal generation capacity remained robust despitegrowing difficulties in financing & international pressure
• Grown every year between 2000 and 2019, nearly doubling from1,066GW to 2,045GW1
• Remained flat in 2020 at 2,125GW despite accelerateddecommissioning of plants in Europe (20GW) and North America(10GW)2
• Expected to reach as much as 2,140GW in 20212

24
GLOBAL C&I MARKET INDICATORS
Announced US C&I and Community Solar Investments since 2H 2019 (US$m)2
Top Corporate Clean Energy Buyers 2020 (MW)1Global Corporate PPA Volumes (GW)1
Source: 1BloombergNEF, “Corporate Clean Energy Buying Grew 18% in 2020, Despite Mountain of Adversity”. 2BloombergNEF, “How Big Investors Make Money in U.S. C&I Solar”

25
NESA JV INDICATIVE STRUCTURE
JVCo
Ncondezi Green Power Holding Ltd
Mozambique Pipeline Maiden Moz. Project
6 projects
2.7MWp Solar + 4.6MWh Storage
400kWp Solar + 924kWh storage
Ncondezi Energy LtdLondon Listed: NCCL
100%
100%
Asset Finance Agreement
SA Services Business
Nesa management team
Revenue Streams:Deal originationEPC and O&M
Asset Management
100%
SA Operational Portfolio
51%
66 active sites in South Africa
15.5MWp Solar PV + 200kWh Storage
49%
NESA
100%
SA Pipeline
41 projects
91.6MWp Solar + 7.3MWh storage
PPA
100% 100%
>40%
New Investors Process
% tbc % tbc
Ncondezi Contribution NESA Contribution NESA Ncondezi exclusive acquisition rights(subject to funding)
Retail Fund Investors
100%