Embed Size (px)
Citation preview

AN ABSTRACT OF THE THESIS OF
James Brik for the degree of Doctor of Education
in Education presented on March 9, 1984
Title: The Effects of EMG Biofeedback Training and RelaxationTraining on Self-Reported Measures of Trait Anxiety andSports Competition Anxiety
Abstract approved:Redacted for Privacy
Forrest Gathercoal
This study examined the singular and combined effects of a
progressive relaxation and biofeedback monitoring program upon Trait
Anxiety, Sports Competition Anxiety, blood pressure, heart rate, and
muscle tension as measured by EMG readings. The programs were
administered over a six-week sequence, with pre-measures utilizing
the Spielberger Trait Anxiety measure, the Sports Competition
Anxiety Test, and Rotter's Locus of Control Test to evaluate the
psychological parameters. In addition, blood pressure and resting
heart rate data were collected one hour prior to three competitive
duo meets and prior to "warm-up". EMG monitoring by biofeedback was
accomplished through use of the Autogen 1100 Myograph at a band pass
setting of 100 to 200 Hz. EMG measures were made by use of the
Autogen 5100 Digital Integrator using time-averaged performance of
each subject. These measures were independent of the analysis

feedback. All pre-measures were gathered prior to the various
treatment strategies. The subjects were 36 male collegiate varsity
track and field athletes divided into one of four treatment cells
containing nine subjects each. Each group met for a total of twelve
one-half hour sessions and participated in either a cassette-taped
Quieting Response program, a Quieting Response program with
augmented EMG biofeedback, or EMG biofeedback alone. The control
group was administered the assessment items and blood pressure and
resting heart rate measures to include EMG time-averaging
monitoring. In lieu of treatment, the control group attended twelve
one-half hour sessions of passive rest and listened to "music of
choice" during these sessions.
Statistical analysis using repeated-measures analysis of
variance (ANOVA) revealed that EMG measures were significantly
reduced through the six weeks of training using relaxation training
alone, biofeedback training, and combined relaxation/biofeedback
training. There were no differences as a result of treatment effect
for the variables for between group significance for any of the
variables to include Trait Anxiety, Sports Competition Anxiety,
Locus of Control, blood pressure, and resting heart rate.

The Effects of EMG Biofeedback Training and Relaxation
Training on Self-Reported Measures of TraitAnxiety and Sports Competition Anxiety
by
James Brik
A THESIS
submitted to
Oregon State University
in partial fulfillment ofthe requirements for the
degree of
Doctor of Education
Completed March 9, 1984
Commencement June, 1984

APPROVED:
Redacted for PrivacyAssodiate Professor of Education in charge of major
Redacted for PrivacyDean of the School of Eekation
Redacted for Privacy
Dean of the cnooi <I
Date thesis is presented March 9, 1984
Typed by Darlene Thorn for James Brik

ACKNOWLEDGEMENTS
I wish to thank and extend a sense of gratitude to Dr. NoelKaestner for advising and assistance in statistics, Mr. David Neiseof the OSU Computer Center, and Darlene Thorn for her patience intyping this project.
Also, I wish to make it known that support of a strong willedwoman can aid in accomplishing many things. I would like to thankmy wife, Nancy, for her consistent and insistent support.

TABLE OF CONTENTS
Page
CHAPTER IINTRODUCTION 1
Statement of the Problem 1
Purpose of the Study 2
Importance of the Study 3
Delimitations 5
Limitations 5
Assumptions 6
Definitions 6
Hypothesis 9
CHAPTER IIREVIEW OF LITERATURE 10
Definition of Anxiety 10The Relationship of Anxiety to Other Nomenclature 17
Anxiety and Performance 18Methods to Alleviate Anxiety and Relationshipsof Anxiety to Performance and Competition 24
Muscle Tension and Relaxation 36
Relaxation and Biofeedback 40Anxiety Reduction and Use of Biofeedback 43
Electrode Placement 47Heart Rate and Anxiety 48Reduction of Blood Pressure Through Use
of Biofeedback 49
Expectations 51
Locus of Control and its Measurement 52
Measurement of Anxiety 54
Need 61
CHAPTER IIIPROCEDURES 64
Population and Sample 66Experimental Procedures 67
Method of Analysis 69
Hypothesis 70
Data Collection 71

TABLE OF CONTENTS(Continued)
CHAPTER IV
Page
RESULTS 74
Interpretation of F Ratio 74
Multiple Comparisons of ANOVABetween Treatment Groups 76
Multiple Comparisons of ANOVAWithin Treatment Groups 77
Between and Within Analysis of Pre-Test,Post-Test I, and Post-Test II Measures 79
Trait Anxiety (STAI) 80
State Anxiety (SCAT) 85
Locus of Control (IE) 89
Blood Pressure (Systolic and Diastolic) 93
Heart Rate (BPM) 100Electromyographic Feedback (EMG I and EMG II) 104,
Summary 111
CHAPTER VDISCUSSION 115
Summary of the Study 115
Conclusions 116
Discussion 119
Recommendations 128
BIBLIOGRAPHY 131
APPENDICESAppendix A. Expectant Faith and the Training Effect 150
Appendix B. Is Something Better Than Nothing,and How Much N is Enough N? 157
Appendix C. Quieting Response for Athletes 168
Appendix D. Sport Competition Anxiety Test (SCAT) 182
Appendix E. Rotter's Internal-ExternalLocus of Control Scale 184
LIST OF FIGURES
Figure Page
1. Trait Anxiety (STAI) 84
2. State Anxiety (SCAT) 88
3. Locus of Control (IE) 92
4. Blood Pressure (SYST and DIAS) 99
5. Heart Rate (BPM) 103
6. EMG I and EMG II 110
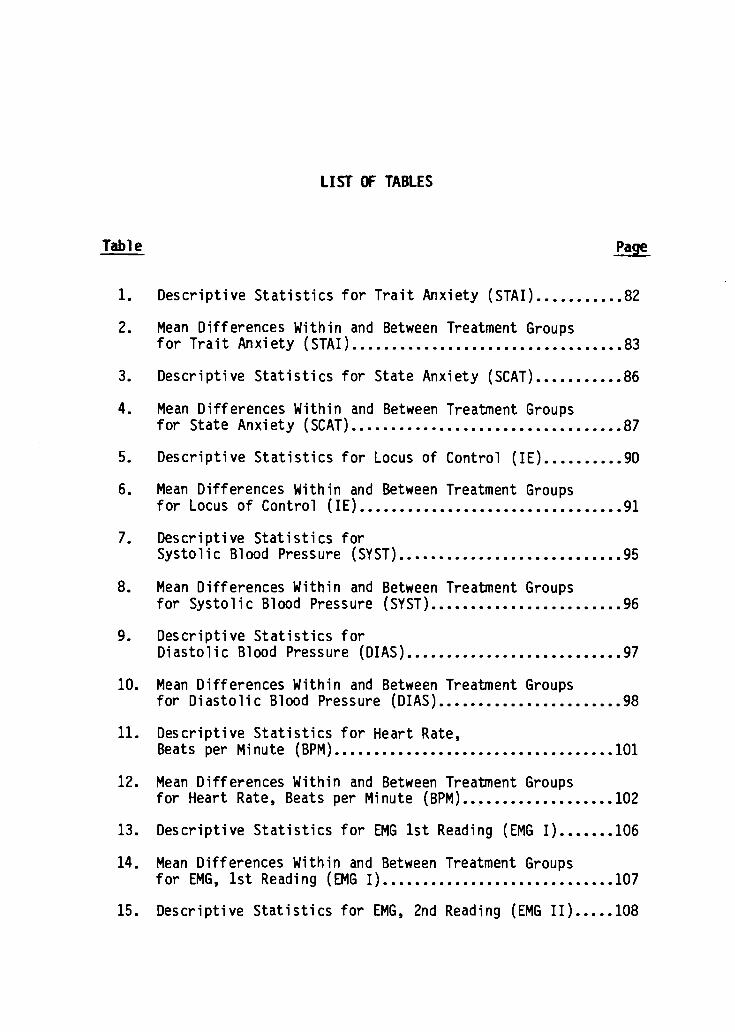
LIST OF TABLES
Table Page
1. Descriptive Statistics for Trait Anxiety (STAI) 82
2. Mean Differences Within and Between Treatment Groupsfor Trait Anxiety (STAI) 83
3. Descriptive Statistics for State Anxiety (SCAT) 86
4. Mean Differences Within and Between Treatment Groupsfor State Anxiety (SCAT) 87
5. Descriptive Statistics for Locus of Control (IE) 90
6. Mean Differences Within and Between Treatment Groupsfor Locus of Control (IE) 91
7. Descriptive Statistics forSystolic Blood Pressure (SYST) 95
8. Mean Differences Within and Between Treatment Groupsfor Systolic Blood Pressure (SYST) 96
9. Descriptive Statistics forDiastolic Blood Pressure (DIAS) 97
10. Mean Differences Within and Between Treatment Groupsfor Diastolic Blood Pressure (DIAS) 98
11. Descriptive Statistics for Heart Rate,Beats per Minute (BPM) 101
12. Mean Differences Within and Between Treatment Groupsfor Heart Rate, Beats per Minute (BPM) 102
13. Descriptive Statistics for EMG 1st Reading (EMG I) 106
14. Mean Differences Within and Between Treatment Groupsfor EMG, 1st Reading (EMG I) 107
15. Descriptive Statistics for EMG, 2nd Reading (EMG II) 108

LIST OF TABLES(continued)
Table Page
16. Mean Differences Within and Between Treatment Groupsfor EMG, 2nd Reading (EMG II) 109
A. ANOVA For the Variables on Pre-Test Assessment 160
B. ANOVA For the Variables on Post-Test I Assessment 161
C. ANOVA For the Variables on Post-Test II Assessment 162

The Effects of EMG Biofeedback Training and RelaxationTraining on Self-Reported Measures of Trait
Anxiety and Sports Competition Anxiety
CHAPTER I. INTRODUCTION
Statement of the Problem
The preponderance of research in the use of biofeedback and its
use in the reduction of anxiety measures falls outside of the milieu
of sports and athletics. A review of the literature and research
indicates that, although use of biofeedback techniques is advocated
by various sports psychologists (Ash and Zellner 6), as yet few
studies have used this technique with athletes in a research set-
ting.
Cognitive training is a term that encompasses techniques used
to help individuals alter their own stress reactions to environmen-
tal events. The term cognitive implies that the technique focuses
on thoughts and perceptions. Cognitive restructuring, mental
rehearsal, rational-emotive therapy, self-efficacy statements, and
general relaxation programs can be brought under the umbrella term
of cognitive training.
Electronic feedback of a physiological response (biofeedback)
has been combined with cognitive training techniques by a few
researchers (Blanchard and Epstein, 17; DeWitt, 44, 45). The gen-

2
eral goal of these programs is to have subjects become aware of
their responses to events and then substitute more adaptive ways of
responding.
The question arises, is biofeedback training effective in
reducing self-reported anxiety in a sports setting? Is biofeedback
control enhanced by the learning of a Quieting Response, or
relaxation program, and is it evidenced by an increased ability to
monitor physiological measurements through self-control?
The information that exists supports, generally, the notion
that High State and High Trait Anxiety in sports is likely to accom-
pany a reduced effectiveness in both physiological and psychological
self-concept and in coping abilities within a competitive contest.
Because of the nature of the interdependent aspects of
perceived success, self-concept, and Trait Anxiety levels in ath-
letes, a clear need exists to develop coping skills that may enhance
awareness of physiological responses and reduce High Anxiety levels.
Purpose of the Study
The purpose of this study is to determine the singular and com-
bined effects of progressive relaxation and biofeedback monitoring
upon anxiety and other psychological and physiological variables in
a selected group of subjects in a specific sports setting. The pro-
gram is designed to be administered over a six-week sequence, with a

3
pre-measure utilizing the Spielberger Trait Anxiety Measure, use of
the Sports Competition Anxiety Test (SCAT) prior to competition of
the subjects in three duo track and field meets throughout a season
of track and field will be used to establish state-anxiety. In
addition, blood pressure and resting heart-rate data will be
collected prior to "warm up" in the competitive duo-meet setting.
The Appendix gives pertinent information and instruction/
references to the paper/pencil instruments. The dependent variables
are SCAT, STAI, the I-E Locus of Control Test, blood pressure/
resting heart rate measures, and EMG measures.
Importance of the Study
A review of the literature in the area indicates that much is
known about pre-competitive anxiety in athletes but little has been
done to modify this pattern. Researchers have reported moderate
success in reducing pre-competitive and trait anxiety but little
evidence exists of a total program incorporating both biofeedback
and cognitive techniques for this purpose specific to athletics.
Many positive attributes have been identified that are supposed
outcomes of a healthy sport environment. The goals of education
that are established identify desired outcomes; the social, emo-
tional, physical, and intellectual goals, are perhaps met. However,
the learning situation of the sports field may be likened to an

4
environment where not only positive lessons are learned but also
negative outcomes may be evident.
Our sports world is replete with opportunities to gain lessons
from both success and failure. Kenneth Pelletier maintains that
. . Stress disorders are based upon the slow, developmental
accumulation of physiological and physical stress responses through-
out the lifetime of the individual" (Pelletier, 130). Pelletier
also maintains that situations and events that would be interpreted
as positive and pleasurable can also be stress-inducing perhaps as
much as those events that are considered as negative.
Models of behavior admired in our society contribute toa high level of stress with their emphasis upon ambi-tion, drive, extreme goal orientation, financial suc-cess, and the appearance of being constantly busy.
(Pelletier, 1977)
Hence, the sport environment that places high expectations upon
participants and the clearly defined values attributed to winning
and losing, is perhaps a stage where later behavior techniques are
rehearsed many times over by our athlete understudies.
The intent of this study is to investigate the results of
changes of Trait and State Anxiety levels and the effects of a
"Quieting Reponse Training" program in conjunction with selected
biofeedback modes. The biofeedback treatment groups utilized the
Autogen 1100 Electromyography Unit (EMG). In addition, the Sports
Competition Anxiety Test (SCAT), and the Rotter I-E Locus of Control
Scale (I-E) were administered to further investigate factors of

5
personality awareness. Examples of the tests and information con-
cerning reliability/validity on the various items appear in the
Appendix.
Delimitations
This investigation was confined to determining the effect of
the instructional program and use of biofeedback techniques on self-
reported measures of state and trait anxiety, blood pressure mea-
sures, heart rate measures, and EMG readings. Undergraduate stu-
dents who were members of a track and field varsity program com-
prised the study population. Consequently, generalizations to other
than athletic populations may be inappropriate.
Limitations
The sample for the study consisted of 36 student/athletes, the
instructional strategies employed and the data collection procedures
for this study required groups of relatively small numbers, however,
the statistical treatment accounts for a level of significance par-
ticularly adapted for the size of the sample. The population of 36
students was placed into each treatment cell based on random selec-
tion procedures.

6
Assumptions
This study was based on the following assumptions:
I. The STAI will correctly identify the trait anxiety levels of the
subjects and is a reliable and valid assessment tool.
2. The undergraduate students who comprised the study group will
represent a cross section of track and field athletes and those
that comprise an individual sports team.
3. Baseline BP and EMG readings will be valid and reliable measures
for each subject.
4. Pre and post test scores will vary sufficiently to allow for a
statistical analysis of the effectiveness of the treatment pro-
grams.
Definitions
1. Anxiety: a strong personally experienced feeling of distress
and anguish. It is a state of being uneasy, apprehensive or
worried about what may happen.
2. A-State Anxiety: existing or current emotional state char-
acterized by feeling of apprehension and tension and associated
with activation or the organism. A-State Anxiety is a negative
affect.
3. Biofeedback: involves the placing of a monitor between a body
process, processes that can be monitored may be subject to

7
learned control. The parasympathetic nervous system works in
opposition to the sympathetic, it is the means by which relaxa-
tion occurs. The activity of the skelatal muscles is triggered
by a pattern of electrical impulses originating in the central
nervous system, the motor nerve pathways terminate in the muscle
fibers. Muscular relaxation occurs when the electrical
discharge rate is decreased. EMG activity is expressed in
microvolts (millionths of a volt). Since muscular tension is
proportional to the degree of electrical discharge that
stimulates the muscle, EMG is a direct index of contraction or
relaxation.
4. Competitive A-Trait Anxiety: a tendency to perceive competitive
situations as threatening and to respond to these situations
with feelings of apprehension or tension.
5. EMG Biofeedback: The activity of the skeletal muscles is trig-
gered by a complex pattern of electrical impulses originating in
the central nervous system. These impulses travel from the
brain and spinal cord through motor nerve pathways which ter-
minate in the muscle fibers. Innervation of the muscle fibers,
and consequent muscle contraction, is brought about when a sig-
nificant number of motor nerves in a given area are emitting
repeated electrical discharges.
The electrical activity which accompanies muscle action is
called the electomyogram, or EMG, and is commonly detected by
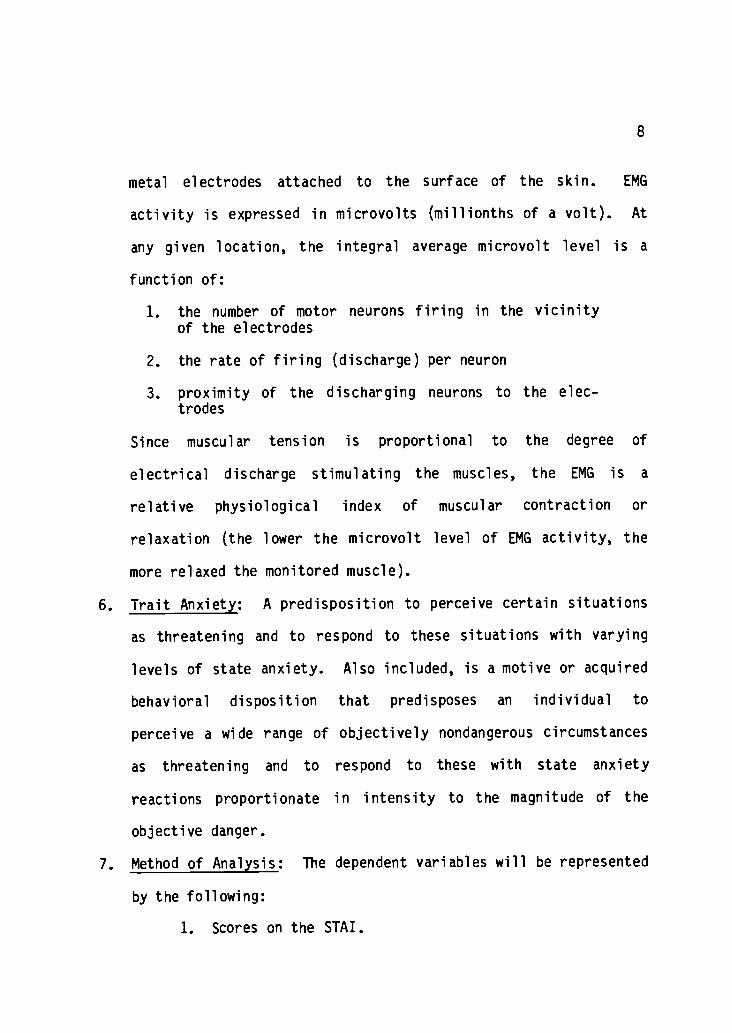
8
metal electrodes attached to the surface of the skin. EMG
activity is expressed in microvolts (millionths of a volt). At
any given location, the integral average microvolt level is a
function of:
I. the number of motor neurons firing in the vicinityof the electrodes
2. the rate of firing (discharge) per neuron
3. proximity of the discharging neurons to the elec-trodes
Since muscular tension is proportional to the degree of
electrical discharge stimulating the muscles, the EMG is a
relative physiological index of muscular contraction or
relaxation (the lower the microvolt level of EMG activity, the
more relaxed the monitored muscle).
6. Trait Anxiety: A predisposition to perceive certain situations
as threatening and to respond to these situations with varying
levels of state anxiety. Also included, is a motive or acquired
behavioral disposition that predisposes an individual to
perceive a wide range of objectively nondangerous circumstances
as threatening and to respond to these with state anxiety
reactions proportionate in intensity to the magnitude of the
objective danger.
7. Method of Analysis: The dependent variables will be represented
by the following:
I. Scores on the STAI.

9
2. Scores on the SCAT.
3. Scores on the I-E Test
4. Average readings on the EMG digital monitor
5. Average readings for pre-meet blood pressure andresting heart rate (BPM).
Pre-test scores will be compared to post-test using the analysis
of variance for repeated measures techniques. Results will be
considered statistically significant at the .05 level.
Hypothesis:
The following comprised the null hypothesis for this study:
1. There is no significant difference in Trait Anxiety measure of
the subjects due to the training programs to include biofeedback
augmented training from pre- to post-test and eighth week
results.
2. There is no significant difference in State Anxiety one hour
before a contest due to the training programs, as measured by
SCAT.
3. There is no significant differences in I-E Locus of Control
measures due to the training programs.
4. There is no significant differences in EMG readings as measured
by the EMG digital monitor for three treatment and one control
groups.
5. There is no significant difference in BP/HR prior to competition
due to the training programs.

10
CHAPTER II. REVIEW OF LITERATURE
Definition of Anxiety
An important component of personality is that of anxiety, a key
construct in the conceptualization of many theorists considering
personality. It usually designates a strong personally experienced
feeling of distress and anguish. McReynolds (102) stated:
Anxiety is found as a central explanatory concept in
almost all contemporary theories of personality and itis regarded as a principle causative agent for suchdiverse consequences as insomnia, immoral and sinful
acts, instances of creative self-expression, debilitat-ing psychological and psychosomatic symptoms and idio-syncratic mannerisms of endless variety.
Freud (52) was one of the first psychologists to be identified
with the field of anxiety. He believed that anxiety was
recognizable by its "character of unpleasure (that) seems to possess
a particular note of its own, definite physical sensations
associated with specific organs and efferent discharge bound
together along specific pathways." Thus, anxiety was first
identified by its particularly unique and unitary characteristics as
an affective physiological state.
The term "anxiety" has prompted much difference of emphasis in
its definition. Epstein (48) emphasized the term "arousal" in his
analysis of anxiety, defining it as a "state of undirected arousal
following perception of danger." McReynolds also indicated the

11
close relationship of anxiety and arousal when he stated that the
arousal system responds positively to increments in anxiety. The
more sudden the increment of anxiety the greater the response, but
once the level of anxiety has reached an equilibrium, even though it
is still high, the levels of arousal tend to return to their normal
baseline. Therefore, according to McReynolds, arousal is a crisis
reaction to upsurges in anxiety.
Investigators have become frustrated in establishing labels for
the multidimensional aspects of anxiety because so much of the
research has indicated inconsistent findings. Spence (166)
discussed this inconsistency:
Individual differences in physiological arousal--do notappear to be correlated with indices of behavioral defi-cit nor with reports of emotional and subjective dis-tress. Rather, the behavioral and the physiologicalreactions to conflict are independently organized sys-tems.
May (113) identified anxiety as a "vague fear stemming from a
source that is unknown to the stricken individual, a diffused appre-
hension." Thus, the primary and the central difference between fear
and anxiety was that fear is a reaction to a specific danger, while
anxiety is unspecific, vague and objectless.
Anxiety has a variety of autonomic and muscular consequences.
These include such characteristics as queasy feelings in the
stomach, heart palpitations, feelings of muscular tension and irreg-
ular breathing. McReynolds elaborated:

12
Still, a further complexity in the experience of anxietyis provided by the existence and diversity of autonomicfeedback and of the perception of other somatic effectsof anxiety. The awareness of gastric disturbances,muscle tensions and the like, becomes a part of thewhole experience of anxiety and adds immeasurably to itscomplexity. Further, such feedbacks themselves can beconditioned.
Sarason (142) specified in his synopsis of anxiety that the
fear which individuals sense is related to self-evaluation and that
the highly anxious individual is self-centered, focusing on self-
worry and self-evaluation rather than on the situational task.
Selye (157) completed a thorough study of stress which included
the physiological changes that occur in the body which accompany
anxiety. He indicated that the widespread bodily changes which
regulates the secretion of adrenalin are behaviorily triggered.
Selye theorized that physiological arousal mediates postural,
perceptual and cognitive responses. It was his contention that
arousal leads to heightened vigilance and greater information
processing, except at extremely high levels of arousal, where
confusion, avoidance and defensiveness (blocking out of relevant
stimuli) occur. This theory is consistent with the older and more
generally known Yerkes-Dodson Law which stated that an increase in
arousal results in improved performance up to a point and that
further increases in arousal result in decrements in performance.
Oxendine (129) explained the principle further:
The Yerkes-Dodson Law . . . points out the varyingeffect that a standard amount of drive might have on

13
different tasks. According to this law, complex tasksare performed best when one's drive or motivation is
relatively low, but optimum proficiency in simple tasksis attained when drive is high. The relationship be-tween drive and performance is therefore not a simpleone. As drive increases, so does performance to a
point. Continued increases in drive lead to poorerperformance, especially in complex skills. It appearsthat under a high level of tension, wrong habits areoften activated which interfere with both learning andperformance.
Stress and elements of arousal and activation is a vital part of
preparing for a meet or contest. Historically, the Yerkes-Dodson
"law" was presented to explain that there was an optimal level of a
person's arousal or motivation necessary to achieve in activity.
Eventually the concept was described as the "inverted-U hypothesis"
and was used to graphically portray the relationship between arousal
and achievement. Too much arousal or too little arousal can have a
detrimental effect on performance in athletics; what the athletes
desire is just the right mix that will enable them to have the kind
of outcome that is desired. The graph below relates how this might
look:
High
Low
Arousal High

14
The optimal level of arousal for each unique sports task will vary
for each individual and each unique setting. Generally, excessive
arousal can cause a lack of coordinated responses and poor decision-
making in the athletic event.
Physiological manifestations of anxiety are one method of
analyzing its presence. A second common identification of anxiety
is as a motivational term. An ordinary recognition of anxiety is
revealed in the statement, "you look anxious" which is a reference
for various publicly observable bodily characteristics.
Sarason (143) specifically listed five different traits which
can cause the anxiety reaction:
1. The situation is seen as difficult, challeng-
ing and threatening.
2. The individual sees himself as ineffective, or
inadequate, in handling the task at hand.
3. The individual focuses on undesirable conse-
quences of personal inadequacy.
4. Self-deprecatory preoccupations are strong and
interfere or compete with task-relevant cogni-
tive activity.
5. The individual expects and anticipates failure
and loss of regard by others.
Early researchers who have studied psychology of sports were
ambiguous in their definition of anxiety. There has been confusion

15
in the determination of whether anxiety is a matter of a general
tendency to be anxious or an immediate state of anxiety. It becomes
even more ambiguous when both of these states have so many similari-
ties. McReynolds defined the general tendency as "primary anxiety,"
for it "inevitably occurs under certain limited and prescribed
conditions, simply because the organism is made that way."
Spielberger (167) was one of the first to define and differentiate
between the two distinct types of anxiety, identifying them as
"trait" and "state" anxiety. He categorized "trait" anxiety as
similar to the general tendency or primary type, which is a predis-
position to perceive certain situations with varying levels of state
anxiety. Thus he maintained that trait anxiety is a stable and
consistent feature of each individual. It is also a single, unitary
characteristic of the organism that is based primarily on past
experience and, like other personality traits, is thought to be
firmly established in adulthood. "State" anxiety, on the other
hand, is defined as an existing or immediate emotional state
characterized by apprehension and tension. Speilberger (170)
further elaborated in a later publication that the definition of
state anxiety can be termed A-state and that it is an emotional
reaction, "consisting of unpleasant, consciously perceived feelings
of tension and apprehension with associated activation or arousal of
the autonomic nervous system." He further pointed out that high A-
Trait anxiety individuals are concerned with a fear of failure and

16
therefore more likely to perceive ego-involving situations as more
threatening than would a person who possessed low A-Trait
characteristics.
Sarson, Davidson, Lighthall, Waite and Ruebusch (144) provided
some background information for Spielberger in the development of
the state and trait anxiety theories. They stated that anxiety is
conceived by a person's self perception. The person who is charac-
terized as ego-centered and concerned about himself is usually found
to possess high levels of anxiety.
Newmark (119) did a comparison study of Spielberger's trait and
state anxiety and indicated that the real nature of state anxiety is
transitory while trait anxiety is more stable. His results revealed
that state anxiety was significantly changed by experimentally
induced stress, while trait anxiety measures remained fixed. In
addition, A-Trait measures seemed to reflect individual differences
in anxiety-proneness that were impervious to the environmental
stress of everyday living.
Despite the fact that state anxiety shows incongruity in anxi-
ety characteristics, there are still patterns of these traits that
can be identified. Levitt (98) indicated that State Anxiety may
express itself in at least four different modes:
1. A verbal report, spoken or written, that conveysvia ordinary language the message that the reporteris consciously experiencing fear;
2. Minor surface physical reactions such as pallor,
sweating or trembling, which are ordinary mani-fests;

17
3. Internal physiological reactions such as elevatedblood pressure and pulse rate, breathing, hormonal,
and gastrointestinal changes;4. Voluntary gross motor behavior or absence of behav-
ior ("freezing") most often taking the form of
withdrawal from, or avoidance of, a situational
task.
Martens (106) developed a situational specific modification of
the A-Trait as Competitive Trait Anxiety and defined it as a "ten-
dency to perceive competitive situations as threatening and to
respond to these situations with feelings of apprehension or ten-
sion."
The Relationship of Anxiety to other Nomenclature
Anxiety is a very complex psychological term and it has been
compared and related to several similar words. Sarason (139) sug-
gested that worry rather than emotionality produces performance
decrement. In his opinion, test anxiety may be conceptualized as a
proneness to emit self-centered interfering responses when con-
fronted with evaluative conditions and these personalized self-cen-
tered responses (worry) interfere with the performance of high test-
anxious persons. Sarason also noted that trait-state anxiety theory
attributes the performance decrements of anxious people to the acti-
vation of strong error tendencies by the high drive levels that are
associated with elevations in A-State.

18
Anxiety and Performance
Stress has long been identified and associated with anxiety
provoking forces. Brown (24) studied the effects of a stressor on a
specific motor task. The motor task involved a hand-eye coordina-
tion task on a rotor pursuit apparatus. Subjects in the control
group executed 15 ten-second trials on the rotor pursuit. The
experimental group performed the same tasks, except during each
trial noises from a tape recorder were played, which served as a
stressor. The Cattell 16 Personality Factor evaluated the subjects
and the results indicated that subjects with high confidence or
emotional stability were not affected in their performance on the
task by the loud noises.
Martens (104) reported a close relationship between arousal and
anxiety. He indicated that when an individual reaches extremely
high levels of arousal, both perceptual and motor processes become
disrupted. However, it is likely that moderate increases in arousal
will facilitate performance on a well-learned task. Zajonc (187)
concurred with Martens' analysis when his research revealed that
increases in arousal tend to elicit the dominant response (the
response more likely to occur). That is, when an aroused individual
is confronted with a stimulus that elicits a potential family of
responses, the response that is strongest in the repertoire of
responses is most likely to occur. Zajonc's research supports the

19
drive theory, which is one of the two main theories which explain
the relationship between changing levels of arousal (anxiety) and
performance. Oxendine contends that the drive theory is a
relationship of habit multiplied by drive. The basis of this theory
is that increases in drive increase the probability of the dominant
response being emitted. During the early stages of skill
acquisition the dominant response is likely to be an incorrect
response; but later with practice as the skill is mastered, the
dominat response becomes the correct response. Thus, increases in
drive (arousal or anxiety) early in the acquisition phase impair
performance, but later in the well-learned phase, increase the per-
formance. The second theory is the Yerkes-Dodson Law or the
Inverted-U Hypothesis. In this theory performance improves with
increasing levels of arousal to some optimum point. At this optimum
point, further increases in arousal cause performance decrement.
According to Oxendine (128) the Yerkes-Dodson Law implies that com-
plex tasks are performed best when one's drive or motivation is
relatively low, but optimum proficiency in simple tasks is attained
when drive is high. Thus, as the drive level is accelerated, per-
formance will follow to a point. Continued increases in drive lead
to a decline in performance, especially in complex skills.
A word closely associated with anxiety is fear. The existence
of a strongly perceived fear will contribute greatly to the buildup
of anxiety. Fear, as a goal-oriented motive, refers to the future,

20
but this is not true of anxiety. It is understandable, however,
that the two terms should frequently be used synonomously, since
fear consistently leads to anxiety and is perhaps more easily iden-
tifiable than other factors leading to anxiety.
Levitt also believed that fear should be distinguished from
anxiety. He believed there are two types of fear. One deals with a
factor of fear, the relative specificity of its stimulus. The other
is concerned with the emotion's basis in reality. It is his
contention that there is a difference between a specific, conscious
fear and what is called "free anxiety," although it is difficult to
separate these two forces distinctively. A specific fear, when it
occurs, is usually easily identified. To be afraid is painful, but
not to know why you are afraid can be catastrophic, because you are
then deprived of any avenue of escape from the treatening danger.
The research, generally, supports that high anxiety individuals
perform to a lesser extent under audience condition than do low and
moderate anxiety subjects (Ganzer, 54; Cox, 32, 33, 34). Vaught and
Newman (180) found that low anxiety subjects made fewer errors than
high anxiety subjects on a steadiness test when competition exag-
gerated the test conditions. Mandler (103) contends that complex
tasks usually present an explicit threat of failure to high anxious
people, which may produce interfering responses during performance
and cause a reduced skill level and lack of success. Many
researchers have found that high anxiety individuals in sports are

21
likely to suffer from a reduced effectiveness in both self-concept
and in poorer physical performance within a competitive contest.
Smilkstein (163) reported two groups of children are likely to
suffer repeated failure: The first group is composed of those who
demonstrate a low level of competence. The second group is composed
of children who perceive that their performance does not meet the
expectations of their peer groups, coaches, or parents. The child-
ren in the first group respond by getting better through practice
and the benefit of coaching or recognize their inabilities and try
other activities. Children in the second group require a more com-
plex solution to their problems. While some may thrive in a setting
of external expectations, many more, according to Smilkstein's
research, will become physiological victims of a system which
demands more than they are able to give. This research established
that children who were successful in athletics had positive self-
perceptions of their physical ability, while high anxiety is associ-
ated with those who had low esteem and low performance expectancy.
This anxiety may be compounded when athletes are part of a losing
team.
The presence of residual muscular tension has been implicated
as a detrimental influence on the performance and learning of motor
skills. French (51) sought to investigate the inhibiting and limit-
ing effects of muscular tension in the acquisition of fine motor
learning skills in regards to the effects of tension-controlled

22
training by use of EMG and performance on a rotor pursuit task. He
found that both EMG and augmented EMG and tension reduction training
both significantly contributed to better performances when compared
to that of a control group when employing the analysis of variance
as the statistical treatment. He concluded that the use of feedback
facilitates learning and performance more than non-treatment sub-
jects and that the combination of tension-reduction training with
EMG training led to the greater level of performance than EMG train-
ing alone.
Certainly, the suggestion that changes in anxiety-state as a
function of time to competition exists. Morgan and Hammer (116)
reported that the anxiety levels of varsity wrestlers were higher
one hour before a match as compared to pre-season baseline meas-
ures. This increased anxiety state was confirmed by Martens and his
colleagues and supported the contention that anxiety levels are
higher at pre-competition and mid-competition as compared to prior
measures.
Players who were high competitive trait anxious, who had low
self-esteem, and who had low performance expectancies perceived
greater threat and experienced higher state anxiety when facing a
pending competition than did those who were low competitive trait
anxious, who had high self-esteem, and who had high performance
expectancies as reported by Scanlan and Passer (150, 151).
A question exists as to the relationship between high, moder-

23
ate, and low levels of state anxiety and the level of attained
skill. Ganzer (54) and Cox (32, 33, 34) found low anxiety subjects
performed better under audience conditions than did high anxiety
subjects. Vaught and Newman (180) found low anxiety subjects (as
measured by manifest anxiety) made fewer errors than high anxiety
subjects on a steadiness test when competition exaggerated the test
conditions. However, Martens and Landers (110) found no interaction
between anxiety levels, competition, and failure. Generally, a
review of the research in this area supports Mandler and Sarason's
(103) contention that complex tasks usually present an explicit
threat of failure to highly anxious people which may produce inter-
fering responses during performance and causes a reduced skill level
of success.
Harrison (73) speaks to the characteristics that describe Type
A behavior as being possessed by an individual who eats rapidly,
speaks and walks rapidly, displays aggression and impatience, demon-
strates a sense of urgency and compunction about time, along with a
preoccupation with work and advancement and a high concern about
peer evaluation. These may be elements that are perhaps rehearsed
and learned in a sports setting and certainly mirror some of the
values of the competitive experience.
Friedman and Rosenman (53) definitely describe the above char-
acteristics along with time urgency in their definitive study on
coronary heart disease and Type A behavior.

24
Solomon (165) and his associates have clearly identified the
relationship involved in the breakdown of the immunological capaci-
ties of the individual and stress and emotions. The life and health
impact is dramatic as described by the characteristics described
empirically, and Solomon's hypothesis has drastic implications on
theories of pathological medicine and psychological and physiologi-
cal wellness.
Methods to Alleviate Anxiety & Relationshipsof Anxiety to Performance and Competition
Of the few investigations published dealing with biofeedback
particular to sports, the majority have sought to reduce muscle
tension (Bennett and Hall, 11; DeWitt, 44, 45). Daniels and Landers
(39) sought the use of biofeedback and improvement in shooting per-
formance in rifle marksmanship. Their choice of activity was based
upon the adaptability of the prone firing position and ease of moni-
toring a somewhat immobile subject. They found that biofeedback
training improved performance and that an increase in awareness
occurred of the autonomic functioning as measured by the Autonomic
Perception Questionnaire (Mandler, 103). The study may be somewhat
tenuous due to its extreme small sampling, as four subjects were
biofeedback trained in comparison to four individuals who occupied
the control/untrained group. Daniels and Landers concluded that ...

25
From these results it appears that the development of aself-monitoring system, through biofeedback, is benefi-cial in allowing individuals to perceive previouslyundetectable physiological patterns important for theirshooting success and to coordinate the motor act of
firing with these patterns.
Daniel DeWitt (42, 43) investigated whether a training program
which combined cognitive (relaxation) training and biofeedback
training would help athletes reduce competitive stress reactions and
improve competitive performance. De Witt reports statistically
significant differences between pre- and post-treatment comparisons
of performance ratings. This study is particularly dubious as
DeWitt relies on an unsophisticated measurement of subjects . . .
"in the treatment condition reported feeling more comfortable and
confident in discussions subsequent to the training." DeWitt's sub-
jects attended 12 bi-weekly, one-hour sessions. Each subject
received 30 minutes of EMG frontalis, masseter and/or trapezius
muscle feedback. Jacobson's (82) progressive relaxation procedure
was used in addition to EMG feedback. As subjects were able to
demonstrate an ability to maintain 2 microvolts, electrode place-
ment was moved to muscle areas identified by the subjects during the
initial assessments as being troublesome. Although DeWitt's report
indicates a reduction in EMG microvolt levels across sessions, he
surreptitiously evaluated "athletic improvement" through a scale
score collectively determined by a staff of coaches. "In general,
this assessment included: overall level of performance, consis-

26
tency, effort, errors, and execution." The ratings were obtained at
the beginning of the program, following a one-week baseline period,
and two weeks following completion of the sessions. The staff rat-
ings indicated that four of the six basketball payers improved in
game performance following the program. Although DeWitt has sought
to implement cognitive relaxation programs with augmented feedback,
his approach to gathering and analyzing data lacks any real mean-
ing. DeWitt might be hard pressed to justify how parameters of
"consistency, effort, and execution" can be statistically interpre-
ted and at best, smacks of a wet-finger-in-the-air assessment
style. Additional research is justified in this case to provide
real data that would hold up to rigorous scrutiny. DeWitt does
mention, however, the need for research considering personality
style and the relationship between factors such as extroversion-
introversion or external vs. internal locus of control and appropri-
ate intervention techniques.
A great many behavioral approaches to reducing fear and anxiety
in empirical studies have centered on systematic desensitization.
These treatments are usually based upon Wolpe's (185) classical
procedures. These involve relaxation training and visualization of
situations that evoke anxiety. Several investigators (83, 90, 102,
185) have shown scientific evidence that systematic desensitization
can notably lower levels of anxiety. Kukla (90) investigated the
effects of strictly progressive relaxation training upon athletic

27
performance during stress. The results were primarily positive, as
the relaxation treatment group had signifiCantly lower STAI A-State
scores than placebo or control groups. The study involved high
school baseball players and statistical results revealed that batt-
ing performances were significantly enhanced by relaxation tech-
niques. He indicated that progressive relaxation can be a useful
technique in decreasing arousal for athletes under stress and that
increased performance on a batting task may have resulted from an
increased ability to concentrate, thus screening out anxiety-produc-
ing stimuli.
Blacksmith (16) completed a study of pre-match anxiety condi-
tions among college wrestlers and the effect of systematic desensi-
tization on these states. The results indicated a disagreement with
most studies done in this area in that the treatment of systematic
desensitization failed to reduce state anxiety among collegiate
wrestlers.
McReynolds indicated that both the relaxation and exposure
elements of desensitization have been found to be individually suf-
ficient treatment procedures. Usually there appears to be two ele-
ments common to most treatment procedures. These elements are
either some form of exposure to or confrontation with fear stimuli
or instruction in coping or controlling fear responses. He men-
tioned that other systematic desensitization include modeling, shap-
ing or reinforcing practice, somatic conditioning, exposure, self-

28
instruction and rantional emotive therapy, and training in relaxa-
tion or coping skills.
Johnson and Spielberger (83) dealt with the effect of relaxa-
tion although their study centered on the passage of time on meas-
ures of state and trait anxiety. The results showed that A-State
measures which involved systolic blood pressure, heart rate and
Zuckerman's Affect Adjective Check List all declined due to the
effects of relaxation. In contrast, the A-Trait measures which
included the Manifest Anxiety Scale and the General Form of the
Affect Adjective Check List were essentially unaffected by relaxa-
tion training. These findings supported Spielberger's contention
that trait anxiety is a stable characteristic while state anxiety is
a transient and fluctuating state. A study designed by De Caria
(41) investigated the feasibility of cognitive rehearsal (progres-
sive relaxation training and mental practice) as a technique to help
athletes facilitate their motor performance in gymnastics. Cogni-
tive rehearsal moderately decreased the self-report of performance
anxiety and moderately enhanced gymnastic performance of the inter-
mediate subjects.
Endler (46) stated that most individuals who become aware of
the presence of anxiety or recognize an implied buildup of unassimi-
lated material carry on a variety of mental procedures in an effort
to cope with the manifestation. These procedures involve problem-
solving, worrying, self-analysis, rumination, working through and

29
mourning. These methods are different ways of looking at things
which permit assimilation of the unassimilated. In some cases,
unassimilated perceptions simply dissipate over a period of time.
Endler summarized their findings on alleviation of anxiety by stat-
ing that One can also reduce A-State by decreasing threat, or at
least, altering the person's perception of the threat so that he or
she perceives it as less threatening."
Ziegler, Linzing, and Williamson (188) studied the effects of
two stress management programs on the cardio-respiratory efficiency
of eight male cross-country runners. Based on a maximal oxygen
consumption treadmill run measuring heart rate and a subsequent
submaximal run at 50% of each subject's maximal ability, the sub-
jects were divided into three groups. The groups were: control,
stress innoculation training, and stress management training. The
subjects in the two training groups completed mental training pro-
grams, EMG relaxation training, cognitive coping strategies, and
guided imagery training. One group used Meichenbaum's Stress Innoc-
ulation Training (SIT) Program and augmented EMG feedback, along
with imagery themes individualized based on each athlete's needs.
In contrast, the second treatment group used Stress Management
Training (SMT) and EMG feedback, and cognitive coping responses were
developed. These techniques were then applied to a series of
disastrous track-imagery situations. As stress reactions developed,
the subjects were asked to allow the disastrous image to develop,

30
experience emotions and feelings, and then to control the reaction
through cognitive coping skills, relaxation responses, and positive
imagery.
At the conclusion of the treatment programs, all three groups
were again given the twenty-minute submaximal oxygen treadmill
run. Heart rates and V02 samples were taken periodically in the
run. Results indicated significant differences in cardio-respira-
tory efficiency between both groups and the control group but none
between the treatment groups. The SIT Program was a positive
imagery approach while the SMT was a negative imagery approach. The
athletes reported changes in their approach to running. The SIT
group indicated "more confidence and ability to control stress,"
little things did not get in the way of performance, and increased
appreciation for positive track experiences. Those in SMT reported
an increase level in handling "emergency stress" situations during
competition. The authors concluded, "Much research is still needed
to establish the effectiveness of techniques already developed, to
generate new stress management strategies, and to develop guide-
lines, warnings, and procedures that the coach and athlete can use
in their pursuit of performance enhancement.
It is the opinion of Ogilvie and Tutko (125) that the impact
that anxiety plays in the ability to perform or to compete against
other individuals is based upon each person's analysis and percep-
tion. Each situation, therefore, is individaully evaluated accord-

31
ing to the makeup of each person. The potential anxiety-producing
situation becomes a reality if the person feels threatened, appre-
hensive, possesses a lack of confidence or senses fear. In dealing
with the field of athletics, investigators are constantly concerned
with how athletes perceive various situations, how this perception
affects their anxiety level and finally how the anxiety might affect
performance. Ogilvie and Tutko conducted studies on problem ath-
letes which included those who possessed a high level of anxiety:
What anxious athletes share in common is an elevatedlevel of tension when compared to the non-anxious ath-letes. Instead of the gradual peaking experiences whichleads to the ideal mental and physical harmony for per-formance near true potential, it becomes obvious thatthere is too much tension too soon. As a consequence,we can expect disharmony, which leaves the athlete witha depletion of this energy and a reduction in true ath-
letic potential.
Ogilvie and Tutko (124, 125) strongly believed that athletics
and competition place individuals into a great number of situati ons
which can provoke fear and anxiety. Even though the nature of the
threats is an individual matter, the potential among athletes is
greater than among non-athletes. It was their contention that
failure in athletics forces individuals to redirect their thinking
or energy to eliminate further possibility of failure. Unfortun-
ately, failure acts as a harsh reminder that we are not good, are
unworthy, or not living up to what someone expects of us.
Provoking anxiety in individuals who are performing or compet-
ing is usually increased by the presence of others, Poteet and

32
Weinberg (132) indicated that in the early stages of learning a
complex skill the dominant response is most likely incorrect whereas
in the later stages of learning a simple task the dominant response
is more likely correct. Therefore, performance would be inhibited
by increases in arousal with the presence of others in the early
stages and facilitated in the later stages. Cox (32, 33, 34)
utilized second and third grade school boys in a study where
mothers, teachers and strangers provided the audience. He found
that low test-anxious subjects showed response increments whenever
any of the people served as an audience in the experimental room.
Conversely, the presence of mothers or teachers resulted in response
decrements in high test-anxious boys. Cox (34), in a later study,
found that high anxious children decreased their rate of performance
when in the presence of others. He suggested that the presence of
another person was interpreted as transforming the situation into an
evaluative one for high anxious children, causing their anxiety to
interfere with performance. On the other hand, low anxious children
assumed that an observer represented incentive for more efficient
performance. Ganzer (54) confirmed these findings and concluded
that low anxious children performed well and perceived spectators as
reinforcement.
Cottrell (29) proposed that the mere presence of an audience is
not sufficient to raise levels of arousal but instead suggested that
the audience must have the potential to evaluate. This potential is

33
the awareness by the audience of the criteria of excellence for the
task.
Alderman (1) indicated that athletes who participate in compet-
itive sports and who repeatedly expose themselves to these anxiety-
provoking situations are more likely to be characterized by lower
state anxiety than are non-athletes. In addition, the more success-
fully an athlete performs in a competitive situation, the lower
should be the amount of anxiety during competition, which in turn
would provide less interference with effective game performance.
Alderman establishes that individual sports competition is probably
a more anxiety-provoking situation, since an individual sports
everything depends upon the performer, whereas in team sports the
responsibility for success is shared by team-mates.
Investigators have found a variety of results when relating
anxiety levels to performance in different sports. Basler, Fisher,
Criag and Mumford (8) found no significant relationship for predict-
ing gymnastic performance from arousal and anxiety measures. Morgan
(115) found the same results in his study where few relationships
existed between pre-match anxiety levels and wrestling perform-
ance. Knapp (87) in constrast found that anxiety was detrimental to
the performance of novice collegiate gymnasts.
It has been generally accepted among sport psychologists (35,
37, 128, 1562 that well learned athletic performance, in essence, is
action requiring varying degrees of emotional performance. The need

34
for arousal depends upon the nature of the task confronting the
participants. Oxendine (122) indicated that a high level of arousal
is essential for optimal performance in gross motor activities
involving strength, endurance and speed, but it interferes with
performance involving complex skills requiring fine muscalar move-
ments, coordination, steadiness and general concentration. Further-
more, a slightly above average level of arousal is preferable to a
normal arousal state for all motor tasks. Spence and Spence (166)
concurred with Oxendine when they found that high-anxious persons
have many of the characteristics of individuals in a high drive
state. This would include greater difficulty in learning complex
tasks and greater facility in learning simple tasks.
When an individual has competed and gained success, investi-
gators (59, 95, 164) have stated consistently that state anxiety
decreases but increases with failure. The tremendous social
pressure on today's youth is particularly visable in athletic
competition. It appears that the competitive process involves
considerable evaluation potential that could provide threatening
information regarding one's competence and could result in negative
social appraisal.
Scanlan (147) found that high-competitive, trait-anxious men
perceived greater personal threat during competition than low-
anxious men, but that both groups preferred performing in the compe-
tition situation and sought evaluative information by selecting

35
opponents of equal or better ability. Levitt (98) concurred with
this perception of greater threats and added:
Anxiety-prone individuals tend to have chronically low
self-esteem, to have a poor self-image, to regard them-
selves as less desirable people than the norm. The
relationship between trait anxiety and self-esteem is
probably circular, a phenomenon that occurs along withother dimensions of human personality. A high predispo-
sition to experience anxiety lead to low- self-esteem,
which in turn increases the predisposition to become
anxious and so on.
Tenebaum and Milgram (178) correltated Spielberger's STAI to
three groups of student athletes participating in individual compet-
itive sports. Also involved were team competitive sports and indi-
viduals performing in non-competitive situations. The scores on the
STAI of each group were compared to a physiological measure of state
anxiety that consisted of metabolic rate. Press metabolic rate is
the number of heart beats under stress minus a person's basic meta-
bolic rate. The results of the study indicated that although the
trait anxiety of both individual and group competitors was lower
than that of non-competitors, the difference was not statistically
significant. They also found that team sports appeared to evoke as
much state anxiety as individual sports. This disagrees with the
investigators discussed previously.

36
Muscle Tension and Relaxation
Muscles have a response repertoire of one. All they can do is
contract; relaxation removes the response made to the muscles stimu-
lated by impulses carried via the motor neurons. Tension without
movement is the normal body reaction to any stressful stimulus.
Generally, muscle tension occurs when the organism is "aroused" or
"alerted" and the body is alerted to take action. This is often
cited as the "fight-or-flight" theory; this allows us to respond to
emergencies that are eminant.
Barbara Brown (23), in her text Stress and the Art of Biofeed-
back, states:
To understand the consequences of stress on muscle ten-
sion, we have to assume either that the social pressure
and tension are fairly frequent if not almost constant,
or that the responses to it are frequent, if not sus-
tained. Spontaneous relaxation following increased ten-
sion occurs very slowly; even sleep is generally not the
answer, since subconscious memories can keep the muscles
tense during sleep, and dreaming may actually increase
the tension further. (pg. 35)
Brown further indicates that if after a stress episode an individual
continues to ruminate and mentally recreate the episode, two muscle
events may occur: muscle tension is sustained at a higher level
with possible further increases and also the increased tightness may
cause hyperactivity. A state of vigilance and inappropriate nonpro-
ductive alertness occurs that may eventuate a maladaptive coping
style through continued and unabated tension. Often, Brown

37
explains, tension messages are sent to the brain or central pro-
cessor and are often recognized as excessive. However, with con-
scious attention generally occupied with emotional and cognitive
situations, tension states are often only minimally recognized in
awareness. Brown explains that this is accounted for by the
cortical inhibitory effects, some active corticle process blocks
recognition of the increased tension. The muscles normal control is
inhibited and the cortical effect is to direct the muscles to stay
prepared for activity.
Brown has spoken of the mind-brain mechanisms that mediate the
physical affects of social stress receiving little scientific atten-
tion,
presumably because of the considerable difficulty in
documenting the elusive, poorly expressed, and often
unaware subjective state for use in correlating subjec-
tive changes with physiological changes. (p. 42)
Cade and Coxhead (25) believe that anxiety symptoms are also
relieved by the combination of EMG feedback and deep muscular relax-
ation. They contend that it is seldom that anxiety can exist in
such a state of relaxation.
The main and prime difference between self-awareness training
with and without biofeedback is that the former greately reduces the
time required to gain a deep state of relaxation. Further, it aids
that vital suspension of disbelief that opens the way for firsthand
experience and self-evidence of results. The latter method, i.e.,

38
without machines, has been carried on for centuries without techno-
logical assistance. The use of biofeedback instruments aids in
learning through the association of subjective feelings and the
carrying out of certain physiological operations. The transfer
occurs as later on, when the operation is desired to be carried out,
the subjective feeling is remembered and reconstructed. Each guided
imagery is for each individual as a separate and incomparable
experience that gradually enables one to realize and expand self-
awareness into self-control.
Ikeda and Hirai (81) found that subjects high on scales of
'internal perception' and 'imagery' are better at maintaining a
given level of electrodermal fluctuations than low scorers. They
concluded that this is probably because the use of imagery is
closely related to the presence of electrodermal fluctuations and
may have been reinforced through the use of feedback.
Cade and Coxhead (25) cite the relaxation response as the very
opposite of the fight or flight response of stress. These authors
delineate the physiological correlates of the relaxation response
as:
1. Decrease in oxygen consumption2. Reduction in carbon dioxide elimination3. Reduction in
a) heart rateb) respiratory ratec) blood pressured) blood lactatee) muscle tensionf) blood cortisone levels

39
4. Increase in perfusion of internal organs5. Increase of peripheral temperature in appendages6. Increase in apparent basal skin resistance which is used
as an accurate measure of extent of relaxation (p. 84)
All of these changes are associated with a decrease in the activity
of the sympathetic nervous system.
Cade and Coxhead state:
Without special training, subjective experience is no
guide to one's physiological state during any alteredstate of consciousness. For this reason....it is help-ful to employ some instrumental indication of the depthof the relaxation response. One's self-awarenessincreases so rapidly that the instruments can soon bediscarded. (p. 84)
Cade and Coxhead are not concerned with the spiritual benefits but
with the basic physical and mental benefits of the relaxation
response.
Dr. Herbert Benson (14), in his book entitled The Relaxation
Response speaks to the altered state of consciousness (ASC) that
accompanies a deep state of calm or rest other than that associated
with sleep. The four basic elements that are required are:
1. A Mental Device: A verbal or visual relaxationtechnique to shift from externally oriented thoughtto internally oriented imaging or mental activity
of the ASC which accompanies the relaxation
response.
2. A Passive Attitude: Distracting thoughts do occurduring the sense-awareness exercises but should bequietly disregarded. One should not overly attendto how well one is performing. Worrying is an
arousing activity which destroys the relaxationresponse by instead producing the fight-or-flightresponse.

40
3. Decreased Muscle Tonus: The subject should be in acomfortable position so that minimum muscular work
is needed. However, relaxation is sought and not
sleep.
4. A Quiet Environment: With decreased distractingstimuli, however, the object of the training is toachieve calmness and relaxation at will, no matterwhat the environmental conditions may be.
Benson feels that the now-established benefits of the relaxation
response, anxiety reduction and diminished psychosomatic ailments
related to states of overarousal can be greatly improved or com-
pletely cured within a few weeks of regular practice of relaxation
techniques. Anxiety, strain, tension, and aggressiveness diminish
while an increase in self-control results concommitently.
Relaxation and Biofeedback
Cade and Maxwell state:
The main goal for biofeedback trainees, therefore, is togain conviction through first hand experience of theeffects of their own other-than-normal state while beingmonitored . . .
(p. 87)
Further,
For beginners in biofeedback . . . it is very difficultto grasp the concept that our so called normal waking
state is neither the highest nor the most effectivestate of which the human mind is capable, that there areother states of vastly greater awareness which one canenter briefly and then return to normal living enriched,
enlivened, and enhanced. (p. 87)
Through the use of biofeedback, relaxation-response training, and
expansion of self-awareness and increased self-control become synon-

41
ymous.
A consideration for selection of biofeedback as a method of
treatment used alone or as an adjunct to relaxation is often the
somewhat inhibitive costs of instruments. Some researchers have
contended that relaxation techniques alone are as effective as
relaxation augmented with biofeedback. A question might then be
raised, why not do without feedback altogether? Relaxation training
such as Stroebel's (173) Quieting Response, Schultz's (154) auto-
genic training, Jacobson's (82) progressive relaxation, and Benson's
(13) relaxation training have little cost impact other than the
expenditure of the subject's time and ability to set aside 20 min-
utes a day.
A comparison was attempted in evaluating traditional relaxation
methods and use of feedback. Haynes, Griffin, Mooney, and Praise
(74) showed the EMG feedback and relaxation instructions were
equally effective in reducing headache severity, relative to a no-
treatment control group. There was no difference between the exper-
imental groups composed of feedback and traditional relaxation
method practitioners. Cox, Freundlich, and Meyer (31) used a con-
trol group that was administered a medication placebo, and evaluated
the effect of the placebo and feedback along with a separate group
utilizing relaxation methods. Their findings are consistent with
Haynes, et al.; the feedback and relaxation groups showed a signifi-
cant improvement over the control group believing to be getting a

42
muscle relaxant. Also, there was no difference between the feedback
group and the relaxation group. A four month followup maintained
the same findings in all three groups. An example where an apparent
superiority of relaxation over feedback is reported by Chesney and
Shelton (26), but Hutchings and Reinking (80) found feedback to be
superior to relaxation with respect to change in headache sever-
ity. Perhaps relaxation and feedback training separately is as
effective as that when used in combination one with the other.
Linda Tarler-Benlolo (176) discussed the roles of relaxation
and biofeedback training of headache patients as well as normal
subjects. She concluded that research documents positive results
for either biofeedback or relaxation programs used alone. In fur-
ther discussion, Tarler-Benlolo concludes that the best form of
training has yet to be determined, although a combination of relaxa-
tion and feedback may be best compared to use independently.
Tarler-Benlolo speaks to the conflict evident in that some subjects
report feeling relaxed but "did not seem to be consciously aware of
the finer or deeper levels of relaxation that they reached following
training as was evidence by physiological records. Tarler-Benlolo
extends that it remains to be seen whether relaxation and biofeed-
back interrelate. Coursey (30) also sought the interrelationships
of EMG feedback and its effect on relaxation, and found positive
results; EMG augmented information provided a subjective and objec-
tive base of information for the subjects with the biofeedback
groups.

43
Anxiety Reduction and Use of Biofeedback
In studies relating to EMG and State-Anxiety, the information
generally dealt with the control of the frontalis EMG levels. Ten-
sion and related anxiety had been shown to respond to biofeedback.
Several studies have shown that biofeedback has reduced self-
reported anxiety but to no greater degree than might be evidenced
through the use of relaxation or meditative techniques (Alexander,
White, Wallace, (3); Reiman, Isreal, Johnson, (10); Fee and Girdano,
(49); Sime and DeGodd, (161); Zaichowsky and Kamen, (186). However,
other studies have reported the feedback training of frontalis
activity is usually intended to reduce subjective anxiety. Leboeuf
(94) showed that lowered anxiety levels were only observed in intro-
verts, although both extroverts and introverts lowered their levels
of EMG activity. Shedivy and Kleinman (159) reported that feedback-
induced EMG level relaxation was not reflected in a change of sub-
jective tension, but Alexander (2) and Beiman, et al. (10) found
that State Anxiety was reduced by both feedback and relaxation
groups.
The question of whether the reduction in self-reported levels
of both trait and state anxiety on non-clinical subjects can be
effected by the use of biofeedback and alternative treatment pro-
grams was investigated by Heibert and Fitzsimmons (76). Their
research involved 40 subjects randomly assigned to one of four

44
treatment groups using biofeedback and augmented training for stress
reduction. Analysis of variance of the results of these treatments
indicated that the experimental groups benefited from the treatment
as indicated by anxiety reductions, and that the treatment group
utilizing EMG feedback demonstrated the greatest anxiety decrements
on both measures of anxiety. Adding cognitive techniques to the EMG
training did not produce a more powerful effect than using EMG feed-
back alone.
LeBoeuf and Wilson (94) suggested that the use of relaxation
and images help in the maintenance of the change. They found that
the subjects who used images retained their lowered EMG levels to a
greater extent than those who did not use images during the biofeed-
back training process. The evidence suggests that in a group of
non-anxious (i.e., non-clinically anxious) persons, feedback has no
distinct advantage over relaxation techniques when the EMG frontalis
levels are examined. Belief in personal control is obviously an
element in the ability to modify EMG levels, and speaks to the abil-
ity to modify muscle tension through self-regulation. The evidence
discussed above on the specificity of reduced State Anxiety and EMG
indicates that its value might be limited.
Grim (67), in 1971, was able to show that an amplified feedback
of breath sounds that allowed focusing of attention and control in
subjects was associated with a reduction in self-reported anxiety in
a group of non-patients.

45
Generally, it might be assumed that a relaxing technique that
is aimed at reducing muscle tension would be effective in alleviat-
ing or reducing symptoms of reported anxiety. There may be an indi-
cation that the relaxation technique for reducing tension may be as
effective as biofeedback. The contention of many of the practi-
tioners of biofeedback speak to the necessary combination of both
biofeedback techniques and continuance of relaxation and or imaging
programs for biofeedback to be a productive process in relieving
symptoms of anxiety.
Biofeedback has been promoted and used to aid relaxation in
treating anxiety. Stroebel (173) indicates that biofeedback can be
used as an adjunct to refine tranditional approaches. Lang (92), in
contrast to many studies, maintains that after reviewing basic
research on heart rate control, biofeedback should not be used as a
routine treatment for anxiety. According to Gatchel (56), along
this line, there are no adequate assessments of the value of bio-
feedback in treating fear and anxiety.
Most of the studies which have looked into the subjective
information as reported by subjects, speak to the conditions and
feelings of general relaxation sensations and a feeling of pleasant-
ness that correlated with increase of Alpha (Kamiya, 85; Brown, 21;
Nowlis and Kamiya, 123; Schneidler and Lewis, 153. Brown's (22)
studies indicated that a reduction of Alpha or a like increase in
Beta is associated with feelings of tension or over-alterness (Beta

46
= Tension). Grynol and Jamieson (68) found a decrease of reported
anxiety in subjects who had increased their Alpha levels and a con-
sequent increase in reported anxiety with those who had learned to
suppress Alpha. It would appear that there may be a relationship
between high Alpha and subjective sensations and a decrease in
levels of self-reported anxiety. Whether the relationship is causal
may not be known or assumed due to the factor of expectancy.
Haynes, Moseley and McGowan (74) tested the hypothesis that
general relaxation reduces frontalis tension. The study found that
after one experimental session, auditory analogue feedback of fron-
talis activity was better than false feedback or progressive relaxa-
tion in the reduction of tension in the frontalis. However,
Alexander (3) examined the use of auditory analogue feedback to see
if an associated reduction in frontalis activity was related to
overall relaxation. He found that the control of EMG activity was
specific to the frontalis and that there was no change registered in
the forearm extensor EMG readings. Alexander's study differs from
Haynes, Mosley, and McGowans' in that he was testing the opposite
hypothesis, that frontalis feedback aids and assists in general
relaxation. Alexander's study seems to indicate that training on
reducing EMG tension in the frontalis is quite specific and builds
skill and control to that area exclusive of the other muscle areas
as examined in relation to the forearm extensors. Obviously, it is

47
difficult to compare these studies as they do not involve the same
amount of treatment sessions or involve the same total duration of
treatment.
Electrode Placement
Whatmore and Fisher (182) dealt with the strategic placement of
electrodes on subjects and the ability to generalize from a specific
site placement and the effect of levels of relaxation of other mus-
cle masses. In particular, they discovered that there is no signif-
icant relation or correlation in the level of microvoltage in the
frontalis and the relation in other skeletal muscles. However, they
espounded that initial training of a relaxation response with the
frontalis site as placement for the positive electrodes was justi-
fied in training sessions for the purpose of establishing positive
indication to subjects on the veracity of the use of feedback and
the ability to monitor self-regulation. Whatmore and Fisher
determined that placement of electrodes on various sites such as the
shoulder girdle to include the trapezius was more productive, as a
general relaxation response could be determined through the use of
the feedback instruments and that this site placement more nearly
generalized to the various other sites with the exclusion of the
frontalis. Shedivy and Kleinman (159) and Sime and DeGood (161)
investigated the ideal location of electrodes particular to the

48
frontalis and recommend that a site other than the frontalis be used
for purposes of general relaxation.
Further investigation into the placement of electrodes and
their ideal sites was investigated by Suarez and Kohlenberg (174)
whose findings coincide with Whatmore and Fisher. These reporters
utilized various sites and EMG readings to determine that with 150
clients of the Biofeedback and Stress Management Clinic in Seattle,
Washington, that the frontalis was not generalizable to the effects
of overall relaxation and that the bilateral placement of electrodes
on the trapezius groups gave a significant reading and hence were
accepted as site of choice in determining the generalizability of
this muscle group to overall senses of relaxation in stress reduc-
tion training.
Heart Rate and Anxiety
Gatchel and Proctor (61) evaluated and examined speech anxiety
in a group of students. They found that two sessions of visual
analogue heart rate feedback produced reductions in resting heart
rate, a lowering of reported speech anxiety (when required to speak
in front of a group), and a reduction in anticipatory heart rate
increase prior to a speech.
Perski and Engel (131) reported interesting findings with dir-
ect implications to the sports field in their research on heart rate

49
reduction during exercise. Ten subjects exercised on a bicycle
ergometer for five sessions, half of the group was asked to slow
their heart rate while exercising with the use of heart rate feed-
back as their source of information. Their average heart rate
increase was 20% less than that of the control subjects who exer-
cised without feedback. Systolic blood pressure was not affected by
the feedback training, although the researchers maintained based on
their research, that autonomically mediated adjustments to exercise
can be brought under experimental control through the use of appro-
priate behavioral techniques.
Reduction of Blood Pressure throughUse of Biofeedback
Hager and Surwit (69) determined that there was no significant
reduction in diastolic blood pressure measures for a group of sub-
jects who participated in various treatment groups under their con-
trol. They established that using various techniques employing
biofeedback and augmented relaxation techniques can significantly
reduce the higher systolic blood pressure measurement but may not
reduce the levels of the lower diastolic measurement as might be
suggested in other research.
McGrady and Yonker (101) investigated the use of feedback and
its effect on blood pressure and other biochemical parameters in 38
subjects with essential hypertension. Training consisted of eight

50
weeks of biofeedback and home practice of relaxation exercises.
Mean blood pressure decreased in the experimental group from 144/90
to 133/84 mm Hg while the control group remained unchanged.
Statistically significant decreases in the experimental group also
occurred in muscle tension levels, in plasma aldosterone, and in
urinary cortisol, which are secreted by the adrenal cortex thus
indicating an effect on the autonomic nervous system. These
researchers established that the experimental group produced a
reduction in skeletal muscle tension and a decrease in stress
responding mediated by the adrenal cortex.
Williamson and Blanchard (183) found dramatic changes for the
better in relation to reduction in blood pressure measurements in
both hypertensive and normal subjects when utilizing augmented bio-
feedback techniques along with accepted meditative and relaxation
programs. However, these researchers reported that a continuous
drop in both systolic and diastolic blood pressure measurements did
not occur in individuals who did not continue to exercise or utilize
the program and hence they advised the use of a maintenance program
much in the sense of homework to assure the continuance of the
reported benefits. They further extended their conclusions to
include that excessively high readings for individuals would likely
be reduced more efficiently than those of individuals with low
blood-pressure readings in both systolic and diastolic blood pres-
sure.

51
Expectations
Bradley and McCanne (18) supported their hypothesis that the
level of expectancy in subjects may govern the success of training
and either increase or inhibit the effect of relaxation training.
Heart rate and electraldermal responses were recorded during prac-
tice of a relaxation technique while the subjects were subjected to
the viewing of a stressful film on industrial accidents that con-
tained vivid and explicit material. These researchers maintained
that the subjects expectancy level concerning mediation may affect
cariovascular responses during stress.
The evidence supports, to a minor degree, that there is an
expectancy factor operating (Walsh, 181; Valle and Levine, 179)
which found that reported subjective feelings were given even though
some subjects were given non-contingent feedback. However, Lynch et
al. (99) found that a group of subjects receiving non-contingent
feedback actually did evidence an increase in Alpha which indicates
that changes may not be solely reliant on expectations.
DeGood, Elkin, Lessin and Valle (42) in 1977, were able to show
that it is possible to produce change simply be expecting to produce
change in regards to biofeedback. Those with prior knowledge about
enhancement or suppression of Alpha in EEG were able to show
change. However, the studies also indicated that there was no sig-
nificant differences in actual EEG changes between the experimental

52
and control groups; consequently, change in ability to enhance or
suppress Alpha was demonstrated by the naive or unknowledgeable.
Hardt and Kamiya (71) showed that low anxiety individuals were bet-
ter at enhancement of Alpha over seven training sessions than were
high anxiety individuals. The conclusion was reached that Alpha
enhancement reduces self-reported anxiety and that suppression of
Alpha increases anxiety in high trait subjects.
Locus of Control and Its Measurement
There is an indication of wide variability in subjects and
response to biofeedback that indicates that perhaps other factors
may be contributing to the reported subjective evaluations of
reduced feelings of tension and anxiety. The term "locus of con-
trol" is used to describe the persons who reflect the extremes of a
dimension or continuum that can be labeled as "externals" and
"internals" in regards to locus of control. Julian Rotter (136)
describes that some people have low expectations for success in
particular situations and that these expectations generalize to
other areas of the subject's life. Rotter describes those people
having the belief that they have power to affect the outcome of
situations as having "internal locus of control," while those who
think that they have little control over events or outcomes are
described as "external locus of control" individuals. From Rotter's

53
viewpoint, the work of the therapist is to teach the client or sub-
ject to take responsibility for change by restructuring the way they
think about the situation and by teaching them to perform new and
adaptive behaviors. His scale is used to identify the external and
internal locus of control, and obviously speaks to the extent that
subjects perceive themselves as having or lacking a sense of mastery
or control.
Rotter defines internal-external locus of control in the fol-
lowing way:
. . an event regarded by some persons as a reward orreinforcement may be differently perceived and reactedto by others. One of the determinants of this reactionis the degree to which the individual perceives that thereward follows from, or is contingent upon, his ownbehavior or attributes versus the degree to which hefeels the reward is controlled by forces outside ofhimself and may occur independently of his own actions .
. . . a perception of causal relationship need not beall or none but can vary in degree. When a reinforce-ment is perceived by the subject as following someaction of his own but not being entirely contingent uponhis action, then, in our culture, it is typically per-ceived as the result of luck, chance, fate, as under thecontrol of powerful others, or as unpredictable becauseof the great complexity of the forces surrounding him.When the event is interpreted in this way by an indi-vidual, we have labeled this a belief in external con-trol. If the person perceives that the event is contin-gent upon his own behavior or his own relatively perman-ent characteristics, we have termed this a belief in
internal control.
Internals, to a degree on the continuum, believe that they can
control their destiny; consequently, it would be logical that these
individuals would have a greater ability to learn biofeedback and/or
54
relaxation techniques which are predominantly learned self-control,
and that they might do better in contrast to the "externals." This
was shown to be the case in experiments by Johnson and Meyer (84),
and Goesling, May, Lavond, Barnes, and Carreira (64) in regards to
Alpha enhancement with use of EEG experiments. However, Ray (134)
showed that externals are better than internals at decreasing heart
rate levels, but internals are more proficient at speeding heart
rate. Gatchel (57) confirmed this but found in addition that this
was only early on in the experiment and that there was no
differences between the groups later into the treatment periods.
Zaichowsky and Kamen (186) also found a relationship between locus
of control, biofeedback, and mediation; internalizers were described
as better capable of monitoring biofeedback instruments.
The scale is self-administered and can be completed in about 15
minutes. The scale has been most frequently used with college stu-
dents, but has been used with adolescent and older subjects. No
upper or lower age limits have been established.
Measurement of Anxiety
Anxiety can be measured by physiological, psychological or
behavioral methods. Martens (105) indicated that "Physiological
methods include analysis of brain potentials, skin resistance,
cardiovascular activity, electromuscular potentials, body tempera-

55
ture and biochemical changes." The physiological component of the
A-State anxiety reaction has been defined operationally as change in
galvanic skin response, systolic blood pressure (127), heart rate
(74) and other indicators of physiological arousal. Utilizing a
physiological method to determine anxiety and A-Trait presents some
limitations which may make it unfeasible to apply. Hodges (77) did
a review of psychological abstracts for approximately a three-year
period and only 7% of the 794 studies indexed under "anxiety" used
any physiological variables as a major dependent variable. He sug-
gests that the necessity of utilizing expensive equipment may limit
the feasibility of this type of experiment.
The psychological self-report inventory of anxiety has been
employed the most frequently because of its ease of administration
and its higher reliability as found in various studies (166, 170,
178,192). The first trait anxiety measure to come into general use
was developed by Taylor in 1951 and published two years later
(177). His Manifest Anxiety Scale is one of the larger number of
various kinds of inventories developed from the 550 items of the
Minnesoata Multiphasic Personality Inventory. In its day, the MAS
was a popular instrument that was employed in more than 2000
experimental investigations (169). The Manifest Anxiety Scale is a
measure of "reactive" anxiety. Thus, the MAS reflects the tendency
to respond under stress with heightened state anxiety to each
individual's high level of trait anxiety. This state anxiety could

56
be experienced constantly or chronically.
Zuckerman (190) developed an Affective Adjective Check List in
1960 which gained national attention as a viable anxiety inven-
tory. His check list is one of the most widely used measures and
his AACL is composed of 11 anxiety-positive adjectives and ten anxi-
ety-negative adjectives. The check list was changed to differenti-
ate state from trait anxiety simply by altering the instructions.
The respondent is asked to indicate how he/she feels right now or
today. Zuckerman utilized words used frequently by anxious parents
and by normals in hypothetical suggested anxiety states to describe
their current mood.
One of the most popular general trait anxiety measures is the
State-Trait Anxiety Inventory (STAI) developed by Spielberger in
1966 (170). Since that time it has undergone several revisions and
was finalized in 1970 (166). The STAI was both a trait and a state
anxiety inventory. Martens (104) concluded that the "STAI is the
most sophisticated anxiety assessment instrument from both the theo-
retical and methodological standpoint." Spielberger believed that
traits may be measured by questionnaires that will predict state
responses to situations perceived as relevant. However, he also
noted that prediction from anxiety measures is limited to certain
types of stress situations such as ego or failure threat as opposed
to impersonal threat of pain.
A number of investigators (107, 78, 192) suggested that situa-

57
tional specific trait anxiety measures are better predictors of
elevation in state anxiety in relevant situations than are general-
ized measures of anxiety traits. These investigators also concurred
that self-ratings of behavior probably exaggerate the degree of
relationship between different kinds of responses. For example,
most persons assume that when they feel emotionally aroused, all of
their autonomic reactions are increased in direct proportion to
their subjective feeling of arousal. Psychophysiological studies
indicate that this assumption is highly oversimplified (78).
When comparing the relationship between trait and state anxiety
inventories, Zuckerman and Lubin (191) reported moderate correlation
between the Taylor (177) Manifest Anxiety Scale (TMAS) and the MAACL
(183) state anxiety scores. It was also reported that the STAI
measure had a high correlation with Cattell's IPAT and the TMAS,
plus a moderate correlation with the MAACL.
Spielberger reported that there was a moderate to high
correlation between his STAI trait and state forms given on the same
occasion to the same people.
Distinguishing between trait and state evaluatory devices cre-
ates some confusion. Zuckerman suggested a number of criteria by
which trait and state tests can be differentiated:
1. Trait and state tests should have high internalconsistency or item reliability, but trait testsshould show high-retest reliability whereas statetests should have low-retest reliability. It is
assumed that state fluctuates over time as a func-

58
tion of external events affecting the individual.
2. Trait and individual state tests that propose tomeasure the same construct should correlate to adegree, but valid trait tests should correlatemoderately with the mean of a number of statetests.
3. A valid trait test should correlate more highlywith other trait measures of the same constructthan they should correlate more highly with otherconcurrent measures of state, such as automaticarousal or performance decrement, than with traitmeasures.
4. Trait tests should not change with transientchanges in conditions while state tests should besensitive to immediate conditions that are expectedto affect the relevant construct.
Ogilvie and Tutko developed a personality instrument called the
Athletic Motivation Inventory (AMI). Martens pointed out that they
have gained wide public acclaim through their assertion that they
have been able to identify with the AMI unique personality profiles
of very successful athletes. Based on their assertion, they offer
for a fee to assess athletes' personalities. From this information
they will predict success as well as suggest to the coach ways to
handle an athlete in order that the athlete may maximize his
potential.
The AMI assessed 11 different personality traits, of which
several relate closely to anxiety. The construction procedures of
the questionnaire have never been published, except that the ques-
tions were based on the Cattell- 16 -PF, the Edwards Personal Prefer-
ence Schedule and the Jackson Personality Research Form (107).
59
It appears that differences existing in general A-Trait between
athletes and non-athletes are only minimal (107). Ogilvie (118)
provided the most persuasive evidence for the existence of a rela-
tionship between sport and competence and A-Trait, although his data
remains unpublished. In his review of literature for sport
personality, he concluded that athletes, particularly superior
athletes, have a unique and identifiable personality profile.
Superior athletes are emotionally more stable, have lower levels of
A-Trait and greater resistance to emotional stress. Other
investigators (104, 110), however, found that there were no
consistent differences in A-Trait among participants when compared
with nonparticipants or among participants of different skill
levels.
Measuring anxiety prior to competitive situations presents a
difficult obstacle to researchers. Almost all sport personality
research has used the trait approach. This system is based on the
assumption that personality traits are relatively stable, consistent
attributes that exert generalized causal effects on behavior. This
original view of traits characterized them as having widespread
influence on behavior with little or no concern for situational
determinants, making them primary determinants of behavior. How-
ever, consideration for human behavior in terms of each situation
must be taken into account. Martens (105) indicated that traits
should be categorized as tendencies or predispositions to perceive

60
or respond to certain classes of situations with certain behav-
iors. Traits are not necessarily the primary determinants of behav-
ior.
The inconsistent findings of researchers in the relationship
between general A-Trait and various behaviors have added further
cause to seek a measuring tool that can evaluate specific competi-
tive situations. Spence (166) explained in support of this conten-
tion: In general, situation-specific trait anxiety measures are
better predictors of elevations in A-State for a particular class of
stress situations than are general A-Trait measures."
Martens' (107) Sport Competition Anxiety Test is a situation-
specific construct, especially developed to identify A-Trait dispo-
sitions in competitive sport situations. According to Martens, the
Sport Competition Anxiety Test (SCAT) for a competitive situation
appeared to have a better ability to predict an A-Trait anxiety than
Spielberger's State Anxiety Inventory. The development of the Sport
Competition Anxiety Test evolved from an investigation by Mandler
and Sarason (103) and later by Sarason, Davidson, Lighthall, Waite,
and Ruebsuch (144).
The SCAT inventory is a specific modification of the A-Trait
construct developed by Speilberger. Martens summarized his
justification for developing the Competitive A-Trait as follows:
1. The recognition that the interaction paradigm forthe study of personality is superior to the traitand situational paradigms.

61
2. The recognition that situation-specific A-Trait
instruments have superior predictive power when
compared to general A-Trait instruments.
3. The trait-state theory of anxiety which makes the
distinction between A-Trait and A-State.
4. The development of a conceptual model for the study
of competition as a social process.
Reed
From this review, the question arises, is biofeedback training
effective in reducing self-reported anxiety in a sports setting? Is
biofeedback control enhanced by the learning of a Quieting Response,
relaxation program, and is it evidenced by an increased ability to
monitor physiological measurements through self-control?
The information that exists supports, generally, the notion
that High State and High Trait Anxiety in sports is likely to
accompany a reduced effectiveness in both physiological and psycho-
logical self-concept and in coping abilities within a competitive
contest.
Because of the nature of the interdependent aspects of per-
ceived success, self-concept, and Trait Anxiety levels in athletes,
a clear need exists to develop coping skills that may enhance aware-
ness of physiological responses and reduce High Anxiety levels.
Even the strongest critics of research in biofeedback do not
want to see it abandoned; they only seek demystification and a shift

62
to the "real world." Beatty and Legewie (9) have written . . .
"Biofeedback . . . may play some part in the study of man and in the
treatment of human disorders. That part may not be large, but in
selected areas it may be important."
Some research indicates that biofeedback adds little to the
benefits of meditation or general relaxation techniques in the
treatment of tension headache, high blood pressure, and other
stress-related disorders. However, biofeedback may yet prove valu-
able in controlling anxiety specific to athletic competition. It
might aid athletes to learn to sense unnecessary arousal and levels
of tension that are indicators of sports competition anxiety and
all them to recognize how it feels to be relaxed through objective
rather than subjective feedback. Other athletes may recognize that
changes can be made in relationship to Trait/State Anxiety through
monitoring effects of emotions, thoughts, and events on physiologi-
cal responses.
Garcia and Rusiniak (55) have intimated that feedback signals
used in most biofeedback procedures have been too neutral; they feel
that reinforcements should give more pleasure to the learner/sub-
jects. This magnitude of reward would serve to strengthen the dura-
tion of change and increase the likelihood of continued practice of
skills. Certainly, an athlete who displays high-anxiety behavior
can garner and appreciate the sense of coping, control, and well-
being as positive reinforcers that may be possible through utiliza-

tion of relaxation and biofeedback.
with:
63
Runck concludes her assessment of biofeedback and treatment
Beyond the task of strengthening the clinical applica-tions of biofeedback, researchers of the future havenumerous other challenges: determining how biofeedbackworks--when it works; comparing it to alternate treat-ments for specific disorders; weighing its costs and
benefits to the patient and the community; and judgingits safety. Until this knowledge accumulates, biofeed-back should be regarded--as should most treatments formental and physical disorders--with cautious optimism.

64
CHAPTER III. PROCEDURES
The purpose of this study was to determine the singular and
combined effects of progressive relaxation and biofeedback
monitoring upon anxiety and other psychological and physiological
variables in a selected group of subjects in a specific sports
setting.
The program was designed to be administered over a six-week
sequence. The psychological assessments utilized as pre and post-
test measures were the Spielberger Trait Anxiety (STAI) measure, and
Rotter's Locus of Control (IE) test. Both of these assessments
appear in the appendices along with the scoring methods and
references. In addition to these psychological tools, the Sports
Competition Anxiety Test (SCAT) was administered as a pre, post-I
and post-test II assessment to determine State Anxiety as measured
one hour prior to three scheduled track and field duo meets, the
pre-test SCAT was administered prior to the beginning of the
experimental program to establish a baseline measure for all 36
subjects before they were randomly placed into one of four groups.
The SCAT was administered prior to participation in the treatment
program as was the STAI and IE measures.
In addition, various physiological assessments were taken that
are, according to the supportive research, indices and measures of
State Anxiety. Blood pressure and resting heart rate was collected

65
one hour before competition and prior to the warm-up at the same
three duo meets discussed above. The blood pressure and resting
heart rate (BPM) was measured by use of the Time Digital Readout
Blood Pressure Monitor, a portable unit and cuff device that is a
sphygmomanometer used in both hospital and research settings.
EMG monitoring by biofeedback was accomplished through use of
the Autogen 1100 Myograph at a band pass setting of 100 to 200 Hz.
The EMG I and EMG II readings by use of the Autogen 5100 Digital
Integrator that measured the time-averaged performance of each
subject over two two-minute periods, these measurements were
independent of the analysis feedback. EMG I denotes the microvolt
level averaged over the first two minutes of the pre, post-I and
post-test II sessions, EMG II indicates the data representing the
time-average electromygraphy readings for the last two minutes of
the pre, post I and post-test II sessions. All pre-measures were
gathered prior to the beginning of the various treatment strategies,
except for the pre EMG I and EMG II measures that were gathered at
session number one of the twelve relaxation sessions.
The appendix gives pertinent information and
instruction/references for the paper/pencil instruments. The
dependent variables are STAI, SCAT, the I-E Locus of Control Test,
systolic/dyastolic blood pressure, resting heart rate, and EMG
levels.
66
Population and Sample
The subjects were 36 male competitors in the varsity track and
field program at Willamette University. This group was selected for
study due to the nature of the individual sports setting that puts a
priority on the attendant stress and pre-competitive affective
feelings expressed prior to the meet experience, as noted often in
the literature and as related to the inverted-U hypothesis. A call
for volunteers was given that complied with the basic elements of
"informed consent" as put forth by the Office of Dean of Research at
Oregon State University. The basic elements of informed consent
that were presented to the group during the call for volunteers
included; a fair explanation of the procedures to be followed, a
description of the attendant discomforts and risks, a description of
the benefits to be expected, an offer to answer any inquiries
concerning the procedures, and instruction that the subjects would
be free to withdraw consent and to discontinue participation in the
project or activity at any time. These points were shared with the
subjects during the call for volunteers along with the information
contained in the subject's Quieting Response Training Packet
(Appendix).

67
Experimental Procedures
Baseline data was collected prior to the onset of the various
treatments, a period of 6 weeks of treatment sessions occurred for
the experimental groups, data was collected on all groups after the
12th treatment session for all variables.
Post-test II was administered two weeks after cessation of the
treatment programs during which time no instruction took place for
any of the experimental treatment groups or for the control group.
A post-test II assessment session to determine EMG levels was also
administered two weeks after cessation of the treatment programs
using the previously described Autogen 1100 and Autogen 1500 Digital
Monitor.
The subjects, based on a table of random numbers, were divided
into one of four treatment cells, each group or cell contained 9
subjects. The first treatment cell or group received the "Quieting
Response" relaxation program that consists of a set of cassette
tapes (Appendix). This group was labeled QR to denote its subjects
and treatment and participated in the six week treatment program set
forth in the "Summary of the Eight Exercise Elements" as described
in the "Quieting Response" manual (Appendix). This group, as the
other treatment groups and control, met for a total of 12 one-half
hour sessions, and was pre and post-tested for STAI, SCAT, I-E Locus
of Control, blood pressure, and resting heart rate. A final post-

68
testing (post-test II) of the dependent variables occurred two weeks
after the cessation of the treatment programs.
The second treatment group (QRBF) received the same Quieting
Response program with the addition of EMG augmented feedback. This
group received the same instruction in progressive relaxation and
was monitored by the Autogen 1100 Feedback Myograph during the
cassette presentations. This second group was identified as QR-BF
to denote the augmented nature of the treatment. The Autogen 1100
Electromyograph Monitor (EMG) was used to record subjects microvolt
readings of the trapezius group and the consequent muscular
activity. This initial session involved orienting subjects to the
EMG unit and was used to select auditory and visual feedback modes
to begin training. EMG readings without feedback were taken for 2
minutes after the start of the sessions and then taken during the
final 2 minutes of the sessions by use of the Autogen 5100 Digital
Intergrator that averages microvolt levels over pre-set periods.
The group labeled QR-BF & BF received the following information on
the use and purpose of the Autogen 1100 EMG unit:
Biofeedback involves the placing of a monitor between abody process, processes that can be monitored may besubject to learned control. The parasympathetic nervoussystem works in opposition to the sympathetic, it is themeans by which you relax. Biofeedback may teach us tobecome aware of relaxation at very subtle levels and mayexpand our awareness of the body processes and tune usinto our muscle tension. The activity of the skeletalmuscles is triggered by a pattern of electrical implusesoriginating in the central nervous system, the motornerve pathways terminate in the muscle fibers. Muscular

69
relaxation occurs when the electrical discharge rate isdecreased. EMG activity is expressed in microvolts
(millionths of a volt). Since muscular tension is pro-
portional to the degree of electrical discharge that
stimulates the muscle, EMG is a direct index of contrac-
tion or relaxation. The audio and visual feedback ofthe unit will inform you of the relative tension of themuscles being monitored. Based on the auditory and vis-ual feedback modes, at this time reduce muscular tensionby reducing microvolt readings and/or auditory tone.
The third treatment group received bi-weekly EMG biofeedback
for a total of 12 one-half hour sessions and was labeled as BF.
This biofeedback only treatment group was also instructed on the use
and purpose of the Autogen 1100 EMG unit according to the above
"script".
The control group, designated as CTRL, was administered the
assessment items and blood pressure and resting heart rate measures
as the three treatment groups. This control group, as the three
treatment groups, was EMG measured for the first two and last two
minutes of three separate sessions. In lieu of treatment, the
control group attended twelve one-half hour sessions that amounted
to a passive rest and listened to "music of choice". Generally, the
control group choose to listen to popular music via cassette or
radio.
Method of Analysis
The dependent variables are represented by the following:
1. Scores on the STAI-Trait

70
2. Scores on the SCAT.
3. Scores on the I-E Locus of Control Scale.
4. Systolic and diastolic blood pressure as measured by theSphygmostat Electronic Blood Pressure Monitor.
5. Resting heart rate.
6. Muscle tension readings on the Autogen 1100 EMG FeedbackMyography unit.
Scores for all variables were compared to post-test I and post-test
II scores using analysis for variance (ANOVA) technique (121) for
repeated-measures and results were considered statistically
significant at the .05 level of confidence.
Hypothesis
The null hypothesis states that there is no real difference
between means (g), that any observed significant difference between
the means for any of the groups must be of a magnitude in order to
reject the null hypothesis and conclude that the difference is real.
1. There is no significant difference, based on ANOVA, in STAI
measurements in each of the four groups from pre-to post-test I
and post-test II at the sixth and eighth week for any of the
treatments.
2. There is no significant difference in state anxiety as measured
by SCAT for any of the groups as measured one hour prior to com-
petition for each of the treatment and control groups.

71
3. There is no significant difference in I-E Locus of Control
measures for any of the four groups from pre- to post-test I and
post-test II for any of the treatment and control groups.
4. There is no significant differences in systolic and diastolic
blood pressure measures at pre-, post-test I and post-test II due
to the treatments.
5. There is no significant difference in resting heart rate measures
for any of the treatment and control groups at the pre-, post-
test I and post-test II assessments.
6. There is no significant difference in EMG tension for the various
treatment and control groups on the pre-, post-test I, and post-
test II assessments.
Data Collection
A. Anxiety Measurement-Trait
The Speilberger Trait Anxiety Test was used in this study as a
pre-and post-test. This instrument was used to gather self-report
information two weeks after cessation of the treatment. The test is4.1 D
a forty-item instrument that can be administered within ten minutes
including the reading of instructions (Appendix).
B. Triat Anxiety and Sports Competition (SCAT)
The Sports Competition Anxiety Test (SCAT) is an instrument
designed to measure specific Trait Anxiety within the Athletic set-

72
ting. It consists of fifteen items, five of which are spurious, and
can be administered within five minutes (Appendix). This item was
administered prior to warm-up at three competitive duo-meets along
with measures of BPM & BP.
C. Locus of Control
Rotter's I-E Locus of Control Test is a tool designed to
assess, within the context of the theory, Internalizer and Exter-
nalizer types and their specific style of interpretation of the
situational events. The test is regarded as both reliable and valid
in specific settings (Appendix). ,) 6/
D. Blood Pressure/Resting Heart Rate
The Time Digital Readout Blood Pressure Monitor was used to
assess this physiological measurement. It consists of a portable
unit and cuff device and can give accurate readings within ten
seconds. These readings occurred prior to warm-up at three
competitive duo meets.
E. Electromyographic Biofeedback
EMG monitoring by biofeedback was accomplished through use of
the Autogen 1100 and Autogen 5100 Digital Integrator; feedback of
the trapezius muscle groups may be accomplished through this dual
channel instrument. Electrode sites cited are generally, within the
literature, those that are associated with increased tension (159,
161, 174, 182). Electromyographic feedback is a technique in which
the electrical activity in a muscle is picked up and fed to the

73
subject in the form of auditory and visual means. By receiving this
feedback, the subject may learn to recognize muscle tension and
alter this tension on a cognitive level.
F. "Quieting Response" Program
The experimental subjects (QR and QRBF) participated in a
regularly scheduled relaxation program (QR) for one-half hour, twice
a week for a six-week period. Text and descriptions of the segments
of instruction material appear in the Appendix. The sessions were
under the instruction of the experimenter and included tape
cassettes. The "Quieting Response" was selected as the script/tape
format.

74
CHAPTER IV. RESULTS
The results of the statistical procedures used to test the
hypotheses are described in this chapter, data pertaining to the
formulation of the study and results of treatment procedures is
presented and discussed.
Descriptive statistics for the pre-test, post-test I, and post-
test II are presented in Tables 1, 3, 5, 7, 9, 11, 13, and 15, for
each of the variables. The results for the treatment groups were
compared by using a repeated-measures analysis of variance (ANOVA)
in comparison with the results of a control group design as outlined
by Neter and Wasserman (118). Further, an ad hoc test of
significance was administered as outlined by Winer (184) and Kirk
(86). The data was analyzed using the Statistical Package for the
Social Sciences (121), an Oregon State University computer package.
INTERPRETATION OF F RATIO (ANOVA)
If the null hypothesis has been rejected based on the F ratio
and the appropriate 1 tailed probability coefficient, the researcher
is faced with the problem of deciding which of the two or more means
are responsible for producing the significant F ratio. For this
purpose, a tool has been developed as explained by Neter and
Wasserman (118), and Kirk (86) called the Tukey test or the test of

75
honestly significant difference (HSD). The Tukey test is used as a
multiple comparison procedure that allows for the determination of
which mean or sets of means are significantly different so as to
justify a confident rejection of the null hypothesis for each
variable between treatment groups. In practical terms, if a given
mean difference is judged significant by the Tukey test, one can
feel safe in concluding that a true difference exists, more so than
would be the case if a subjective examination were employed to
determine whether the means differed. When retaining the null
hypothesis (it should be reinforced) the F ratio must not exceed the
.05 level of confidence. If it is judged that the null hypothesis
is accepted between treatment as based on interpretation of the F
ratio for treatment, the null hypothesis still stands even though
there may exist a significant difference within treatments as
indicated by a significant F ratio for "repeated measures" and
"interaction". Hence, the null hypothesis is retained even though
an F ratio existed that might have encouraged the researcher to
consider rejection. For purposes of discussion and the drawing of
conclusions, however, a significant F ratio may be discussed
appropriately in Chapter V.

76
Multiple Comparisons ofANOVA Between Treatment Groups
As briefly stated in the previous description of ANOVA for
multiple comparisons for repeated-measures between treatment groups,
solution for a Tukey coefficient value is necessary when it is
desired to determine where actual difference may occur between means
when examining treatment groups, one to the other.
Once an overall F ratio has been determined for the analysis of
variance, the treatment means are arranged in ascending order of
magnitude (Tables 2, 4, 6, 8, 10, 12, 14 and 16), tests of
significance for the between means are then computed by using the
Tukey test, which is:
2 * MSEtTs(D) = 1/11-2- q (1 - a, k, d.f.) 1/I
k -1(1)
Where: Ts(D) = Tukey coefficient
1/ 2 = constant of .707
q = table value
1 - a= 1 - significance level of .05
k = number of treatment cells
d.f. = degrees of freedom
2 = constant
MSEt= Mean Square Error for treatment measures
n = number of subjects per cell

77
Therefore: solving for the Tukey coefficient for significance
between treatment groups becomes,
2 * MSEt
TS(D) = .707 * 3.861/ k_14,n
Of the dependent variables, a significant F ratio for between
analysis of variance (ANOVA) was evidenced only for EMG II as
presented in Table 15 and 16. The data pertinent to interpretation
of Tukey test of significance appears in Tables 2,4,6,8,10,12,14 and
16, for all of the dependent variables.
Multiple Comparisons ofANOVA Within Treatment Groups
Often a significant F ratio is produced that indicates
retention of the null hypothesis where, in actuality a significant
difference may exist when within differences are examined but the
data is masked due to the combined treatment format. As stated
before, even though a significant F ratio may exist for "repeated-
measures" or for "interaction" as in STAI in Table 1, retention of
the null hypothesis is required. However, the fact that a
significant F ratio for "repeated measures" and/or "interaction"
occurs indicates that a treatment effect is being registered within
one or more of the groups that, according to Winer, warrants and
justifies further scrutinization. Hence, the further application of

78
the Tukey test is justified with an adaptation to its application
for within examination of treatment means.
The formula for the Tukey multiple comparison (HSD) procedure
for within treatment differences becomes:
* MSErTs(D) = 140(1 , b, d.f.)
Where: Ts(D) = Tukey coefficient
1/ 2 = constant of .707
q = table value
IN = significance level of .05
b = number of repeated measures
d.f. = degrees of freedom for repeated measures and forinteraction
MSEr = Mean Square Error for repeated measures
n = subjects per cell
Therefore: solving for the Tukey coefficient for significance
within treatment groups becomes:
2 * MSErTs(D) = .707 * 2.401/ ----g --L
Of the dependent variables, STAI, SCAT, IE, Systolic blood
pressure, and the EMG measures refelcted a significant difference
within treatment groups justifying further scrutiny for the purpose

79
of discussion as done in Chapter V.
Tests of significance for the difference within the treatments
is then completed by calculating the mathematical difference within
treatment means of pre-test, post-test I and post-test II
measures. If the differences between these means meets or exceeds
in magnitude ( Ts(D) the Tukey coefficient, it may be assumed that
the difference is significant within the treatment groups. If the
magnitude does not meet or exceed ( Ts(D) the coefficient, then any
difference is assumed to be chance and hence insignificant. The
Tukey coefficient value is identified by the designation of Ts(D) in
the tables and is represented by a numerical value in each case for
each dependent variable that reflects differences within treatments
for each variable.
Between and Within Analysis of Pre-Test,Post-Test I, and Post-Test II Measures
Mean scores for treatment groups were examined using the
analysis of variance technique for repeated-measures, results were
considered statistically significant at the .05 level. Further,
decisions of rejection or retention of the hypothesis are
strengthened by utilizing the "ad hoc" Tukey honestly significant
difference (HSD) test (86).

80
Trait Anxiety (STAI)
Repeated-measures analysis of variance (ANOVA) revealed no
significant differences between treatment groups on Trait Anxiety
(STAI) measures. Consequently, the null hypothesis is retained.
Examination of the F ratio and employing the Tukey test reveals
significant differences within treatment groups as indicated by an
"interaction" F ratio that is significant at the .0279 level.
Examination of Table 2 reveals a significant difference within means
when pre and post-test measures are compared for QR, BF, and ORBF
but not for the CTRL group. The QR and BF groups are significantly
different when considering the pre and post-test I and post-test II
singly, and jointly. The QRBF group is significantly different from
the QR and BF group. The control group realized no significant
change from pre to post-test I and post-test II.
Neter and Wasserman and Kirk advise that the concept of
"interaction" be portrayed in a graphic manner, for this purpose the
Figures have been included in the result section to more easily
interpret this parameter. Interaction is shown to be occuring for
the Trait Anxiety variable by the F ratio of 2.55 (Table 1) which is
significant to a .0279 confidence level. Examination of Figure 1
indicates a drop in this measure with the QR and BF groups
decreasing their indices at a similar rate over time evidenced by
the similar and somewhat parallel configuration of these two

81
experimental groups. The QRBF demonstrates a more dramatic decrease
(supported by the significance level of .0279 for interaction in
Table 1) in this measure when compared to QR and BF and the CTRL
group. All three of the experimental groups display either
convergence (QR) or divergence (QRBF and BF) from the control
group. It may be assumed that while all experimental groups
experienced a significant reduction within their treatments
(repeated measures probability of .0019, Tables 1 and 2), the QRBF
group realized a greater effect or rate of change over time than BF
or QR alone. As a result, rate of change over time for QRBF
indicates this combined treatment tactic as the most beneficial of
the formats intended to decrease Trait Anxiety.

Cell means (7) for STAI scoresTreatment QR BF QRBF CTRL
STAI PRE 46.11111 40.66667 43.66667 42.00000
STAI POST I 41.33333 36.11111 36.44444 41.88889
STAI POST II 41.33333 36.33333 35.55556 41.77778
Cell standard deviations for STAI scoresTreatment QR BF QRBF CTRL
STAI PRE 12.26218 10.222252 7.71362 12.53994STAI POST I 13.74773 8.55050 9.05692 11.73433
ANOVA (Analysis of Variance) for Trait Anxiety (STAI)Source ofVariation d.f. SS MS F
ProbabilityLevel
Treatment 3 518.39815 172.79938 .53 .6662
Error 32 10469.48148 327.17130
Repeated Measures 2 437.01852 218.50926 19.13 .0019Interaction 6 175.12963 29.18827 2.55 .0279Error 64 731.18519 11.4277
Table 1Descriptive Statistics for Trait Anxiety (STAI)

Mean Differences Between Treatment Groups (Ts(D) = 13.4346
STAI POST I BF QRBF
Means 36.11111 36.44444QR
41.33333CTRL
41.88889
BF 36.11111 .33333 5.22222 5.77778
QRBF 36.44444 4.88889 5.44445
QR 41.33333 .55556
CTRL 41.88889
STAI POST II QRBF BF QR CTRL
Means 35.55556 36.33333 41.33333 41.77778
QRBF 35.55556 .77777 5.77777 6.22222
BF 36.33333 5.00000 5.44445
QR 41.33333 .44445
CTRL 41.77778
Mean Differences Within Treatment Groups Ts(D) = 3.830*
QR Diff. BF Diff. QRBF Diff. CTRL Diff.
STAI PRE 46.11111 40.66667 43.66667 42.00000
STAI POST I 41.33333 4.77778* 36.11111 4.55556* 36.44444 7.22223 41.88889 .11111
STAI POST II 41.33333 .00000* 36.33333 .22222* 35.55556 .88888 41.77778 .11111
Sum of Diff. 4.77778 4.33334 8.11111* .22222
* = significant to the .05 level of confidence
Table 2Mean Differences Within and Between Treatment Groups
for Trait Anxiety (STAI)
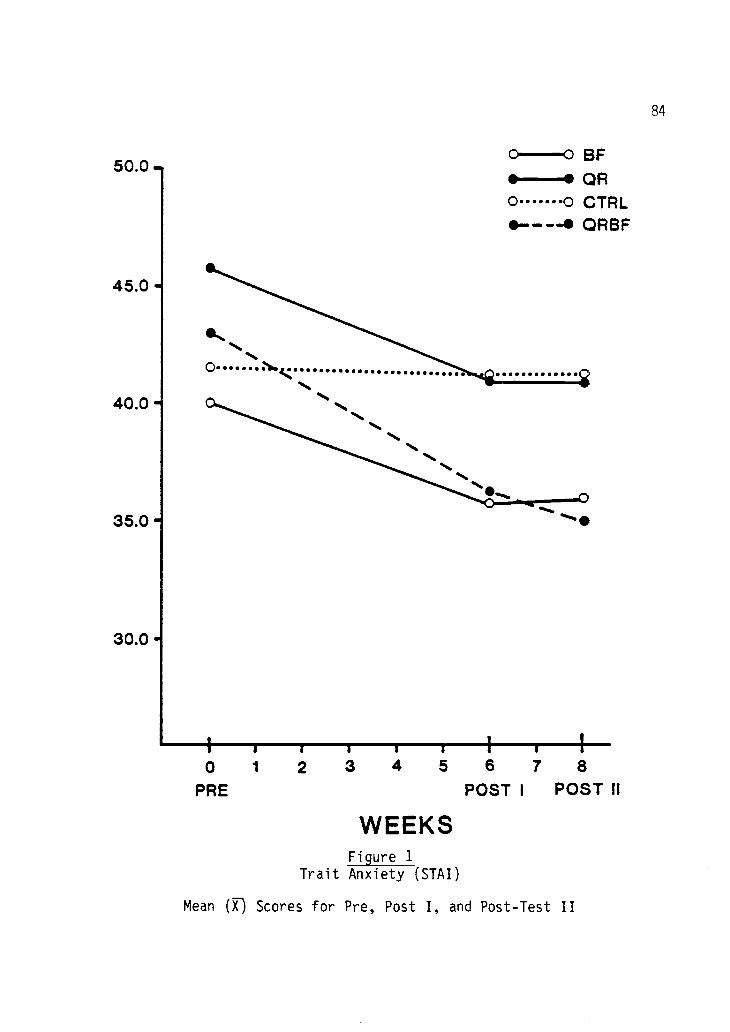
50.0 .
45.0
40.0
35.0
30.0
BFOR
0 0 CTRL0-40 QRBF
t I I I I r0 1 2 3 4 5 6 7 8
PRE POST I POST 11
WEEKSFigure 1
Trait Anxiety (STAI)
Mean (57,-) Scores for Pre, Post I, and Post-Test II
84

85
State Anxiety (SCAT)
There were no main effects or significant differences between
groups on State Anxiety. Thus the null hypothesis is retained. The
"repeated-measures" ratio of 9.25 in Table 3, reflects a significant
difference within treatment at the .003 level of confidence and
justifies further scrutiny by employing the Tukey test. Examination
of data in Table 4 shows that only the QRBF group realized a
significant change over time in pre, post-test I and post-test II
measures on the Sports Competition Anxiety Test as evidenced by the
mean differences of 3.66667 and 5.88887 which exceeds the Ts(D)
coefficient of 3.1446. Hence, there is no significant differences
between treatment groups but there is a significant difference of
time and treatment for the QRBF group singly.
Examination of Figure 2 indicates, thru a rate of change,
reduction of QR and BF but to no greater extent than the CTRL.
However, scrutiny of Table 3 indicates no significant interaction
(probability of .1929). The QRBF group has affected a significant
change within its treatment as supported by a repeated measures
probability coefficient of .003 (Table 3) and a pre-post difference
of 5.88 (Table 4) which exceeds the Tukey coefficient of 3.1446.
Convergence of the QRBF profile may portray a reduction in this
group and suggest that QRBF is more robust in effect for reduction
of Sports Competition Anxiety.

Cell means On for SCAT scoresTreatment QR BF QRBF
SCAT PRESCAT POST ISCAT POST II
24.1111122.6666721.22222
26.2222225.3333324.88889
28.6666725.0000022.77778
CTRL
25.5555624.4444424.55556
Cell standard deviations for SCAT scoresTreatment QR BF QRBF
PREPOST IPOST II
4.702254.582583.80058
9.782359.797969.61047
ANOVA (Analysis of Variance) for State Anxiety (SCAT)Source ofVariation d.f. SS MS
TreatmentError
3
32
Repeated Measures 2
Interaction 6
Error 64
144.546105466.22222
142.5185269.25926492.88889
11.3357810.828208.88507
F
CTRL
5.433954.977734.92725
ProbabilityLevel
48.18210170.81944
71.2592611.543217.70139
.28
9.251.50
.8379
.0030
.1929
Table 3Descriptive Statistics for State Anxiety (SCAT)

Mean Differences Between Treatment Groups (Ts(D) = 9.7096
SCAT POST I QR QRBF
Means 22.66667 25.00000BF
25.33333CTRL
24.44444
QR 22.66667 2.33333 2.66666 1.77777
QRBF 25.00000 .33333 .55556
BF 25.33338 .88889
CTRL 24.44444
QR QRBF BF CTRL
SCAT POST II 22.22222 22.77778 24.88889 24.55556
Means
QR 21.22222 1.55556 3.66667 3.33334
QRBF 22.77778 2.11111 1.77778
BF 24.88889 .33334
CTRL 24.55556
Mean Differences Within Treatment Groups Ts(D) = 3.1446*
QR Diff. BF Diff. QRBF Diff. CTRL Diff.
SCAT PRE 24.11111 26.22722 28.66667 25.55556
SCAT POST I 22.66667 1.44444 25.33333 .88889 25.00000 3.66667* 24.44444 1.11112
SCAT POST II 21.22222 1.44445 24.88889 .44444 22.77778 2.22222* 24.55556 -.11112
Sum of Diff. 2.88889 1.33333 5.88887 1.00000
*= significant to the .05 level of confidence
Table 4Mean Differences Within and Between Treatment Groups
for State Anxiety (SCAT)
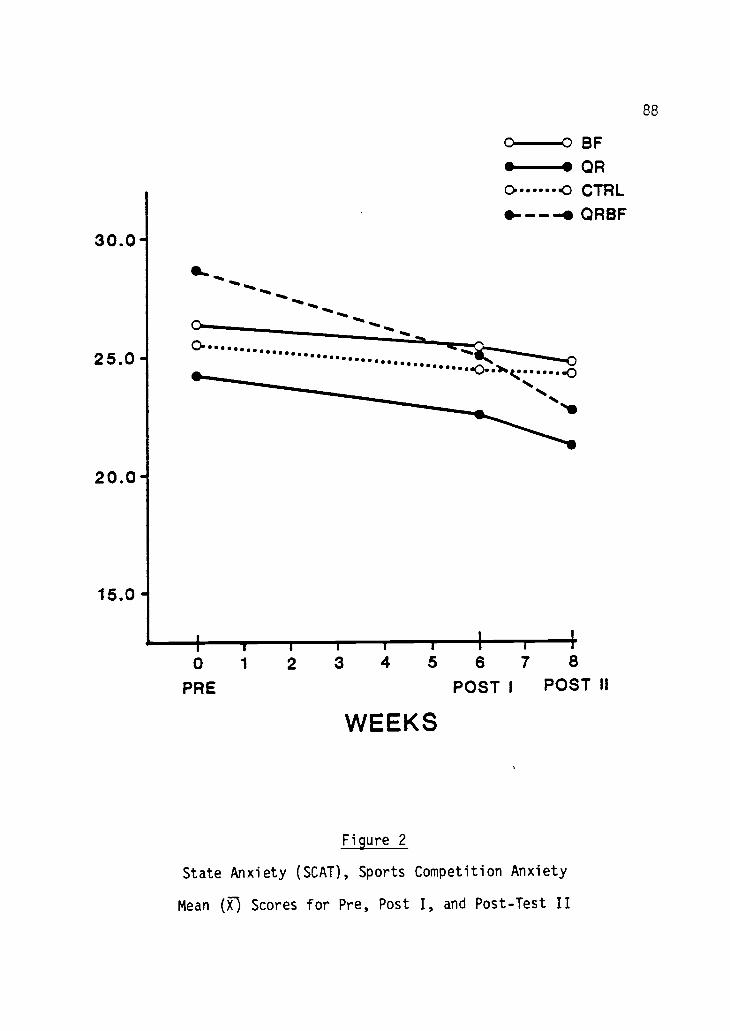
Nokiety 5c,0), Sports CoopetiO or Wiety
14011 (fs) Scores km" Pre, Post 1, end .lest 11

89
Locus of Control (IE)
There is no main effect involving data between treatment groups
as evidenced by ANOVA in Table 5 for Locus of Control, retention of
the null hypothesis is warranted based on these findings. The
"repeated-measures" F ratio and the "interaction" F ratio indicates
a level of significance of .002 and .0285 respectively that
justifies further examination of the data. Further investigation of
the data using Ts(D) for within treatment differences in Table 6, a
significant difference is revealed for QR and the QRBF group
exclusive of the BF and CTRL groups. This indicates a significant
change over time and treatment for the QR and QRBF treatment groups
both singly and jointly.
Figure 3 portrays the profiles for the groups, the BF profile
would seem to initially evidence a reduction for IE at week 6 but
upon investigation at week 8 has returned to very near the pre-test
level. The profiles for QR and QRBF indicate a significant
interaction or rate of change that is indeed different than the
control (CTRL) and BF. That these two groups are significantly
different is reflected in the interaction coefficient of .0285 in
Table 5.

Cell means (7) for IE scoresTreatment QR BF QRBF CTRL
IE PRE 9.77778 10.77778 10.11111 10.22222IE POST I 8.33333 9.66667 8.33333 10.00000IE POST II 8.11111 10.66667 8.66667 10.88889
Cell standard deviations for IE scoresTreatment QR BF QRBF CTRL
IE PRE 4.84195 3.80058 1.96497 3.92994IE POST I 3.93700 3.39116 1.87083 2.78388IE POST II 3.82245 3.87298 1.93649 2.57121
ANOVA (Analysis of Variance) for Locus of Control (IE)Source ofVariation d.f. SS MS F
ProbabilityLevel
treatment 3 60.44444 20.14815 .64 .5951Error 32 1008.07407 31.50231
Repeated Measures 2 23.46296 11.73148 9.98 .0002Interaction 6 17.94444 2.99074 2.54 .0285Error 64 75.25926 1.17593
Table 5Descriptive Statistics for Locus of Control (IE)
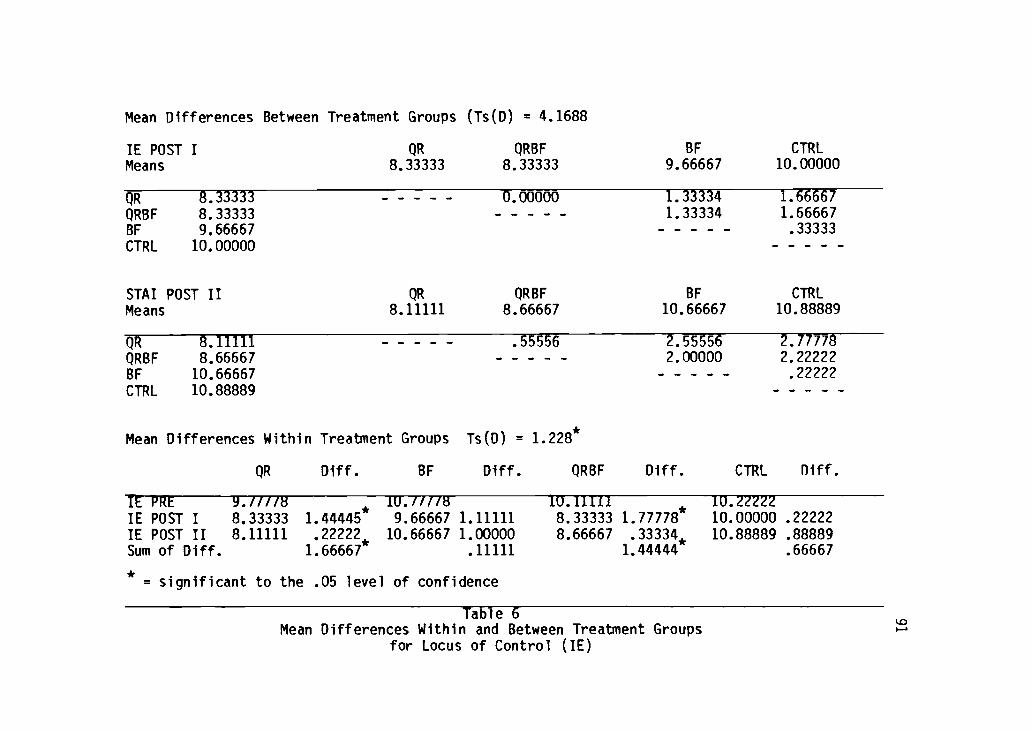
Mean Differences Between Treatment Groups (Ts(D) = 4.1688
IE POST I QR QRBFMeans 8.33333 8.33333
BF
9.66667CTRL
10.00000
QR 8.33333 0.00000 1.33334 1.66667
QRBF 8.33333 1.33334 1.66667BF 9.66667 .33333
CTRL 10.00000
STAI POST II QR QRBF BF CTRL
Means 8.11111 8.66667 10.66667 10.88889
QR 8.11111 .55556 2.55556 2.77778
QRBF 8.66667 2.00000 2.22222
BF 10.66667 .22222
CTRL 10.88889
Mean Differences Within Treatment Groups Ts(D) = 1.228*
QR Diff. BF Diff. QRBF Diff. CTRL Diff.
FE PRE g./1/78 110./7/T8 IU.IIII1 10.Z2ZZ2
IE POST I 8.33333 1. 44445* 9.66667 1.11111 8.33333 1.77778* 10.00000 .22222
IE POST II 8.11111 22222, 10.66667 1.00000 8.66667 .33334* 10.88889 .88889Sum of Diff. 1. 66667* .11111 1.44444 .66667
*= significant to the . 05 level of confidence
Table 6Mean Differences Within and Between Treatment Groups
for Locus of Control (IE)

11.0
10.0
9.0
8.0
7.0
8.0
0----0 BF
.......--0 ORc> 0 CTRL--- ORBF
I, , I , , 1 , I
0 1 2 3 4 5 6 7 8
PRE POST I POST II
WEEKS
Figure 3
Locus of Control (IE)
Mean (fl Scores for Pre, Post I, and Post-Test II
92

93
Blood Pressure (Systolic and Diastolic)
Repeated-measures ANOVA revealed no significant difference
between treatment cells in regards to systolic and diastolic blood
pressure changes due to effect, thus the null hypothesis is
retained. An ad hoc examination of the data prompted by the
presence of a significant F ratio for the "repeated-measures"
probability level of .0320 revealed a significant difference as
determined by the Tukey test within the QR and QRBF groups over time
and treatment for these two variables indicating that a significant
treatment effect has taken place.
There were no significant differences using ANOVA for repeated-
measures for diastolic blood pressure and the null hypothesis is
retained for main effect measures for within and between group
effects.
The interaction coefficients for systolic (SYST) and diastolic
(DIAS) were not significant as indicated in Table 7 and Table 9.
Figure 4 indicates a reduction in the profile lines as portrayed
graphically.
An increase in diastolic pressure is portrayed in Figure 4,
however, examination of Table 9 indicates no significant change for
this measure as evidenced by a repeated measures coefficient of .89
and an interaction coefficient of .85. Although the profile in
Figure 4 may seem to indicate rates or directions of change that

94
look dramatic, this is not supported by the data, it follows as a
result that any change is attributed to chance and does not reflect
a significant level of change for within or between ANOVA.

Cell means (T) for SYST scoresTreatment QR BF 0118F CTRL
SY3T PRE 126.00000 123.22222 131.44444 129.77778
SYST POST I 118.11111 117.66667 119.66666 125.88889
SYST POST II 117.55556 118.33333 120.33333 125.44444
Cell standard deviations for SYST MeasuresTreatment QR BF QRBF CTRL
SYST PRE 9.88686 13.69104 13.10640 13.89044
SYST POST I 7.73700 10.09950 9.27362 5.27836
SYST POST II 4.79873 9.28709 5.95819 8.14112
ANOVA (Analysis of Variance) for SYST MeasuresSource ofVariation d.f. SS MS F
ProbabilityLevel
Treatment 3 901.21296 300.40432 1.70 .1$75
Error 32 5668.22222 177.13194
Repeated Measures 2 1256.79630 628.39815 11.74 .0320
Interaction 6 200.53704 33.42284 .62 .7100
Error 64 3425.33333 53.52083
Table 7Descriptive Statistics for Systolic Blood Pressure (SYST)

Mean Differences Between Treatment Groups (Ts(D) = 9.8850
STAI POST I BF QR
Means 117.66667 118.11111QRBF
119.66667CTRL
125.88889
BF 117.66667 .55557 2.00000 8.22222
QR 118.11111 1.55556 7.77778
QRBF 119.66667 6.22222
CTRL 125.88889
STAI POST II QR BF QRBF CTRL
Means 117.55556 118.33333 120.33333 125.44444
QRBFQRBFCTRL
117.55556118.33333120.33333125.44444
.77777 2.777772.00000
7.888887.111115.11111
Mean Differences Within Treatment Groups Ts(D) = 8.28996*
QR Diff. BF Diff. QRBF Diff. CTRL Diff.
SYST PRE 126.00000 123.22222 131.44444 129.77778
SYST POST I 118.11111 7.88889 117.66667 5.55555 119.66667 11.77773* 125.88889 3.88889
SYST POST II 117.55556 .55555, 118.33333 -.66666 120.33333 -.66666 125.44444 .44445
Sum of Diff. 8.44444^ 4.88889 11.11111* 4.33334
* = significant to the .05 level of confidence
Table 8Mean Differences Within and Between Treatment Groups
for Systolic Blood Pressure Pressure (SYST)
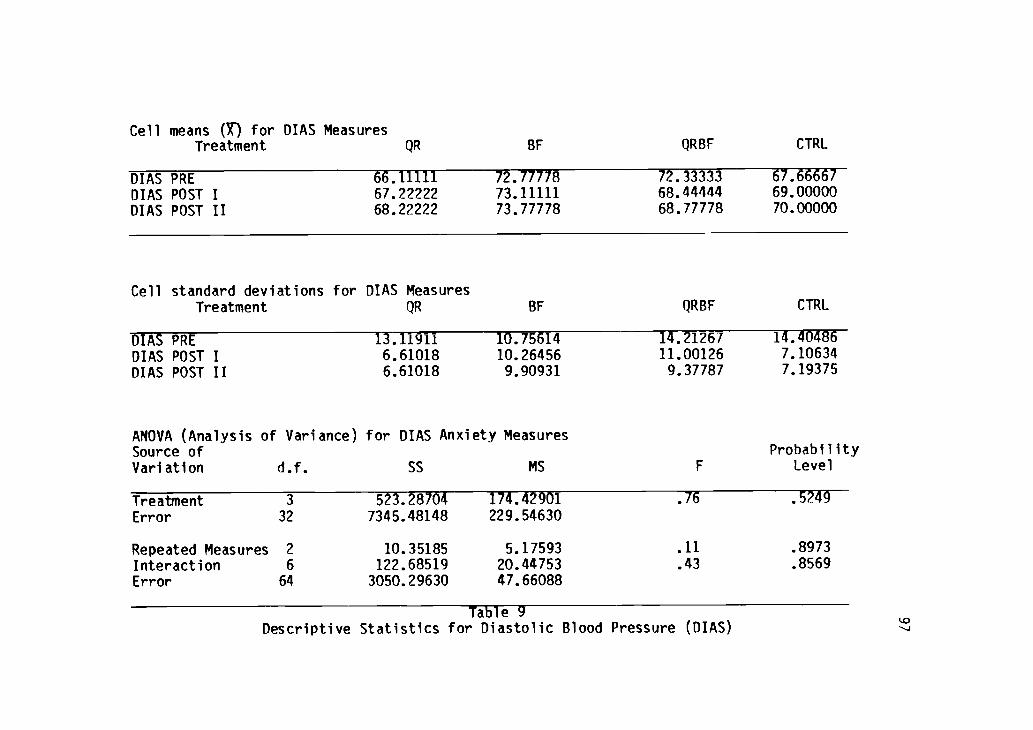
Cell means (Y) for DIAS MeasuresTreatment QR BF QRBF
DIAS PREDIAS POST IDIAS POST II
66.1111167.2222268.22222
72.7777873.1111173.77778
72.3333368.4444468.77778
CTRL
67.6666769.0000070.00000
Cell standard deviations for DIAS MeasuresTreatment QR BF QRBF
DIAS PREDIAS POST IDIAS POST II
13.119116.610186.61018
10.7561410.264569.90931
ANOVA (Analysis of Variance) for DIAS Anxiety MeasuresSource ofVariation d.f. SS MS
14.2126711.001269.37787
F
CTRL
14.404867.106347.19375
ProbabilityLevel
TreatmentError
3
32
Repeated Measures 2
Interaction 6
Error 64
523.287047345.48148
10.35185122.685193050.29630
174.42901229.54630
5.1759320.4475347.66088
.76
.11
.43
.5249
.8973
.8569
Table 9Descriptive Statistics for Diastolic Blood Pressure (DIAS)

Mean Differences Between Treatment Groups (Ts(D) = 11.2532
DIAS POST I QR QRBFMeans 67.22222 68.44444
CTRL69.00000
BF73.11111
QR 67.22222 1.22222 1.77778 5.88889QRBF 68.44444 .55556 4.66667CTRL 69.00000 4.11111BF 73.11111
DIAS POST II QR QRBF CTRL BFMeans 68.22222 68.77778 70.00000 73.77778
QR 68.22222 .55556 1.77778 5.55556QRBF 68.77778 1.22222 5.00000CTRL 70.00000 3.77778BF 73.77778
Mean Differences Within Treatment Groups Ts(D) = 7.8236*
QR Diff. BF Diff. QRBF Diff. CTRL Diff.
DIAS PRE 66.11111 72.77778 72.33333 67.66667DIAS POST I 67.22222 1.11111 73.11111 .33333 68.44444 3.88888 69.00000 1.33333DIAS POST II 68.22222 1.00000 73.77778 .66666 68.77778 .33334 70.00000 1.00000Sum of Diff. 2.11111 1.00000 3.55555 2.33333
Table 10Mean Differences Within and Between Treatment Groups
for Diastolic Blood Pressure (DIAS)

130.0
125.0
120.0
115.0
74.0
72.0
70.0
89.0
67.0
65.0
. 0"-'-'-'"0 BFN. 41"-"'"- ORo..... _
...... o o CTRL.......
0.*--- ORBF
... o
0 1 2 3 4 5 6 7 8
PRE POST I POST H
WEEKS
,, ,
o....
.......0-..............................
0 1 2 3 4 5 6 7 8PRE POST I POST II
WEEKS
Figure 4
Blood Pressure (SYST and DIAS)
Mean (g) Scores for Pre, Post I, and Post-Test II
99

100
Heart Rate (BPM)
Analysis of variance (ANOVA) revealed no significance between
treatment groups on Heart Rate (BPM) reduction measures prior to
competition as an effect of the various treatment programs. The
null hypothesis is retained. An ad hoc test seemed justified based
upon the F ratio of 6.02 (Table 11) that indicated a probability
level of .1040 but examination of the data in Table 12 reveals no
significant differences over time for any of the treatment groups
both between and within as no mean differences meet or exceed a
Ts(D) of 4.4798 for within differences or of 14.7943 for the mean
differences between group measures.
There is no significant "interaction" evidenced by an F ratio
of .14 (probability level of .9908) in Table 11. An examination of
Figure 5 illustrates that all groups including the CTRL realized a
reduction in heart rate, but none more than another. The reduction
in BPM is perhaps explained as being a result of the physiological
adaption to the training effect across all of the groups and seems
to be consistent for each, no group differs from the other in this
regard.

Cell means (7) for BPMTreatment QR BF QRBF CTRL
RPM PRE 61.11111 67.88889 66.44444 66.55556BPM POST I 58.00000 64.22222 62.77778 64.22222BPM POST II 59.22222 65.44444 65.00000 64.22222
Cell standard deviations for RPM MeasuresTreatment QR BF QRBF CTRL
BPM PRE 11.16293 15.70386 13.92041 12.55101BPM POST I 10.93161 13.25498 12.15296 9.60179BPM POST II 10.59219 11.24846 12.03121 8.42285
ANOVA (Analysis of Variance) for BPM MeasuresSource ofVariation d.f. SS MS F
ProbabilityLevel
Treatment 3 688.48148 229.49383 .58 .6334Error 32 12695.92593 396.74769
Repeated Measures 2 188.12963 94.06481 6.02 .1040Interaction 6 12.90741 2.15123 .14 .9908Error 64 1000.29630 15.62963
Table 11Descriptive Statistics for Heart Rate, Beats Per Minute (BPM)

Mean Differences Between Treatment Groups (Ts(D) = 14.7943
BPM POST I QR QRBFMeans 58.00000 62.77778
CTRL64.22222
BF64.22222
QR 58.00000 4.77778 6.22222 6.22222QRBF 62.77778 1.44444 1.44444CTRL 64.22222 0.00000BF 64.22222
BPM POST II QR CTRL QRBF BFMeans 59.22222 64.22222 65.00000 65.44444
QR 59.22222 5.00000 5.77778 6.22222CTRL 64.22222 .77778 1.22222QRBF 65.00000 .44444BF 65.44444
Mean Differences Within Treatment Groups Ts(D) = 4.4798
QR Diff. BF Diff. QRBF Diff. CTRL Diff.
BPM PRE 61.11111 67.88889 66.44444 66.55556BPM POST I 58.00000 3.11111 64.22222 3.66669 62.77778 3.66666 64.22222 2.33336BPM POST II 59.22222 -1.22222 65.44444 -1.22222 65.00000 -2.222?2 64.22222 0.00000Sum of Diff. 1.88889 2.44445 1.44444 2.33336
Table 12Mean Differences Within and Between Treatment Groups
for Heart Rate, Beats Per Minute (BPM)
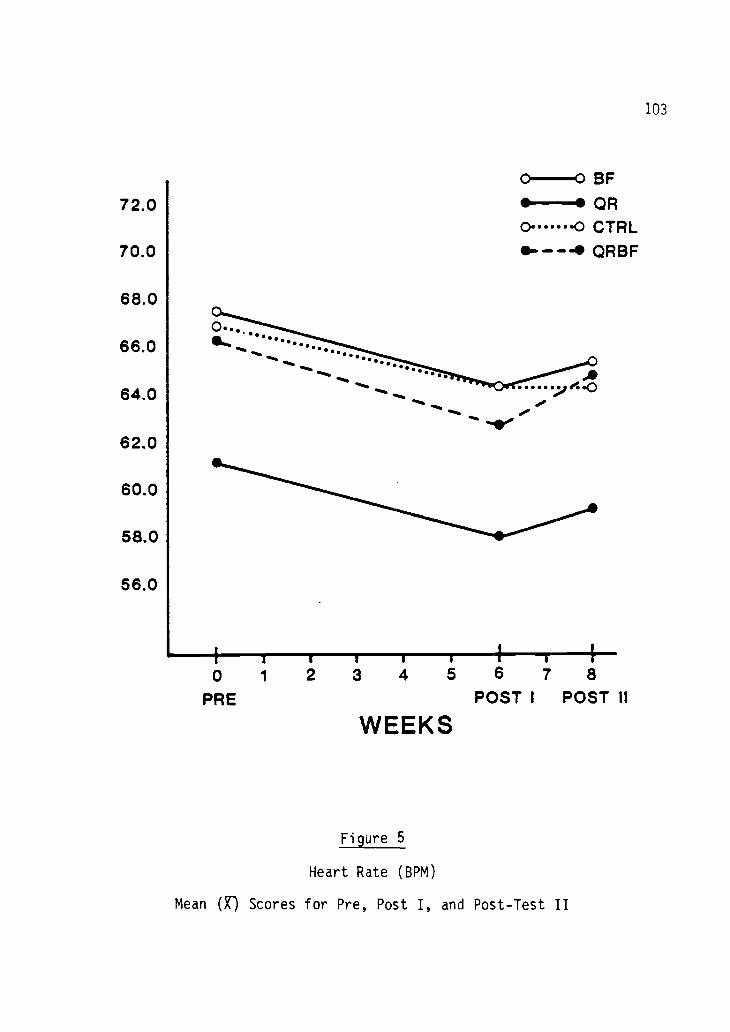
103
72.0
70.0
68.0
0-0 BFQR
0 .0 CTRLQRBF
66.0......
.°64.0 .1111,
410.
62.0
60.0
58.0
56.0
0 1
PRE
II I
2 3 4 5 6 7 8
POST I POST II
WEEKS
Figure 5
Heart Rate (BPM)
Mean (X) Scores for Pre, Post I, and Post-Test II

104
Electromyographic Feedback (EMG I and EMG II)
Repeated measures analysis of variance (ANOVA) revealed
significant difference between groups on EMG I levels when across
treatment measures were analyzed using Tukey's honestly significant
difference test. Ad hoc analysis revealed significantly different
between measures where Ts(D) = 1.0483 in Table 14 for main effect at
Post-Test I treatment groups and for main effect for the BF and QRBF
groups at the Post-Test II session.
The significant F ratio for "repeated measures" over time of
42.16 and "interaction" of 4.14 in Table 13 prompted further
investigation of the data utilizing the Tukey test. All of the
treatment groups exclusive of CTRL realized a significant reduction
in tension as measured by EMG for within treatment analysis. Table
14 indicates that although Post-Test I showed significant
differences between groups at the assessment session, Post-Test II
for EMG I indicates a significance for the QRBF and BF groups only
at this second assessment session. The null hypothesis for main
effect between treatment groups is rejected for this variable.
Table 15 and 16 reveals a significant difference existing
between all treatment groups for effect with the exclusion of the
CTRL group. These findings support rejection of the null hypothesis
over time and treatment both singly and jointly. Hence, the null
hypothesis is rejected for EMG II which is EMG tension level in
105
microvolts over two minutes at completion of treatment session
segments.
The "interaction" coefficient of .0014 in Table 13 and .0429 in
Table 15 indicate a significant change having occurred that is
supported upon examination of Figure 6. EMG I reflects a dramatic
drop in this indices as profiled by the sixth week assessment with a
slight increase of this measure at week 8. BF and QRBF intersect
the line profiling QR indicating a more profound change for these
indices, the inference is supported that the BF and QRBF affects
change on this measure to a greater degree than QR alone. This is
again supported upon examination of the profiles for EMG II, in both
of these instances all three treatment groups diverge from the
CTRL. In both instances, the BF and QRBF groups intersect the QR
group indicating that these two groups have a greater effect in
change over time for this measure.

Cell means (X) for EMG I MeasuresTreatment QR BF QRBF CTRL
EMG I PRE 1.79000 3.84556 4.10555 3.41333EMG I POST I 1.94889 1.59111 1.90000 3.31333EMG I POST II 2.42222 1.81667 2.02778 3.15556
Cell standard deviations for EMG I MeasuresTreatment QR BF QRBF CTRL
EMG I PRE 1.62978 1.40869 1.50793 .89847EMG I POST I .50615 .32876 .91161 1.32623EMG I POST II .78264 .26491 1.08619
ANOVA (Analysis of Variance) for EMG I MeasuresSource ofVariation d.f. SS MS F
ProbabilityLevel
Treatment 3 11.05534 3.68511 1.85 .0581Error 32 63.75341 1.99229
Repeated Measures 2 55.71001 27.85500 42.16 .0001Interaction 6 16.39092 2.73182 4.14 .0014Error 64 42.28094 .66064
Table 13Descriptive Statistics for EMG, 1st Reading (EMG I)

Mean Differences Between Treatment Groups (Ts(D) = 1.0483*
EMG I POST I BF QRBFMeans 1.59111 1.90000
QR1.94889
CTRL3.31333
BF 1.59111 .30889 .35778 1.72222,QRBF 1.90000 .04889 1.41333:QR 1.94889 1.36444-CTRL 3.31333
EMG I POST II BF QRBF QR CTRLMeans 1.81667 2.62778 2.42222 3.15556
BF 1.81667 .21111 .60553 1.33889*QRBF 2.02778 .39444 1.12778QR 2.42222 .73334CTRL 3.15556
Mean Differences Within Treatment Groups Ts(D) = .92498*
QR Diff. BF Diff. QRBF Diff. CTRL Diff.
EMG I PRE 3.79000 3.84556 4.10556 3.41333EMG I POST I 1.94889 1.84111* 1.59111 2.25445 1.90000 2.20556 3.31333 .10000EMG I POST II 2.42222 -.47333, 1.81667 -.22556, 2.02778 -.12778, 3.15556 .15777Sum of Diff. 1.36778- 2.02889* 2.07778* .25777
* = significant to the .05 level of confidence
Table 14Mean Differences Within and Between Treatment Groups
for EMG, 1st Reading (EMG I)

Cell means (g) for EMG II MeasuresTreatment QR BF QRBF CTRL
EMG II PRE 1.24556 1.47778 1.65333 3.22667EMG II POST I .87778 .55222 .65333 3.44000EMG II POST II .99444 .69000 .80000 3.10222
Cell standard deviations for EMG II MeasuresTreatment QR BF QRBF CTRL
EMG II PRE .41092 .67177 1.23310 1.11513EMG II POST I .48205 .23879 .36010 1.17369EMG II POST II .55909 .28478 .42714 1.03200
ANOVA (Analysis of Variance) for EMG II MeasuresSource ofVariation d.f. SS MS F
ProbabilityLevel
Treatment 3 103.96289 34.65430 33.12 .0000Error 32 33.48015 1.04625
Repeated Measures 2 6.29802 3.14901 9.55 .0002Interaction 6 4.60080 .76680 2.33 .0429Error 64 21.09532 .32961
Table 15Descriptive Statistics for EMG, 2nd Reading (EMG II)

Mean Differences Between Treatment Groups (Ts(D) = .7597*
EMG II POST I BF QRBFMeans .55222 .65333
QR.87778
CTRL3.44000
BF .55222 .10111 .32556 2.8877QRBG .65333 .22445 2.78667*QR .87778 2.56222CTRL 3.44000
EMG II POST II BF QRBF QR CTRLMeans .69000 .80000 .99444 3.10222
BF .69000 .11000 .30444 2.41222,QRBF .80000 .19444 2.30222*QR .99444 2.10778'CTRL 3.10222
Mean Differences Within Treatment Groups Ts(D) = .65056*
QR Diff. BF Diff. QRBF Diff. CTRL Diff.
EMG II PRE 1.24556 2.47778 1.65333 3.22667EMG II POST I .87778 .36778 .55222 .92556- .65333 1.00000* 3.44000 -.21333EMG II POST II .99444 -.11666 .69000 -.13778, .80000 -.14667, 3.10222 .44778Sum of Diff. .25112 .78778* .85333* .12445
* = significant to the .05 level of confidence
Table 16Mean Differences Within and Between Treatment Groups
for EMG, 2nd Reading (EMG II)

110
0.---....0 SF
4.00 lik0......4) OR
1..-.10
3. 50
3.00
0 ......
S. \\..). .
0* ----- '0 CTRL
0` '' 4b OREIF
0
> \ .I
CC 2.50\ 0
(..)
5 2.00
1.50
3.50
3.00co
0 2.50
0 2.00cc0
1.50
1.00
.50
0
0 1
EMG 1
2 3 4 5 e 7 8
WEEKS
EMG It
0 1 2 3 4 5 8 7 8
WEEKS
11211EMG I and EMG II
Mean (X) Scores for Pre, Post I, and Post-Test II

Summary
Analysis of variance (ANOVA) findings lead to an inability to
fully support the following research hypothesis:
1. There is no significant difference in STAI measurements in
each of the four treatment groups from pre-test to post-test I and
post-test II at the sixth and eighth week for any of the treatments.
2. There is no significant difference in State Anxiety (SCAT)
for any of the experimental groups as measured one hour prior to duo
meet competition for each of the three experimental groups and
control group.
3. There is no significant differences in IE Locus of Control
measures for any of the experimental groups and control group from
pre-test to post-test I and post-test II.
4. There is no significant differences in systolic and
diastolic blood pressure measures one hour prior to duo meet
competition for each of the three experimental groups and control
group.
5. There is no significant differences in resting heart rate
measures for any of the experimental groups and control group one
hour prior to duo meet competition.
6. There is significant differences in Electromyography (EMG)
measures of tension for the various treatment and control groups on
the pre-test, post-test I, and post-test II assessments at the start

112
and finish of three separate treatment sessions.
The above mentioned research hypothesises were partially
supported. Only one variable, that of EMG (Tables 13, 14, 15 and
16) revealed ANOVA that was statistically significant between
treatment groups at the .05 level of confidence. Analysis failed to
yield any significant difference between groups for all variables
except for the aforementioned EMG variable.
Analysis of the data yields some practical trends. On all the
variables tested except diastolic pressure and heart rate,
experimental groups registered improvement over the control group
when their observed post-test I and post-test II scores were
compared to their observed pre-test mean scores. Although no
significant differences between experimental groups and control
group can be found, there are some practical trends within the QR,
BF, and QRBF treatment groups of note.
Trait anxiety is shown to be reduced by the various treatments
with an ability to determine that one treatment (QRBF) had the
greater effect. The QR, BF, and QRBF groups evidenced statistically
significant main effect differences within their experimental groups
indicating a positive effect of these treatment experiences.
State Anxiety, as measured by the Sports Competition Anxiety
Test (SCAT), was significantly reduced for the treatment group
utilizing the Quieting Response training and augmented biofeedback
(GRBF). All other groups, including the control, showed no

113
significant improvement on this measure for both within and between
treatments. Due to the lack of significances between groups,
retention of the null hypothesis dictates that interpretation of
data allow for the conclusion that no experimental treatment was
more beneficial over the other. A significant gain was evidenced
within the combined Quieting Response and biofeedback group (QRBF)
and it can be assumed that this specific treatment may have an
effect on State Anxiety specific to the duo meet environment.
Lucus of Control (IE) was shown to be reduced as a measure
indicating less externalization and greater internalization of
causal effects for the QR and QRBF groups to the exclusion of the BF
alone and control group. This may indicate that the integral effect
in this variable is related to the Quieting Response training rather
than the augmented biofeedback experience.
Measures of blood pressure were shown to be reduced in regards
to systolic pressure for QR and QRBF when compared to within
measures only, it may be assumed that QR and QRBF may reduce
systolic blood pressure more so than the biofeedback alone. Heart
rate measures were shown by analysis of the descriptive data in
Table 11 to be reduced but to no significant level that would allow
for rejection of the null hypothesis for either between or within
treatments. It may be assumed that the changes experienced by the
various groups was a process of the physiological adaption of the
athletic experience and not due to any of the experimental effects.

114
Electromyographic (EMG) measures revealed significant
differences between means for EMG I (the reading over two minutes at
the beginning of treatment as gathered by the Autogen 5100 Digital
Integrator) for the three experimental groups for post-test I.
Further examination of Table 16 indicates significant differences
between treatments for QR, BF and QRBF at the post-test II
assessment.
The variables tested show improvement, except diastolic blood
pressure, but not sufficient to establish statistical significance
except for the EMG variable. Meaningful, though not significant
trends can be observed in the analysis of the sub group data,
subjects utilizing QR, BF and QRBF were successful in lowering their
Trait Anxiety measures when within data was examined. EMG measures
were significantly affected as a result of QR, BF and QRBF training
at post-test I and post-test II.

115
CHAPTER V. DISCUSSION
The final chapter includes a discussion of the study and
recommendations which grew from the project. This chapter presents
in sequence:
1. A summary of the study;
2. The conclusions of the study;
3. A discussion of the findings; and
4. Recommendations for further study and/or action.
Summary of the Study
The purpose of the study was to determine the singular and
combined effects of progressive relaxation and biofeedback
monitoring upon anxiety and other psychological and physiological
variables in a selected group of subjects in a specific sports
setting. The program was designed to be administered over a six-
week sequence, with a pre-measure utilizing the Spielberger Trait
Anxiety Measure. Use of the Sports Competition Anxiety Test (SCAT)
prior to competition of the subjects in three duo meets throughout a
season of track and field were used to establish State-Anxiety. In
addition, blood pressure and resting heart rate data were collected
one hour prior to "warm up" in the competitive duo-meet setting.
The Appendix gives pertinent information and

116
instruction/references to the paper/pencil instruments. The
dependent variables were SCAT, STAI, the I-E Locus of Control Test,
blood pressure/resting heart rate measures, and EMG measures.
The questions arise, is biofeedback training more effective in
reducing self-reported anxiety than simple relaxation training? Is
biofeedback control enhanced by the learning of a Quieting Response
relaxation program, and is it evidenced by an increased ability to
monitor physiological measurements through self-control?
A review of the literature in the area indicates that much is
known about pre-competitive anxiety in athletes but little has been
done to modify this pattern. Researchers have reported moderate
success in reducing Pre-Competitive and Trait Anxiety but little
evidence exists of a total program incorporating both biofeedback
and cognitive techniques for this purpose specific to athletics.
Conclusions
Within the purpose and limitations of this study the following
conclusions appear appropriate:
1. EMG measures were significantly reduced through the six
weeks of training using relaxation training, biofeedback training
and combined relaxation/biofeedback training. Levels of tension, as
measured by EMG for all experimental groups, was significantly
modified as a result of treatment effect with the exclusion of the

117
control group. The null-hypothesis is rejected for this dependent
variable only. It follows, as a result, that within the scope of
the study, a reduction of tension is experienced as a main effect of
participation in a Quieting Response relaxation training program,
EMG biofeedback training, and a combined Quieting Response and EMG
biofeedback augmented training.
2. Trait Anxiety, within the scope of the study, was not
reduced significantly for between treatment groups analysis.
Although these indices showed significant lowering within the
treatment groups, there was no main effect for instruction between
groups (see Table 1, and Fig. 1).
3. There was no significant reduction in State Anxiety as a
product of the six week training programs compared one to the
other. Although Sports Competition Anxiety (State Anxiety) showed a
significant reduction for the QRBF group, there was no main effect
between treatments, nor was there interaction (Table 3, and Fig. 2).
4. Within the scope of the study, a reduction was evidenced
for Locus of Control to an extent but not such that allows for
rejection of the null-hypothesis. Although these indices showed
significant lowering over time, there was no main effect between
treatment groups, there was interaction (see Table 5, Fig. 3).
5. Systolic and diastolic blood pressure was not
significantly reduced across groups for the six week training
programs. Within the scope of the study, a reduction in systolic

118
blood pressure occurred over time and treatment for the QR and the
combined QRBF group, within treatment groups, indicating that a
significant effect has taken place. There was no significant change
in diastolic blood pressure for any of the experimental groups for
main effect or interaction. There was no interaction for systolic
blood pressure measures (Table 13), repeated measures F ratio
indicates that a significant change occurred within the QR and QRBF
treatment groups.
6. Within the scope of the study, heart rate as measured as
beats per minute (BPM) was not effectively modified other than
perhaps expected as a consequence of the physiological adaptation to
the track and field training experience. There was no main effect
for the various treatments, nor was there interaction or
significance for repeated measures (see Table 11, and Fig. 5) for
this variable.

119
Discussion
Newmark (119) suggests that the real nature of State Anxiety is
transitory while Trait Anxiety is more stable. Newmark's conclusion
that State Anxiety was significantly changed by induced stress,
while Trait Anxiety measures remained fixed, may be questioned by
the present study. The indication of a reduction in Trait Anxiety
exists when one examines the data for this indices. These findings
are consistent with Suinn (175), Gatchell, (56, 57 and 58), and Grim
(67) that indicated Trait Anxiety may be modifyable through extended
long-term treatment strategies incorporating relaxation training and
forms of biofeedback. The present study is in contrast to Newmark
(119), Spielberger (170, and Johnson & Shelberger (83) who espound
that Traits are thought to be firmly established in adulthood. Both
forms of anxiety were found to be reduced by biofeedback by Heibert
and Fitzsimmons (76). However, they found that adding cognitive
techniques to the EMG training did not produce a more powerful
effect than using EMG feedback alone.
Attention now turns to whether individuals actually change in
A-state as they approach a competitive sport contest or meet
environment. The research generally supports the fact that high
anxiety individuals perform to a lesser extent under audience
condition than do low and moderate anxiety subjects (Ganzer, 54;

120
Cox, 31, 32, 33). Mandler (103) contends that complex tasks usually
present an explicit threat of failure to highly anxious people,
which may produce interfering and inappropriate responses during
performance and cause a reduced skill level. Morgan and Hammer
(116) reported that the anxiety levels of varsity wrestlers were
higher one hour before a match as compared to pre-season baseline
measures. Increased anxiety state was confirmed by Martens (104-
111) and supported the contention that anxiety levels are higher at
pre-competition and mid-competition as compared to the prior
measures.
The present study was not designed to determine whether State
Anxiety for high anxiety athletes only was reduced. The findings
suggest to a degree that a reduction in State Anxiety may be an
effect of the relaxation training, EMG biofeedback training alone,
and augmented relaxation training; indeed, the treatment group
utilizing both techniques was able to lower its score in this self-
reported measure of State Anxiety. It may be assumed that any of
these three treatment strategies may be helpful in reducing this
measure, but until further research substantiates this for between
treatment significance, sweeping statements as to the ability of
these treatment strategies to reduce State Anxiety may be premature
and unjustified. This study contrasts with Morgan and Hammer in
that a slight reduction occurred over time for this measure. It is
consistent, however, with the findings of Alexander (3) and Raman

121
(10) who found that State Anxiety was reduced by both feedback and
relaxation programs.
Biofeedback is thought, as a method, to increase external
verification of the extent of muscle activity through
electromyograph (EMG) readings which is a measure of a physiological
component of tension, stress and apprehension. The underlying
principle in this form of tension reduction is that a more relaxed
response allows greater blood flow to the extremities and muscle
tension becomes lessened. It may be that psychophysiological self-
regulation may result in a greater psychological internal locus of
control (IE), and that important performance differences may be
resultant. However, this study does not support a broad acceptance
of this premise. Self-regulation skills evidenced by the ability to
reduce tension as measured through electromyography may further
build this efficacy for athletes and increase internalization
through a greater treatment duration. As stated, this study did not
support the hypothesis that an ability to reduce EMG measures would
reflect a concomitant decrease in IE, although significant decreases
occurred in the measure of muscle tension through the efficiency of
EMG. No resultant across treatment reductions were evidenced.
Of the experimental groups that evidenced within reductions of
this measure, only QR and QRBF that had the common element of the
relaxation program realized significant reduction from
externalization to internalization. The experimental group that

122
utilized and also realized significant reductions in tension, the BF
group, showed no reduction in IE; the premise that verification of
the extent of muscle activity through EMG may reduce IE is not
upheld. It remains for further research to verify that increased
ability to regulate tension level through employing of EMG
biofeedback strategies induces a reduction in IE, this statement
cannot be supported by the present research. Perhaps a well planned
program that sought to increase biofeedback sessions over a
prolonged period that included a pre-season orientation and ongoing
instructional strategy and also encouraged and promoted "homework"
monitored through a relaxation inventory or compliance diary might
further increase the liklihood of reduction in this measure.
Blood pressure, as measured by systolic pressure, was shown to
be reduced for the treatment groups participating in the relaxation
training and the relaxation training/augmented EMG biofeedback group
with the exclusion of biofeedback alone and the control for within
measures. There was no significant reduction in diastolic blood
pressure measures for the group of subjects who participated in the
various treatments. This is consistent with findings by Hager and
Surwit (69), they established that using various treatments
employing biofeedback and augmented relaxation techniques can
significantly reduce the higher systolic blood pressure measurement
but may not reduce the levels of the lower diastolic measurement as
might be suggested by other research (Williamson, 183).

123
Physiological studies of BP (blood pressure) have found that
changes in BP are determined by an interaction of three
cardiovascular functions: HR, stroke volume, and total peripheral
resistance (Detweiler, 43). Research directed towards assessing the
contribution of each of these factors in the development of learned
BP control is only beginning. An implication for further
investigation may be evidenced in the present research by the lack
of reduction within treatment groups for diastolic BP and a
concomitant reduction in BPM. Fey and Lindholm (50), Kristt and
Engel (89) and Brener (19) have shown that voluntary control of
either diastolic of systolic BP is normally accompanied by
positively correlated changes in heart rate BPM. Thus, it appears
that the use of biofeedback normally produces simultaneous changes
in HR, which is not indicated in the present study.
For BP most of the recent experimental work has been done with
hypertensive patients with the exclusion of Ziegler (188) who
utilized a treadmill submaximal run to determine changes in
cardiorespiratory efficiency with athletes. Since most of the
present utility of biofeedback training with BP will probably lie in
treating hypertension, this emphasis makes sense. Further
investigation using Ziegler's methods seem justified in relation to
specific sports benefits on both a physiological level and also
within the psychological context of anxiety and competition.
Again, a reduction in heart rate (BPM) was not evidenced that

124
could be attributed to the dependent variable and the various
treatment strategies. There was no significant change in this
measure, any reduction in this study may be attributed to an
adaptation to the physiological processes of the season of track and
field.
Levels of tension as measured by EMG for all experimental
groups was significantly modified as a result of treatment effect in
this study. There was significant interaction (Figure 6) that
indicated that the EMG biofeedback treatment group and the
relaxation/augmented biofeedback treatment group experienced a
greater effect of change than the relaxation training group alone.
This further supports the contention that athletes can gain mastery
over their physiological responses via an effective cognitive
training program utilizing relaxation alone and also encorporating
augmented biofeedback with the best method being that of a combined
treatment strategy. These findings are consistent with Ziegler
(188) who sought to investigate the changes in cardiorespiratory
efficiency with a group of elite runners utilizing EMG training and
various cognitive programs. A significant and positive effect was
reported in relation to maximal oxygen uptake and cardiorespiratory
efficiency for groups participating in augmented biofeedback
relaxation treatment. Further investigation is warranted specific
to this parameter in regard to the effect of stress management on
physiological functioning as well as in physical performance of the

125
athlete.
French (51) sought to understand the inhibiting and limiting
effects of muscular tension in the acquisition of fine motor
learning skills in regards to the effects of tension controlled
training by use of EMG and performance on a rotor pursuit task. He
found that both EMG and augmented EMG and relaxation training both
significantly contributed to better performances when compared to
that of a control group. He concluded that the use of feedback
facilitates learning and performance more than non-treatment
subjects and that the combination of tension-reduction training with
EMG training led to the greater level of performance alone. The use
of various treatments designed to lessen tension (EMG) have
generally dealt with hypertensive patients, certainly research
within the field of athletics is warranted, the reported research
indicates that this type of investigation is seminal in regards to
its application to other than hypertensives.
Cognitive training is a broad term encompassing various
techniques to help individuals alter their own stress reactions to
environmental events. The term cognitive implies that the technique
focuses on a person's thoughts and perceptions. The terms cognitive
restructuring, mental rehearsal, rational emotive therapy, cognitive
appraisal, systematic desensitization, and self-efficacy statements
may be thought of as cognitive training strategies. It remains to
be investigated as to the benefits and outcomes of these various

126
programs specific to competition within the sports setting.
Jacobson's relaxation techniques, that have been incorporated
into the Quieting Response program by Stroebel, are considered basic
for both psychological and physiological effects. Specific muscle
tension-relaxation is followed by sessions of a combination of
muscle relaxation, deep-regular and smooth breathing, the use of key
stimulus words and guided imagery. Schultz's Autogenic phrases are
also introduced, words such as warm, serene, calm and confident are
used to encourage and achieve the psychophysiological state.
Several forms of imagery are used, to include pleasant images to
facilitate the generalized relaxation response. The focus is on
internal awareness of muscle flexion-extension patterns and weight
shifts as relaxation progresses, as well as visualizing the calm
setting, such as colors and the use of physical cues.
There may be, however, little to sporadic application by some
athletes in terms of practice and the use of the relaxation
techniques in training. In regard to motivation, an ambivalence
about one's basic ability and the desire to win may surface as a
problem in that a heightened sense of arousal prior to a contest may
negate gains that may have been evident when demonstrated in the
non-contest environment. However, it is hoped that the use of a
relaxation technique would enable a greater adaptation to the
stressful pre-meet setting, the effectiveness of the relaxation
techniques and phrases may vary from person to person and certain
127
stimulus words may not always work as they may tend to hold
different meanings for different athletes.
While a few studies exist that specifically address the issue
and use of cognitive training and application to the sports area, it
remains to be seen whether integration of these various programs
with biofeedback training can alter specific pre-meet feelings of
anxiety. Perhaps assessing Sports Competition Anxiety immediately
prior to competition could give a clearer indices of this specific
State-Anxiety and lead productive modification strategies.
Perhaps the strategy of a relaxation program with augmented
biofeedback is a too passive method of preparing for an athletic
contest and its inherent arousal triggers that might be expressed
through the Sports Competition Anxiety Test (SCAT). In general, the
goal of this form of biofeedback and cognitive training is to have
the subjects become aware of their typical responses to
environmental events and then to substitute a more acceptable and
adaptive way of responding to these specific pre-meet stressful
environmental conditions. An additional strategy for maximizing
potential and reducing sports anxiety could include the use of
mental rehearsal techniques specifically designed for events or
success oriented thoughts and behavior in the athletic context. An
inclusion of discussions about feelings and attitudes about
particular events and competition behaviors to include worries may
be helpful in reducing pre-competitive measures of anxiety. A
128
systematic desensitization strategey that addresses ways of reducing
psychological pressures and reconciles levels of aspiration, goal
setting, goal achievement with ability levels may be productive in
reducing State Anxiety specific to athletics. This may further lead
to aspects of success-failure avoidant strategies used by athletes
and might incorporate discussions of psychological needs for
achievement, power and team affiliation.
Reconnen d at i ons
It is recommended that further research be conducted.
1. Replicate the study and increase the scope of the study to
include athletic programs of varying size, geographical
locations, multiple racial backgrounds, and varying levels
of caliber of competitors to include the novice to the
elite athlete.
2. Measure effects over time, using longitudinal and time-lag
designs to investigate the retention of change.
3. An expanded relaxation program with augmented biofeedback
should be tested on a larger population. An increased
sample size may allow for less difficulty in obtaining
statistical significance when the data is analyzed
(Appendix B).

129
4. Organize the study so as to account for and accomodate
field events competitors and their unique competitive
environment and that of the running events, the diversity
of a track and field team composed of field and running
athletes may mask results that might have been found in
the analysis.
5. It might be suggested that further applications of the
study techniques be applied with athletes selected from a
wider range of sports to include team and individual
sports settings.
6. A follow-up study might address the aspect of self-
regulation and supposed results of a greater psychological
internal locus of control that may vary from athlete to
athlete who demonstrate similar skills in both ability and
potential.
7. Further study is warranted in follow-up contact with
athletes to determine application not only in the contest
environment but to application to life situations beyond
the sports setting.
8. Follow-up studies might address the aspect of replicating
the study utilizing a systematic desensitization and
biofeedback procedure to investigate effects on State
Anxiety (SCAT).
9. The potential interaction of personality style and

130
specific stress responses represents another reason for
developing research. This project did not attempt to
group athletes according to stress level, future research
could focus on psychological characteristics of athletes
(i.e., a specific group of athletes who collectively
exhibit problems of over arousal). The relationship
between specific personality characteristics and treatment
success then may be assessed.
10. A study program should be compared to other training
programs (i.e., relaxation training only, only cognitive
techniques, only biofeedback, only mental rehearsal, only
systematic desensitization, and all of these techniques
combined with forms of biofeedback) to determine if one
technique or group of techniques is more effective than
another.
11. Compare the anxiety level of successful coaches and the
impact this has on anxiety levels of team members. Relate
these factors to performance in intercollegiate
competition.
12. Investigate the optimum or ideal level of arousal for
realizing the greatest potential, can this level be
mediated and regulated during a contest?
13. Study all of the above parameters on performance specific
to women in sports as well as men.

131
BIBLIOGRAPHY
1. Alderman, R.B. Psychological Behavior in Sport.Philadelphia: Sanders, 1974.
2. Alexander, A.B. "An Experimental Test of Assumptions Relatingto the Use of Electromyographic Biofeedback as a GeneralRelaxation Training Technique." Phsychophysiology, 12,
1975, 656-662.
3. Alexander, A.B., White, P.D., & Wallace, H.M. "Training andTransfer of Training Effects in EMG Biofeedback AssistedMuscular Relaxation." Psychophysiology, 14, 1977, 551-
559.
4. Allen, G.J. "The Behavioral Treatment of Test Anxiety:Recent Research and Future Trends." Behavior Therapy 3,1972, 253-262.
5. Altrocchi, J., Palmer, J., Hellmann, R., and Davis, H. The
Marlowe-Crowne, repressor-sensitizer, and internal-external scales and attribution of unconscious hostileintent. Psychological Reports, 23, 1968, 1229-1230.
6. Ash, M.J. & Zeliner, R.D. "Speculations on the Use of
Biofeedback Training in Sport Psychology." In D.M.
Landers & R.W. Christina (Eds.), Psychology of Motor
Behavior and Sports. Champaign, IL: Human Kinetics,1978.
7. Basler, Marilyn. Prediciton of Gymnastic Performance fromArousal and Anxiety Measures. Revised version of a
research paper presented at the national convention ofthe American Association of Health, Physical Educationand Recrea;tion. Anaheim, California: 1974.
8. Basler, M.L., Fisher A.; and Mumford, L. "Arousal and AnxietyCorrelates of Gymnastics Performance." ResearchQuarterly 47 December, 1976, 586-589.
9. Beatty, J. & Legewie, H. "Biofeedback and Behavior:Introduction to the Proceedings." In Biofeedback and
Behavior. New York: Plenum Press, 1977, 1-5.

132
10. Beiman, I., Israel, E., & Johnson, S.A. "During Training andPosttraining Effects of Live and Taped ExtendedProgressive Relaxation, Self-Relaxation, and
Electromyogram Biofeedback." J. Consult. Clin. Psychol.,46, 1978, 314-321.
11. Bennett, B.B., & Hall, C.R. "Biofeedback Training and ArcheryPerformance." In C.H. Nadeau, W.R. Halliwell, K.M.
Newell, & G.C. Roberts (Eds.), Psychology of Motor
Behavior and Sport -- 1979. Champaign, IL: Human
Kinetics, 1980.
12. Bennett, B.K. & Stothart, C.M. "The Effects of a RelaxationBased Cognitive Technique on Sport Performance." In P.Klavora & K.A. Wipper (Eds.), Psychological and
Sociological Factors and Sport. Toronto: University ofToronto Press, 1980.
13. Benson, H. The Relaxation Response. New York: Morrow, 1975.
14. Benson, H. & Wallace, R.K. "Decreased Blood Pressure in
Hypertensive Subjects Who Practice Meditation."Circulation, 45/46, 1972, (Supplement II).
15. Birk, L. "Biofeedback-Furor Therapeutics." Seminars in
Psychiatry, 5, 1973, 361-364.
16. Blacksmith, W.A. "The Effects of Systematic Desensitization onPre-Match Anxiety States Among Collegiate Wrestlers."Dissertation Abstract International 34-A, February, 1974.
17. Blanchard, E.B. & Epstein, L.H. A Biofeedback Primer.
Reading, PA: Addison-Wesley, 1978.
18. Bradley, B.W. and McCanne, T.R. "The Effects of RelaxationResponse, and Expectancy of Relief." Biofeedback and
Self-Regulation 6, 1981, 235-251.
19. Brener, J. "Learned Control of Cardiovascular Processes." In
L.V. DiCara (Ed.), Limbic and Antonomic Nervous SystemResearch. Plenum, 1974.
20. Brener, J.A. "Sensory and Perceptual Determinants of
Voluntary Visceral Control." In G.E. Schwartz & J.
Beatty (Eds.), Biofeedback: Theory and Research. NewYork: Academic Press, 1977.

133
21. Brown, B.B. "Recognition of Aspects of Consciousness ThroughAssociation With EEG Alpha Activity Represented by a
Light Signal." Psychophysiology, 6, 1970, 442-452.
22. Brown, B.B. "Awareness of EEG-Subjective ActivityRelationships Detected Within a Closed FeedbackSystem." Psychophysiology, 7, 1971, 451-464.
23. Brown, B.B. Stress and the Art of Biofeedback. New York, NewYork: Harper & Row, 1977.
24. Brown, E.M.Y. "The Effects of a Stressor on a Specific MotorTask on Individuals Displaying Selected PersonalityFactors." Dissertation Abstract International 34-AFebruary, 1974.
25. Cade, C.M. & Coxhead, N. The Awakened Mind. New York, NewYork: Dell Publishing Co., Inc., 1979.
26. Chesney, M.A. & Shelton, J.L. "A Comparison of MuscleRelaxation and Electromyogram Biofeedback Treatments forMuscle Contraction Headache." Journal of BehaviorTherapy, 7, 1976, 221-225.
27. Cone, J.D. "Locus of Control and Social Desirability."Journal of Consulting and Clinical Psychology, 36, 1971,449.
28. Cornish, R.D. & Dilley, J.S. "Comparison of Three Methods ofReducing Test Anxiety: Systematic Desensitization,Implosive Therapy and Study Counseling." Journal of
Counseling Psychology 20, 1973, 499-503.
29. Cottrell, W.B. "Performance in the Presence of Other HumanBeings' mere Presence, Audience, and AffiliaitonEffects." In E.C. Simnel, R.A. Hoppe & G.A. Milton
(Eds.), Social Facilitation and Imitative Behavior
Boston: Allyn and Bacon, 1968, 91-110.
30. Coursey, R.D. "Electromyograph Feedback as a RelaxationTechnique." Journal of Consulting ClinicalPsychologists, 43, 1975, 825-834.
31. Cox, D.J., Freundlich, A. & Meyer, R.G. "Differential
Effectiveness of Electromyography Feedback, Verbal
Relaxation Instructions, and Medicaiton Placebo with
Tension Headaches." Journal of Consulting ClinicalPsychologists, 43, 1975, 892-898.

134
32. Cox, F.N. "Some Effects of Test Anxiety and Presence or
Absence of Other Persons on Boys' Performance on a
Repetitive Motor Task." Journal of Experimental Child
Psychology, 3, 1966, 1-12.
33. . "Some Relationships Between Text AnxietyPresence or Absence of Male Persons and Boys' Performance
on a Repetitive Motor Task." Journal of ExperimentalChild Psychology 6, 1968, 1-12.
34. Cox, F.N. "Some Relationships Between Test Anxiety, Presenceor Absence of Male Persons, and Boys' Performance on a
Repetitive Motor Task." Journal of Experimental ChildPsychology, 3, 1968, 1-12.
35. Cratty, B.J. Movement Behavior and Motor Learning.
Philadelphia, Pennsylvania: Lea and Febiger, 1973.
36. . Psychology and Physical Activity.Prentice-Hall, Inc., 1968.
37. . Psychology in Contemporary Sport.Cliffs, New Jersey: Prentice-hall, Inc., 1973.
London:
Englewood
38. . "Experimental Studies for Conflict-Produced
Stress." In S. Levine and N.A. Scotch (Eds.), Social
Stress, Chicago: Aldine, 1970.
39. Daniels, F.S. & Landers, D.M. "Biofeedback and Shooting
Performance: A Test of Disregulation and Systems
Theory." Journal of Sport Psychology, 4, 1982, 280-289.
40. Davison, G.D. & Neale, J.M. Abnormal Psychology: An
Experimental-clinical Approach. New York: Wiley, 1974.
41. De Caria, M.L. "The Effects of Cognitive Rehearsal Trainingon Performance and on Self Report of Anxiety in Novice
and Intermediate Female Gymnasts." Dissertation AbstractInternational 38(1-B) 1969, 1977.
42. DeGood, D.E., Elkin, B., Lessin, S. & Valle, R.S. "Expectancy
Influence on Self Reported Experience During Alpha
FeedbackTraining: Subject and Situational Factors."
Biofeedback & Self Regulation, 2, 1977, 183-194.
43. Detweiler, D.K. Circulation. Baltimore: Williams & Wilkins,
1973.

135
44. DeWitt, D.J. "Biofeedback Training with UniversityAthletes." In Proceedings of the Biofeedback SocietyAnnual Meeting. Denver, CO: The Biofeedback Society,1979. (Summary)
45. . "Cognitive and Biofeedback Training for StressReduction with University Athletes." Journal of SportPsychology, 2, 1980, 288-294.
46. Endler, N.S. & Okada, M.A. "A Multidimensional Measure ofTrait Anxiety: The S-R Inventory of General Trait
Anxiousness." Journal of Consulting and ClinicalPsychology 43, 1975, 319-329.
47. Epstein, M.L. "The Relationship of Mental Imagery and MentalRehearsal to performance of a Motor Task." Journal ofSport Psychology, 2, 1980, 211-220.
48. Epstein, S. "Toward a Unified Theory of Anxiety." In B.A.Maher (Eds) Progress in Experimental Personality Research4, New York: Academic Press, 1967, 2-89.
49. Fee, R.A. & Girdano, D.A. 'The Relative Effectiveness ofThree Techniques to Induce the Trophotropic Response."Biofeedback & Self Regulation, 3, 1978, 145-158.
50. Fey, S.G. & Lindholm, E. "Systolic Blood Pressure and HeartRate Change Involving Biofeedback." Psychophysiology,12, 1975, 513-519.
51. French, S.N. "Electromyographic Biofeedback for TensionControl during Fine Motor Skill Acquisition."Biofeedback and Self-Regulation, 5, 1980, 221-228.
52. Freud, S. "The Problem of Anxiety" (Translated by A.A.Bunker). The Psychoanalytic Quarterly Press. New
York: W.W. Norton and Co., 1936.
53. Friedman, M. & Rosenman. "Type A Behavior Pattern: Its
Association with Coronary Heart Disease." Annals of
Clinical Research, 3, 1971, 300-312.
54. Ganzer, V.J. "Effects of Audience Presence and Test Anxietyon Learning and Retention in Serial LearningSituation." Journal of Personality and SocialPsychology, 8,. 1968, 194-199.

136
55. Garcia, J. & Rusiniak, K.W. "Visceral Feedback and the TasteSignal." In J. Beatty & H. Legewie (Eds.) Biofeedbackand Behavior. New York: Plenum Press, 1977, 59-71.
56. Gatchel, R.J. "Biofeedback and the Treatment of Fear and
Anxiety." In R.J. Gatchel & K.P. Price (Eds.) ClinicalApplications of Biofeedback: Appraisal and Status. New
York: Pergamon Press, 1979, 148-172.
57. . "Change Over Training Sessions of RelationshipBetween Locus of Control and Voluntary Heart Rate
Control." Perceptual Motor Skills, 40, 1975, 424-426.
58. . "Therapeutic Effectiveness of Voluntary HeartRate Control in Reducing Anxiety." Journal ConsultingClinical Psychology, 45, 1977, 689-691.
59. , Hatch, J.P., Watson, P.J., Smith, D. & Gaas,E. "Comparative Effectivenss of Voluntary Heart RateControl and Muscular Relaxation as Active Coping Skillsfor Reducing Speech Anxiety." Journal ConsultingClinical Psychology, 45, 1977, 1093-1100.
60. , Korman, M., Weis, 0.B., Smith, D. & Clarke, L."A Multiple-Response Evaluation of EMG Biofeedback
Performance During Training and Stress-Induction
Conditions." Psychophysiology, 15, 1978, 253-258.
61. & Proctor, J.D. "Effectiveness of VoluntaryHeart Rate Control in Reducing Speech Anxiety." Journal
Consulting Clinical Psychology, 44, 1976, 381-389.
62. Gaudry, E. & Poole, C. "The Effectiveness of an Experiment ofSuccess or Failure on State Anxiety Level." Journal ofExperimental Education, 41, 1972, 18-21.
63. Gerson, R. & Deshaies, D. "Competitive Trait Anxiety andPerformance as Predictors of Pre-Competitive State
Anxiety." International Journal of Sport Psychology, 9,1978, 16-26.
64. Goesling, W.J., May, C., Lavond, D., Barnes, T., & Carreira,C. "Relationship Between Internal and External Locus ofControl and the Operant Conditioning of Alpha ThroughBiofeedback Training." Perceptual Motor Skills, 39,
1974, 1339-1343.

137
65. Goldfried, M.P. & Tier, C.S. "Effectiveness of Relaxation as
an Active Coping Skill." Journal of Abnormal Psychology,
83, 1974, 348-355.
66. Gordon, E.M. & Sarason, S.B. "The Relationship Between TestAnxiety and Other Anxieties,"
67. Grim, P.F. "Anxiety Change Produced by Self-Induced Muscle
Tension and by Relaxation with Respiration Feedback."
Behavior Therapy, 2, 1971, 11-17.
68. Grynol, E. & Jamieson, J. "Alpha Feedback and Relaxation: A
Cautionary Note." Perceptual Motor Skills, 40, 1975, 58-
62.
69. Hager, J.L. & Surwit, R.S. "Hypertension Self-Control with a
Portable Feedback Unit for Meditation-Relaxation."Biofeedback and Self-Regulation, 3, 1978, 269-276.
70. Hall, E.G. "Comparison of Post Performance State Anxiety ofInternals and Externals Following Failure or Success on a
Simple Motor Task." Research Quarterly, 51, 1980, 306-
313.
71. Hardt, J.V. & Kamiya, J. "Anxiety Change ThroughElectroencephalographic Alpha Feedback Seen Only in High
Anxiety Subjects." Science, 201, 1978, 79-81.
72. Harlesion, B.W. "Test Anxiety and Performance in Problem-
Solving Situations." Journal of Personality, 30, 1962,
557-573.
73. Harrison, J. "Warning: The Male Sex Role May Be Dangerous toYour Health." Journal of Social Issues, 34, 1978, 65-86.
74. Haynes, S.N., Griffin, P., Mooney, D. & Parise, M.
"Electromyographic Biofeedback and Relaxation
Instructions in the Treatment of Muscle Contraction
Headaches." Behavior Therapy, 6, 1975, 672-678.
75. , Moseley, D. & McGowan, W.T. "Relaxation
Training and Biofeedback in the Reduction of FrontalisMuscle Tension." Psychophysiology, 12, 1975, 547-552.
76. Hiebert, A. & Fitzsimmins, G. "A Comparison of EMG Feedbackand Alternative Anxiety Treatment Programs." Biofeedback
and Self-Regulation, 4, 1981, 501-516.

138
77. Hodges, W. "The Effects of Success, Threat of Shock and
Failure on Anxiety." Dissertation Abstracts, 28(10-B),1968, 4296.
78. , "Psychophysiology of Anxiety." In Marvin Zuckermanand Charles Spielberger (eds.) Emotions and Anxiety, NewYork: Lawrence Erlbaum Associates, Inc., 1976, 175-196.
79. Horsfall, J.S., Fisher, A.C. & Morris, H.H. "Sport
Personality Assessment: A Methodological Re-
Examination." In D.M. Landers (ed.) Psychology of Sportsand Motor Behavior II, University Park: Pennsylvania
State University, 1975.
80. Hutchings, D.F. & Reinking, R.H. "Tension Headaches: What
Form of Therapy is Most Effective?" Biofeedback andSelf-Regulation, 1, 1976, 183-190.
81. Ikeda, Y. & Hirai, H. "Voluntary Control of ElectrodermalActivity in Relation to Imagery and Internal PerceptionScores." Psychophysiology, 13, 1976, 330-333.
82. Jacobsen, E. Progressive Relaxation, Chicago: University of
Chicago Press, 1929.
83. Johnson, D. & Spielberger, C.D. "The Effects of RelaxationTraining and the Passage of Time on Measures of State andTrait Anxiety." Journal of Clinical Psychology, 24,
1968, 20-23.
84. Johnson, R.K. & Meyer, R.G. "The Locus of Control Constructand EEG Alpha Rhythm Feedback." Journal ConsultingClinical Psychology, 42, 1974, 913-916.
85. Kamiya, J. "Operant Control of the EEG Alpha Rhythm and Someof its Reported Effects on Consciousness." In C.T. Tart(ed.), Altered States of Consciousness, New York: Wiley,
1969, 507-517.
86. Kirk, B.J. Experimental Design: Procedures for the Behavioral
Sciences. Belmont, Ca: Brooks/Cole, 1968.
87. Knapp, J. "Emotional Reactions of College Gymnastics as a
Function of Time to Competition." Masters Thesis,
University of Massachusetts, 1970.
88. Krahenbuhl, S. "Stress Reactivity in Tennis Players."
Research Quarterly, 42, 1971, 42-46.

139
89. Kristt, D.A., and Engel, B.T. "Learned Control of Blood
Pressure in Patients With High Blood Pressure.
90. Kukla, K.J. "The Effects of Progressive Releaxation Trainingupon Athletic Performance During Stress." DissertationAbstracts International, 37 (12-B), 1977.
91. Lacey, J. & Lacey, B. "Verification and Extension of thePrinciple of Autonomic Response-Stereotype." AmericanJournal of Psychology, 24, 1958, 153-154.
92. Lang, P.J. "Acquisition of Heart Rate Control: Method,
Theory, and Clinical Implications." In D.C. Fowles
(ed.), Clinical Applications of Psychophysiology. New
York: Columbia University Press, 1975.
93. , "Research on the Specificity of FeedbackTraining: Implications for the Use of Biofeedback in the
Treatment of Anxiety and Fear." In J. Beatty & H.
Legewie (eds.), Biofeedback and Behavior, New York:
Plenum Press, 1977, 323-330.
94. LeBoeuf, A. "The Effects of EMG Feedback Training on StateAnxiety in Introverts and Extroverts." Journal ClinicalPsychology, 33, 1977, 251-253.
95. , & Wilson, C. "Importance of Imagery in
Maintenance of Feedback-Assisted Relaxation Over
Extinction Trials." Perceptual Motor Skills, 47, 1978,824-826.
96. Lefcourt, H.M. "Internal Versus External Control of
Reinforcement: A Review." Psychological Bulletin, 65,
1966, 206-220.
97. Leherissey, B.L., O'Neil, H.F. & Hansen, D.N. "Effects of
Memory Supported on State Anxiety and Performance in
Computer Assisted Learning." Journal of Educational
Psychology, 62, 1971, 412-420.
98. Levitt, E. E. The Psychology of Anxiety, second edition,
Hillsdale, New Jersey: Lawrence Erlbaum Associates,
1980.
99. Lynch, J.J., Paskewitz, D.A. & Orne, M.T. "Some Factors in
the Feedback Control of Human Alpha Rhythm."Psychosomatic Medicine, 36, 1974, 399-410.

140
100. McAdoo, W.G., Jr. "The Effects of Success, Mild Failure andStrong Failure Feedback on A-State for Subjects whoDiffer in A-Trait." Doctoral Dissertation Florida StateUniversity, 1970.
101. McGrady, A.V. & Yonker, R. "The Effect of Biofeedback-Assisted Relaxation Training on Blood Pressure andSelected Biochemical Parameters in Patients withEssential Hypertension." Biofeedback and Self-Regulation, 6, 1981, 343-353.
102. McReynolds, P. "Assimilation and Anxiety." In MarvinZuckerman and Charles Spielberger (eds.) Emotions andAnxiety: New Concepts, Methods and Applications. NewYork: Wiley and Sons, 1976.
103. Mandler, G. & Sarason, S.B. "A Study of Anxiety andLearning." Journal of Abnormal and Social Psychology,47, 1952, 166-173.
104. Martens, R. "Anxiety and Motor Performance: A Review:Journal of Motor Behavior, 3, 1971, 151-179.
105. . "Competition: In Need of Theory." in D.M.Landers (ed.) Social Problems in Athletics. Urbana,Illinois: University of Illinois Press, 1979.
106. . Social Psychology and Physical Activity. NewYork: Harper and Row, 1975.
107. . Sport Competitive Anxiety Test. Champaign,Illinois: Human Kinetic Publishers, 1977.
108. Martens, R. & Gill, D.L. "State Anxiety Among Successful andUnsuccessful Competitors who Differ in Competitive TraitAnxiety." Research Quarterly, 47, 1976, 698-708.
109. , Gill, D.L. & Scanlan, T. "Competitive TraitAnxiety, Success-Failure and Sex as Determinant of MotorPerformance." Perceptual and Motor Skills, 43, 1976,1199-1208.
110. & Landers, D.M. "Motor Performance UnderStress: A Test of the Inverted-U Hypothesis." Journalof Personality and Social Psychology, 16, 1970, 29-37.

141
111. & Simon, J.A. "Comparisons of Three Predictorsof State Anxiety in Competitive Situations." ResearchQuarterly, 47, 1976, 381-387.
112. Martin, B. "The Assessment of Anxiety by PsychologicalBehavior Measures." Psychological Bulletin, 58, 1961,
234-255.
113. May, R. The Meaning of Anxiety. Revised Edition. New
York: W.W. Norton, 1977.
114. Mirels, H.L. "Dimensions of Internal Versus External
Control." Journal of Consulting and Clinical Psychology,34, 1970, 226-228.
115. Morgan, W.P. "Pre-match Anxiety in a Group of CollegeWrestlers." International Journal of Sport Psychology,1, 1970, 7-13.
116. & Hammer, W.M. "Influence of CompetitiveWresting Upon State Anxiety." Medicine and Science inSports, 6, 1974, 58-61.
117. Morris, L.W. & Liebert, R.M. "Effects of Anxiety on Timed andUntimed Intelligence Tests: Another Look." Journal of
Consulting and Clinical Psychology, 33, 1969, 240-244.
118. Neter, J. & Wasserman, W.W. Applied Linear Statistical
Models. Homewood, Illinois: Richard Irwin, Inc., 1974.
119. Newmark, C.S. "Stability of State and Trait Anxiety."Psychological Reports, 30, 1972, 196-198.
120. Nicholson, W.M. "The Influence of Anxiety Upon Learning:Interference or Drive Increment?" Journal of
Personality, 26, 1958, 303-319.
121. Nie, N.H., Hull, C.H., Jenkins, J.G., Steinbrenner, K. & Bent,D.H. Statistical Package for the Social Sciences, OregonState Computer package, 1981.
122. Nowlis, D.P. & Kamiya, J. "The Control of
Electroencephalographic Alpha Rhythms Through AuditoryFeedback and Associated Mental Activity."Psychophysiology, 6, 1970, 476-484.

142
123. Nowlis, V. "Research with the Mood Adjective Check List." In
S.S. Tomkins and C.E. Izard (eds.) Affect, Cognition and
Personality. New York: Springer Publishers, 1965, 352-
389.
124. Ogilvie, B.C. "Psychological Consistencies Within the
Personality of High Level Competitors." Journal of theAmerican Medical Association, 205, 1968, 146-162.
125. & Tutko, T.A. "If You Want to Build Character,
Try Something Else." Psychology Today, 5, 1971, 60-63.
126. , Johnsgard, K. & Tutko, T.A. "Personality:
Effects of Activity." in L.A. Larson (ed.) Encyclopediaof Sport Sciences and Medicine. New York: MacMillan,
1971, 229-236.
127. O'Neil, H.F., Speilberger, D.C., & Hansen, D.N. "Effects of
State Anxiety and Task Difficulty on Computer AssistedLearning." Journal of Educational Psychology, 60, 1969,
343-350.
128. Oxendine, J.B. "Emotional Arousal and Motor Performance."
QUEST, 13, 1970, 32-32.
129. . Psychology of Motor Learning. New York:
Appleton-Century-Crofts. 1968.
130. Pelletier, K. Mind as Healer, Mind as Slayer. New York:
Dell Publishing Co., 1977.
131. Perski, A., Engel, T. "The Role of Behavioral Conditioning in
the Cardiovascular Adjustment to Exercise." Biofeedback
and Self-Regulation, 5, 1980, 91-104.
132. Poteet, D. & Weinberg, R. "Competition Trait Anxiety, State
Anxiety and Performance." Perceptual and Motor Skills,
50, 1980, 651-654.
133. Purvis, J.W. & Mogan, W.P. "Influence of Repeated MaximalTesting on Anxiety and Work Capacity in College Women."Research Quarterly, 49, 1978, 512-519.
134. Ray, W.J. "The Relationship of Locus of Control, Self-ReportMeasures and Feedback to the Voluntary Control of Heart
Rate." Psychophysiology, 11, 1974, 527-534.

143
135. Robinson, J.P. & Shaver, P.R. Measures of Social Psychologyand Attitudes. Michigan Institute for Social Research,University of Michigan, 1973.
136. Rotter, J.B. "Generalized Expectancies for Internal VersusExternal Control of Reinforcement." PsychologicalMonographs, 8, 1966, 1-28.
137. Rupnow, A. & Ludwig, D. "Psychometric Note on the Reliabilityof the Sport Competition Anxiety Test: Form C."
Research Quarterly for Exercise and Sport, 52, 1981, 35-37.
138. Ryan, F.D. and Lakie, W.L. "Competitive and NoncompetitivePerformance in Relation to Achievement Motive and
Manifest Anxiety." Journal of Personality and Social
Psychology, 1, 1965, 342-392.
139. Sarason, I.G. "The Effect of Anxiety and Two Kinds of Failureon Serial Learning." Journal of Personality, 25, 1957,
383-392.
140. "Experimental Approaches to Test Anxiety:Attention and the Uses of Information." in C.D.
Spielberger (ed.) Anxiety: Current Trends in Theory and
Research. New York: Academic Press, 1972.
141. . "Introduction to the Study of Test Anxiety."In I.G. Sarason (ed.) Test Anxiety: Theory, Research and
Applications. Hillsdale, New Jersey: Lawrence ErlbaumAssociates, 1980.
142. . "Test Anxiety and Social Influence." Journalof Personality, 41, 1973, 261-271.
143. . "Test Anxiety, Attention and General Problemsof Anxiety." In Spielberger and I.G. Sarason (eds.)
Stress and Anxiety I Washington, D.C.:
Hemisphere/Wiley, 1975.
144. Sarason, S.B., Davidson, K.S., Lighthall, F.E., Waite, R.R. &Ruebusch, B.K. Anxiety in Elementary School Children.New York: John Wiley and Son, Inc. 1960.
145. & Mandler, G. "Some Correlates of TestAnxiety." Journal of Abnormal Social Psychology, 47,
1952, 810-817.

144
146. Scanlan, T.K. "Children in Competition: Examination of StateAnxiety and Social Comparison Response in the Laboratoryand in the Field." NCPEAM Proceddings 1977, 340-345.
147. . "Perceptions and Responses of High and LowCompetitive Trait-Anxious Males to Competition."Research Quarterly, 49, 1978, 520-529.
148. . "Suggested Directions for CompetitionResearch." QUEST, Summer, 1977, 66-75.
149. . "The Effects of Success-Failure on thePerception of Threat in a Competitive Situation."Research Quarterly, 48, 1977, 144-153.
150. Scanlan, T.K. & Passer, M.W. "Anxiety-Inducing Factors in
Competitive Youth Sports." In F.L. Smoll & R.E. Smith(eds.), Psychological Perspectives in Youth Sports.Washington: Hemisphere Publishing Co., 1978.
151. . "Factors Related to Competitive Stress AmongMale Youth Sports Participants." Medicine and Science inSports, 10, 1978, 103-108.
152. Scheier, I.H. "Recent Data on IPAT Anxiety Tests."Information Bulletin #13. Champaign, Illinois:Institute for Personality and Ability Testing, 1967.
153. Schmeidler, G. & Lewis, L. "Mood Changes After Alpha FeedbackTraining." Perceptual Motor Skills, 32, 1971, 709-719.
154. Schultz, J. & Luthe, W. Autogenic Training: APsychophysiological Approach in Psychotherapy. NewYork: Grune & Stratton, 1959.
155. Schwartz, G.E. "Disregulation and Systems Theory: ABiobehavioral Framework for Biofeedback and BehavioralMedicine." In N. Birbaumer & H.D. Kimmel (eds.)Biofeedback and Self-Regulation. Hillsdale, NewJersey: Erlbaum, 1979.
156. Seefeldt, V. & Bould, D. Physical and Psychological Effectsof Athletic Competition on Children and Youth. OpinionPaper. Washington, D. C.: Eric Clearinghouse on TeacherEducation, 1980.

145
157. Selye, H. Stress Without Distress, Philadelphia: J. B.
Lippincott, 1976.
158. Shapiro, S. & Lehrer, P.M. Psychophysiological Effects of
Autogenic Training and Progressive Relaxation."Biofeedback and Self-Regulation, 5, 1980, 249-255.
159. Shedivy, D.I. & Kleinman, K.M. "Lack of Correlation BetweenFrontalis EMG and Either Neck EMG or Verbal Ratings ofTension." Psychophysiology, 14, 1977, 182-186.
160. Sherman, R.A. "Real-life Exposure as a Primary TherapeuticFactor in the Desensitization Treatment of Fear."
Journal of Abnormal Psychology, 79, 1972, 19-28.
161. Sime, W.E. & DeGood, D.E. "Effect of EMG Biofeedback andProgressive Muscle Relaxation Training on Awareness ofFrontalis Muscle Tension." Psychophysiology, 14, 1977,
522-530.
162. Singer, R.N. Coaching, Athletics and Psychology, New York:McGraw-Hill, 1972.
163. Smilkstein, G. "Psychological Trauma in Children and Youth in
Competitive Sports," Journal of Family Practice, 10,
April 1980, 737-739.
164. Smith, R.E. "A Cognitive-Affective Approach to Stress
Management Training for Athletes." In C.H. Nadeau, W.R.Halliwell, K.M. Newell, & G.C. Roberts (eds.), Psychologyof Motor Behavior and Sport--1979. Champaign,
Illinois: Human Kinetics, 1980.
165. Solomon, G., Amkraut, A.A. & Kaster, P. "Immunity, Emotions
and Stress." Psychotherapy and Psychosomatics, 23, 1974,
209-217.
166. Spence, J.T. & Spence, K.W. "The Motivational Components ofManifest Anxiety: Drive and Drive Stimuli." In C.D.
Spielberger (ed.) Anxiety and Behavior. New York:
Academic Press, 1966.
167. Spielberger, C.D. Anxiety: Current Trends in Theory andResearch I New York: Academic Press, 1972.

146
168. . "Anxiety: State-Trait Process." In C.C.
Spielberger and I.G. Sarason (eds.) Stress and Anxiety
I Washington, D. C.: Hemisphere/Wiley, 1975.
169. . "Advanced Study Institute on Stress and Anxiety
in Modern Life." In Charles D. Spielberger and Irwin G.
Sarason (eds.) Stress and Anxiety. Washington, D. C.:
Holsted Press, 1975.
170. . "Theory and Research on Anxiety." In Charles
D. Spielberger (ed.) Stress and Anxiety. New York:
Academic Press, 1966.
171. Spielberger, C.D.; Anton, W.D. & Bedell, Jr. "The Nature and
Treatment of Test Anxiety." In Marvin Zuckerman and
Charles Speilberger (eds.) Emotions and Anxiety: New
Concept, Methods, and Applications. Hillsdale, New
Jersey: Hoisted Press, 1975.
172. Spielberger, C.D.; Gorsuch, R. L. & Lushene, R.L. STAI
Manual. Palo Alto, California: Consulting Psychologists
Press, 1970.
173. Stroebel, C.F. Quieting Response Training. New York, New
York: BMA Cassette Publications, 1978.
174. Suarez, A. & Kohlenberg, R. J. "Is EMG Activity from theFrontalis Site a Good Measure of General Bodily Tensionin Clinical Populations?" Biofeedback and Self-
Regulation, 4, 1979, 293-296.
175. Suinn, R.M. "Body Thinking: Psychology for Olympic
Champs." Psychology Today, July 1976, 38-43.
176. Tarler-Benlolo, L. "The Role of Relaxation in Biofeedback
Training: A Critical Review of the Literature."Psychological Bulletin, 85, 1978, 727-755.
177. Taylor, J.A. "A Personality Scale of Manifest Anxiety."
Journal of Abnormal and Social Psychology, 48, 1953, 285-290.
178. Tenebaum, G. & Milgram, R.M. "Trait and State Anxiety in
Israeli Student Athletes." Journal of Clinical
Psychology, July-October, 1978, 691-693.

147
179. Valle, R.S. & Levine, J.M. "Expectation Effects in Alpha WaveControl." Psychophysiology, 12, 1975, 306-309.
180. Vaught, G.M. & Newman, S.E. "The Effects of Anxiety on MotorSteadiness in Competitive and Non-Competitive
Conditions." Psychological Science, 6, 1966, 519-520.
181. Walsh, D.H. "Interactive Effects of Alpha Feedback and
Instructional Set on Subjective State."Psychophysiology, 11, 1974, 428-435.
182. Whatmore, G. & Fisher, L.D. "Is Frontalis Activity a Reliable
Indicator of the Activity in Other Skeletal Muscles?"Biofeedback and Self-Regulation, 6, 1981, 305-314.
183. Williamson, D. & Blanchard, E.B. "Heart Rate and Blood
Pressure Biofeedback." Biofeedback and Self-Regulation,4, 1979, 1-34.
184. Winer, B. J. Statistical Principles in Experimental Design.New York, New York: McGraw-Hill Co., Inc., 1971.
185. Wolpe, J. Psychotherapy by Reciprocal Inhibition.
Stanford: Stanford University Press, 1958.
186. Zaichowsky, L.D. & Kamen, R. "Biofeedback and Meditation:
Effects on Muscle Tension and Locus of Control."Perceptual Motor Skills, 46, 1978, 955-958.
187. Zajonc, P. "Social Facilitation." Science, 149, 1965, 269-274.
188. Ziegler, S.G., Klinzing, J. & Williamson, K. "The Effects ofTwo Stress Management Training Programs on
Cardiorespiratory Efficiency." Journal of Sport
Psychology, 4, 1982, 280-289.
189. Zuckerman, M. "General and Situation-Specific Traits and
States: New Approaches to Assessment of Anxiety andother Constructs." In Marvin Zuckerman and Charles D.
Spielberger (eds.) Emotions and Anxiety: New Conceptsand Application, New York: Wiley and Sons, 1975.
190. . "The Development of an Affective AdjectiveCheck List for the Measurement of Anxiety." Journal ofConsulting Psychology, 24, 1960, 457-462.

148
191. Zuckerman, M. & Lubin, B. Manual for the Multiple AffectiveAdjective Check List, San Diego, California: Educationand Industrial Testing Service, 1965.
192. Zuckerman, M.; Persky, H. & Curtis, G. Behavior and AutomaticResponses to Hypnotically Suggested Emotions. Paperpresented at the Meeting of the Society for Clinical andExperimental Hypnosis. Chicago, Illinois, 1972.

149
APPENDI CES

150
Appendix A
EXPECTANT FAITH AND THE TRAINING EFFECT
A question arising from the research utilizing various forms of
relaxation training and augmented biofeedback techniques deals with
the aspect of nonspecific or placebo variables and their interaction
with the treatment components. This appendix is set aside to
discuss this factor by reviewing the placebo effect, considering its
place in psychotherapy and, finally discussing implications for
further research in the hope of stimulating others and their
thinking.
The Placebo Effect and Expectant Faith
The placebo remedy (Frank, 4) symbolizes the healing power of
the care giver, healer, or physician. This individual's direct or
indirect message is that the chosen treatment or training effect
will make one better and will prove its effect through an increased
ability to cope with the demands of life or the stessors surrounding
an individual. In this manner, the "healer" seeks to promote a
state of mind in the patient which has been termed expectant
faith. Frank (3) in discussing this aspect of the healing process,
estimated that this emotion strongly affects states of subjective
stress and distress such as pain and anxiety. He reports, that on
the average, the placebo effect accounts for about 60% of the
effectiveness of all pain relievers. In fact, findings (Evans, 2)
support the view that the proportional effect of placebo is the same

151
regardless of the strength of the active drug -- it is 60% as
effective as aspirin and also 60% as effective as morphine.
Expectant faith (as evoked by a placebo) can lead patients to
report reduced pain, which may not account for the underlying bodily
changes. Some research (Mills, 6 and Mason, 5) supports the view
that expectant faith is associated with acceleration of bodily
healing after surgery. An example of speed of healing following
operational procedures is reported by Mason et al, in 1969 whose
sample consisted of 98 patients in two separate studies. Interviews
established acceptance of faith measures based on a paper-pencil
scale with questions dealing with aspects of level of trust,
optimism about outcomes, ability to cope, and a preparedness to
accept the good with the bad. Speed of healing was rated by the
surgeon independently without knowledge of the test scores. A
correlation of .61 was obtained between acceptance and speed of
healing; similar scores and correlations were found by Mills. These
researchers concluded that high acceptance and rapid healing occur
when the patient has faith in the healer, his methods and
procedures, and that consequently the healer should focus attention
on variables that enhance or destroy the patients' attitude of
faith.
The Placebo Effect of Medications and Operations
Frank further discusses these aspects, suggesting that
medications and operations are often symbols of the physician's

152
healing role and that they carry symbolic meanings that may have
dramatic healing effects that are not trivial. The healing
psychological effects of surgical procedures are particularly
striking with respect to operations on the heart. This was
demonstrated by Beecher (1) for relief of angina which consisted of
operationally tying off the internal mammary artery on the
supposition that this would increase coronary circulation. Forty
percent of the patients receiving this operation experienced
symptomatic relief. Mock operations (administered anesthesia and
opening of the skin but no actual contact with the mammary artery)
proved to be as effective as the real operation in reducing
patients' pain, causing them to reduce their use of nitro-glycerin
tablets and to increase their exercise tolerance. Thus, the placebo
effect was judged to be sufficiently powerful to affect the actual
functioning of the heart. This specific operation was therefore
abandoned and has been replaced by coronary bypass techniques. This
standard operation has been shown to be dramatically effective,
indicated by about 90% reduction in symptoms and an improved quality
of life. However, on objective tests of cardiac function, about 44%
showed no change, 38% were actually worse, and only about 20% showed
cardiac output improvement that could be directly attributed to the
increase of blood flow. The implications drawn by Ross (7) are that
coronary bypass is a very successful procedure for relief of
symptoms. However, it may be faulty to assume that the increased

153
functioning is caused by better blood flow as a result of the bypass
although the operation seemed to prolong life. The improvement in
90% was accompanied by improvement in heart function of 20%; so 70%
improved symptomatically with heart function the same or worse, and
82% could tolerate more exercise without pain.
The Placebo Effect and Psychotherapy
Expectant faith may be a significant adjunct in the reported
effects of psychotherapy. On the average, psychiatric outpatients
reported the same drop in discomfort after four months of three
forms of psychotherapy (group, individual, and minimal). As
reported by Frank (3), "In general, placebo responsiveness seems
related to willingness to depend on others for help and ready
acceptance of the socially assigned roles."
It is estimated that positive response is related to such
traits as dependency, emotional reactivity, and conventionality,
while failure to respond was related to isolation and a sense of
mistrustfulness.
The major healing components of psychotherapy are:
A systematic, emotionally charged, confiding
interaction between a (1) trained, and (2) socially
sanctioned healer and a sufferer in which the healer
seeks to relieve the suffer's distress and disability
through a symbolic communication, primarily words but
also therapeutic rituals or procedures."
Frank, (4, pg. 455)
Smith, Glass, and Miller (8) report that after assessing survey

154
studies, different forms of psychotherapy have consistently shown
that all are followed by improvement than passage of time without
psychotherapy but that with a few exceptions, different forms for
most persons and effects are slight if present at all. Their
explanation is that most patients come to therapy not for symptoms
alone, but because they are also demoralized and that this is a
major source of their distress. The core of demoralization,
according to Frank (3) is a sense of incompetence, feelings of
hopelessness, alienation, and cognitive unclarity as to the meaning
of symptoms and what to do about them. The features common to all
forms of psychotherapy that combat this sense of demoralization are:
1. An intense, emotionally charged, confiding
relationship.
2. A healing setting.
3. A rationale or conceptual scheme.
4. A procedure that requires dual participation of
patient and therapist.
The rationale combats demoralization by helping to overcome the
patients sense of isolation through the providing of a belief system
shared by both the patient and therapist.
The comparisons of therapies with placebos and comparison with
each other yields much evidence, the main aspect being that
differences are not regularly found. The placebo effect and
expectant faith can influence bodily and psychological processes and
are inextricably bound up with biofeedback procedures as with all

155
forms of therapy. Suggestions for further research in this area
include a study of the effects of expectant faith on both patients
and therapists and its positive power when it can be shown to have
such a positive and powerful effect.

156
REFERENCES
1. Beecher, H.K. "Surgery as placebo". Journal of the AmericanMedical Association, 1961, 176, 1102-1107.
2. Evans, F.J. "The placebo response in pain reduction". Advances
in Neurology, Vol. 4. New York: Raven Press, 1974. Pp. 289-
296.
3. Frank, J.D. "Psychotherapy: The restoration of morale".
American Journal of Psychiatry, 1974, 131, 271-274.
4. Frank, J.D. "Biofeedback and the placebo effect." Biofeedbackand Self-Regulation, 1982, 7, 449-460.
5. Mason, R.C., Clark, G., Reeves, R.B., & Wagner, B. "Acceptanceand Healing". Journal of Religion and Health, 1969, 8, 123-
142.
6. Mills, M., Mimbs, D., Jayne E.E., & Reeves, R.B. "Predicition
of results in open heart surgery". Journal of Religion andHealth, 1975, 14, 159-164.
7. Ross, J.B. "The problem of ischemic heart disease: Current
approaches and implications." Johns Hopkins Medical Review.1976, 38, 217-228.
8. Smith, M.L., Glass, G.V., & Miller, T.I. The Benefits of
Psychotherapy. Baltimore: Johns Hopkins University Press,
1980.

157
Appendix B
IS SOMETHING BETTER THAN NOTHING,
AND HOW MUCH N IS ENOUGH N ?
Two ancillary questions arise; first, does compressing the
experimental groups from three disparate and different treatment
strategies into one conglomerate and combined cell representing all
of the experimental subjects enable a significant difference to be
established for any of the various variables previously addressed?
Secondly, how many subjects are necessary within each cell (ideally)
for significant differences to be shown to exist for between levels
of significance so that rejection of the null hypothesis can be done
with confidence? The first question is based on the assumption,
perhaps a bit unorthodox but with a bit of credence, that something
is perhaps better than nothing. That is, the premise may exist that
by allowing the subjects to enter into the specified treatment
sessions with the assumption that something significant will occur,
some change will result as a product of involvement. This may be
likened to the previously discussed (appendix A) "expectant faith"
or placebo effect. The direct or indirect message is that the
chosen treatment or training effect will make us better, will prove
itself or its effects through an increased ability to cope with
stress or the demands of the competitive event. By this route the
coach may seek to promote a state of mind in the athlete which has
been termed "expectant faith".

158
If all of the treatment groups are combined and then compared
to the control group, will a significant difference exist on any of
the variables? A practical and working hypothesis for this
exploratory examination of the data might be: there is significant
difference between the combined treatment groups and the control
group on the psychological and physiological measures after
treatment at the sixth week and eighth week assessments.
A T test for analysis of variance (ANOVA) was run on the
original data using the Statistical Package for the Social Sciences
(SPSS) with an N of 27 in the experimental group designated as Group
1; Group 2 was the control group with an N of 9. The tables depict
the Pre, Post I, and Post-Test II means for the data treated in the
above manner. Analysis of variance (ANOVA) indicates that the
combined experimental group with an N of 27 is not significantly
different than the control group on any of the variables at the pre-
test assessment. EMG II ANOVA indicates that group I realized a
significant reduction in tension as measured by electromyography
when compared to the control group at this first assessment. This
indicates that members of group one collectively realized a reduced
level of tension at the end of the first one half hour session as
compared to the control group who listened to "music of choice".
Thus, even after involvement in the first relaxation session (QR,
BF, and QRBF) the experimental group realized a reduction in tension
as is compared to the control group who sought relaxation by

159
listening to music.
Does "expectant faith" account for the reduction in EMG at this
first session? It is not likely that the placebo effect alone is
acting as the independent variable at this first session. A
reduction in tension or EMG measures is not demonstrated for the
control group as would be assumed as all four groups were led to
believe that positive effects might be the result of the various
strategies to include listening to "music of choice". It is
therefore reasonable to assume that the reduction of tension
evidenced by group one is attributed to the independent variable of
the particular treatment effect
Table 2 portrays the result of analysis of variance of the data
at the sixth week assessment (Post-Test I), and further reveals that
a significant difference exists for systolic blood pressure along
with EMG I and EMG II. Hence, if it can be assumed that compression
of experimental groups is permissable, a significant reduction has
occurred for these measures between the experimental group 1 and
control group 2. The working hypothesis is upheld for systolic
blood pressure and EMG measures but is rejected for STAI, IE,
diastolic blood pressure, and heart rate BPM.
Examination of Table 3 indicates support of the working
hypothesis for systolic blood pressure and EMG I and EMG II as
observed in Table 2 with the exclusion of the previously mentioned
dependent variables. This eighth week assessment indicates a

VARIABLE
STAI
NUMBEROF CASES MEAN
STANDARDDEVIATION
*STANDARD *ERROR *
*
SEPARATE VARIANCE ESTIMATET DEGREES OF 2-TAIL
VALUE FREEDOM PROB.
GROUP 1 27 43.4815 10.093 1.942 * .32 11.66 .753
GROUP 2 9 42.0000 12.540 4.180 *
SCAT *
GROUP 1 27 26.3333 8.910 1.715 * .31 23.06 .758
GROUP 2 9 25.5556 5.434 1.811 *
IE *
GROUP 1 27 10.2222 3.609 .695 * 0 12.82 1.000
GROUP 2 9 10.2222 3.930 1.310 *
SYST *
GROUP 1 27 126.8889 12.358 2.378 * -.55 12.51 .588
GROUP 2 9 129.7778 13.890 4.630 *
DIAS *
GROUP 1 27 70.4074 12.662 2.437 * .51 12.40 .620
GROUP 2 9 67.6667 14.405 4.802 *
BPM *
GROUP 1 27 65.1481 13.516 2.601 * -.29 14.70 .779
GROUP 2 9 66.5556 12.551 4.184 *
EMG I *
GROUP 1 27 3.9137 1.465 .282 * 1.22 22.93 .236
GROUP 2 9 3.4133 .898 .299 *
EMG II *
GROUP 1 27 1.4589 .829 .160 * -4.37 11.10 .001
GROUP 2 9 3.2267 1.115 .372 *
TABLE AANOVA For the Variables on Pre-Test Assessment

VARIABLE
STAI
NUMBEROF CASES MEAN
STANDARDDEVIATION
*
STANDARD *ERROR *
*
SEPARATE VARIANCE ESTIMATET DEGREES OF 2-TAIL
VALUE FREEDOM PROB.
GROUP 1 27 37.9630 10.574 2.035 * -.94 13.41 .363
GROUP 2 9 41.8889 10.891 3.630 *
SCAT *
GROUP 1 27 24.3333 8.575 1.650 * -.05 24.33 .963
GROUP 2 9 24.4444 4.978 1.659 *
IE *
GROUP 1 27 8.7778 3.130 .602 * -1.10 15.32 .287
GROUP 2 9 10.0000 2.784 .928 *
SYSTGROUP 1 27 118.4815 8.777 1.689 * -3.04 23.42 .006
GROUP 2 9 125.8889 5.278 1.759 *
DIAS *
GROUP 1 27 69.5926 9.476 1.824 * .20 18.31 .845
GROUP 2 9 69.0000 7.106 2.369 *
BPM *
GROUP 1 27 61.6667 11.984 2.306 * -.65 17.05 .526
GROUP 2 9 64.2222 9.602 3.201 *
EMG I *
GROUP 1 27 1.8133 .628 .121 * -3.27 9.22 .010
GROUP 2 9 3.3133 1.326 .442 *
EMG II *
GROUP 1 27 .6944 .385 .074 * -6.90 8.58 .000
GROUP 2 9 3.4400 1.174 .391 *
TABLE BANOVA For the Variables on Post-Test I Assessment

VARIABLE
STAI
NUMBEROF CASES MEAN
STANDARDDEVIATION
*
STANDARD *ERROR *
*
SEPARATE VARIANCE ESTIMATET DEGREES OF 2-TAIL
VALUE FREEDOM PROB.
GROUP 1 27 37.7407 10.380 1.998 * -.92 12.46 .376
GROUP 2 9 41.7778 11.734 3.911 *
SCAT*
GROUP 1 27 22.9630 7.714 1.484 * -.72 21.91 .479
GROUP 2 9 24.5556 4.927 1.642 *
IE*
GROUP 1 27 9.1481 3.393 .653 * -1.62 18.11 .124
GROUP 2 9 10.8889 2.571 .857 *
SYSTGROUP 1 27 118.7407 6.780 1.305 * -2.23 11.93 .046
GROUP 2 9 125.4444 8.141 2.714 *
DIAS*
GROUP 1 27 70.2593 8.786 1.691 * .09 16.67 .931
GROUP 2 9 70.0000 7.194 2.398 *
BPM *
GROUP 1 27 63.2222 11.240 2.163 * -.28 18.33 .781
GROUP 2 9 64.2222 8.423 2.808 *
EMG I*
GROUP 1 27 2.0889 .704 .136 * -2.76 10.34 .020
GROUP 2 9 3.1556 1.086 .362 *
EMG II *
GROUP 1 27 .8282 .440 .085 * -6.42 8.99 .000
GROUP 2 9 3.1022 1.032 .344 *
TABLE CANOVA For the Variables on Post-Test II Assessment

163
maintenance in the reduction of those measures that were discerned
at post-test I, hence acceptance of the working hypothesis is
warranted for systolic blood pressure and EMG tension levels only at
the eighth week assessment.
Conclusions and Discussion
This data indicates that a significant difference exists
between the combined experimental group and the control group on EMG
measures and systolic blood pressure. This would support the
contention that BF, QRBF, and QR training strongly influences these
bodily or physiological processes. This cannot be supported under
the limitations of the working hypothesis for the psychological
measures of STAI, IE, SCAT, and the physiological measures of
diastolic blood pressure and heart rate as measured in beats per
minute.
It is known that high blood pressure increases the probability
of coronary artery diseases and are linked, through stress, with
cardiovascular problems. Persons with high blood pressure are often
limited in the activities in which they can participate. Often,
until recently, use of drugs and surgery were predominant as a
treatment for high blood pressure. The following treatment of the
data indicates support to research cited in the body of the review
of literature and presents evidence that relaxation and feedback
techniques can be applied to reduce systolic blood pressure.
Further, relaxation programs have been found by some

164
researchers to have a profound effect upon levels of tensions that
also resulted in a decrease of anxiety (both Trait and State) when
applied either as a sole treatment strategy or combined with
augmented biofeedback. This treatment of data in a compressed
manner however, does not support the contention that a reduction in
psychological measures will be a product of a significant reduction
in muscular tension. A significant reduction in EMG and systolic
blood pressure is not related to a concomitant reduction in the
perception of the self-related measure of State Anxiety as measured
by the Sports Competition Anxiety Test, and to measures of Trait
Anxiety and Internal/External Locus of Control.
Ideal Sample Size
Discussion now turns to the question of levels of significance
and number of subjects (ideally) necessary for between levels of
significance to be shown so that rejection of the null hypothesis
can be done. This question can be answered in an oblique fashion by
dealing with two aspects. Often, the lack of statistical
significance reported in data analysis is attributed to the extreme
small size of the sample or experimental group being evaluated.
When small N investigation is used in research, the affected change
or outcome of any one tactic as reflected by change in the measured
variable often must be enourmous for true significance to occur.
165
Perhaps, by increasing the number of subjects in each cell to a
specific N, statistical significance might occur, given the data at
hand. The first consideration is a procedure which is very
sensitive to errors in estimating and determining sample size and is
detailed in "Sample Size Tables" developed by Cohen. J. Cohen's
Statistical Power Analysis for the Behavioral Sciences, Academic
Press, New York: 1969, pp. 247-61, yield minimum sample size
listings when the following criteria are considered:
1. Probability level,
2. Effect size, and
3. Power level.
Entry points for the tables are calculated by various methods
appropriate to the design matrix. The table entry for a design as
utilized in a combined format as presented as a T test with a two-
tailed level of significance at the .05 level with a power of .80
(suggested for the social sciences) advises a minimum size criteria
of 95 persons per cell, or a total of 190 athletes in a study
employing one treatment group and a control group for eight
variables.
However, when a matrix is formed that allows for examination of
data for three treatment groups plus a control group for eight
variables as portrayed in the main study, an entry point for this F
test configuration advises for a minimum cell size of 15 subjects
per group. A total of 60 athletes would then be necessary for the

166
investigation of the previous variables with three treatment groups
and a control group for a total of eight variables (STAI, SCAT, 1E,
EMGI & II, SYST & DIAS, and BPM).
A second method of determining the speculated size or N per
cell is now presented, this method represents a calculation that is
perhaps best perceived and interpreted as a "guesstimate" as the
source of the formula given is not found within statistical texts.
Rather, the formula was given to this researcher by Mr. David Neiss,
a member of the staff at the Milne Computer Center, Oregon State
University. It has been pointed out by this individual that the
following technique is perhaps best utilized for purposes of
speculation and discussion of the data rather than as a proven
method of determining significance.
The formula follows:
d = 1/2 x S2 (1.96)
Where: d = additional N per cell
S = Error Mean Squared
N = original N of 36
1.96 = T value at .95 significance

167
Utilizing the above formula for the treatment of the data at hand
(Tables 1, 3, 5, 7, 9, 11, 13 and 15) for the variables the
following occurs:
Variable d Per Cell Total N
STAI 5.96 23.84 59.8
SCAT 4.31 17.24 53.2IE 1.85 7.40 43.4BPM 6.57 26.28 62.2SYST 4.39 17.56 53.5DIAS 4.99 19.96 55.9
Therefore, by increasing the number of subjects to 15 in each group
or a total of 60, it may have been possible to establish statistical
significance at the .05 level, given the data at hand.
This would mean that under ideal circumstances, a design that
would afford the examination of three treatment groups utilizing a
repeated measures ANOVA would necessitate a total of 60 athletes of
the same gender, perhaps a number beyond reason for the practical
researcher in the individual sports area and perhaps beyond
logistics when one considers the scheduling and equipment needs for
a program of this size.
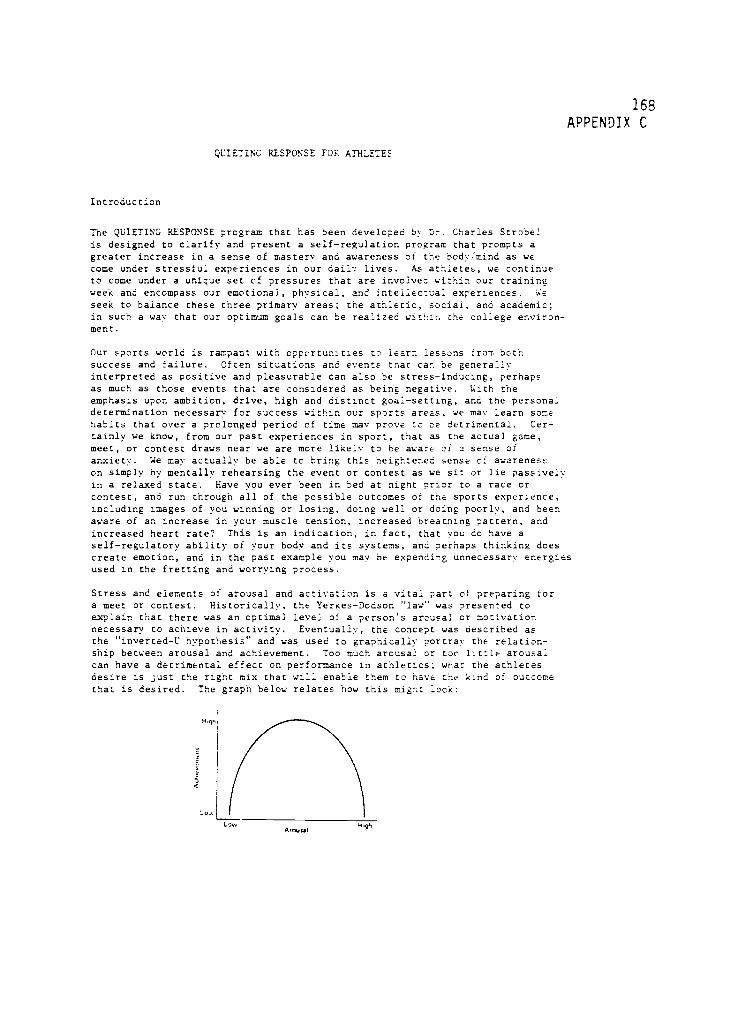
168APPENDIX C
QUIETING RESPONSE FOR ATHLETES
Introduction
The QUIETING RESPONSE program that has been developed by Dr. Charles Strobelis designed to clarify and present a self-regulation program that prompts agreater increase in a sense of mastery and awareness of the bodyimind as wecome under stressful experiences in our daily lives. As athletes, we continueto come under a unique set of pressures that are involved within our trainingweek and encompass our emotional, physical, and intellectual experiences. We
seek to balance these three primary areas; the athletic, social, and academic;in such a way that our optimum goals can be realized within the college environ-ment.
Our sports world is rampant with opportunities to learn lessons from bothsuccess and failure. Often situations and events that can be generallyinterpreted as positive and pleasurable can also be stress-inducing, perhapsas much as those events that are considered as being negative. With theemphasis upon ambition, drive, high and distinct goal-setting, and the personaldetermination necessary for success within our sports areas, we may learn somehabits that over a prolonged period of time may prove to be detrimental. Cer-
tainly we know, from our past experiences in sport, that as tne actual game,meet, or contest draws near we are more likely to be aware of a sense ofanxiety. We may actually be able to bring this heightened sense of awarenesson simply by mentally rehearsing the event or contest as we sit or lie passivelyin a relaxed state. Have you ever been in bed at night prior to a race orcontest, and run through all of the possible outcomes of the sports experience,including images of you winning or losing, doing well or doing poorly, and beenaware of an increase in your muscle tension, increased breathing pattern, andincreased heart rate? This is an indication, in fact, that you do have aself-regulatory ability of your body and its systems, and perhaps thinking doescreate emotion, and in the past example you may be expending unnecessary energiesused in the fretting and worrying process.
Stress and elements of arousal and activation is a vital part of preparing fora meet or contest. Historically, the Yerkes-Dodson "law" was presented toexplain that there was an optimal level of a person's arousal or motivationnecessary to achieve in activity. Eventually, the concept was described asthe "inverted-U hypothesis" and was used to graphically portray the relation-ship between arousal and achievement. Too much arousal cr too little arousalcan have a detrimental effect on performance in athletics; what the athletesdesire is just the right mix that will enable them to have the kind of outcomethat is desired. The graph below relates how this might lock:
to.'.
toy.Arousal
417h

169
The optimal level of arousal for each unique sports task will vary for eachindividual and each unique setting. Generally, excessive arousal can causea lack of coordinated responses and poor decision-making in the athletic event.We are all familiar with the time we tried so hard that we almost guaranteedfailure, or in an effort to control an action on too high a thinking levelwe suffered from "paralysis by analysis." Also, not enough arousal may bereflected in low motivation and a missing of important cues or executing slow,inefficient movement skills. Obviously then, what would be ideal is a mixturethat allows for the optimal level in performance and allows us to accommodatethe unique demands of our sport. Usually, the skills that are repetitive andsimple in nature and require power, require more arousal and effort. On theother hand, complex, discreet, and refined movement requires less arousal toinsure success. Your specific sport has its unique demands in regards toarousal and preparation for practice or the contest.
The research, generally, supports that nigh anxiety individuals perform toa lesser extent under audience condition than do low and moderate anxietysubjects (Ganzer, 1968; Cox, 1966, 1968). Vaught and Newman (1966) foundthat low anxiety subjects made fewer errors than high anxiety subjects on asteadiness test when competition exaggerated the test conditions. Mandierand Sarason (1952) contend that complex tasks usually present an explicitthreat of failure to high anxious people, which may produce interferingresponses during performance and cause a reduced skill level and lack ofsuccess. Many researchers have found that high anxiety individuals in sportsare likely to suffer from a reduced effectiveness in both self-concept and inpoorer physical performance within a competitive contest. We all are awareof the individual, perhaps including ourselves, who does a tremendous joband shows skill within the practice setting but suffers a decrease ineffectiveness or skill in the actual game, meet, or contest situation.Perhaps as you participate in this QUIETING RESPONSE program You may becomemore aware of your ability to regulate and interpret your levels of bodytension and be able to free up energies that can contribute to improvedperformance.
Perhaps more importantly, your ability to relax may have some direct healthimplications. Kenneth Pelletier (1977) maintains that stress disorders arebased upon the slow, developmental accumulation of psychological and physicalstress responses throughout the lifetime of an individual. Bence, the sportsenvironment that places high expectations upon participants and is unrelentlessin its judgmental and value-setting nature; the one in which there is a cleardemarcation of winners and losers, good guys and bad guys; the same settingwhere values and attitudes may be created may also serve to set a stage wherelater behavior techniques are rehearsed that may have a negative health impact.
Our body mobilizes itself for action by a readiness response; we often canconsciously get "up" for a contest by "psyching" or thinking about the event.We may actually cut down on our efficiency if we over-psyche or mentallyprepare ourselves in an inappropriate manner. The intent of this programis to make athletes more aware of the causes and effects of stress. More andmore stress-producing pressures are placed on many of our athletes within thesports setting, therefore, it is vital that athletes learn how to controltheir levels of stress and to remain calm in the face of their problems andpressures within the context of their sport. Through the use and incorporationof the program and through continued practice, it is hoped that the athletewill be able to incorporate the techniques in order to maximize athleticperformance and to continue to cope with the problems of life in a reasonableand healthy manner.

170To begin with, it is helpful to gain an impression of how you feel right now.
This can give you a sense of what benefits you can expect from QUIETING RESPONSEtraining and a standard with which you can measure your progress as you developand use the new quieting skills. The item that you will fill out is called theSports Competition Anxiety Test and is used to measure trait anxiety (how youusually feel). The results will be shared with you at the start and finish ofthe program to provide you with feedback on your progress. Competitive traitanxiety is defined by Rainer Martens, the developer of the test, as a tendencyto perceive competitive situations as threatening and to respond to these situa-tions with feelings of apprehension or tension.
Stress Disorders. A number of common disorders are often caused or made worseby overreaction to stress. However, some of these disorders may result also fromsome other medical problems. If during the training you notice a worsening ofany of these stress related problems, discontinue training until you have con-sulted the athletic trainer or spoken with the staff at the health clinic oncampus. The following disorders are linked to stress and its negative effects.QUIETING RESPONSE training may aid in your ability to manage stress throughself-regulation and your ability to recognize the situations that bring aboutyour stressed conditions.
Migraine HeadachesMuscle Contraction HeadachesLower BackacheNeck PainSevere AnxietyPainfully Cold Hands & FeetGastro-Intestinal Problems
Frequent Anger StatesAsthmaHigh Blood PressureFainting SpellsPersistent Muscle SpasmChronic FatigueSleeplessness & Insomnia
WARNING: Since QUIETING RESPONSE TRAINING can have veryprofound effects on your body and its tolerance for medi-cations, if you are currently taking medication for diabetes,thyroid condition, or severe depression, you should beginthe training ONLY UNDER YOUR PHYSICIAN'S SUPERVISION. Also,
should you notice a worsening of any of these stress relatedproblems, immediately discontinue training until you haveconsulted your physician, or the trainer or coach.

171
THE NATURE OF QUIETING RESPONSE TRAINING
When your ancestors lived in the wilds, they needed a "fight or flight" reactionto survive. When they came upon a tiger, a mastodon, or a warring tribe, theirbodies responded with a shot of adrenalin, faster breathing, and a quicker heartrate. This gave them the extra strength they needed to either fight or fleeto safety.
Modern day stressors rarely involve physical threats to life. The stressfulsituations athletes encounter most frequently, such as the demands of classesand assignments, the potential stressors in our social lives, and the regimenof training, often require mental rather than physical arousal. When the fightor flight reaction of the body occurs in the absence of an immediate physicalthreat, it may lessen the mental alertness you need to solve wnatever problemis causing the stress. This overreaction is a maladaptive response. However,many of us have learned to activate the emergency response a: the slightestprovocation, until it becomes a dominating pattern in our life.
The body of a healthy person will quickly recover its normal :siologicalbalance after its initial reaction to stress. This is the body's inherentQUIETING RESPONSE. However, if you are suffering from any of the signs ofstress listed above, it is likely that your body is maintaining a high levelof arousal for much longer than it should. You may have unconsciously taughtyour body to override your natural QUIETING RESPONSES, until constant tension.anxiety, and tightness begin to seem normal. This abnormal state of higharousal has been linked to the development of kidney diseases, ::vpertension,hardening of the arteries, ulcers, suppression of the body's defense againstcancer, and infection by microorganisms and bacteria.
In the course of the training you will learn to recognize when you are over-reacting to stress and learn specific techniques to brine your body back toa healthy level of activity. If you are willing to learn the QUIETING RESPONSE,to practice it regularly, and to use it consciously in life situations, Youwill be able to help keep your body healthy and lessen your chances of sufferingfrom stress and too much arousal.
Repetition and practice are important elements in mastering movement skillsin athletics; proficiency in throwing and catching a football, in setting avolleyball, and in mastering a complex dive can be related to rehearsal andrepetition. Repetition may be the most important part of the training, sinceyou are now setting the stage for making the QUIETING RESPONSE an automaticand unconscious part of your life. Your conscious practice of the QUIETINGRESPONSE should continue until you no longer find yourself responding excessivelyto stress. At this point, the QUIETING RESPONSE has become an inherent partof your body's response mechanisms, and vou are free from the self-destructivehabit patterns that had kept you in an uncomfortable state of constant tension.
DESCRIPTION OF THE TRAINING
The QUIETING RESPONSE TRAINING is contained on the eight cassettes whichaccompany this manual. Each cassette, except the first one, contains aseparate element of the training. The first cassette is an introduction tothe program.

172
It is best tc practice the QUIETING RESPONSE at the same time each day.Many people prefer to do their exercises in a quiet room free from dis-tractions. If possible, use a comfortable arm chair. If you find yourselffalling asleep during the exercise, postpone your practice until you arerested and alert.
During the course of the training, you may feel unusual sensations ofheaviness, warmth, tingling in your hands, feet, or forehead, temporarynumbness, floating, or detachment from your surroundings. You may alsoexperience unusual emotions and memories as quieting becomes more profound.These are all normal reactions as your body begins to relax for perhapsthe first time in years. Don't be concerned if you experience them.
It is important to keep systematic record_ of your progress. The recordsheets beginning in the manual provide a useful way of keeping track ofyour developing skills. (We suggest you set aside a few minutes eachevening to think about and record your experience of the day.)
SELECTED REFERENCES
The following books will provide you with further useful information onthe subject of relaxation training.
Benson, Herbert, THE RELAXATION RESPONSE (William Morrow, 1973).Carrington, Patricia, FREEDOM IN MEDITATION (Anchor Press, 1977).Jacobson, Edmund, YOU MUST RELAX (McGraw-Hill, 1978).Lamott, Kenneth, ESCAPE FROM STRESS (J. P. Putnam, 1975).Martens, Rainer, SPORT COMPETITION ANXIETY TEST (Human Kinetics
Publ., 1977).Pelletier, Kenneth R., MIND AS HEALER, MIND AS SLAYER (Delta, 1977).Selye, Hans, STRESS WITHOUT DISTRESS (Lippincott, 197»).

173QUIETING RESPONSE Training Program
Summary of the Eight Exercise Elements
Exercise Element #1, QUIETING RESPONSE Learning: Introduction
This introduction discusses the relationship between your perceptions ofstress and the onset of a variety of physical symptoms. It distinguishesbetween the "fight or flight" or "emergency response" and its opposite, theQUIETING RESPONSE. You should note the contrast between this self-masteryapproach to health and the traditional medical model where the physicianis typically asked to assume total responsibility for treatment.
Exercise Element #2, Breathing: Basic Element of the QUIETING RESPONSE
This exercise teaches you two fundamental breathing skills. The first is asimple but very important awareness technique where you become alert to therelationship between breathing patterns and different levels of body tension.The second is a method for breathing which you can use to initiate QUIETINGRESPONSE. This technique involves a slow, deep, regular form of breathingwhich starts with your diaphragm. If, during this exercise, you take insubstantially more oxygen than your body is accustomed to, you may feel atemporary dizziness. If this occurs, slow your breathing somewhat and relaxin the chair until the sensation passes. Remember that correct breathingpatterns cannot be taken for granted. Consequently, mastering the breathingtechniques described in this exercise is essential before you move on to thenext step. You will notice that each of the subsecuent exercises begins witha brief period of correct breathing.
This exercise also introduces a second fundamental principle for QUIETINGRESPONSE learning -- cultivation of a passive attitude during training, whereyou direct your attention easily and effortlessly to various parts of yourbody. This technique will be used repeatedly in later elements of thetraining program.
Exercise Element #3, Relaxing Skeletal Muscles for the QUIETING RESPONSE
Your skeletal muscles are those over which you already exercise relatively easyconscious control- -such as the muscles which allow you to move your fingers,arms, legs, neck and so forth. This exercise element gives you instructionsfor tensing and relaxing such muscles throughout your body. The purpose ofthis element is to help you become more aware of the distinction betweentension and relaxation, and to recognize subtle changes throughout your body.You are also taught to become more aware of the relationship between skeletalmuscular tension levels and your breathing as you passively observe those twoactivities in yourself. Eventually you will find that correct breathing andreleasing tension in these muscles will produce feelings of substantial relaxa-tion which may be new to you. Just let these changes occur as You follow theinstructions.
Exercise Element #4, Relaxing Smooth Muscles for the QUIETING RESPONSE
Smooth muscles in your body generally operate without your even knowing it.These are the muscles, for example, which surround your veins and arteriesand determine, to a large degree, how much blood flows to your fingers, hands,arms, feet, legs, and other extremities. This exercise teaches you to relax

such muscles, thereby increasing blood flow and, as a result, the warmth of
your extremities. The method, a form of so-called "autogenic training," isdifferent from the one which you used to relax your skeletal muscles throughconscious release. Here, you are instructed to imagine warmth and heavinessflowing to your hands, feet, and so forth. This indirect approach willeventually result in actual self-control. Again, you will learn to recognizethe connection between deep, slow breathing and sensations of warmth andheaviness which indicate relaxation of the muscles in the walls of your arteries.
Exercise Element #5, Contrasting Muscle Tension and Relaxation for theQUIETING RESPONSE
In this exercise, you are taught how to combine relaxation of your skeletaland smooth muscles. Here, the instructions integrate self-suggestions andmental images which link both forms of relaxation and produce a more profoundeffect.
Exercise Element #6, Combining Skeletal and Smooth Muscle Relaxation forthe QUIETING RESPONSE
At this point in your training program, you may become concerned about thefairly elaborate series of exercises, self-suggestions and images with whichyou have been working in earlier sessions. You may wonder how it is possibleto remember all of these instructions when conducting practice on your owntime. This element consolidates those instructions in a simple nine-stepprocedure which integrates and builds upon what you have already learned. Do
not be overly concerned about memorizing this nine-step sequence. The realpoint of this exercise is to allow you to discover what combination of exercisesis most effective for you in achieving a true sense of heaviness and warmth andrelaxation in both your skeletal and smooth muscles. After reviewing the ninesteps two or three times, it is advisable that you select those parts of thesequence which you find most effective for yourself and to concentrate uponthose particular elements as you continue your QUIETING RESPONSE practice.
Exercise Element #7, Ten Steps to the Integrated QUIETING RESPONSE
This exercise reviews the nine-step exercise which you accomplished inElement 46 and adds a tenth step called the "Daily Review." This last stepis particularly useful for learning how to cope with problems and time pressuresin your daily life. It is particularly important because the real purpose ofQUIETING RESPONSE training is to give you a skill which can be used at thosetimes during your daily life when stress builds to undesirable levels.
Exercise Element #8, Using the QUIETING RESPONSE in Daily Life
At this point you are ready to integrate the QUIETING RESPONSE into your dailylife. This Exercise Element describes how you can accomplish this very impor-tant transition. Basically it involves frequent use of the brief, six secondQUIETING exercise at many points during the day whenever you confront annoyingor stressful situations. Ideally this will mean that you use the QUIETINGRESPONSE seventy to a hundred times every day. At the beginning you may haveto remind yourself repeatedly to go through this very simple exercise. Even-
tually, however, it will become second nature to you. After some time, usuallyaround six months, the QUIETING RESPONSE begins to have its maximum effect uponyour body and mind. If you have conscientiously maintained your practice it isat this point that relaxation of your skeletal and smooth muscle systems becomes
174

175virtually automatic. When this happens your body will nc longer over-reactto stressful situations, enabling you to deal much more effectively with thehectic pace of today's typical life style.
REMINDER: If at any point during QUIETING RESPONSE training you shouldnotice a marked change in your health or tolerance of medications you maybe taking, you should consult with your physician. Note that if you aresuffering from diabetes, thyroid condition, or severe depression, you areadvised to begin the training ONLY UNDER YOUR PHYSICIAN'S SUPERVISION.

TEN-STEP GUIDE FOR PRACTICING THE QUIETING RESPONSE(TAKEN FROM EXERCISE ELEMENT #7)
. Sit or lie down in a comfortable position with your eves closec.
2. Carry out quiet, easy breathing for 30 to 40 seconds.
3. Lift your arms slowly, high above your head, and take a deep, deep breath.Hold your breath and then slowly lower your arms and hands, and when your armsand hands touch your sides or your chair, breathe out and go completely limp.
Hold your arms in front of you as if you were praying. Take a deep breath,and, holding it, press your hands together until you feel your arm muscles
begin to tremble. Maintain that tremble as long as you can, and then breathe
out and go completely limp.
Take a deep breath and hold it, slowly drawing your hands toward your face.When your hands touch your face, breathe out and let yourself go completelylimp, letting your hands fall to your sides.
Again, bring your hands to a prayer position, holding them about 7 inches
apart. Notice a feeling of warmth between your hands, as You continuebreathing deeper and deeper. Then relax and bring your hands to your sides
in a comfortable position.
4. Imagine a spot of warm sunlight on the top of your head.
5. While doing this, imagine your body as a hollow vessel.
6. Now let the wtrm sunlight shining on Your head slowly flow into thevessel, filling it, beginning with your toes, moving on up through yourlegs, your abdomen, and your chest.
7. Feel the warmth reach your shoulders, where it spills over and flows intoyour arms and fingers, filling your arms until your body begins to have a warm
and heavy feeling.
8. Continue to pay attention to quiet breathing.
9. With Your eyelids closed, gently focus your eyes on an imaginary point just
in front of the tip of your nose. Imagine that spot is a ball of warn sunlightwhich now changes to the misty, cool, white-blue light of a winter moon, fillingyour mind like a blank screen. Float in this state for several minutes.
10. Conduct your daily review, making your mind like a blank movie screen, andplaying the activities of your day backwards on that screen, observing objective-ly and passively, reacting neither positively nor negatively to events during
your day.
SUKMARY QUIETING RESPONSE EXERCISES (TAKEN FROM EXERCISE ELEMENT #8)
Whenever you encounter a stressful situation and wish to relax, check your
breathing. If it is shallow, indicating excessive tension, say to yourself,"What a stupid thing to do to my body." Then, take a slow, deer breath, a
count of four in, an easy count of four out. Repeat this, and as you are exhal-
ing let your body go totally limp, imagining feelings of warmth and heavinessflowing from your neck down to your toes, reaching your toes at about the sametime you have finally let the breath out. Then carry on your normal activity.
176

177
RECORD KEEPING
Use these records to keep track of your experiences during QUIETING RESPONSE
training. As you fill in each column over the weeks of practice, you willbecome more aware of your pattern of response to stress. This awareness is
vital in learning to eradicate the habit of overreacting to stressful situa-
tions. Use a scale of 0 to 10 to record your tension level, with 0 indicating
a feeling of complete relaxation, and 10 indicating maximum tension.
Recording your level of tension before and after practice helps you becomemore conscious of the tension you are holding in your body. Do not be con-
cerned if tension is reduced only slightly at first.
Recording any unusual feelings you experience during practice helps youbecome more familiar with your body's response to its growing quieting skills.
Note any body areas which still feel tense after practice. If certain body
areas continue to be tense after several sessions, try focusing your attention
on relaxing these areas when you next dc your quieting exercises.
Recording the stressful situations which you encounter during the day helpsyou become more aware of the circumstances to which your body responds with
excessive tension. You will soon be able to foresee such situations and use
the QUIETING RESPONSE to relax before stress occurs.

BREATHING: BASIC ELEMENT OF THE Ilk: QR Exercise Element #2 (tape MV8-2)178
Day
Tension Levels Unusual FeelingsDuring
Practice
Body AreasStill Tense
After Practice
ExperiencesWhich CausedStress Today
ClearSigns of
Stress TodayBefore
PracticeAfter
Practice
1
2
3
4
5
6
7
RELAXING SKELETAL MUSCLES: QR Exercise Element r3 (tape MV8-3)
Tension Levels Unusual FeelingsDuring
Practice
Body AreasStill Tense
After Practice
ExperiencesWhich CausedStress "Today
ClearSigns of
Stress TodayI
Before
Day I PracticeAfter
Practice1
i
2
3
4 I
5 I
16-11
7 I
RELAXING SMOOTH MUSCLES: QR Exercise Element #4 (tape MV8-4)
Day
Tension Levels Unusual FeelingsDuring
Practice
Body AreasStill Tense
After Practice
ExperiencesWhich CausedStress Toaay
CliarSigns of
Stress Today
Before, Practice
AfterPractice
I
2
3
4
5
6
7

CONTRASTING MUSCLE TENSION AND RELAXATION: QR Exercise Element #5 (tape MV8-5)
Tension Levels Unusual FeelingsDuring
Practice
Body AreasStill TenseAfter Practice
ExperiencesWh;ch Caused.Stress Today
ClearSigns of
Stress Today
BeforePractice
AfterPractice
COMBINING SKELETAL ANC SMOOTH MUSCLE RELAXATION: QR Exercise Element ;6 (tape MV6-6)
Tension Levels Unusual FeelingsDuringPractice
Body AreasStill TenseAfter Practice
ExperiencesWhic!, Caused
Stress Today
ClearSigns of
Stress Today
BeforePractice
AfterPractice
TEN STEPS TO THE INTEGRATED QR: QR Exercise Element F7 (tape Ml/8-7)
Tension Levels Unusual FeelingsDuringPractice
Body Areas
Still TenseAfter Practice
ExperiencesWhich CausedStress Today
ClearSigns of
Stress Tocay
BeforePractice
AfterPractice
I
1
1
179

180
QUIETING RESPONSE GENERALIZATION TRAINING LOG
Be sure to continue keeping track of your response to stress afteryou have entered the practice and reinforcement stage of the training.
By recording both the situations in your life which are still causingyou stress and the signs of stress you experience, you will increaseyour benefit from the training in two ways. First, you will be ableto see your progress in reducing the number of situations to which yourespond with excessive stress. You will also be able to pinpoint thesituations in which you must consciously use the QUIETING RESPONSE, andlearn on which body areas you should focus your attention .hen relaxing.
Be sure to mark down whether you tried the six second QUIETING RES-PONSE and if it was helpful. If you forgot to use the QUIETING RESPONSEin a stressful situation, be more conscious of your QUIETING TRAININGthe next time that situation arises. If you find that using the QUIET-ING RESPONSE does not seem to be helpful, you may wish to return to anearlier QR exercise and practice until deep relaxation consistentlyoccurs after five minutes.
Exercise Element #8 (tape MV8-8)
Day
Stressful or AnnoyingSituations Today
Clear Signs orSymptoms of Stress
Did You Trythe 6 SecondQuieting Exercise?
Was It
Helpful?
WeekDay 1
2
3
4
5
6
7
WeekDay?
2
3
4
5
6
7

181
QUIETING RESPONSE GENERALIZATION TRAINING LOG (cont.)
Dax.....
Stressful or AnnoyingSituations Today
Clear Signs orSymptoms of Stress
Did You Trythe 6 SecondQuieting Exercise?
Was It
Helpful?
Week
Day 1
2
3
4
5
6
7
Week,
Day 1
2
3
4
5
6
7
Week
Day 1
2
3
4
5
6
7

Variable
Description
Sample
Reliability
182Appendix D
SPORT COMPETITION ANXIETY TEST(Rainer Martens 1977)
Competitive A-trait is a construct that describes individualdifferences in the tendency to perceive competitive situationsas threatening and to respond to these situations with A-statereactions of varying intensity. Items were developed bymodifying Spielberger's STAIC, Sarason's General AnxietyScales, and Taylor's Manifest Anxiety Scale.
The SCAT was developed for the purpose of providing areliable and valid instrument for measuring competitiveA-trait. SCAT was initially developed for use with childrenbetween ages 10-15 years. Shortly after the initial stepsto develop SCAT, it was deemed desirable to develop theadult form. After inspection, the instructions were modi-fied in the adult form. Instrument development involvedtesting over 2500 person:..
Athletes within the setting of elementary school, juniorhigh, high school, and college and professional ranks havebeen sampled to date.
The intercorrelation based on test-retest is .77, well abovethe accepted criterion level. A reliability coefficient of.85 for SCAT was achieved using only the analysis of variancemethod on the same sample as used for the item analyses.
7alidity Concurrent validity for general A-trait scales and sport-specific A-trait of .28 to .46 is clear support for theconcurrent validity of SCAT.
Location Martens, Rainer, Snort Competition Anxiety Test, HumanKinetics Publishers, 1977.
Administration Less than ten minutes should be required for completion ofthe scale.
References Griffin, M.R. An analysis of state and trait anxietyexperienced in sports competition by women at differentages. Unpublished Doctoral Dissertation, LouisianaState University, 1971.
Katahn, M. Interaction of anxiety and ability in complexlearning situations. Journal of Personality and SocialPsychology, 1966, 3, 475-479.
Martens, R., and Landers, D.M. Motor performance understress: A test of the inverted U hypothesis. Journal of
Personality and Social Psychology, 1970, 16, 29-37.
Oxendine, J.B. Emotional arousal and motor performance.Quest, 1970, 13, 23-32.
Simon, J. and Martens, R. SCAT as a predictor of A-statesin varying competitive situations. In R.W. Christina andD.M. Landers (eds.) Psychology of Motor Behavior and Sport,1976 (Vol. 2), Champaign, IL: Human Kinetics Publishers, 1977.
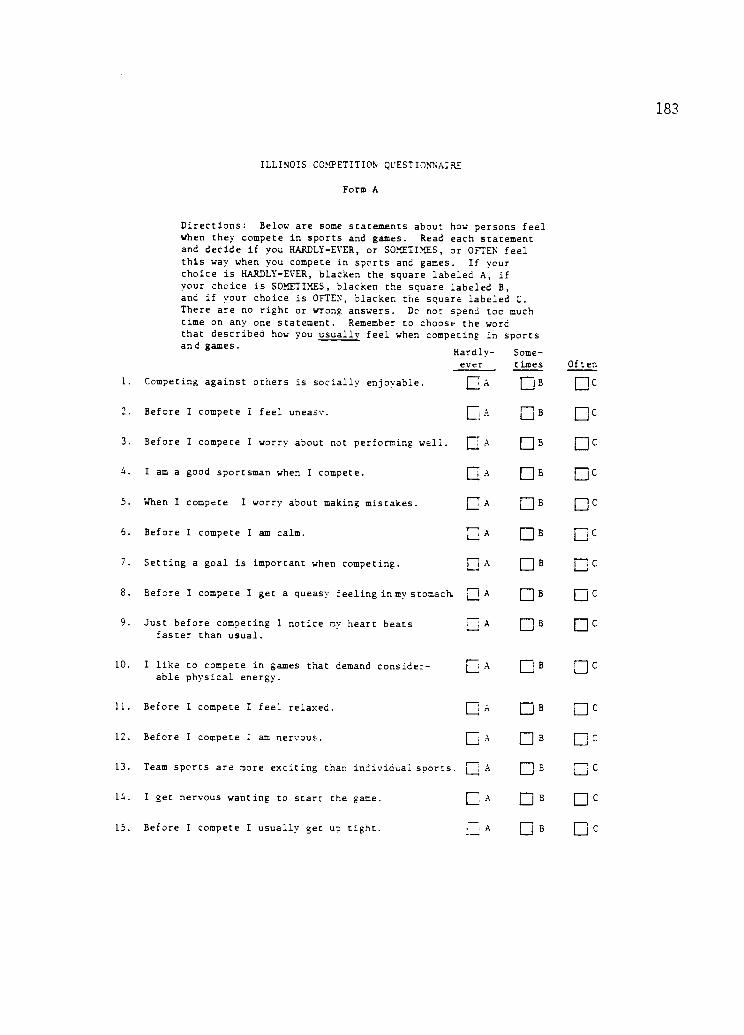
183
ILLINOIS COMPETITION QUESTIONNAIRE
Form A
Directions: Below are some statements about how persons feelwhen they compete in sports and games. Read each statementand decide if you HARDLY-EVER, or SOMETIMES, or OFTEN feelthis way when you compete in sports and games. If yourchoice is HARDLY-EVER, blacken the square labeled A, ifyour choice is SOMETIMES, blacken the square labeled B,and if your choice is OFTEN, blacken the square labeled C.There are no right or wrong answers. Dc not spend too muchtime on any one statement. Remember to choose the wordthat described how you usually feel when competing in sports
1.
and games.Hardly-ever
Some-times Often
Competing against others is socially enjoyable. LA EB
2. Before I compete I feel uneasy. EA OD EC
3. Before I compete I worry about not performing well. EA DB EC
4. I am a good sportsman when I compete. rj A DB DC
5. When I compete I worry about making mistakes. LA EB EC
5. Before I compete I am calm. E A OB
7. Setting a goal is important when competing. E] A DB DC8. Before I compete I get a queasy feeling in my stomach E.] A LB LC
9. Just before competing I notice my heart beatsfaster than usual.
A L B
10. I like to compete in games that demand consider-able physical energy.
L A L 8
11. Before I compete I feel relaxed. E A L B EC
12. Before I compete I am nervous. E A L B EC
13. Team sports are more exciting than individual sports. EA L B
14. I get nervous wanting to start the game. E A E] B D C
15. Before I compete I usually get up tight. A DB DC

ROTTER'S INTERNAL-EXTERNAL LOCUS OF CONTROL SCALE
(Rotter 1966)
Variable
Description
184APPENDIX E
Rotter (1966) defines internal- external locusof control in the following way:
"...an event regarded by some persons asa reward or reinforcement may be differentlyperceived and reacted to by others. Oneof the determinants of this reaction is thedegree to which the individual perceivesthat the reward follows from, or is contin-gent upon, his own behavior or attributesversus the degree to which he feels thereward is controlled by forces outside ofhimself and may occur independently of hisown actions. ...a perception of causalrelationship need not be all or none but canvary in degree. When a reinforcement isperceived by the subject as following someaction of his own but not being entirelycontingent upon his action, then, in ourculture, it is typically perceived as theresult of luck, chance, fate, as under thecontrol of powerful others, or as unpre=dictable because of the great complexityof the forces surrounding him. When theevent is interpreted in this way by anindividual, we have labeled this a beliefin external control. If the person per-ceives that the event is contingent uponhis own behavior or his own relativelypermanent characteristics, we have termedthis a belief in internal control."
In view of recent concerns about the multi-dimensional nature of the IE construct, thereader may wish to note that Rotter's definitionof the construct deals only with a person'sperception of contingency relationships betweenhis own behavior and events which follow thatbehavior.
The history of the development of the test isdetailed in Rotter's (1966) monograph. In itspresent form, it consists of 23 question pairs,using a forced-choice format, plus six fillerquestions.
Internal statements are paired with externalstatements. One point is given for each externalstatement selected. Scores can range from zerc(most internal) to 23 (most external).
Normative data are reported by Rotter (1966).Using the means reported for a variety ofsamples, and those from samples not reportedby Rotter (for a total N of 4,433), Owens

Sample
Reliability/Homogeneity
Validity
computed the overall means for all groupscombined: males, mean = 8.2 (SD = 4.0);females, mean = 8.5 (SD = 3.9); combined,mean = 8.3 (SD = 3.9).
Rotter (1966) reported that two factor analyseshad been completed; one by himself and the otherby Franklin (1963). The results were much thesame. Each revealed one general factor whichaccounted for much of the total scale variance(53 percent in Franklin's analysis) and severladditional factors which involved only a fewitems and which accounted for very littlevariance. More recent factor analyses (Gurin,et al., 1969; MacDonald and Tseng, 1971;Minton, 1972; Mirels, 1970) have shown theRotter scale to be more multidimensional thanthe analyses of Rotter and Franklin. (Still,there is generally one factor that accountsfor most of the variance, and often this factorhas to do with one's belief in his own control- -with items worded in the first person; a secondfactor that often emerges has to do with one'sbelief that people have control generally- -items worded in the third person.)
The Rotter IE scale has been administered tonumerous samples. For details, see Joe (1971),Lefcourt (1966, 1972), and Rotter (1966).
An internal consistency coefficient (Kuder-Richardson) of .70 was obtained from a sampleof 400 college students (Rotter, 1966).
For two subgroups of Rotter's (1966) sampletest-retest reliability coefficients werecomputed, with a value of .72 for 60 collegestudents, after one month (for males, r = .60;for females, r = .83). After two months, anr of .55 was obtained for 117 college students(for males, r = .49; for females, r = .61).Rotter suggests that part of the decreaseafter the two month period is due to differencesin administration (group vs. individual).
Convergent: Over -50 percent of the internal-external locus of control investigations haveemployed the Rotter scale. It is not possibleto list all of the findings here. Detailedliterature reviews are available (Joe, 1971;Lefcourt, 1966, 1972; Minton, 1967; Rotter,1966). The literature does indicate that thereare individual differences in perception aboutone's control over one's destiny and that theRotter scale is sensitive to these differences.
185

Location
Administration
Comments
Discriminant: Rotter reports that correlationswith the Marlowe-Crowne Social DesirabilityScale range from -.07 to -.35. More recentstudies have uncovered higher coefficients(Altrocchi et al., 1968; Feather, 1967;Hjelle, 1971; MacDonald, 1972)--ranging from-.20 to -.42. Additionally, correlations withEdward's Social Desirability Scales have'beenfound to range between -.23 and -.70 (Berzinset al., 1970; Cone, 1971).
Correlations with measures of intelligence haveranged from .03 to -.22 (Rotter, 1966).
Rotter, J. B. Generalized expectancies forinternal versus external control of reinforce-ment. Psychological Monographs, 1966, 80(1 Whole No. 609).
The scale is self-administered and can be com-pleted in about 15 minutes. The scale has beenmost frequently used with collece students,but has been used with adolescent and oldersubjects. No upper or lower age limits havebeen established.
The scale has been used in a number of interestingand important studies. The recent group ofstudies that find sianificant correlations withmeasures of social desirability response bias,along with those which have found the scaletapping more than one factor, have called thevalidity of the scale into question. However,when one considers that (a) the correlationswith measures of social desirability responsebias are typically low, and (b) results of factoranalyses are varied and difficult to compare(e.g., the analysis performed by Gurin et al.(1969) included a number of items not found inRotter's scale; it is difficult to assess theeffect of those items on the analysis), onemust conclude that methodological questionshave been more effectively raised than answered.
As mentioned above, factor analyses have un-covered one factor (names "personal control")on which the items with the highest loadingsare phrased in the first person. This groupof items would appear to be reflecting andmeasuring the construct as it has been definedby Rotter (see the definition under "Variable"above).
186

References
Although this factor tends to account formost of the scale variance, a second factor-"control ideology" (which could as easily becalled "control attritution"), in which theitems are phrased in the third person--appearswith some frequency. This factor seems tobe indeed different from IE as defined byRotter and does seem to be important in itsown right.
It is clear that there are methodologicalproblems to be resolved in the IL area andthat Rotter's scale is not as "pure" as itwas believed to be. However, until such timeas the issues are resolved, Rotter's scale isstill to be recommended as a measure of generalizedIE expectancy.
Altrocchi, J., Palmer, J., Hellmann, R., andDavis, H. The Marlowe-Crowne, repressor-sensitizer,and internal-external scales and attribution ofunconscious hostile intent. Psycholocical Reports,1968, 23, 1229-1230.
Cone, J. D. Locus of control and socialdesirability. Journal of Consulting and ClinicalPsychology, 1971, 36, 449.
Feather, N. T. Some personality correlates ofexternal control. Australia Journal ofPsychology, 1967, 19, 253-260.
Hjelle, L. A. Social desirability as a variablein the locus of control scale. PsycholocicalReports, 1971, 28, 807-816.
Joe, V. C. Review of the intern-externalcontrol construct as a personality variable.Psychological Reports, 1971, MonographSupplement 3-V28, 619-640.
Lefcourt, H. M. Internal versus externalcontrol of reinforcement: A review. PsycholocicalBulletin, 1966, 65, 206-220.
Minton, H. L. Power as a personality construct.In Progress in experimental personality researchedited by B. Maher. Vol. 4, New York: AcademicPress, 1967.
Minton, H. L. Internal-external control andthe distinction between personal control andsystem modifiability. Paper presented atMidwestern Psychological Association, Cleveland,1972.
187

188Mirels, H. L. Dimensions of internal versusexternal control. Journal of Consulting andClinical Psychologv, 1970, 34, 226-228.
Rotter, J. B. Generalized expectancies forinternal versus external control cf reinforce-ment. Psychological Monographs, 1966, 80(1 Whole Nc. 609).

189
INTERNAL VS. EXTERNAL CONTROL
1.a. Childrdn get into trouble because their parents punish them too much.b. The trouble with most children nowadays is that their parents are toe Filler
easy with them.
2.a. Many of the unhappy things in people's lives are partly due to bad luck.b. People's misfortunes result from the mistakes they make.
3.a. One of the major reasons why we have wars is because people don't takeenough interest in politics.
b. There will always be wars, nc matter how hard people try to preventthem.
4.a. In the long run people get the respect they deserve in this world.b. Unfortunately, an individual's worth often passes unrecognized no
matter how hard he tries.
5.a. The idea that teachers are unfair to students is nonsense.b. Most students don't realize the extent to which their graces are
influenced by accidental happenings.
6.a. Without the right breaks one cannot be an effective leader.b. Capable people who fail to become leaders have not taken advantage of
their opportunities.
7.a. No matter how hard you try some people just don't like you.b. People who can't get others to like them don't understand how to get
along with others.
8.a. Heredity plays the major role in determining one's personality.b. It is one's experiences in life which determine what one is like. Filler
9.a. I have often found that what is going to happen will happen.b. Trusting to fate has never turned out as well for me as making a
decision to take a definite course of action.
10.a. In the case of the well prepared student there is rarely if ever sucha thing as an unfair test.
b. Many times exam questions tend to be so unrelated to course work thatstudying is really useless.
11.a. Becoming a success is a matter of hard work, luck has little or nothingto do with it.
b. Getting a good job depends mainly on being in the right place at theright time.
12.a. The average citizen can have an influence in government decisions.b. This world is run by the few people in power, and there is not much
the little guy can do about it.
13.a. When I make plans, I am almost certain that I can make them work.b. It is not always wise to plan too far ahead because man-: things turn
out to be a matter of good or bad fortune anyhow.

190
14.a. There are certain people who are just no good.b. There is some good in everybody. Filler
15.a. In my case getting what I want has little or nothing to do with luck.b. Many times we might just as well decide what to do by flipping a coin.
16.a. Who gets to be the boss often depends on who was lucky enough to bein the right place first.
b. Getting people to do the right thing depends upon ability, luck haslittle or nothing to do with it.
17.a. As far as world affairs are concerned, most of us are the victims offorces we can neither understand, nor control.
b. By taking an active part in political and social affairs the peoplecan control world events.
18.a. Most people don't realize the extent to which their lives are controlledby accidental happenings.
b. There really is no such thing as "luck."
19.a. One should always be willing to admit mistakes.b. It is usually best to cover up one's mistakes. Filler
20.a. It is hard to know whether or not a person really likes you.b. How many friends you have depends on how nice a person you are.
21.a. In the long run the bad things that happen to us are balanced by thegood ones.
b. Most misfortunes are the result of lack of ability, ignorance, laziness,or all three.
22.a. With enough effort we can wipe out political corruption.b. It is difficult for people to have much control over the things poli-
ticians do in office.
23.a. Sometimes I can't understand how teachers arrive at the grades they give.b. There is a direct connection between how hard I study and the grades I
get.
24.a. A good leader expects people to decide for themselves what they shoulddo.
b. A good leader makes it clear to everybody what their jobs are.
25.a. Many times I feel that I have little influence over the things thathappen to me.
b. It is impossible for me to believe that chance or luck plays animportant role in my life.
26.a. People are lonely because they don't try to be friendly.b. There's not much use in trying too hard to please people, if they like
you, they like you.
Filler
27.a. There is too much emphasis on athletics in high school.b. Team sports are an excellent way to build character. Filler

191
28.a. What happens to me is my own doing.b. Sometimes I feel that I don't have enough control over the direction
my life is taking.
29.a. Most of the time I can't understand why politicians behave the waythey do.
b. In the long run the people are responsible for bad government on anational as well as on a local level.
Note: Score is the total number of underlined choices (i.e., external itemsendorsed).