Embed Size (px)
Citation preview

AMS-ASA-MAA-SIAM
DATA COMMITTEE MEETING
Meeting to be held Saturday, January 7, 2012 Beacon D, Sheraton Hotel (third floor)
Agenda 1:00 pm – 5:00 pm
AGENDA
A. Introductions & Minutes 1:00-1:10 pm
The current list of committee members is provided in Attachment A.1. Corrections can be reported to the AMS staff. The minutes of the meeting held on January 9, 2011, in New Orleans, are provided in Attachment A.2. The committee is asked to approve the minutes.
B. Committee Review of 2010 Reports and 2011 Survey Forms 1:10-1:30 pm
Committee members were invited, via a November 30th email, to review the Notices reports from the 2010 Annual Survey and the survey forms used for the 2011 Annual Survey. They were asked to report any feedback – from “small edits to larger issues of content” – ahead of the meeting. As background to this item, Attachment B.1 provides a brief summary of the individual components that make up the Annual Survey.
Committee members may raise issues derived from their review of the reports and forms that they judge warrant consideration by the full committee. Comments on report format and minor edits of the survey forms may be given directly to Maxwell or Rose.
C. Old Business
C1. Defining New Annual Survey Groups 1:30-2:30 pm
At its meeting in New Orleans, the Data Committee adopted a scheme for using the department rankings recently released by the National Research Council (NRC) to produce new groupings of the doctoral mathematics departments analogous to those currently used for reporting on the data collected by the Annual Survey. While the scheme was approved in principle, only Group 1, the traditional top-rated departments, was confirmed during the meeting. (See Attachment C1.1 for a detailed review of the scheme and the outcome of the meeting.) The plan was to obtain full committee approval of revised Group 2 and Group 3 doctoral departments following the meeting based on recommendations to be produced by the subcommittee that developed the scheme for Group 1 presented at the meeting. For a variety of reasons, the follow up review of the other potential groups was never undertaken. (See page 2, Attachment C1.1, for further details.) As a result, this issue remains unresolved.
1 of 5

After considerable discussion over the summer, Maxwell and Cleary explored an alternative scheme for defining new groupings of the doctoral mathematics departments using only the data provided through the Annual Survey by the doctoral departments themselves. Attachment C1.2 describes this new scheme and lists the new department groupings that result, along with various comparisons of the new groups with the current groups that suggest the new groups would work well as a way to aggregate the Annual Survey data for reporting purposes.
A committee decision on which new scheme to use for constructing groups at this meeting would enable the incorporation of the groups with Annual Survey reporting on the 2012 survey cycle.
C2. Longitudinal Study of “New Docs” 2:30-2:45 pm
Sue Geller will report on the status of the MAA proposal to conduct a longitudinal study of new doctorates which was submitted in September to the Division of Mathematical Science at NSF. She serves as lead PI on the proposal.
Break 2:45-3:00 pm
C3. Report on the 2010 CBMS Survey 3:00-3:20 pm
Kirkman will update the committee on the Conference Board of the Mathematical Sciences’ (CBMS) 2010 survey, launched during October and early November of 2010.
C4. Exploring the Two-Body Problem 3:20-3:40 pm
During the committee’s meeting in San Francisco in January 2010 interest was expressed in knowing more about the impact of the two-body problem among new doctorates in mathematics. Following the meeting, a subcommittee was formed to consider drafting up to two questions that could be added to the Employment Experiences of New Doctoral Recipients (EENDR) form to gather information on how widespread this issue was. The subcommittee members are Rick Cleary, Abbe Herzig and Pam Arroway. The plan to develop the questions for implementation with the 2011 version of the EENDR did not come to pass.
Is there still interest in seeing this expansion of the EENDR implemented for the 2012 survey cycle? If so, the subcommittee will be supported by Maxwell and Rose in order to settle on the new questions during the spring of 2012 for implementation with the 2012 survey cycle.
C5. Request for Additional Data Collection 3:40-3:55 pm
As reported at the committee’s meeting in New Orleans, the AMS Committee on the Profession (CoProf) asked the Data Committee to consider gathering a finer breakout of the faculty category “Other Full-time Faculty” which appears on the current Departmental Profile form. CoProf felt that it would be useful to know more
2 of 5

about what sort of faculty appointments are being reported within this designation. (The category of postdoctoral appointments was separated from this category and given its own column on the Departmental Profile survey starting with the 2003 Annual Survey.) CoProf members suggested that there are a growing number of instances in which departments are creating non-tenure-track, full-time positions that can be renewed indefinitely.
As a first step in considering this request, Maxwell proposed doing a short survey of a small number of departments, between 20 to 30, to provide a better sense of how widespread this phenomenon is. In addition, the survey would identify the category names one might use to refine the picture of the faculty currently being reported within the “Other Full-time Faculty”. This step has not yet been carried out.
Is there still significant interest in exploring this issue? If so, an appropriately worded question can simply be added to the upcoming Departmental Profile form to produce initial estimates of the number of position of the specific type mentioned by CoProf.
D. New Business
D1. Adjustments to Data Collection Frequency 3:55-4:20 pm
Maxwell requests reaction from the committee on his plan, presented in Attachment D1.1, to reduce the frequency of collection of certain portions of the data now collected annually on the Departmental Profile survey. This proposal is based on Maxwell’s observation that there are certain categories of departmental data that change little from year-to-year, faculty counts being one example and demographic profiles of graduate students being another. Hence, reducing the frequency of collection of these more stable data would have no impact on the availability of timely information on departments. Furthermore, less frequent collection would reduce the effort required of departments to complete the survey, and it would reduce somewhat the work of AMS survey staff.
This proposal is offered for discussion and possible endorsement by the committee.
D2. Reporting on Subgroupings of the Bachelors Mathematics Departments
4:20-4:45 pm
Over the past few years members of the committee have supported subdividing the roughly 1,000 Bachelors departments that comprise Group B into smaller subgroups and reporting on these subgroups in addition to the traditional reporting on Group B. Attachment D2.1 presents Maxwell’s approach to subdividing Group B using the 2010 Carnegie Commission classification of postsecondary institutions.
Maxwell suggests the formation of a small subcommittee to review preliminary analysis of a test dataset of prior-year Departmental Profile data using the new subgroupings with the goal of expanding the reporting on Group B using the new
3 of 5

subgroups with the 2012 survey cycle. The work of the subcommittee would take place over the period between March and July of 2012.
This proposal is offered for discussion and possible committee endorsement.
E. Information Only Items 4:45-5:00 pm
These items will be discussed only if someone has a comment or question.
E1. Moving the Annual Survey Online
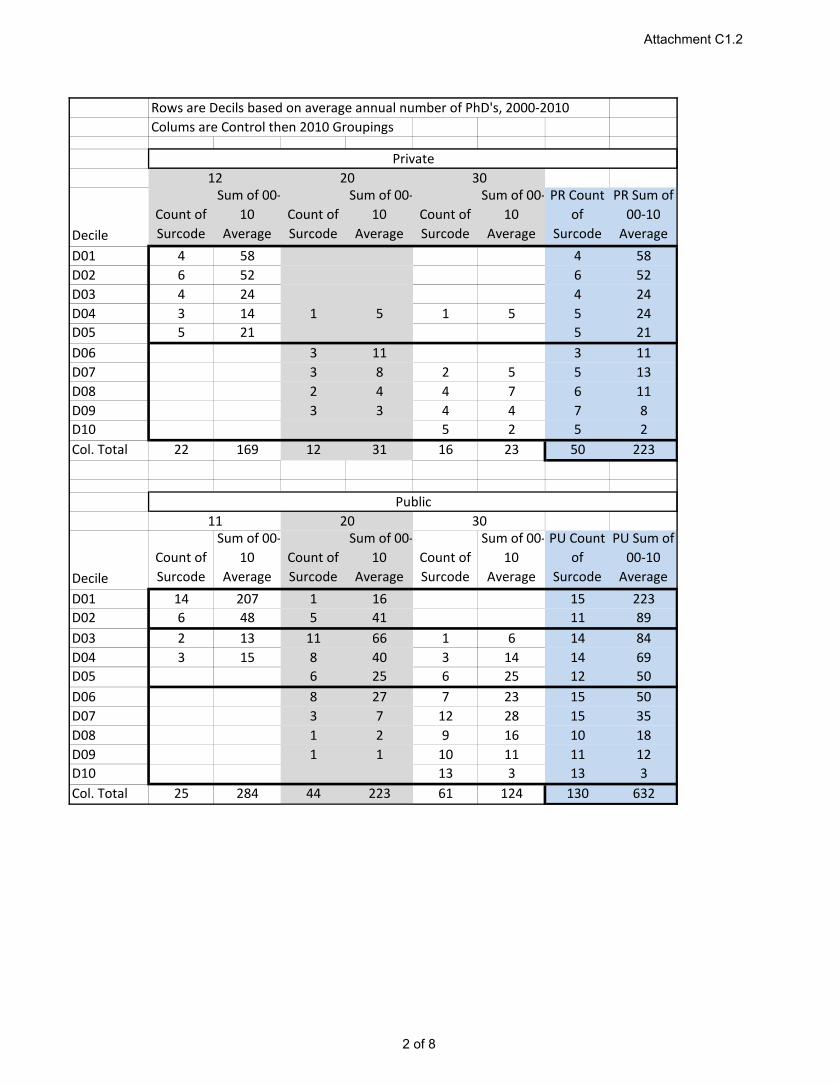
After considerable study and evaluation during 2010 and 2011, a new online survey tool, Snap Survey, was purchased by AMS, and it is now being used to distribute the Recruitment and Hiring survey and the Employment Experiences of New Doctoral Recipients survey (EENDR). Starting in January, it will be used to distribute the Departmental Profile survey. The early results for the Recruitment and Hiring survey are very positive from the point of view of survey staff and from the point of view of department staff asked to complete the survey. Attachment E1.1 presents several screens from the Recruitment and Hiring survey.
E2. Initial Report of 2011 Annual Survey
The Preliminary Report on the 2010-2011 New Doctoral Recipients, previously referred to as “The First Report, Part 1”, is scheduled to appear in the March 2012 issue of Notices of the AMS. A final draft will be posted to the AMS website for you review via the link http://www.ams.org/profession/data/annual-survey/AS-Committee . Via this link you’ll also find posted by mid-January a final draft of the departmental salary survey. The report is scheduled to appear in the April 2012 Notices.
E3. Gender, Race/Ethnicity and Citizenship of 2009-2010 New Doctoral Recipients
These data are summarized by individual group in Attachment E3.1. This same file is also available from the AMS website at http://www.ams.org/profession/data/annual-survey/docsgrtd . E4. Review of Survey Response Rates
Rose prepared a report on the final response rates for each survey for the years 2006 through 2010. The report appears in Attachment E4.1. The 2011 cycle of surveys is taking place later than usual this year, so there are no meaningful response rates to report at this time.
E5. 2010 Department Profile Summary
These data are summarized by individual group in Attachment E5.1.
4 of 5

E6. 2011 Data Committee Annual Report
The report on the work of the Data Committee during 2011 is provided in Attachment E6.1 for committee review. This report is submitted each year in February to the secretaries of the sponsoring organizations.
E7. Departing and Incoming members of Data Committee
Departing: Abbe Herzig, Consumers Union (AMS) Incoming: William Vélez, University of Arizona (AMS)
5 of 5

2011–2012 AMS-ASA-IMS-MAA-SIAM Data CommitteeTerm: 3 years ending 31 January of designated year
Email: [email protected]
Attachment A.1
6512 Bakersfield Drive
Prof. Pam ArrowayStatistics Department
ASA2013
North Carolina State University
Raleigh NC [email protected]
Bentley College
Prof. Richard ClearyDept. of Mathematical Sciences
MAA2015
319 Morison Hall
Waltham, MA 02452-4705781-891-2702 (office)[email protected]
University of Nebraska-Lincoln
Prof. Steven DunbarDepartment of Mathematics
AMS2013
308 Avery Hall
Lincoln NE [email protected]
Texas A&M University
Prof. Susan GellerDepartment of Mathematics
MAA2015
MS 3368
College Station TX [email protected]
503 Boston Avenue
Prof. Boris HasselblattTufts University
AMS2013
Department of Mathematics
Medford, MA [email protected]
101 Truman Avenue
Dr. Abbe H. HerzigConsumers Union of U.S.
AMS2012
Health Ratings Center
Yonkers NY 10703-1057518-727-4755 (office)[email protected]
Wake Forest University
Prof. Ellen KirkmanDepartment of Mathematics
MAA2014
Manchester Hall, Box 7388
Winston-Salem, NC 27109-7388336-758-5851 (department)336-758-7190 (fax department)[email protected]
The Ohio State University
Prof. Peter March Department of Mathematics
AMS2014
100 Math Tower
Columbus, OH [email protected]
University of California
Prof. David R. MorrisonDepartment of Mathematics
AMS2014
South Hall, Room 6708
Santa Barbara, CA [email protected]
Indiana University - Purdue University
Prof. Bart NgDept of Mathematical Sciences
SIAM2013
402 North Blackford Street LD 270
Indianapolis IN [email protected]
Providence, RI 02904
Dr. James W. MaxwellAmerican Mathematical Society
AMSex officio
201 Charles St.
401-455-4035 (office)800-321-4267 (toll free AMS)401-331-3842 (fax AMS)[email protected]
Providence, RI 02904
Ms. Colleen RoseAmerican Mathematical Society
AMSStaff
201 Charles St.
401-455-4124 (office)800-321-4267 (toll free AMS)[email protected]
Providence, RI 02904
Ms. Maureen McVeighAmerican Mathematical Society
AMSStaff
201 Charles St.
401-455-4189 (office)800-321-4267 (toll free AMS)

AMS-ASA-IMS-MAA-SIAM DATA COMMITTEE MEETING
Sunday, January 9, 2011
Bacchus Room, New Orleans Marriott 11:45 am – 4:30 pm
Minutes
Members Present: Pam Arroway, Rick Cleary (Chair), Steve Dunbar, Sue Geller, Ellen Kirkman, Jim Maxwell, Joanna Mitro, Bart Ng, Doug Ravenel, Marie Vitulli, AMS Staff Present: Colleen Rose, Sam Sholes Guests Present: David Morrison (incoming committee member)
A. Introductions & Minutes
The minutes of the meeting held on Saturday, January 16, 2010 in San Francisco, CA were approved, with a correction to Joanna Mitro’s name.
Pam Arroway suggested the draft minutes be distributed sooner after the meeting and the committee asked to approve the minutes at the time of distribution.
B. Committee Review of 2009 Reports and 2010 Survey Forms
Committee members were invited, via a 30 November 2010 email, to review the Notices reports from the 2009 Annual Survey and the survey forms used for the 2010 Annual Survey ahead of the meeting and to report any feedback ahead of the meeting. As background to this item, Attachment C provided a brief summary of the individual components that make up the Annual Survey.
After brief discussion, no issues were raised that led to committee actions.
C. Old Business
C1. NRC Assessment of U.S. Doctoral Programs
The final report of the National Research Council’s assessment of doctoral programs in the U.S. was released in late September of 2010. The subcommittee appointed by Committee Chair Phipps — Abbe Herzig, Joanna Mitro, Bart Ng and Marie Vitulli — together with Committee Chair Cleary, used the reported data to illustrate a scheme to produce a Top X mathematics programs that would become the new Group 1, where X would be approximately the same size as the current Group 1. Attachment D described the scheme and showed the resulting Top X departments under several
Attachment A.2
1 of 4

ranking methods and how each list differed from the 48 departments that currently constitute Group 1.
After considerable review of the materials in Attachment D and discussion of various options for finalizing the list of departments that would form the new Group 1, the following motion was approved:
“The new Group 1 shall be the 48 departments that form the intersection of the three sets of Top X departments produced by the three ranking methods presented in Attachment D.”
The motion passed.
It was also agreed that the same scheme used to produce the new Group 1 would be used by the subcommittee to develop a new Group 2 of roughly the same size as the current Group 2. The subcommittee’s proposal for Group 2 should be circulated to the full committee via email following the meeting and a final vote for approval taken during February. Group 3 would then consist of all the doctoral mathematics departments not in the new Groups 1 and 2.
C2. Access to Annual Survey Data
In San Francisco, the committee reviewed the subcommittee’s draft of the policy concerning governing access to Annual Survey data by individuals and organizations outside the AMS staff charged with conducting the survey. The resulting document was presented as Attachment E.
After a brief discussion, the committee approved the policy as presented.
C2. Longitudinal Study of “New Docs”
At the committee’s meeting in San Francisco, Sue Geller reported on preliminary plans within MAA to submit a proposal to NSF to support conduct of a study of the career experiences of new doctoral recipients well pass their initial post-graduation employment. Geller, now designated as the PI on the grant, updated the committee on the current status of this effort. C4. Exploring the Two-Body Problem During the committee’s discussion in San Francisco of the agenda item on the career experiences of new doctoral recipients beyond their first job, interest was expressed in knowing more about the impact of the two-body problem among new doctoral recipients (newdocs) in mathematics. A subcommittee was formed to consider drafting two questions that could be added to the Employment Experiences of New Doctoral Recipients (EENDR) form and to present them at this meeting to gather feedback and hopefully finalize the questions. The report from the subcommittee was postponed with the expectation that it would circulate draft questions to the committee via email during February and
Attachment A.2
2 of 4

March with the goal of finalizing questions in time for the 2011 EENDR survey.
D. New Business
D1. Request for Additional Data Collection
The AMS Committee on the Profession (CoProf) asked the Data Committee to consider gathering a finer breakout of the faculty category “Other Full-time Faculty” that appears on the Departmental Profile form. CoProf felt that it would be useful to know more about what sort of faculty appointments are being reported within this designation. The category of postdoctoral appointments was separated from “Other Full-time Faculty” and given its own column on the Departmental Profile survey starting with the 2003 Annual Survey. Members of CoProf felt that there are a growing number of instances where departments are creating non-tenure-track, full-time positions that can be renewed indefinitely. As a first step in considering this request, Maxwell proposed doing a short survey of a small number of departments to get a better sense of how widespread this phenomenon is, and in addition, to identify the category names one might use to refine the picture of the faculty currently being reported within the “Other Full-time Faculty”. The committee endorsed this plan. D2. New Report on Recruitment and Hiring Maxwell presented a preliminary report on recruitment and hiring by mathematics departments during the 2009-2010 recruitment cycle. This data was scheduled to be collected as part of the Departmental Profile (DP) Survey to be launched in January 2011. Recognizing the keen interest in the academic job market, Maxwell recast this one section of the DP form as a separate, stand-alone, online survey and launched it in September of 2010. Attachment F provided a printed version of the survey used. The final report appeared in the May 2011 issue of Notices.
E. Information Only Items
E1. Review of Initial Employment by Gender
Marie Vitulli and Mary Flahive prepared a report on the Annual Survey’s initial employment data for men and women separately for the past ten years. A preliminary version of this report appeared in the committee’s San Francisco agenda. Their final report appeared in the September 2010 issue of Notices of the AMS, pages 984-986. E2. Initial Report of 2010 Annual Survey
Attachment A.2
3 of 4

The Preliminary Report on the 2009-1010 New Doctoral Recipients, previously referred to as “The First Report, Part 1”, will appear in the February 2011 Notices of the AMS. A copy is provided in Attachment G. The report of the departmental salary survey will appear in the March 2010 Notices. A final draft is provided in Attachment H.
E3. Gender, Race/Ethnicity and Citizenship of New Doctoral Recipients summarized by survey groups
These data are summarized by individual group in Attachment I. E4. Review of Survey Response Rates
Rose prepared final response rates for each survey for the years 2006 through 2009, and the current response rates from 2010. These appear in Attachment J. Considerable additional follow-up remains for the Employment Experiences of New Doctoral Recipients and the Departmental Profile survey was just initiated in early January. E5. 2008 Department Profile Summary
These data are summarized by individual group in Attachment K.
E6. 2010 Data Committee Annual Report
The draft of the report on the work of the Data Committee during 2010 is provided in Attachment L for committee review. This report is submitted each year in February to the secretaries of the sponsoring organizations.
E7. Departing and Incoming members of Data Committee
Departing: Joanna Mitro, University of Cincinnati (AMS) Douglas Ravenel, University of Rochester (AMS) Marie Vitulli, University of Oregon (AMS)
Incoming: Boris Hasselblatt, Tufts University (AMS)
Peter March, Ohio State University (AMS) David Morrison, UC Santa Barbara (AMS)
Attachment A.2
4 of 4

Sum
mar
y of
Ann
ual S
urve
y Fo
rms
Nam
e of
For
m
Lau
nch
Tim
e Se
nt to
Su
rvey
Met
hod
How
and
whe
n re
port
ed
Doc
tora
tes G
rant
ed (D
G)
and
Gen
der,
Rac
e/Et
hnic
ity &
C
itize
nshi
p (G
REC
)
Firs
t wee
k of
A
pril
All
mat
h, a
pplie
d m
ath,
stat
&
bios
tat d
epts
. in
the
US
offe
ring
a do
ctor
ate.
Cen
sus w
ith m
ail,
emai
l, &
ph
one
follo
w-u
ps
Two
repo
rts in
Not
ices
ap
pear
ing
in F
eb. a
nd A
ugus
t.
Ass
ista
ntsh
ips.
& G
rad.
Fe
llow
ship
s (A
&G
F)
Third
wee
k in
M
ay
US
& C
anad
ian
mat
h. sc
ienc
es
dept
s. w
ith a
gra
duat
e pr
ogra
m in
m
ath.
Cen
sus w
ith m
ail &
em
ail
follo
w-u
ps
Boo
k fo
rm m
aile
d to
all
mat
h.
scie
nces
dep
artm
ents
at 4
-yea
r in
stitu
tions
in U
S. in
Oct
. R
epor
ts a
re p
oste
d on
the
web
in
late
Oct
ober
Fa
culty
Sal
arie
s (FS
) Fi
rst w
eek
in
June
A
ll m
ath
scie
nces
dep
ts. a
t 4-y
ear
inst
itutio
ns in
US
C
ensu
s with
mai
l &em
ail
follo
w-u
ps
Rep
orte
d in
Mar
ch is
sue
of
Not
ices
as P
art 2
of F
irst
Rep
ort
Empl
oym
ent E
xper
ienc
e of
New
Doc
. Rec
ipie
nts
(EEN
DR
)
Mid
-Oct
ober
(d
elay
ed to
mid
-Ja
n 20
12)
All
new
docs
iden
tifie
d vi
a D
G
with
follo
w-u
p co
ntac
t inf
o av
aila
ble
Cen
sus u
sing
onl
ine
surv
ey
laun
ched
via
em
ail,
with
m
ultip
le e
mai
l fol
low
-ups
Rep
orte
d in
2nd
Rep
ort,
typi
cally
in A
ugus
t Not
ices
Rec
ruitm
ent &
Hiri
ng
(R&
H),
with
dea
ths &
re
tirem
ents
Mid
-Sep
tem
ber
(del
ayed
to e
arly
D
ec. 2
011)
All
mat
h sc
ienc
es d
epts
. at 4
-yea
r in
stitu
tions
in U
S
Cen
sus u
sing
onl
ine
surv
ey
laun
ched
via
em
ail,
with
m
ultip
le e
mai
l fol
low
-ups
Rep
orte
d in
sprin
g is
sue
of
Not
ices
, and
pos
ted
to A
MS
web
site
with
em
ail
notif
icat
ions
to d
epts
. D
epar
tmen
tal P
rofil
e (D
P)
Early
Janu
ary
All
mat
h sc
ienc
es d
epts
. at 4
-yea
r in
stitu
tions
in U
S
Cen
sus u
sing
onl
ine
surv
ey
laun
ched
via
em
ail,
with
m
ultip
le e
mai
l fol
low
-ups
, ph
one
calls
whe
n ne
eded
.
In N
ovem
ber i
ssue
of N
otic
es
as 3
rd R
epor
t
Attachment B.1

Reviewing the scheme for defining new groups for Annual Survey Reporting as discussed at the New Orleans meeting of the Data Committee At the time of the Data Committee meeting in New Orleans in January of 2011, we were working with 127 departments that appear in the list of mathematical sciences PhD programs evaluated by the NRC during its recent study. The data released in this study was revised in late April of 2011. As a result of this update, Rensselaer Polytechnic Institute was moved into the NRC’s list of applied mathematics programs and the University of Louisiana at Lafayette was moved from the applied mathematics programs into the mathematical sciences programs. Pages 4-6 lists the 127 mathematics departments that were discussed in January, plus Lafayette, and it includes their new group designations under the scheme discussed at the January meeting and again after the release of the revised NRC data in April. Each of these PhD programs is housed within the department of mathematics (or mathematical sciences) at the named institution. You can review the revised NRC data for mathematics, applied mathematics, and statistics at http://www.ams.org/profession/data/annual-survey/AS-Committee . The NRC-based scheme for defining new groupings (with revised NRC data) The following scheme produces a list of 47 departments that appear in each of three intermediate sets of departments defined below. I’ll refer to these 47 departments as the core list, and they are the candidates for the new top-rated grouping of departments, the new Group 1 using the current nomenclature of the Annual Survey. The three sets are defined as follows. (Page 3 shows the departments that constitute each of the three sets and the intersection.)
Set 1 – Sort the list of programs in ascending order of the R-5 ranking and flag the first 55 departments, plus any ties for the 55th position. Next sort the list in ascending order of the S-5 ranking, flagging the first 55 programs, plus ties. Set 1 consists of the intersection of these two flagged lists, and it contains a total of 49 departments. In addition to the 47 departments that appear in the core list, it also includes the University of Rochester and the University of Kansas. The strength of Set 1 is that it includes departments that ranked in the top 55 in both the R-ranking system and the S-ranking system. In this way we are giving equal weight to both of the two ranking systems used by the NRC in arriving at these 49 departments.
Set 2 – Repeat the steps described above for R-95 and S-95, take the intersection, and call this Set 2. The intersection produces 51 departments, the same 47 that appeared in the core list, plus the University of Oregon, University of Pittsburgh, University of Utah, and University of Virginia.
Set 3 – First compute the average (mid-point) of the R-5 and R-95 rankings for each department, and likewise, the average of the S-5 and S-95 rankings. Once again, sort on each such average ranking and flag the top 55 in each sort, including ties for the 55th spot. Set 3 consists of the intersection of these two lists. This produces a list of 49 departments, the core list plus the University of Pittsburg and the University of Rochester.
The first question before the Data Committee in New Orleans was to decide whether to include in the new Group 1 any of the departments that make it into one or two of the three
Attachment C1.1
1 of 6

sets, but not all three, or to keep it to just the core 47 departments?1 The committee approved a motion to have the new Group 1 be precisely the core group of 47 departments. The committee also agreed that the scheme used to produce the new Group 1 would be applied to the remaining departments to arrive at the new Group 2, though instead of looking at three sets of 55 departments, the sets would be based on picking the top sixty departments under each ranking step. The remaining departments would form a new Group 3, to be joined with the mathematics departments whose Ph.D. program was not evaluated in the NRC study. The result of this process was to be reviewed by the subcommittee and then presented to the full committee for approval by email ballot. Pages 4-6 show the departments in the NRC study that would form Group 1 and Group 2 and the departments that would be combined with those not evaluated by the NRC to form Group 3. Delay in Implementation of Scheme Several developments prevented proceeding as planned. The NRC announced in March that revised data was being prepared for release in April. By then, two members of the subcommittee were no longer on the Data Committee, and three new members had joined the committee. The paper A quantitative criticism of the 2010 NRC assessment of graduate programs in Mathematics by Professor Peter Mucha of the Department of Mathematics at the UNC Chapel Hill argues against the use of the NRC study as a basis for defining new groups, and it is available at http://www.ams.org/profession/data/annual-survey/AS-Committee. Included below is a short communication from the AMS Committee on the Profession to the Data Committee chair Cleary that recommends against revising the current groupings based on the new NRC study. After several discussions, Maxwell and Cleary judged that the various mixed reviews of the NRC study warranted delaying a final decision on new groupings until after another discussion at the committee meeting in Boston.
Dear Professor Cleary, I'm writing you in your capacity as chair of the AMS-ASA-MAA-SIAM Joint Data Committee. The material below, taken from the annual report of the AMS Committee on the Profession (CoProf), should be self-explanatory. • NRC Rankings: In 2010, the National Research Council released its Data-Based Assessment of Research-Doctorate Programs. These assessments are significantly different than the earlier rankings done by the NRC. The AMS asked CoProf to make a recommendation to the Joint Data Committee concerning whether these rankings should be used to create new groupings for the Annual Survey of the Mathematical Sciences. CoProf voted to recommend to the Joint Data Committee that the rankings not be used for the Annual Survey. Please let me know if you have any questions. Best wishes, Bob Daverman Robert J. Daverman, AMS Secretary
1 The core list presented at the Data Committee meeting numbered 48 as it included Rensselaer Polytechnic Institute.
Attachment C1.1
2 of 6

Count Institution Name
Set 1Top 55 R&S-5
Set 2Top 55
R&S-95Set 3
R&S_Mid551 Princeton University R&S-5 R&S-95 R&S-mp-552 New York University R&S-5 R&S-95 R&S-mp-553 University of California-Berkeley R&S-5 R&S-95 R&S-mp-554 Stanford University R&S-5 R&S-95 R&S-mp-555 Harvard University R&S-5 R&S-95 R&S-mp-556 University of Michigan-Ann Arbor R&S-5 R&S-95 R&S-mp-557 Penn State University R&S-5 R&S-95 R&S-mp-558 Massachusetts Institute of Technology R&S-5 R&S-95 R&S-mp-559 University of Wisconsin-Madison R&S-5 R&S-95 R&S-mp-5510 Yale University R&S-5 R&S-95 R&S-mp-5511 California Institute of Technology R&S-5 R&S-95 R&S-mp-5512 Columbia University in the City of New York R&S-5 R&S-95 R&S-mp-5513 University of Texas at Austin R&S-5 R&S-95 R&S-mp-5514 Brown University R&S-5 R&S-95 R&S-mp-5515 University of California-San Diego R&S-5 R&S-95 R&S-mp-5516 Cornell University R&S-5 R&S-95 R&S-mp-5517 University of Illinois at Urbana-Champaign R&S-5 R&S-95 R&S-mp-5518 Michigan State University R&S-5 R&S-95 R&S-mp-5519 Purdue University Main Campus R&S-5 R&S-95 R&S-mp-5520 Indiana University at Bloomington R&S-5 R&S-95 R&S-mp-5521 University of California-Los Angeles R&S-5 R&S-95 R&S-mp-5522 State University of New York at Stony Brook R&S-5 R&S-95 R&S-mp-5523 Texas A & M University R&S-5 R&S-95 R&S-mp-5524 Carnegie Mellon University R&S-5 R&S-95 R&S-mp-5525 University of Illinois at Chicago R&S-5 R&S-95 R&S-mp-5526 University of California-Davis R&S-5 R&S-95 R&S-mp-5527 Rutgers The State University of New Jersey Ne R&S-5 R&S-95 R&S-mp-5528 University of Maryland College Park R&S-5 R&S-95 R&S-mp-5529 Duke University R&S-5 R&S-95 R&S-mp-5530 Vanderbilt University R&S-5 R&S-95 R&S-mp-5531 University of Chicago R&S-5 R&S-95 R&S-mp-5532 University of Notre Dame R&S-5 R&S-95 R&S-mp-5533 University of Delaware R&S-5 R&S-95 R&S-mp-5534 University of California-Santa Barbara R&S-5 R&S-95 R&S-mp-5535 University of Pennsylvania R&S-5 R&S-95 R&S-mp-5536 University of Minnesota-Twin Cities R&S-5 R&S-95 R&S-mp-5537 Brandeis University R&S-5 R&S-95 R&S-mp-5538 Boston University R&S-5 R&S-95 R&S-mp-5539 University of Arizona R&S-5 R&S-95 R&S-mp-5540 Arizona State University R&S-5 R&S-95 R&S-mp-5541 University of Washington R&S-5 R&S-95 R&S-mp-5542 Georgia Institute of Technology R&S-5 R&S-95 R&S-mp-5543 University of California-Irvine R&S-5 R&S-95 R&S-mp-5544 Northwestern University R&S-5 R&S-95 R&S-mp-5545 University of Tennessee R&S-5 R&S-95 R&S-mp-5546 University of Kentucky R&S-5 R&S-95 R&S-mp-5547 University of Massachusetts Amherst R&S-5 R&S-95 R&S-mp-5548 University of Pittsburgh Pittsburgh Campus R&S-95 R&S-mp-5549 University of Rochester R&S-5 R&S-mp-5550 University of Kansas R&S-551 University of Oregon R&S-9552 University of Virginia R&S-9553 University of Utah R&S-95
Green entries had a higher new group designation with the revised NRC data. Red entries had a lower new group designation with the revised NRC data.
Attachment C1.1
3 of 6

New group designations are based on the scheme approved in New Orleans.Entries are sorted by NRC Revised Data, then by initial NRC Data.Highlighted entries had their program reclassified for the April 2011 revised report.Green entries had a higher new group designation with the revised NRC data.Red entries had a lower new group designation with the revised NRC data.
Nbr. InstitutionGroup in
2010
New Group,
initial NRC Data
New Group, Revised
NRC Data1 BOSTON UNIVERSITY 1 1 12 BRANDEIS UNIVERSITY 1 1 13 BROWN UNIVERSITY 1 1 14 CALIFORNIA INSTITUTE OF TECHNOLOGY 1 1 15 CARNEGIE MELLON UNIVERSITY 1 1 16 COLUMBIA UNIVERSITY IN THE CITY OF NEW YO 1 1 17 CORNELL UNIVERSITY 1 1 18 DUKE UNIVERSITY 1 1 19 GEORGIA INSTITUTE OF TECHNOLOGY 1 1 110 HARVARD UNIVERSITY 1 1 111 INDIANA UNIVERSITY AT BLOOMINGTON 1 1 112 MASSACHUSETTS INSTITUTE OF TECHNOLOGY 1 1 113 MICHIGAN STATE UNIVERSITY 1 1 114 NEW YORK UNIVERSITY 1 1 115 PENN STATE UNIVERSITY 1 1 116 PRINCETON UNIVERSITY 1 1 117 PURDUE UNIVERSITY MAIN CAMPUS 1 1 118 RUTGERS THE STATE UNIVERSITY OF NEW JERSE 1 1 119 STANFORD UNIVERSITY 1 1 120 STATE UNIVERSITY OF NEW YORK AT STONY BRO 1 1 137 TEXAS A & M UNIVERSITY 2 1 138 UNIVERSITY OF ARIZONA 2 1 121 UNIVERSITY OF CALIFORNIA-BERKELEY 1 1 139 UNIVERSITY OF CALIFORNIA-DAVIS 2 1 140 UNIVERSITY OF CALIFORNIA-IRVINE 2 1 122 UNIVERSITY OF CALIFORNIA-LOS ANGELES 1 1 123 UNIVERSITY OF CALIFORNIA-SAN DIEGO 1 1 124 UNIVERSITY OF CALIFORNIA-SANTA BARBARA 1 1 125 UNIVERSITY OF CHICAGO 1 1 141 UNIVERSITY OF DELAWARE 2 1 126 UNIVERSITY OF ILLINOIS AT CHICAGO 1 1 127 UNIVERSITY OF ILLINOIS AT URBANA-CHAMPAIG 1 1 142 UNIVERSITY OF KENTUCKY 2 1 128 UNIVERSITY OF MARYLAND COLLEGE PARK 1 1 143 UNIVERSITY OF MASSACHUSETTS AMHERST 2 1 129 UNIVERSITY OF MICHIGAN-ANN ARBOR 1 1 130 UNIVERSITY OF MINNESOTA-TWIN CITIES 1 1 131 UNIVERSITY OF NOTRE DAME 1 1 132 UNIVERSITY OF PENNSYLVANIA 1 1 144 UNIVERSITY OF TENNESSEE 2 1 133 UNIVERSITY OF TEXAS AT AUSTIN 1 1 134 UNIVERSITY OF WASHINGTON 1 1 135 UNIVERSITY OF WISCONSIN-MADISON 1 1 145 VANDERBILT UNIVERSITY 2 1 136 YALE UNIVERSITY 1 1 147 ARIZONA STATE UNIVERSITY 2 2 146 NORTHWESTERN UNIVERSITY 1 2 1
Attachment C1.1
4 of 6

New group designations are based on the scheme approved in New Orleans.Entries are sorted by NRC Revised Data, then by initial NRC Data.Highlighted entries had their program reclassified for the April 2011 revised report.Green entries had a higher new group designation with the revised NRC data.Red entries had a lower new group designation with the revised NRC data.
Nbr. InstitutionGroup in
2010
New Group,
initial NRC Data
New Group, Revised
NRC Data48 UNIVERSITY OF OREGON 1 1 249 UNIVERSITY OF PITTSBURGH PITTSBURGH CAMP 2 1 285 BAYLOR UNIVERSITY 3 2 286 BOWLING GREEN STATE UNIVERSITY 3 2 258 CLEMSON UNIVERSITY 2 2 259 DARTMOUTH COLLEGE 2 2 287 EMORY UNIVERSITY 3 2 260 FLORIDA STATE UNIVERSITY 2 2 288 INDIANA UNIVERSITY PURDUE UNIVERSITY INDI 3 2 261 IOWA STATE UNIVERSITY 2 2 250 JOHNS HOPKINS UNIVERSITY 1 2 262 KANSAS STATE UNIVERSITY 2 2 263 KENT STATE UNIVERSITY MAIN CAMPUS 2 2 264 LOUISIANA STATE UNIVERSITY AND AGRICULTU 2 2 289 MICHIGAN TECHNOLOGICAL UNIVERSITY 3 2 290 NEW MEXICO STATE UNIVERSITY MAIN CAMPUS 3 2 265 NORTH CAROLINA STATE UNIVERSITY 2 2 266 NORTHEASTERN UNIVERSITY 2 2 251 OHIO STATE UNIVERSITY MAIN CAMPUS 1 2 252 RICE UNIVERSITY 1 2 267 STATE UNIVERSITY OF NEW YORK AT BINGHAMT 2 2 268 SYRACUSE UNIVERSITY MAIN CAMPUS 2 2 269 TEMPLE UNIVERSITY 2 2 291 TUFTS UNIVERSITY 3 2 292 UNIVERSITY OF ALABAMA 3 2 270 UNIVERSITY OF CALIFORNIA-RIVERSIDE 2 2 271 UNIVERSITY OF CALIFORNIA-SANTA CRUZ 2 2 272 UNIVERSITY OF CONNECTICUT 2 2 273 UNIVERSITY OF FLORIDA 2 2 274 UNIVERSITY OF GEORGIA 2 2 275 UNIVERSITY OF HOUSTON 2 2 276 UNIVERSITY OF IOWA 2 2 293 UNIVERSITY OF KANSAS 3 2 277 UNIVERSITY OF MIAMI 2 2 278 UNIVERSITY OF MISSOURI - COLUMBIA 2 2 294 UNIVERSITY OF MISSOURI - ROLLA 3 2 279 UNIVERSITY OF NEBRASKA - LINCOLN 2 2 253 UNIVERSITY OF NORTH CAROLINA AT CHAPEL HI 1 2 280 UNIVERSITY OF OKLAHOMA NORMAN CAMPUS 2 2 281 UNIVERSITY OF ROCHESTER 2 2 282 UNIVERSITY OF SOUTH CAROLINA COLUMBIA 2 2 254 UNIVERSITY OF SOUTHERN CALIFORNIA 1 2 255 UNIVERSITY OF UTAH 1 2 295 UNIVERSITY OF VERMONT 3 2 256 UNIVERSITY OF VIRGINIA 1 2 283 VIRGINIA POLYTECHNIC INSTITUTE AND STATE 2 2 257 WASHINGTON UNIVERSITY IN ST. LOUIS 1 2 284 WAYNE STATE UNIVERSITY 2 2 2
Attachment C1.1
5 of 6
New group designations are based on the scheme approved in New Orleans.Entries are sorted by NRC Revised Data, then by initial NRC Data.Highlighted entries had their program reclassified for the April 2011 revised report.Green entries had a higher new group designation with the revised NRC data.Red entries had a lower new group designation with the revised NRC data.
Nbr. InstitutionGroup in
2010
New Group,
initial NRC Data
New Group, Revised
NRC Data96 WESTERN MICHIGAN UNIVERSITY 3 2 298 MISSISSIPPI STATE UNIVERSITY 3 3 297 TEXAS TECH UNIVERSITY 2 3 299 UNIVERSITY OF NEW HAMPSHIRE 3 3 2100 UNIVERSITY OF LOUISIANA AT LAFAYETTE 3 AM 2101 CLAREMONT GRADUATE UNIVERSITY 2 2 3102 UNIVERSITY OF CINCINNATI MAIN CAMPUS 2 2 3103 UNIVERSITY OF NORTH TEXAS 2 2 3105 AUBURN UNIVERSITY 2 3 3104 CITY UNIVERSITY OF NEW YORK GRAD. CENTER 1 3 3106 COLORADO STATE UNIVERSITY 2 3 3114 GEORGE WASHINGTON UNIVERSITY 3 3 3115 HOWARD UNIVERSITY 3 3 3107 LEHIGH UNIVERSITY 2 3 3116 MONTANA STATE UNIVERSITY - BOZEMAN 3 3 3117 NORTHERN ILLINOIS UNIVERSITY 3 3 3118 OHIO UNIVERSITY MAIN CAMPUS 3 3 3108 OREGON STATE UNIVERSITY 2 3 3119 SOUTHERN ILLINOIS UNIVERSITY CARBONDALE 3 3 3109 STATE UNIVERSITY OF NEW YORK AT ALBANY 2 3 3110 STATE UNIVERSITY OF NEW YORK AT BUFFALO 2 3 3120 STEVENS INSTITUTE OF TECHNOLOGY 3 3 3111 TULANE UNIVERSITY 2 3 3121 UNIVERSITY OF ARKANSAS MAIN CAMPUS 3 3 3112 UNIVERSITY OF COLORADO AT BOULDER 2 3 3113 UNIVERSITY OF HAWAII AT MANOA 2 3 3122 UNIVERSITY OF MEMPHIS 3 3 3123 UNIVERSITY OF MISSISSIPPI 3 3 3124 UNIVERSITY OF RHODE ISLAND 3 3 3125 UNIVERSITY OF SOUTH FLORIDA 3 3 3126 UNIVERSITY OF TOLEDO 3 3 3127 UNIVERSITY OF WISCONSIN-MILWAUKEE 3 3 3128 RENSSELAER POLYTECHNIC INSTITUTE 1 1 AM
Attachment C1.1
6 of 6

An Alternative to the NSA Rankings for Defining Survey Groups
We are offering for consideration an alternative scheme for defining groupings of the Ph.D.-granting mathematics departments. A description of the scheme follows.
For each of the 180 math departments that made up Groups 1, 2 and 3 in 2010 and have not already elected to be moved into our applied math grouping going forward, we determined the average annual number of PhD's awarded over the ten annual survey periods 2000-2001 through 2009-2010. We used this average annual number of Ph.D.'s since there are departments that did not respond every year during this ten year span. In the rest of this document when we refer to size of department we are referring to the department’s average annual number of PhD's awarded.
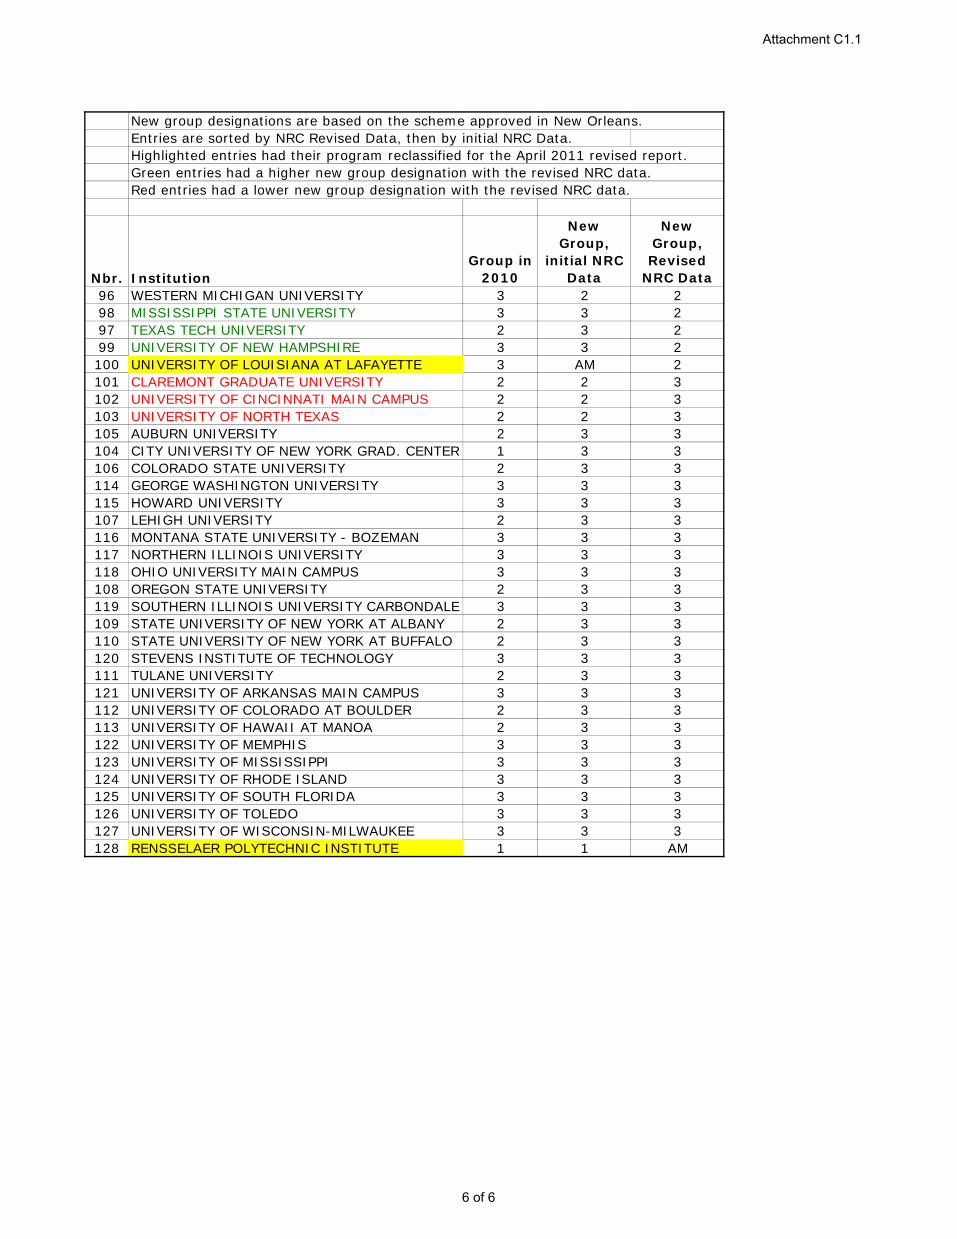
After sorting these departments by their size, we grouped them into decils. We then looked at these decils cross-tabulated by institutional control —public versus private— and by their current Group designation. (See page 2) We felt it might be useful to look separately at the publics and privates for several reasons. First, we suspected that the size of programs at privates run considerably smaller than at the publics, and the data we prepared supports that. Second, salaries are usually significantly different between publics and privates, so having all the privates grouped separately from the publics would make sense for our reporting of this data. Finally, a full separation of the privates and publics would reinforce that these new groupings are different from the old groupings.
Looking at the data we put together, we propose having two groups of private departments and three groups of publics. Math Private Large (MPr_L) and Math Private Small (MPr_S) are the working labels for the private groups. Math Public Large, Math Public Medium, and Math Public Small are the working labels for the publics. The labeling scheme we used is designed to be extendable to new labels for applied math departments (AM), stat departments (ST), and biostat departments (BST).
Group MPr_L would consist of all the private departments that lie in the first five decils. This would be 24 departments total, and it would include all 22 of the current 23 Group 1 Privates, with RPI having elected to move to the applied math grouping(s) when we reform them. This group would pick up one department currently in Group 2 and one in Group 3. This group of the largest private departments account for 80% of the PhD's produced by the privates combined, an annual rate of production of 179 PhD's per year.
There is a natural drop off in rate of production among the privates between the 5th decil and the 6th decil. This supports the notion of taking the remaining 26 privates and making them MPr_S. This group has a combined average annual rate of production of 45 PhD's per year.
The 26 public departments in decils 1 and 2 account for 49% of the average annual production of PhD's among all the public departments, a total of 312 per year. These 26 would constitute Group MPu_L. The next three decils total 40 departments and account for 32% of the average annual production of PhD's among all the publics, a total of 203 per year. These 40 would constitute Group MPu_M. The remaining 64 departments would constitute Group MPu_S, producing 19% of the average annual production of PhD's among all the publics.
The list of departments in each of the proposed new groupings begins on page 3. Starting on page 6 you will find a number of comparisons of the new groupings described above with the current groupings and then with the new NRC-based groupings as discussed at the New Orleans meeting.
Attachment C1.2
1 of 8
Rows are Decils based on average annual number of PhD's, 2000-2010Colums are Control then 2010 Groupings
DecileCount of Surcode
Sum of 00-10
AverageCount of Surcode
Sum of 00-10
AverageCount of Surcode
Sum of 00-10
Average
PR Count of
Surcode
PR Sum of 00-10
AverageD01 4 58 4 58D02 6 52 6 52D03 4 24 4 24D04 3 14 1 5 1 5 5 24D05 5 21 5 21D06 3 11 3 11D07 3 8 2 5 5 13D08 2 4 4 7 6 11D09 3 3 4 4 7 8D10 5 2 5 2Col. Total 22 169 12 31 16 23 50 223
DecileCount of Surcode
Sum of 00-10
AverageCount of Surcode
Sum of 00-10
AverageCount of Surcode
Sum of 00-10
Average
PU Count of
Surcode
PU Sum of 00-10
AverageD01 14 207 1 16 15 223D02 6 48 5 41 11 89D03 2 13 11 66 1 6 14 84D04 3 15 8 40 3 14 14 69D05 6 25 6 25 12 50D06 8 27 7 23 15 50D07 3 7 12 28 15 35D08 1 2 9 16 10 18D09 1 1 10 11 11 12D10 13 3 13 3Col. Total 25 284 44 223 61 124 130 632
11 20 30
Private12 20 30
Public
Attachment C1.2
2 of 8

List of Departments by New Size-based GroupsProto Group Institution Name DL Department Name DL 00-10
Average
MPr_L Boston University Dept. of Mathematics & Statistics 7.40MPr_L Brandeis Universitity Dept. of Mathematics 4.20MPr_L Brown University Dept. of Mathematics 4.60MPr_L California Institute of Technology Dept. of Mathematics 4.20MPr_L Carnegie Mellon University Dept. of Mathematical Science 6.20MPr_L Claremont Graduate University School of Mathematical Sciences 4.90MPr_L Columbia University Dept. of Mathematics 8.90MPr_L Cornell University Dept. of Mathematics 9.30MPr_L Duke University Dept. of Mathematics 4.70MPr_L Emory University Mathematics & Computer Science Dept. 4.80MPr_L Harvard University Dept. of Mathematics 9.20MPr_L Johns Hopkins University, Baltimore Dept. of Mathematics 3.90MPr_L Massachusetts Institute of Technology Dept. of Mathematics 19.80MPr_L New York University, Courant Institute Courant Institute of Mathematical Sciences 15.44MPr_L Northwestern University Dept. of Mathematics 6.00MPr_L Princeton University Dept. of Mathematics 9.90MPr_L Rice University Dept. of Mathematics 4.00MPr_L Stanford University Dept. of Mathematics 10.00MPr_L University of Chicago Dept. of Mathematics 12.90MPr_L University of Notre Dame Dept. of Mathematics 6.00MPr_L University of Pennsylvania Dept. of Mathematics 7.30MPr_L University of Southern California Dept. of Mathematics 6.00MPr_L Washington University Dept. of Mathematics 4.20MPr_L Yale University Dept. of Mathematics 4.90MPr_S Baylor University Dept. of Mathematics 1.88MPr_S Boston College Dept. of Mathematics 0.00MPr_S Brigham Young University Dept. of Mathematics 1.00MPr_S Bryn Mawr College Dept. of Mathematics 1.22MPr_S Case Western Reserve University Dept. of Mathematics 1.10MPr_S Clarkson University Dept. of Mathematics & Computer Science 1.33MPr_S Dartmouth College Dept. of Mathematics 3.50MPr_S Drexel University Dept. of Mathematics 0.38MPr_S George Washington University Dept. of Mathematics 2.22MPr_S Howard University Dept. of Mathematics 2.33MPr_S Lehigh University Dept. of Mathematics 2.50MPr_S Marquette University Dept. of Mathematics, Statistics & Comp Science 0.78MPr_S Northeastern University Dept. of Mathematics 3.50MPr_S Polytechnic Institute of NY University Dept. of Mathematics 0.88MPr_S Southern Methodist University Dept. of Mathematics 1.90MPr_S St Louis University Dept. of Mathematics & Computer Science 0.80MPr_S Stevens Institute of Technology Dept. of Mathematical Sciences 2.00MPr_S Syracuse University Dept. of Mathematics 3.50MPr_S Tufts University Dept. of Mathematics 1.67MPr_S Tulane University Dept. of Mathematics 1.33MPr_S University of Denver Dept. of Mathematics 0.44MPr_S University of Miami Dept. of Mathematics 1.56MPr_S University of Rochester Dept. of Mathematics 2.80MPr_S Vanderbilt University Dept. of Mathematics 3.00MPr_S Wesleyan University Dept. of Mathematics & Computer Science 2.00MPr_S Worcester Polytechnic Institute Mathematical Sciences Dept. 0.67MPu_L Arizona State University Dept. of Mathematics & Statistics 7.40MPu_L Graduate Center, City University of NY PhD Program in Mathematics 7.10MPu_L Indiana University, Bloomington Dept. of Mathematics 10.30MPu_L Louisiana State University, Baton Rouge Dept. of Mathematics 8.00MPu_L Michigan State University Dept. of Mathematics 9.00MPu_L North Carolina State University Dept. of Mathematics 15.50MPu_L Ohio State University, Columbus Dept. of Mathematics 11.30MPu_L Pennsylvania State University, University Park Dept. of Mathematics 8.90MPu_L Purdue University Dept. of Mathematics 14.00MPu_L Rutgers The State University of NJ Dept. of Mathematics 10.00MPu_L SUNY, Stony Brook University Dept. of Mathematics 7.00MPu_L Texas A&M University Dept. of Mathematics 9.40MPu_L University of California, Berkeley Dept. of Mathematics 24.20MPu_L University of California, Davis Dept. of Mathematics 7.70
Attachment C1.2
3 of 8

List of Departments by New Size-based GroupsProto Group Institution Name DL Department Name DL 00-10
Average
MPu_L University of California, Los Angeles Dept. of Mathematics 18.20MPu_L University of California, San Diego Dept. of Mathematics 11.11MPu_L University of California, Santa Barbara Dept. of Mathematics 7.00MPu_L University of Illinois at Chicago Mathematics, Statistics & Computer Science Dept. 11.30MPu_L University of Illinois, Urbana-Champaign Dept. of Mathematics 18.30MPu_L University of Iowa Dept. of Mathematics 8.20MPu_L University of Maryland, College Park Dept. of Mathematics 22.20MPu_L University of Michigan Dept. of Mathematics 18.00MPu_L University of Minnesota-Twin Cities School of Mathematics 11.70MPu_L University of Texas at Austin Dept. of Mathematics 11.50MPu_L University of Washington Dept. of Mathematics 9.00MPu_L University of Wisconsin, Madison Dept. of Mathematics 15.20MPu_M Auburn University Dept. of Mathematics & Statistics 5.44MPu_M Bowling Green State University Dept. of Mathematics & Statistics 4.10MPu_M Clemson University Dept. of Mathematical Sciences 6.30MPu_M Colorado State University Dept. of Mathematics 4.56MPu_M Florida State University Dept. of Mathematics 5.90MPu_M Georgia Institute of Technology School of Mathematics 6.80MPu_M Illinois State University Dept. of Mathematics 4.44MPu_M Iowa State University Dept. of Mathematics 5.60MPu_M Kent State University, Kent Dept. of Mathematical Sciences 4.25MPu_M Montana State University Dept. of Mathematical Sciences 4.00MPu_M State University of New York at Buffalo Dept. of Mathematics 4.60MPu_M State University of NY at Binghamton Dept. of Mathematics & Science 5.00MPu_M Temple University Dept. of Mathematics 4.11MPu_M Texas Tech University Dept. of Mathematics & Statistics 4.80MPu_M University of Alabama Dept. of Mathematics 4.00MPu_M University of Arizona Dept. of Mathematics 4.30MPu_M University of California, Irvine Dept. of Mathematics 6.33MPu_M University of Colorado, Boulder Dept. of Mathematics 5.00MPu_M University of Connecticut, Storrs Dept. of Mathematics 5.50MPu_M University of Delaware Dept. of Mathematical Science 3.90MPu_M University of Florida Dept. of Mathematics 6.33MPu_M University of Georgia Dept. of Mathematics 5.20MPu_M University of Houston Dept. of Mathematics 5.60MPu_M University of Kentucky Dept. of Mathematics 6.50MPu_M University of Louisiana at Lafayette Dept. of Mathematics 4.70MPu_M University of Maryland, Baltimore County Dept. of Mathematics & Statistics 4.50MPu_M University of Massachusetts, Amherst Dept. of Mathematics & Statistics 4.40MPu_M University of Memphis Dept. of Mathematical Sciences 4.20MPu_M University of Missouri-Columbia Dept. of Mathematics 5.30MPu_M University of Nebraska-Lincoln Dept. of Mathematics 5.50MPu_M University of New Mexico Dept. of Mathematics & Statistics 5.80MPu_M University of North Carolina at Chapel Hill Dept. of Mathematics 5.00MPu_M University of Oregon Dept. of Mathematics 5.30MPu_M University of Pittsburgh Dept. of Mathematics 6.60MPu_M University of South Florida Dept. of Mathematics 4.50MPu_M University of Tennessee, Knoxville Dept. of Mathematics 3.90MPu_M University of Utah Dept. of Mathematics 6.10MPu_M University of Virginia Dept. of Mathematics 5.10MPu_M University of Wisconsin, Milwaukee Dept. of Mathematical Sciences 4.00MPu_M Virginia Polytechnic Institute and State Univ. Dept. of Mathematics 5.40MPu_S Air Force Institute of Technology Dept. of Mathematics & Statistics 0.22MPu_S Central Michigan University Dept. of Mathematics 2.30MPu_S College of William & Mary Dept. of Mathematics 0.44MPu_S Colorado School of Mines Dept. of Mathematics & Computer Science 1.90MPu_S Delaware State University Dept. of Mathematical Sciences 0.40MPu_S Florida Atlantic University Dept. of Mathematical Sciences 2.00MPu_S George Mason University Dept. of Mathematical Sciences 0.50MPu_S Georgia State University Mathematics & Statistical Dept. 0.00MPu_S Idaho State University Dept. of Mathematics 0.89MPu_S Indiana Univ.-Purdue Univ. Indianapolis Dept. of Mathematical Sciences 1.30MPu_S Kansas State University Dept. of Mathematics 2.50MPu_S Michigan Technical University Dept. of Mathematics & Science 2.30
Attachment C1.2
4 of 8

List of Departments by New Size-based GroupsProto Group Institution Name DL Department Name DL 00-10
Average
MPu_S Mississippi State University Dept. of Mathematics & Statistics 1.10MPu_S Missouri University of Science & Technology Dept. of Mathematics & Statistics 1.70MPu_S New Mexico Institute of Mining & Technology Dept. of Mathematics 0.00MPu_S New Mexico State University, Las Cruces Dept. of Mathematical Sciences 2.70MPu_S North Dakota State University, Fargo Dept. of Mathematics 1.00MPu_S Northern Illinois Univeresity Dept. of Mathematical Sciences 3.40MPu_S Oakland University Dept. of Mathematics & Statistics 1.80MPu_S Ohio University, Athens Dept. of Mathematics 2.10MPu_S Oklahoma State University Dept. of Mathematics 1.40MPu_S Old Dominion University Dept. of Mathematics & Statistics 2.30MPu_S Oregon State University Dept. of Mathematics 2.11MPu_S Portland State University Dept. of Mathematics & Statistics 1.60MPu_S Rutgers University-Newark Dept. of Mathematics & Computer Science 1.00MPu_S South Dakota State University Dept. of Mathematics & Statistics 1.00MPu_S Southern Illinois University, Carbondale Dept. of Mathematics 2.22MPu_S Texas State University-San Marcos Dept. of Mathematics 0.00MPu_S The University of Albany, SUNY Dept. of Mathematics & Statistics 1.90MPu_S University of Alabama at Birmingham Dept. of Mathematics 2.11MPu_S University of Alaska Fairbanks Dept. of Mathematics & Statistics 0.22MPu_S University of Arkansas at Fayetteville Dept. of Mathematical Sciences 1.50MPu_S University of California, Riverside Dept. of Mathematics 3.30MPu_S University of California, Santa Cruz Dept. of Mathematics 2.50MPu_S University of Central Florida Dept. of Mathematics 3.67MPu_S University of Cincinnati Dept. of Mathematical Sciences 3.20MPu_S University of Hawaii at Mano Dept. of Mathematics 0.90MPu_S University of Idaho Dept. of Mathematics 1.22MPu_S University of Kansas Dept. of Mathematics 3.20MPu_S University of Mississippi Dept. of Mathematics 2.50MPu_S University of Missouri-Kansas City Dept. of Mathematics & Statistics 0.30MPu_S University of Missouri-St Louis Dept. of Mathematics & Computer Science 0.56MPu_S University of Montana - Missoula Dept. of Mathematical Sciences 2.22MPu_S University of Nevada, Las Vegas Dept. of Mathematical Sciences 0.00MPu_S University of New Hampshire Dept. of Mathematics & Statistics 3.22MPu_S University of North Carolina at Charlotte Dept. of Mathematics & Statistics 3.20MPu_S University of North Carolina at Greensboro Dept. of Mathematics & Statistics 0.00MPu_S University of North Texas Mathematics Dept. 3.40MPu_S University of Northern Colorado School of Mathematical Sciences 2.20MPu_S University of Oklahoma Dept. of Mathematics 3.20MPu_S University of Rhode Island Dept. of Mathematics 2.20MPu_S University of South Carolina Dept. of Mathematics 3.70MPu_S University of Southern Mississippi Dept. of Mathematics 0.00MPu_S University of Texas at Arlington Dept. of Mathematics 3.67MPu_S University of Texas at Dallas Dept. of Mathematical Sciences 3.10MPu_S University of Toledo Dept. of Mathematics 1.50MPu_S University of Vermont Dept. of Mathematics & Statistics 1.00MPu_S University of Wyoming Dept. of Mathematics 1.11MPu_S Utah State University Dept. of Mathematics & Statistics 3.20MPu_S Washington State University Dept. of Mathematics 3.10MPu_S Wayne State University Dept. of Mathematics 3.44MPu_S West Virginia University Dept. of Mathematics 2.60MPu_S Western Michigan University Dept. of Mathematics 2.11MPu_S Wichita State University Mathematics & Statistics Dept. 1.70
Attachment C1.2
5 of 8

Comparisons among Current & New Groupings
New Size-based Grouping Name Group CodeMathematics Public Large MPu_LMathematics Public Medium MPu_MMathematics Public Small MPu_SMathematics Private Large MPr_LMathematics Private Small MPr_SApplied Mathematics AMStatistics STBiostatistics BST
2011 Doctoral Math Departments: Current Groups vs New Groups
New Size-based Groups →Current Groups ↓ MPu_L MPr_L MPu_M MPr_S MPu_S Grand Total
11 20 5 2512 22 221
20 6 1 25 11 13 5630 1 10 15 51 77
Grand Total 26 24 40 26 64 180
Sum of Average Annual PhD Production: Current Groups vs New Groups
New Size-based Groups →Current Groups ↓ MPu_L MPr_L MPu_M MPr_S MPu_S Grand Total
11 255 28 28412 169 16920 56 5 130 26 37 25430 5 44 19 80 148
Grand Total 312 179 203 44 117 855
PhD Source of 2009-2010 Newdocs: Current Groups by New Groups
New Size-based Groups →Current Groups ↓ MPu_L MPr_L MPu_M MPr_S MPu_S ST BST AM Grand TotalGroup 1 Pub 321 44 365Group 1 Pri 166 7 173Group 2 68 12 185 29 57 351Group 3 7 53 33 113 10 216Statistics 294 294Biostatistics 128 128Applied Math 105 105Grand Total 389 185 282 62 170 294 128 122 1632
1 Group 1 Private contains 23 departments but with the new groupings, RPI will move to applied math per their preference.
Attachment C1.2
6 of 8

2009-10 Newdocs Taking Academic Employment, by Current Groups
PhD Source →Employer ↓ Gr 1 Pu Gr 1 Pr Gr 2 Gr 3 App. M. Stat Biostat Grand TotalGroup 1 Pub. 52 19 11 3 2 1 88Group 1 Pri. 34 34 6 2 5 2 83Group 2 36 11 37 3 1 5 93Group 3 2 2 12 25 3 8 1 53Group V 3 9 2 14Stat dept. 1 3 1 1 30 3 39Biostat dept. 1 13 21 35Masters dept. 7 2 13 10 3 3 1 39Bachelor dept. 27 13 62 47 3 11 1 164Two-year inst. 6 11 9 26Other Acad. 21 9 36 22 15 51 33 187Grand Total 189 93 190 121 42 126 60 821
Inner box contains 139 of 171 hires by Groups 11 & 12, 81.3%Outer box contains 240 of 264 hires by Groups 11, 12, 20, 90.9%
2009-10 Newdocs Taking Academic Employment, by New Size-based Groups
PhD Source →Employer ↓ MPu_L MPr_L MPu_M MPr_S MPu_S AM ST BST Grand TotalMPu_L 61 19 9 2 3 2 3 99MPr_L 33 33 6 2 1 5 2 82MPu_M 22 7 31 11 2 3 76MPr_S 9 5 3 4 1 1 23MPu_S 1 1 8 14 1 7 32AM 4 12 3 19Stat dept. 1 3 1 1 30 3 39Biostat dept. 1 13 21 35Masters dept. 7 2 11 4 8 3 3 1 39Bachelor dept. 34 13 50 15 32 8 11 1 164Two-year inst. 6 6 1 13 26Other Acad. 25 9 24 8 20 17 51 33 187Grand Total 203 92 149 36 103 52 126 60 821
Inner box contains 146 of 181 hires by Groups MPu_L & MPr_L, 80.6%Outer box contains 221 of 257 hires by Groups MPu_L, MPr_L, & MPu_M, 86.0%
Attachment C1.2
7 of 8

New Size-based Groups →NRC-based Groups ↓ MPr_L MPu_L MPu_M MPr_S MPu_S Grand Total
Group 1 18 21 7 1 0 47Group 2 5 4 22 7 15 53Group 3 1 1 11 18 49 80
Grand Total 24 26 40 26 64 180
New Size-based Groups →NRC-based Groups ↓ MPu_L MPu_M MPu_S Grand Total
Group 1 21 7 0 28Group 2 4 22 15 41Group 3 1 11 49 61
Grand Total 26 40 64 130
New Size-based Groups →NRC-based Groups ↓ MPr_L MPr_S Grand Total
Group 1 18 1 19Group 2 5 7 12Group 3 1 18 19
Grand Total 24 26 50
2011 Doctoral Math Departments: New NRC-based Groups vs New Size-based Groups
2011 Public Doctoral Math Departments: New NRC-based Groups vs New PhD Size-based Groups
2011 Private Doctoral Math Departments: New NRC-based Groups vs New PhD Size-based Groups
Attachment C1.2
8 of 8

Attachment D1.1
Page 1 of 1
Changes in Annual Survey Schedule
Survey Section PhD Depts. Masters Depts. Bachelors Depts.
New Doctorates Survey Annual – – Salary Survey Annual Annual Annual Recruitment & Hiring Survey, including Deaths & Retirements
Annual Annual Annual
Departmental Profile Survey Faculty Profile Section Even Years Even Years Even Years Graduate Student Profile, summary1 Even Years Even Years – Graduate Student Profile, detail Odd Years Odd Years – Masters Degrees Awarded Section Odd Years Odd Years – Bachelor Degrees Awarded Section Odd Years Odd Years Odd Years Graduate Course Enrollments Section Odd Years Odd Years – Undergraduate Course Enrollments
Section Odd Years Odd Years Odd Years
1 The summary would gather only counts of total full-time graduate students and total full-time first-year graduate students. It would omit citizenship, gender and race/ethnicity breakouts, but it would still allow us to monitor total numbers of graduate students annually.

Current Group B Institutional CountsCarnegie Groupings →
Carnegie Class ↓ B1 B2 B3 B4 Grand Total
12 2 2
15 2 2
16 5 517 35 3518 257 25719 130 130
20 73 73
21 225 225
22 257 25723 10 10
24 2 2
26 3 327 3 329 7 7
Grand Total 299 203 225 284 1011
Proposed Groups CC Code CC CategoryB4 12B1 15B1 16B1 17B1 18B2 19B2 20B3 21B4 22B4 23B4 24B4 25B4 26B4 27B4 28B4 29 Spec/Bus: Special Focus Institutions--Schools of business and
Spec/Faith: Special Focus Institutions--Theological Spec/Med: Special Focus Institutions--Medical schools and Spec/Health: Special Focus Institutions--Other health Spec/Engg: Special Focus Institutions--Schools of engineeringSpec/Tech: Special Focus Institutions--Other technology-
Master's M: Master's Colleges and Universities (medium Master's S: Master's Colleges and Universities (smaller Bac/A&S: Baccalaureate Colleges--Arts & SciencesBac/Diverse: Baccalaureate Colleges--Diverse FieldsBac/Assoc: Baccalaureate/Associate's Colleges
Assoc/Pub4: Associate's--Public 4-year Primarily Associate'sRU/VH: Research Universities (very high research activity)RU/H: Research Universities (high research activity)DRU: Doctoral/Research UniversitiesMaster's L: Master's Colleges and Universities (larger
Attachment D2.1
1 of 6

Current Group B DepartmentsPub (1) vs Pri (2) →
Carnegie Groupings ↓ 1 2 Grand TotalB1 87 212 299B2 71 132 203B3 31 194 225B4 66 218 284Grand Total 255 756 1011
All Group B 2011 Survey Strata →Carnegie Groupings ↓ 1 2 3 4 5 Grand TotalB1 18 31 70 102 78 299B2 19 37 63 61 23 203B3 57 47 81 40 225B4 96 86 57 39 6 284Grand Total 190 201 271 242 107 1011
Group B Privates 2011 Survey Strata →Carnegie Groupings ↓ 1 2 3 4 5 Grand TotalB1 16 29 62 83 22 212B2 19 34 49 23 7 132B3 51 45 72 26 194B4 88 69 36 23 2 218Grand Total 174 177 219 155 31 756
Group B Publics 2011 Survey Strata →Carnegie Groupings ↓ 1 2 3 4 5 Grand TotalB1 2 2 8 19 56 87B2 3 14 38 16 71B3 6 2 9 14 31B4 8 17 21 16 4 66Grand Total 16 24 52 87 76 255
< 1000 <1500 <2500 <5000 >=5000
Attachment D2.1
2 of 6

Group B3: Private Carnegie Class 21Inst Dept City StateBirmingham-Southern College Department of Mathematics & Computer Science Birmingham ALJudson College Department of Mathematics & Physics Marion ALStillman College Department of Mathematics & Computer Science Tuscaloosa ALTalladega College Department of Mathematics & Computer Science Talladega ALHendrix College Department of Mathematics & Computer Science Conway ARLyon College Department of Mathematics Batesville AROuachita Baptist University Mathematics & Computer Science Department Arkadelphia ARClaremont McKenna College Department of Mathematics & Computer Science Claremont CAHarvey Mudd College Department of Mathematics Claremont CAOccidental College Department of Mathematics Los Angeles CAPacific Union College Computer Science, Mathematics & Physics DepartmeAngwin CAPitzer College Department of Mathematics Claremont CAPomona College Department of Mathematics Claremont CAScripps College Department of Mathematics Claremont CASimpson University Department of Mathematics Redding CAWestmont College Department of Mathematics & Computer Science Santa Barbara CAWhittier College Department of Mathematics Whittier CAColorado College Department of Mathematics & Computer Science Colorado Springs COConnecticut College Department of Mathematics & Computer Science New London CTTrinity College Department of Mathematics Hartford CTClearwater Christian College Department of Mathematics Clearwater FLEckerd College Mathematics Discipline St Petersburg FLAgnes Scott College Department of Mathematics Decatur GABerry College Department of Mathematics & Computer Science Mt Berry GAMorehouse College Department of Mathematics Atlanta GAOglethorpe University Department of Mathematics & Computer Science Atlanta GAShorter University Department of Mathematics & Computer Science Rome GASpelman College Department of Mathematics Atlanta GAWesleyan College Department of Mathematics & Computer Science Macon GACentral College Department of Mathematics & Computer Science Pella IACoe College Department of Mathematical Science Cedar Rapids IACornell College Department of Mathematics Mt Vernon IAGrinnell College Department of Mathematics & Statistics Grinnell IALuther College Department of Mathematics Decorah IASimpson University Department of Mathematics Indianola IAWartburg College Mathematics, Computer Science & Physics DepartmeWaverly IAThe College of Idaho Department of Mathematics & Physical Science Caldwell IDAugustana College Mathematics & Computer Science Department Rock Island ILIllinois College Department of Mathematics Jacksonville ILIllinois Wesleyan University Department of Mathematics & Computer Science Bloomington ILKnox College Department of Mathematics Galesburg ILLake Forest College Mathematics & Computer Science Department Lake Forest ILMonmouth College Mathematics & Computer Science Department Monmouth ILPrincipia College Department of Mathematics Elsah ILWheaton College Department of Mathematics & Computer Science Wheaton ILDePauw University Department of Mathematics Greencastle INEarlham Colletge Department of Mathematics Richmond INGoshen College Department of Mathematics Goshen INHanover College Department of Mathematics & Computer Science Hanover INMartin Univiversity Science & Mathematics Division Indianapolis INSaint MaryÕs College Mathematics Department Notre Dame INWabash College Department of Mathematics & Computer Science Crawfordsville IN
Attachment D2.1
3 of 6

Group B3: Private Carnegie Class 21Inst Dept City StateAlice Lloyd College Department of Natural Sciences & Mathematics Pippa Passes KYBerea College Department of Mathematics & Computer Science Berea KYCentre College Department of Mathematics Danville KYGeorgetown College Mathematics Physics & Computer Science Departme Georgetown KYPikeville College Department of Mathematics & Science Pikeville KYTransylvania University Mathematics Program Lexington KYCentenary College Department of Mathematics Shreveport LADillard University Department of Mathematics New Orleans LAXavier University of Louisiana Department of Mathematics New Orleans LAAmherst College Department of Mathematics Amherst MABay Path College Department of Mathematics Longmeadow MACollege of the Holy Cross Department of Mathematics & Computer Science Worcester MAEastern Nazarene College Department of Mathematics & Computer Science Quincy MAGordon College Department of Mathematics & Computer Science Wenham MAHampshire College School of Natural Science Amherst MAMount Holyoke College Department of Mathematics & Statistics South Hadley MAPine Manor College Department of Mathematics Chestnut Hill MASmith College Department of Mathematics and Statistics Northampton MAStonehill College Department of Mathematics North Easton MAWellesley College Department of Mathematics Wellesley MAWheaton College Department of Mathematics & Computer Science Norton MAWilliams College Department of Mathematics & Statistics Williamstown MAGoucher College Mathematics & Computer Science Department Baltimore MDMcDaniel College Department of Mathematics & Computer Science Westminster MDWashington College Department of Mathematics & Computer Science Chestertown MDBates College Department of Mathematics Lewiston MEBowdoin College Mathematics Department Brunswick MEColby College Department of Mathematics Waterville MEAlbion College Department of Mathematics & Computer Science Albion MIAlma College Mathematics & Computer Science Department Alma MICalvin College Mathematics & Statistics Department Grand Rapids MIHope College Department of Mathematics Holland MIKalamazoo College Department of Mathematics & Computer Science Kalamazoo MICarleton College Department of Mathematics Northfield MNConcordia College Department of Mathematics & Computer Science Moorhead MNGustavus Adolphus College Mathematics & Computer Science Department St Peter MNMacalester College Department of Mathematics & Computer Science St Paul MNSt John's University/College of S Department of Mathematics Collegeville MNSt Olaf College Department of Mathematics, Statistics & Computer SNorthfield MNWestminster College Department of Mathematical Science Fulton MOWilliam Jewell College Department of Mathematics & Phyics Liberty MOMillsaps College Department of Mathematics Jackson MSRust College Department of Mathematics Holly Springs MSTougaloo College Mathematics & Science Department Tougaloo MSBennett College for Women Department of Mathematics & Computer Science Greensboro NCBrevard College Division of Science & Mathematics Brevard NCDavidson College Department of Mathematics Davidson NCGuilford College Department of Mathematics Greensboro NCJohnson C Smith University Department of Natural Science & Mathematics Charlotte NCPeace College Department of Mathematics Raleigh NCSalem College Department of Mathematics & Computer Science Winston Salem NCWarren Wilson College Department of Mathematics & Computer Science Asheville NC
Attachment D2.1
4 of 6

Group B3: Private Carnegie Class 21Inst Dept City StateDoane College Department of Mathematics Crete NENebraska Wesleyan University Mathematics & Computer Science Department Lincoln NESt Anselm College Department of Mathematics Manchester NHBloomfield College Division of Science & Mathematics Bloomfield NJDrew University Mathematics & Computer Science Department Madison NJBard College Department of Mathematics Annandale on Huds NYColgate University Department of Mathematics Hamilton NYColumbia University, Barnard CoDepartment of Mathematics New York NYHamilton College Department of Mathematics Clinton NYHartwick College Department of Mathematics Oneonta NYHobart & William Smith College Mathematics & Computer Science Department Geneva NYHoughton College Department of Mathematics Houghton NYMarymount Manhattan College Department of Natural Science & Mathematics New York NYSarah Lawrence Coll Department of Mathematics Bronxville NYSiena College Department of Mathematics Loudonville NYSkidmore College Department of Mathematics & Computer Science Saratoga Springs NYSt Lawrence University Department of Mathematics, Computer Science & St Canton NYUnion College Department of Mathematics Schenectady NYVassar College Department of Mathematics Poughkeepsie NYWells College Department of Mathematics & Physical Science Aurora NYDenison University Department of Mathematics & Computer Science Granville OHHiram College Mathematics Department Hiram OHKenyon College Department of Mathematics Gambier OHOberlin College Department of Mathematics Oberlin OHOhio Wesleyan University Department of Mathematics & Computer Science Delaware OHThe College of Wooster Mathematics & Computer Science Department Wooster OHWittenberg University Department of Mathematics & Computer Science Springfield OHLewis & Clark College Department of Mathematical Science Portland ORLinfield College Department of Mathematics McMinnville ORReed College Department of Mathematics Portland ORWillamette University Mathematics Department Salem ORAlbright College Department of Mathematics Reading PAAllegheny College Department of Mathematics Meadville PADickinson College Department of Mathematics and Computer Science Carlisle PAFranklin & Marshall College Department of Mathematics Lancaster PAGettysburg College Department of Mathematics Gettysburg PAGrove City College Department of Mathematics Grove City PAHaverford College Department of Mathematics Haverford PAJuniata College Mathematics Department Huntingdon PALafayette College Department of Mathematics Easton PALycoming College Mathematical Sciences Department Williamsport PAMoravian College Department of Mathematics & Computer Science Bethlehem PAMuhlenberg College Department of Mathematics & Computer Science Allentown PASt Vincent College Department of Mathematics Latrobe PASusquehanna University Department of Mathematical Science Selinsgrove PASwarthmore College Department of Mathematics & Statistics Swarthmore PAUrsinus College Department of Mathematics & Computer Science Collegeville PAWashington & Jefferson College Department of Mathematics Washington PAWestminster College Department of Mathematics & Computer Science New Wilmington PAAllen University Department of Mathematics Columbia SCClaflin University Mathematics & Computer Science Department Orangeburg SCErskine College Department of Mathematics Due West SC
Attachment D2.1
5 of 6

Group B3: Private Carnegie Class 21Inst Dept City StateFurman University Department of Mathematics Greenville SCPresbyterian College Department of Mathematics Clinton SCWofford College Department of Mathematics Spartanburg SCFisk University Department of Mathematics Nashville TNLambuth University Department of Mathematics & Physics Jackson TNLane Colletge Mathematics Jackson TNMaryville College Mathematics & Computer Science Division Maryville TNRhodes College Department of Mathematics & Computer Science Memphis TNSewanee: The University of the SDepartment of Mathematics & Computer Science Sewanee TNAustin College Department of Mathematics & Computer Science Sherman TXHuston-Tillotson Univ Division of Science & Technology Austin TXSouthwestern University Department of Mathematics & Computer Science Georgetown TXBridgewater College Mathematics & Computer Science Department Bridgewater VAEmory & Henry College Department of Mathematics Emory VAHampden-Sydney College Department of Mathematics & Computer Science Hampden-Sydney VAHollins University Department of Mathematics & Statistics Roanoke VARandolph College Department of Mathematics Lynchburg VARandolph-Macon College Department of Mathematics Ashland VARoanoke College Mathematics, Statistics, Computer Science & Physics Salem VASweet Briar College Mathematical Science Department Sweet Briar VAUniversity of Richmond Department of Mathematics & Computer Science Richmond VAVirginia Intermont College Department of Mathematics Bristol VAVirginia Wesleyan College Department of Mathematics & Computer Science Norfolk VAWashington & Lee University Department of Mathematics Lexington VABennington College Department of Mathematics & Science Bennington VTGreen Mountain College Department of Mathematics Poultney VTMiddlebury College Department of Mathematics Middlebury VTSt Michael's College Department of Mathematics Colchester VTUniversity of Puget Sound Department of Mathematics & Computer Science Tacoma WAWhitman College Department of Mathematics Walla Walla WABeloit College Mathematics & Computer Science Department Beloit WICarthage College Department of Mathematics Kenosha WILawrence University Department of Mathematics & Computer Science Appleton WINorthland College Department of Mathematics & Applied Statistics Ashland WIRipon College Department of Mathematics & Computer Science Ripon WISt Norbert College Department of Mathematics DePere WIWisconsin Lutheran College Mathematical Science Department Milwaukee WIBethany College Department of Mathematics & Computer Science Bethany WV
Attachment D2.1
6 of 6

Attachment E1.1
1 of 5
Attachment E1.1
2 of 5

Attachment E1.1
3 of 5

Attachment E1.1
4 of 5

Attachment E1.1
5 of 5

Groups I, II, III, IV & Va Combined
299 of 299 departments responding ( 26 with no degrees)MEN WOMEN
Citizenship CitizenshipNon-US Non-US
US Perm Temp Unk Total US Perm Temp Unk Total TOTALAm Ind/Alas 2 0 1 0 3 0 0 1 0 1Asian 23 17 319 5 364 19 36 176 4 235Bl/Afr Am 14 4 11 2 31 14 0 0 0 14Hisp/Lat 20 2 28 0 50 4 0 9 0 13Haw/Pac Is 2 0 0 0 2 4 0 1 0 5White 486 11 139 1 637 182 9 41 2 234
Unknown 17 0 9 5 31 2 0 9 1 12TOTAL 564 34 507 13 1118 225 45 237 7 514
Group I (Public)Doctorate Granting Departments of Mathematics
25 of 25 departments responding ( 0 with no degrees)MEN WOMEN
Citizenship CitizenshipNon-US Non-US
US Perm Temp Unk Total US Perm Temp Unk Total TOTALAm Ind/Alas 0 0 0 0 0 0 0 0 0 0Asian 1 3 65 0 69 6 5 27 0 38Bl/Afr Am 2 1 0 0 3 0 0 0 0 0Hisp/Lat 4 1 7 0 12 1 0 3 0 4Haw/Pac Is 0 0 0 0 0 1 0 0 0 1White 150 3 42 0 195 30 1 7 1 39Unknown 2 0 1 0 3 0 0 1 0 1TOTAL 159 8 115 0 282 38 6 38 1 83
Group I (Private)Doctorate Granting Departments of Mathematics
23 of 23 departments responding ( 0 with no degrees)MEN WOMEN
Citizenship CitizenshipNon-US Non-US
US Perm Temp Unk Total US Perm Temp Unk Total TOTALAm Ind/Alas 0 0 0 0 0 0 0 0 0 0Asian 3 0 33 1 37 0 1 11 1 13Bl/Afr Am 2 0 1 0 3 0 0 0 0 0Hisp/Lat 0 0 1 0 1 0 0 2 0 2Haw/Pac Is 0 0 0 0 0 1 0 0 0 1White 58 2 28 1 89 18 2 5 0 25Unknown 0 0 1 0 1 0 0 1 0 1TOTAL 63 2 64 2 131 19 3 19 1 42
31
1142
173
2344
365
050
3
1632
0107
316
1
7871
43
4563
4599
Supplemental Table D.1: Gender, Race/Ethnicity & Citizenship of 2009-2010 New Doctoral Recipients, July 1, 2009 - June 30, 2010
Section on Demographics
Attachment E3.1
1 of 4

Group IIDoctorate Granting Departments of Mathematics
56 of 56 departments responding ( 2 with no degrees)MEN WOMEN
Citizenship CitizenshipNon-US Non-US
US Perm Temp Unk Total US Perm Temp Unk Total TOTALAm Ind/Alas 0 0 0 0 0 0 0 0 0 0Asian 8 6 65 0 79 5 5 19 0 29Bl/Afr Am 3 3 3 0 9 5 0 0 0 5Hisp/Lat 7 1 12 0 20 2 0 0 0 2Haw/Pac Is 2 0 0 0 2 0 0 0 0 0White 112 0 25 0 137 41 3 11 0 55Unknown 8 0 1 1 10 2 0 1 0 3TOTAL 140 10 106 1 257 55 8 31 0 94
Group IIIDoctorate Granting Departments of Mathematics
80 of 80 departments responding ( 9 with no degrees)MEN WOMEN
Citizenship CitizenshipNon-US Non-US
US Perm Temp Unk Total US Perm Temp Unk Total TOTALAm Ind/Alas 0 0 0 0 0 0 0 0 0 0Asian 0 1 31 2 34 0 8 26 1 35Bl/Afr Am 4 0 3 2 9 3 0 0 0 3Hisp/Lat 3 0 3 0 6 1 0 1 0 2Haw/Pac Is 0 0 0 0 0 0 0 1 0 1White 66 1 19 0 86 25 0 9 1 35Unknown 1 0 0 4 5 0 0 0 0 0TOTAL 74 2 56 8 140 29 8 37 2 76
Groups I, II & III CombinedDoctorate Granting Departments of Mathematics
184 of 184 departments responding ( 11 with no degrees)MEN WOMEN
Citizenship CitizenshipNon-US Non-US
US Perm Temp Unk Total US Perm Temp Unk Total TOTALAm Ind/Alas 0 0 0 0 0 0 0 0 0 0Asian 12 10 194 3 219 11 19 83 2 115Bl/Afr Am 11 4 7 2 24 8 0 0 0 8Hisp/Lat 14 2 23 0 39 4 0 6 0 10Haw/Pac Is 2 0 0 0 2 2 0 1 0 3White 386 6 114 1 507 114 6 32 2 154Unknown 11 0 3 5 19 2 0 3 0 5TOTAL 436 22 341 11 810 141 25 125 4 295
495
66124
1105
1215
216
0334
32
351
06912
81
1081422
2192
13
0
Attachment E3.1
2 of 4
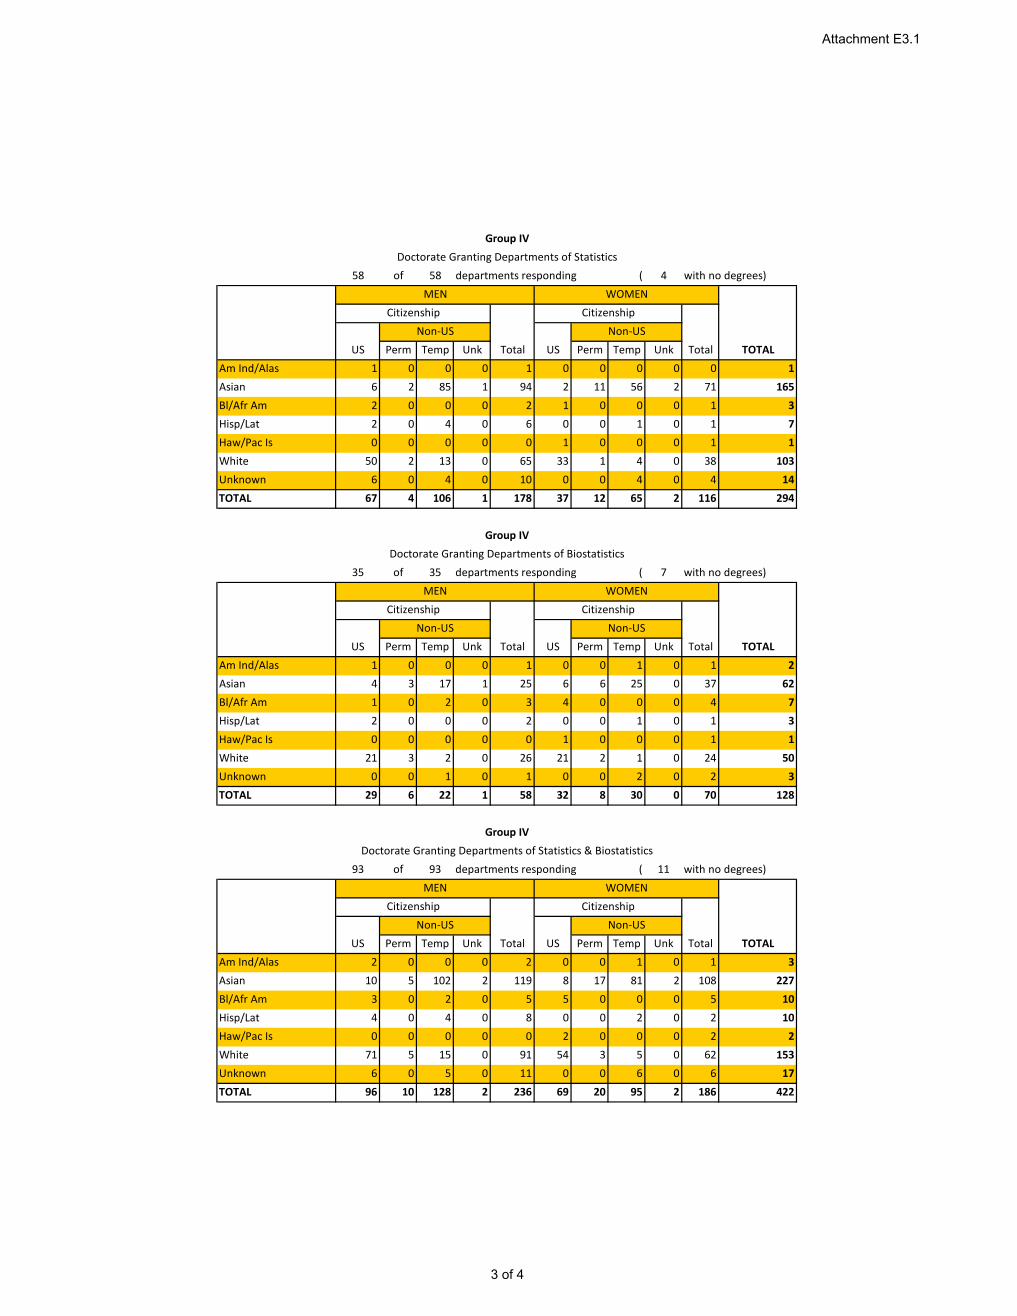
Group IVDoctorate Granting Departments of Statistics
58 of 58 departments responding ( 4 with no degrees)MEN WOMEN
Citizenship CitizenshipNon-US Non-US
US Perm Temp Unk Total US Perm Temp Unk Total TOTALAm Ind/Alas 1 0 0 0 1 0 0 0 0 0Asian 6 2 85 1 94 2 11 56 2 71Bl/Afr Am 2 0 0 0 2 1 0 0 0 1Hisp/Lat 2 0 4 0 6 0 0 1 0 1Haw/Pac Is 0 0 0 0 0 1 0 0 0 1White 50 2 13 0 65 33 1 4 0 38Unknown 6 0 4 0 10 0 0 4 0 4TOTAL 67 4 106 1 178 37 12 65 2 116
Group IVDoctorate Granting Departments of Biostatistics
35 of 35 departments responding ( 7 with no degrees)MEN WOMEN
Citizenship CitizenshipNon-US Non-US
US Perm Temp Unk Total US Perm Temp Unk Total TOTALAm Ind/Alas 1 0 0 0 1 0 0 1 0 1Asian 4 3 17 1 25 6 6 25 0 37Bl/Afr Am 1 0 2 0 3 4 0 0 0 4Hisp/Lat 2 0 0 0 2 0 0 1 0 1Haw/Pac Is 0 0 0 0 0 1 0 0 0 1White 21 3 2 0 26 21 2 1 0 24Unknown 0 0 1 0 1 0 0 2 0 2TOTAL 29 6 22 1 58 32 8 30 0 70
Group IVDoctorate Granting Departments of Statistics & Biostatistics
93 of 93 departments responding ( 11 with no degrees)MEN WOMEN
Citizenship CitizenshipNon-US Non-US
US Perm Temp Unk Total US Perm Temp Unk Total TOTALAm Ind/Alas 2 0 0 0 2 0 0 1 0 1Asian 10 5 102 2 119 8 17 81 2 108Bl/Afr Am 3 0 2 0 5 5 0 0 0 5Hisp/Lat 4 0 4 0 8 0 0 2 0 2Haw/Pac Is 0 0 0 0 0 2 0 0 0 2White 71 5 15 0 91 54 3 5 0 62Unknown 6 0 5 0 11 0 0 6 0 6TOTAL 96 10 128 2 236 69 20 95 2 186
102
15317
422
503
128
3227
10
294
262
731
165371
10314
1
Attachment E3.1
3 of 4

Group VaDoctorate Granting Departments of Applied Mathematics
22 of 22 departments responding ( 4 with no degrees)MEN WOMEN
Citizenship CitizenshipNon-US Non-US
US Perm Temp Unk Total US Perm Temp Unk Total TOTALAm Ind/Alas 0 0 1 0 1 0 0 0 0 0Asian 1 2 23 0 26 0 0 12 0 12Bl/Afr Am 0 0 2 0 2 1 0 0 0 1Hisp/Lat 2 0 1 0 3 0 0 1 0 1Haw/Pac Is 0 0 0 0 0 0 0 0 0 0White 29 0 10 0 39 14 0 4 0 18Unknown 0 0 1 0 1 0 0 0 1 1TOTAL 32 2 38 0 72 15 0 17 1 33 105
38340
572
1
Attachment E3.1
4 of 4

Gro
upse
ntrc
vd%
sent
rcvd
%se
ntrc
vd%
sent
rcvd
%se
ntrc
vd%
Gro
up I
Tota
l4
84
49
24
84
81
00
48
48
10
04
84
59
44
84
79
8G
rp I
Pub(
11
s)2
52
51
00
25
25
10
02
52
51
00
25
25
10
02
52
51
00
Grp
I Pr
i (1
2s)
23
19
83
23
23
10
02
32
31
00
23
20
87
23
22
96
Gro
up II
56
51
91
56
56
10
05
65
61
00
56
52
93
56
54
96
Gro
up II
I8
17
49
18
18
11
00
73
73
10
07
46
48
67
57
49
9G
roup
IV T
otal
92
74
80
92
89
97
89
65
73
88
70
80
88
73
83
Stat
isti
cs (
41
s)5
74
78
25
75
59
65
64
68
25
64
58
05
54
88
7Bi
osta
t (4
2s)
35
27
77
35
34
97
33
19
58
32
25
78
33
25
76
Gro
up V
a (5
1s)
22
16
73
21
21
10
02
12
11
00
21
21
10
02
12
11
00
Tota
l2
99
25
98
7%
29
82
95
99
%2
87
26
39
2%
28
72
52
88
%2
88
26
99
3%
1 -
cou
nt a
s of
Firs
t Re
port
Add
ed w
/20
10
51
CAM
DD
ropp
ed w
/20
10
52
CAIT
mer
ged
into
51
CAIT
Doc
tora
tes
Gran
ted
20
06
20
07
20
08
20
10
12
00
9
Attachment E.4.1
1 of 4

Gro
upse
ntrc
vd%
sent
rcvd
%se
ntrc
vd%
sent
rcvd
%se
ntrc
vd%
Gro
up I
Tota
l48
3165
4837
7748
3675
4839
8148
3471
Grp
I Pu
b(11
s)25
1872
2523
9225
2184
2524
9625
2392
Grp
I Pr
i (12
s)23
1357
2314
6123
1565
2315
6523
1148
Gro
up II
5647
8456
5089
5645
8056
4682
5645
80G
roup
III
7957
7281
6580
7360
8275
6384
7566
88G
roup
IV T
otal
188
5259
8754
6287
5968
Gro
up IV
(41
's)
5737
6555
3665
5642
75G
roup
IV (
42's
)231
1548
3218
5631
1755
Gro
up V
a To
tal3
1711
6517
1165
1710
5919
1053
2111
52G
roup
M17
991
5118
210
215
619
093
4918
997
5119
080
42G
roup
B10
1031
431
1029
330
3210
3130
830
1035
328
3210
0832
432
Tota
l13
8955
140
%14
1359
542
%15
0360
440
%15
0963
742
%14
8561
942
%
1 -
surv
ey n
ot s
ent
to G
roup
IV (
92 d
epts
); S
alar
y da
ta o
btai
ned
from
ASA
(A
mer
ican
Sta
tist
ical
Ass
ocia
tion
)2
- su
rvey
not
sen
t to
42O
HCI
3 -
surv
ey n
ot s
ent
to 5
1NYC
R &
51I
AUI
; the
y ha
ve n
o pr
imar
y fa
cult
y
s
urve
y no
t se
nt t
o 51
MA
HA
& 5
1TXA
U (i
nter
disc
iplin
ary
prog
ram
)A
dded
w/2
010
51CA
MD
,D
ropp
ed w
/201
052
CAIT
mer
ged
into
51C
AIT
2006
Fac
ulty
Sal
arie
s
2010
2009
2008
2007
Attachment E.4.1
2 of 4
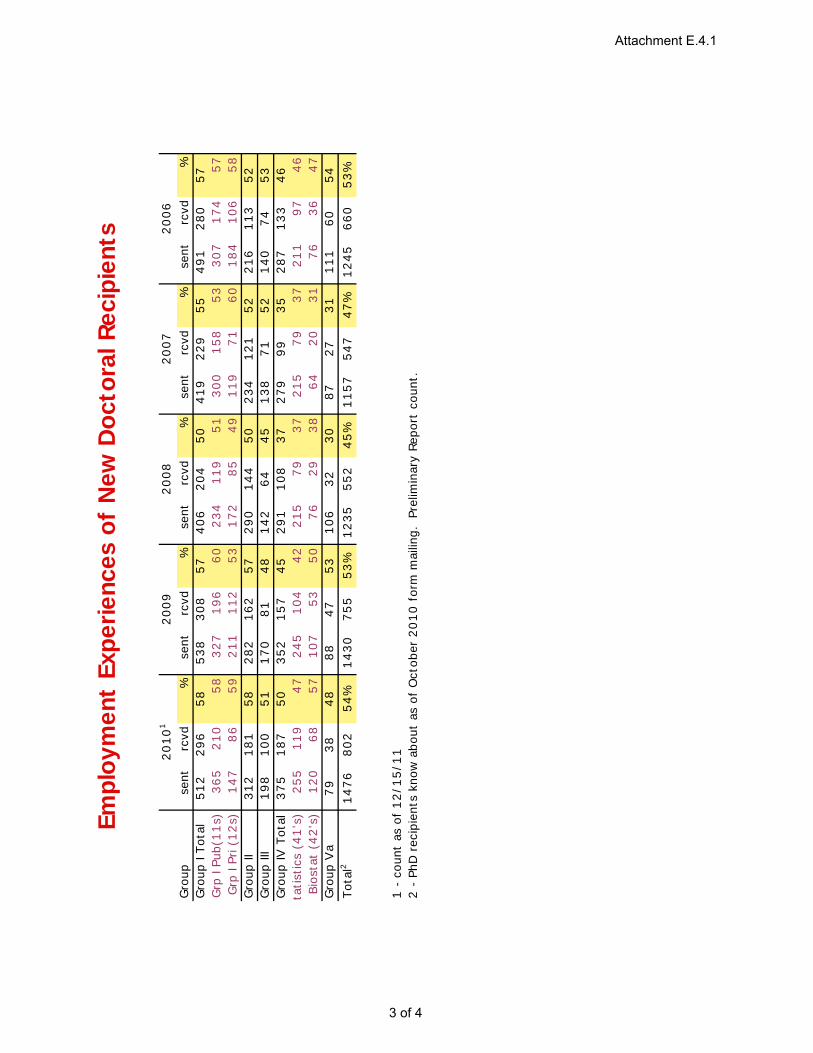
Gro
upse
ntrc
vd%
sent
rcvd
%se
ntrc
vd%
sent
rcvd
%se
ntrc
vd%
Gro
up I
Tota
l5
12
29
65
85
38
30
85
74
06
20
45
04
19
22
95
54
91
28
05
7G
rp I
Pub(
11
s)3
65
21
05
83
27
19
66
02
34
11
95
13
00
15
85
33
07
17
45
7G
rp I
Pri (
12
s)1
47
86
59
21
11
12
53
17
28
54
91
19
71
60
18
41
06
58
Gro
up II
31
21
81
58
28
21
62
57
29
01
44
50
23
41
21
52
21
61
13
52
Gro
up II
I1
98
10
05
11
70
81
48
14
26
44
51
38
71
52
14
07
45
3G
roup
IV T
otal
37
51
87
50
35
21
57
45
29
11
08
37
27
99
93
52
87
13
34
6St
atis
tics
(4
1's
)2
55
11
94
72
45
10
44
22
15
79
37
21
57
93
72
11
97
46
Bios
tat
(42
's)
12
06
85
71
07
53
50
76
29
38
64
20
31
76
36
47
Gro
up V
a7
93
84
88
84
75
31
06
32
30
87
27
31
11
16
05
4To
tal2
14
76
80
25
4%
14
30
75
55
3%
12
35
55
24
5%
11
57
54
74
7%
12
45
66
05
3%
1 -
cou
nt a
s of
12
/15
/11
2 -
PhD
rec
ipie
nts
know
abo
ut a
s of
Oct
ober
20
10
for
m m
ailin
g.
Prel
imin
ary
Repo
rt c
ount
.
Empl
oym
ent
Expe
rienc
es o
f N
ew D
octo
ral R
ecip
ient
s
20
09
20
08
20
07
20
06
20
10
1
Attachment E.4.1
3 of 4
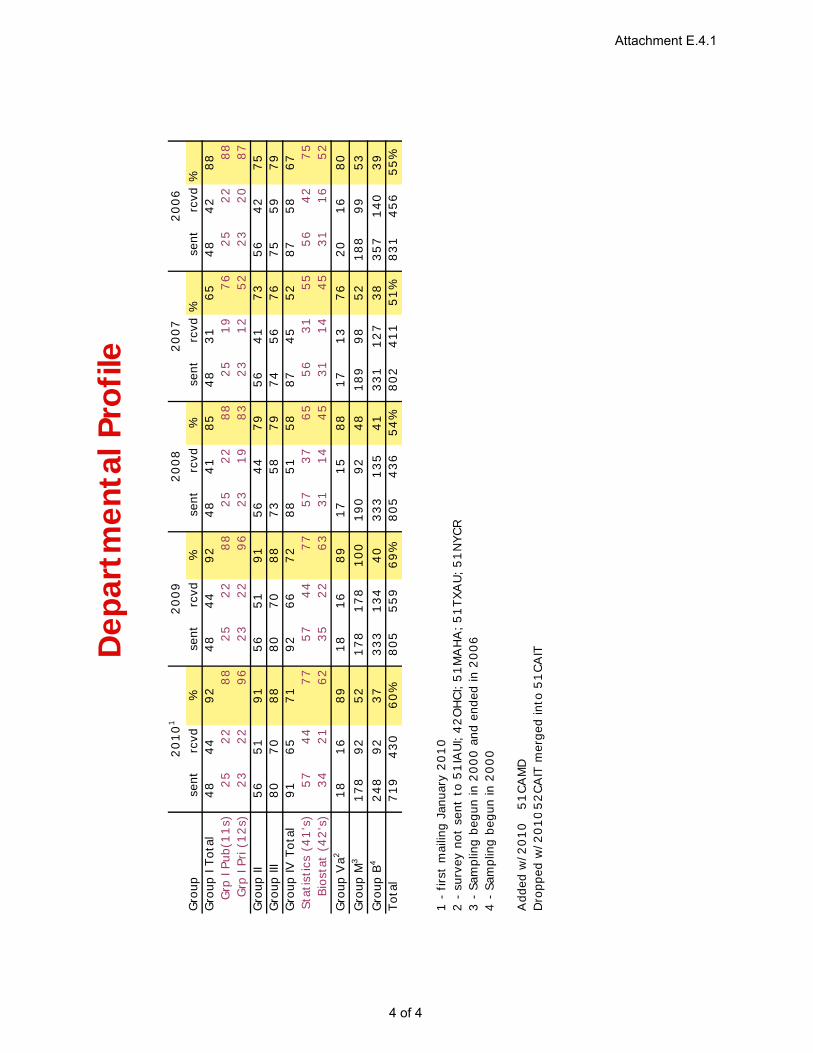
Gro
upse
ntrc
vd%
sent
rcvd
%se
ntrc
vd%
sent
rcvd
%se
ntrc
vd%
Gro
up I
Tota
l4
84
49
24
84
49
24
84
18
54
83
16
54
84
28
8G
rp I
Pub(
11
s)2
52
28
82
52
28
82
52
28
82
51
97
62
52
28
8G
rp I
Pri (
12
s)2
32
29
62
32
29
62
31
98
32
31
25
22
32
08
7G
roup
II5
65
19
15
65
19
15
64
47
95
64
17
35
64
27
5G
roup
III
80
70
88
80
70
88
73
58
79
74
56
76
75
59
79
Gro
up IV
Tot
al9
16
57
19
26
67
28
85
15
88
74
55
28
75
86
7St
atis
tics
(4
1's
)5
74
47
75
74
47
75
73
76
55
63
15
55
64
27
5Bi
osta
t (4
2's
)3
42
16
23
52
26
33
11
44
53
11
44
53
11
65
2G
roup
Va2
18
16
89
18
16
89
17
15
88
17
13
76
20
16
80
Gro
up M
31
78
92
52
17
81
78
10
01
90
92
48
18
99
85
21
88
99
53
Gro
up B
42
48
92
37
33
31
34
40
33
31
35
41
33
11
27
38
35
71
40
39
Tota
l7
19
43
06
0%
80
55
59
69
%8
05
43
65
4%
80
24
11
51
%8
31
45
65
5%
1 -
firs
t m
ailin
g Ja
nuar
y 2
01
02
- s
urve
y no
t se
nt t
o 5
1IA
UI;
42
OH
CI; 5
1M
AH
A; 5
1TX
AU
; 51
NYC
R3
- S
ampl
ing
begu
n in
20
00
and
end
ed in
20
06
4 -
Sam
plin
g be
gun
in 2
00
0
Add
ed w
/20
10
51
CAM
DD
ropp
ed w
/20
10
52
CAIT
mer
ged
into
51
CAIT
D
epar
tmen
tal P
rofil
e
20
10
12
00
92
00
82
00
72
00
6
Attachment E.4.1
4 of 4

Not e: All f igures are project ed values.
Fall 2010 Fall 2010
wit h PhD no PhD wit h PhD no PhD
Full-t ime M F M F Full-t ime M F M F
Tenured 997 93 1 0 502 43 1 0
Unt enured, t enure-t rack 115 42 0 0 65 17 0 0
Post doc appoint ment s 258 65 0 0 222 61 0 0
Ot her non-t enure-t rack 99 40 29 50 92 30 3 1
Part -t ime 32 20 35 18 Part -t ime 17 4 5 0
Fall 2010 Fall 2010
wit h PhD no PhD wit h PhD no PhD
Full-t ime M F M F Full-t ime M F M F
Tenured 1364 161 2 3 1168 209 6 3
Unt enured, t enure-t rack 216 77 1 1 296 128 6 0
Post doc appoint ment s 197 68 0 0 71 23 0 0
Ot her non-t enure-t rack 114 103 98 162 136 84 164 221
Part -t ime 90 44 129 108 Part -t ime 124 39 235 190
Fall 2010 Fall 2010
Full-t ime M F M F Full-t ime M F M F
Tenured 746 192 1 0 176 27 0 0
234 166 2 0 39 9 10 2
92 41 0 0 54 12 2 0
163 129 42 51 29 12 8 9
Part -t ime 127 36 15 15 Part -t ime 17 1 5 6
Fall 2010 Fall 2010
Full-t ime M F M F Full-t ime M F M F
Tenured 1795 572 41 26 4346 1611 306 241
484 273 5 12 1248 607 15 130
10 6 0 1 6 0 0 0
135 84 332 437 396 118 709 776
Part -t ime 236 101 783 661 Part -t ime 404 209 1266 1289
Full-t ime t eaching courses
Out side Mat h Sci
Comp Sci Only
Tot al only
1102
484
2010 DEPARTMENTAL PROFILE REPORT
FACULTY SIZE SUMMARY
wit h PhD no PhD
Ot her non-t enure-t rack Ot her non-t enure-t rack
GROUP IV - 92 Departments GROUP Va - 21 Departments16 ( inc. 0 imput ed) / 18 project ed
GROUP II - 56 Departments56 ( inc. 5 imput ed) / 56 project ed
GROUP III - 80 Departments77 ( inc. 7 imput ed) / 80 project ed
GROUP I (Public) - 25 Departments24 ( inc. 2 imput ed) / 25 project ed
80 ( inc. 15 imput ed) / 91 project ed
Tenured
Unt enured, t enure-t rack
Post doc appoint ment s
Ot her non-t enure-t rack
Unt enured, t enure-t rack Unt enured, t enure-t rack
Post doc appoint ment s Post doc appoint ment s
wit h PhD no PhD
Tenured
Tenured
Unt enured, t enure-t rack
Post doc appoint ment s
Ot her non-t enure-t rack
GROUP I (Private) - 23 Departments23 ( inc. 1 imput ed) / 23 project ed
Ot her non-t enure-t rack Ot her non-t enure-t rack
GROUP B - 1014 Departments/ 276 Depts Sampled151 ( inc. 34 imput ed) / 1014 project ed
GROUP M - 178 Departments94 ( inc. 39 imput ed) / 178 project ed
wit h PhD no PhD
Tenured
Unt enured, t enure-t rack
wit h PhD no PhD
Unt enured, t enure-t rack
Post doc appoint ment s Post doc appoint ment s
Attachment E5.1
1 of 5
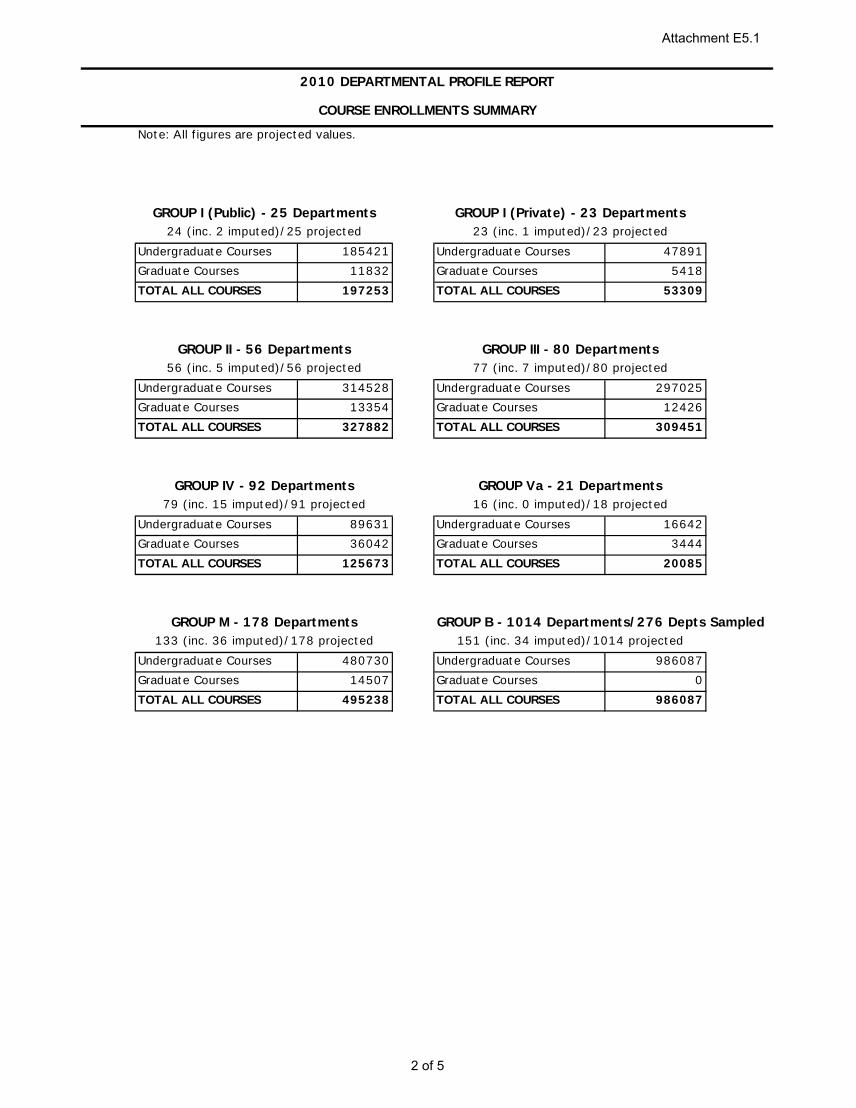
Not e: All f igures are project ed values.
Undergraduat e Courses 185421 Undergraduat e Courses 47891Graduat e Courses 11832 Graduat e Courses 5418TOTAL ALL COURSES 197253 TOTAL ALL COURSES 53309
Undergraduat e Courses 314528 Undergraduat e Courses 297025Graduat e Courses 13354 Graduat e Courses 12426TOTAL ALL COURSES 327882 TOTAL ALL COURSES 309451
Undergraduat e Courses 89631 Undergraduat e Courses 16642Graduat e Courses 36042 Graduat e Courses 3444TOTAL ALL COURSES 125673 TOTAL ALL COURSES 20085
GROUP B - 1014 Departments/ 276 Depts Sampled
Undergraduat e Courses 480730 Undergraduat e Courses 986087Graduat e Courses 14507 Graduat e Courses 0TOTAL ALL COURSES 495238 TOTAL ALL COURSES 986087
GROUP II - 56 Departments
GROUP M - 178 Departments133 ( inc. 36 imput ed) / 178 project ed 151 ( inc. 34 imput ed) / 1014 project ed
2010 DEPARTMENTAL PROFILE REPORT
COURSE ENROLLMENTS SUMMARY
GROUP IV - 92 Departments79 ( inc. 15 imput ed) / 91 project ed
56 ( inc. 5 imput ed) / 56 project edGROUP III - 80 Departments
77 ( inc. 7 imput ed) / 80 project ed
GROUP Va - 21 Departments16 ( inc. 0 imput ed) / 18 project ed
GROUP I (Public) - 25 Departments24 ( inc. 2 imput ed) / 25 project ed
GROUP I (Private) - 23 Departments23 ( inc. 1 imput ed) / 23 project ed
Attachment E5.1
2 of 5
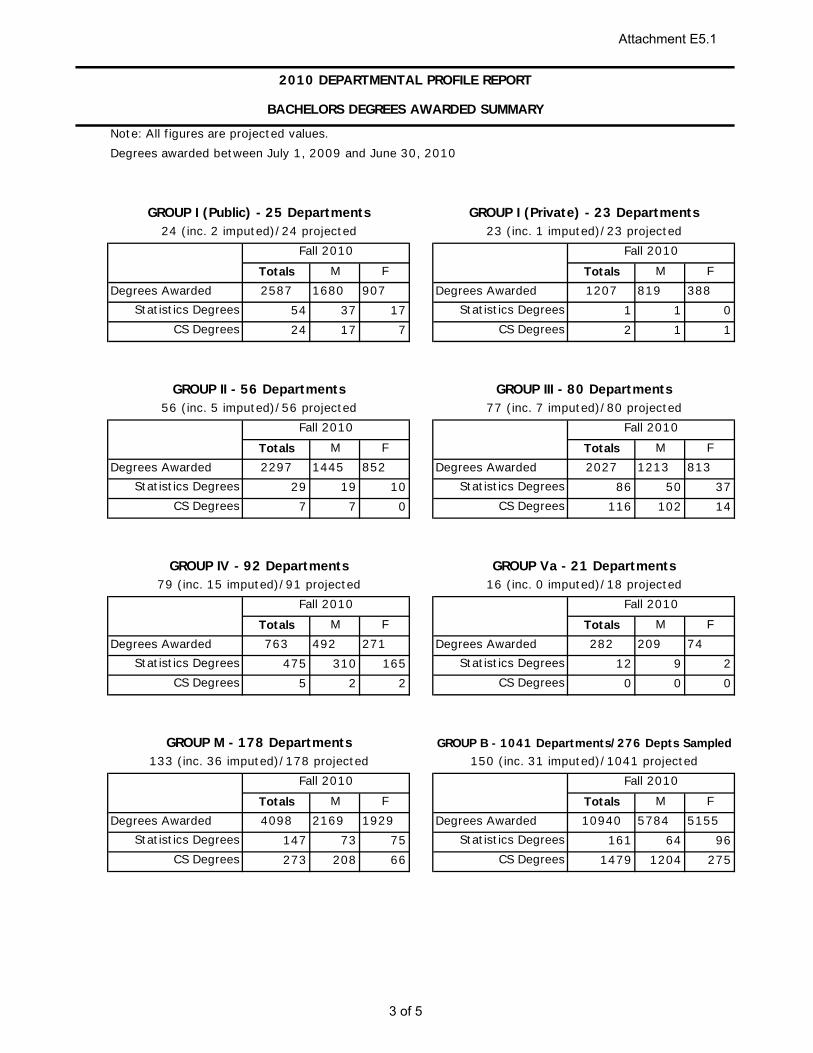
Not e: All f igures are project ed values.Degrees awarded bet ween July 1 , 2009 and June 30, 2010
Totals M F Totals M FDegrees Awarded 2587 1680 907 Degrees Awarded 1207 819 388
54 37 17 1 1 024 17 7 2 1 1
Totals M F Totals M FDegrees Awarded 2297 1445 852 Degrees Awarded 2027 1213 813
29 19 10 86 50 377 7 0 116 102 14
Totals M F Totals M FDegrees Awarded 763 492 271 Degrees Awarded 282 209 74
475 310 165 12 9 25 2 2 0 0 0
Totals M F Totals M FDegrees Awarded 4098 2169 1929 Degrees Awarded 10940 5784 5155
147 73 75 161 64 96273 208 66 1479 1204 275
GROUP I (Public) - 25 Departments GROUP I (Private) - 23 Departments24 ( inc. 2 imput ed) / 24 project ed 23 ( inc. 1 imput ed) / 23 project ed
2010 DEPARTMENTAL PROFILE REPORT
BACHELORS DEGREES AWARDED SUMMARY
Fall 2010 Fall 2010
St at ist ics Degrees St at ist ics DegreesCS Degrees CS Degrees
GROUP II - 56 Departments GROUP III - 80 Departments56 ( inc. 5 imput ed) / 56 project ed 77 ( inc. 7 imput ed) / 80 project ed
Fall 2010 Fall 2010
St at ist ics Degrees St at ist ics DegreesCS Degrees CS Degrees
GROUP IV - 92 Departments GROUP Va - 21 Departments79 ( inc. 15 imput ed) / 91 project ed 16 ( inc. 0 imput ed) / 18 project ed
Fall 2010 Fall 2010
St at ist ics Degrees St at ist ics DegreesCS Degrees CS Degrees
GROUP M - 178 Departments GROUP B - 1041 Departments/ 276 Depts Sampled133 ( inc. 36 imput ed) / 178 project ed 150 ( inc. 31 imput ed) / 1041 project ed
Fall 2010 Fall 2010
St at ist ics Degrees St at ist ics DegreesCS Degrees CS Degrees
Attachment E5.1
3 of 5

Not e: All f igures are project ed values.Degrees awarded bet ween July 1 , 2009 and June 30, 2010
Totals M F Totals M FDegrees Awarded 395 270 125 Degrees Awarded 438 333 105
31 17 13 10 8 22 2 0 0 0 0
Totals M F Totals M FDegrees Awarded 716 438 278 Degrees Awarded 758 463 295
55 30 25 157 93 640 0 0 62 46 16
Totals M F Totals M FDegrees Awarded 1252 661 591 Degrees Awarded 209 146 62
1077 570 507 15 12 20 0 0 0 0 0
Totals M FDegrees Awarded 1750 892 858
189 87 10298 47 51
CS Degrees
St at ist ics DegreesCS Degrees
St at ist ics DegreesCS Degrees
76 ( inc. 7 imput ed) / 80 project ed
15 ( inc. 0 imput ed) / 17 project ed
Fall 2010
GROUP Va - 21 Departments
CS Degrees
GROUP II - 56 Departments GROUP III - 80 Departments
GROUP IV - 92 Departments
CS Degrees
Fall 2010
GROUP M - 178 Departments134 ( inc. 35 imput ed) / 178 project ed
Fall 2010
56 ( inc. 5 imput ed) / 56 project ed
St at ist ics Degrees
78 ( inc. 14 imput ed) / 90 project ed
CS Degrees
St at ist ics DegreesCS Degrees
St at ist ics Degrees
Fall 2010
Fall 2010
GROUP I (Public) - 25 Departments GROUP I (Private) - 23 Departments
2010 DEPARTMENTAL PROFILE REPORT
MASTERS DEGREES AWARDED SUMMARY
St at ist ics Degrees St at ist ics Degrees
22 ( inc. 2 imput ed) / 24 project ed 21 ( inc. 1 imput ed) / 23 project edFall 2010Fall 2010
Attachment E5.1
4 of 5

Not e: All f igures are project ed values. URM = Underrepresent ed Minorit ies
M F M F M F M F M FFull-t ime grad st udent s 1330 374 112 37 953 317 48 14 2284 691
285 92 26 5 174 80 3 0 459 173Part -t ime grad st udent s 72 52 2 2 12 11 2 5 84 63
M F M F M F M F M FFull-t ime grad st udent s 677 163 23 9 787 239 21 26 1464 402
143 32 1 0 237 78 3 4 380 110Part -t ime grad st udent s 143 24 5 1 58 16 12 9 201 40
M F M F M F M F M FFull-t ime grad st udent s 1670 702 168 85 882 473 32 30 2552 1175
439 224 37 18 219 102 8 15 658 326Part -t ime grad st udent s 229 160 32 21 46 32 8 6 275 191
M F M F M F M F M FFull-t ime grad st udent s 1331 739 127 90 848 494 81 46 2179 1233
356 142 24 20 217 139 10 7 573 281Part -t ime grad st udent s 401 273 34 23 103 69 20 14 505 342
M F M F M F M F M FFull-t ime grad st udent s 1231 813 105 118 1577 1443 78 97 2808 2256
352 239 29 21 487 454 13 34 839 693Part -t ime grad st udent s 271 206 17 15 126 132 25 18 397 338
M F M F M F M F M FFull-t ime grad st udent s 376 110 44 22 355 227 17 10 731 337
96 36 18 12 128 94 12 6 224 130Part -t ime grad st udent s 86 19 5 2 20 7 8 0 107 26
M F M F M F M F M FFull-t ime grad st udent s 1340 1066 142 165 457 250 8 13 1769 1292
587 376 40 44 191 102 2 3 785 481Part -t ime grad st udent s 879 822 93 99 57 52 6 9 936 873
Cit izenship
Above who are 1st -year
Tot al Perm Visa
US
GROUP III - 80 Departments75 ( inc. 7 imput ed) / 80 project ed
78 ( inc. 15 imput ed) / 91 project ed
Cit izenship
Above who are 1st -year
Cit izenship
GROUP II - 56 Departments
Cit izenship56 ( inc. 5 imput ed) / 56 project ed
Above who are 1st -year
Perm Visa
US Non-USURM Tot al Perm VisaTot al
Cit izenship
GROUP Va - 21 Departments15 ( inc. 0 imput ed) / 18 project ed
Cit izenship
Above who are 1st -year
TOTAL
TOTAL
TOTAL
TOTAL
2010 DEPARTMENTAL PROFILE REPORT
FALL 2010 - GRADUATE STUDENTS SUMMARY
Tot al
Tot al
Tot al Perm Visa
TOTAL
TOTAL
Above who are 1st -year
GROUP I (Private) - 23 Departments22 ( inc. 1 imput ed) / 23 project ed
Above who are 1st -year
US Non-USURM Tot al
GROUP I (Public) - 25 Departments23 ( inc. 1 imput ed) / 25 project ed
Cit izenship
GROUP M -178 Departments109 ( inc. 33 imput ed) / 178 project ed
US Non-USURM Tot al
Perm Visa
URM Tot al Perm VisaTOTALNon-USUS
Above who are 1st -year
GROUP VI - 92 Departments
Tot al
Tot al
Tot al
US Non-USURM Tot al Perm Visa
US Non-USURM
Non-USURM Tot al
Attachment E5.1
5 of 5

2011 ANNUAL REPORT OF THE AMS-ASA-IMS-MAA-SIAM DATA COMMITTEE
Prepared by Richard Cleary, Chair, AMS-ASA-IMS-MAA-SIAM Data Committee, Professor in the Department of Mathematical Sciences, Bentley University, Waltham, MA,
[email protected] December 31, 2011
The Annual Survey Data Committee guides the collection and dissemination of data on matters of concern to the mathematical sciences community. The committee held its annual meeting during the Joint Mathematics Meetings in New Orleans, Louisiana in January 2011. The committee discussed data gathered and published during the previous year and made recommendations on data to be gathered in 2011. Staff at AMS in Providence, under the direction of Ellen Maycock, Associate Executive Director for Meetings and Professional Services, carry out the annual gathering and analysis of data and the writing of the reports jointly with the committee chair. AMS staff members involved in this work during 2011 included James Maxwell, Associate Executive Director for Special Projects, and Colleen Rose, AMS Survey Analyst. Based on data gathered in questionnaires sent to departments of mathematical sciences in the U.S. and to new doctoral recipients earning degrees between July 1, 2009–June 30, 2010 from departments with doctoral programs, four reports were published in the Notices of the AMS*. The 2011 Assistantships and Graduate Fellowships in the Mathematical Sciences were also published by the American Mathematical Society with advice from the committee. Staff at AMS handled seven requests for specialized reports drawn from the Annual Survey Data.
Members of the committee for 2011 and the organization they represent are given below. Terms expire on January 31 of the listed year. Pam Arroway ASA 2013 Ellen Kirkman MAA 2014 Richard Cleary MAA 2015 Peter March AMS 2014 Steven Dunbar AMS 2013 James Maxwell Ex officio Susan Gellar MAA 2015 David R. Morrison AMS 2014 Boris Hasselblatt AMS 2013 Bart Ng SIAM 2013 Abbe Herzig AMS 2012
* 2011 Annual Survey of the Mathematical Sciences (AMS-ASA-IMS-MAA) edited by Richard Cleary, James W. Maxwell, and Colleen A. Rose:
• Preliminary Report on the 2009-2010 New Doctoral Recipients, Notices of the AMS (2011), Volume 58, Number 2, pp. 291-299
• Faculty Salary Survey, Notices of the AMS (2011), Volume 58, Number 3, pp. 438-443. • Report on Academic Recruitment and Hiring Survey, Notices of the AMS (2011), Volume 58, Number 5,
pp. 693-696 • Report on the 2009-2010 Survey of New Doctoral Recipients and Starting Salary of New Doctoral
Recipients, Notices of the AMS (2011), Volume 58, Number 7, pp. 944-954 • Departmental Profile Report: Faculty Profile, Enrollment and Undergraduate Majors Profile and
Graduate Student Profile, Notices of the AMS (2012), Volume 59, Number 2, pp. 291-300 Attachments:
Current Data Gathering of the AMS-ASA-IMS-MAA Data Committee, Revised Dec 2011
Attachment E6.1
1 of 2

CURRENT DATA GATHERING OF THE AMS-ASA-IMS-MAA-SIAM DATA COMMITTEE December 2011
The AMS-ASA-IMS-MAA-SIAM Data Committee gives advice to staff at AMS about annual data gathering from U.S. departments in the mathematical sciences. This data gathering was started by AMS in 1957 and has continued uninterrupted since that time. The MAA joined this effort in 1989 and in more recent times IMS, ASA and SIAM have become sponsors. Staff at the AMS, under the Associate Executive Director for Meetings and Professional Services, carries out the survey work. The Chair of the Data Committee and appropriate personnel at AMS write four reports each year drawn from the annual survey that are published in Notices of the AMS. Preliminary Report on the 2010-2011 New Doctoral Recipients. Each calendar year the data gathering begins in April. Doctoral granting departments in the Mathematical Sciences in the U.S. are asked to report a variety of information about their new doctoral recipients from July 1 the previous year through June 30 of the current year. The departments are asked for the names of their new doctoral recipients, dissertation titles, addresses, citizenship, current employment status, etc. Information gathered for this report is typically published in the February issue of the Notices of the AMS
2010-2011 Faculty Salaries Report. Each June a questionnaire is sent to Mathematical Sciences departments in all 4-year colleges and universities in the U.S. asking them to provide salary information for all tenured or tenure-track faculty in their department for the upcoming academic year. This information is reported by group (see group definitions below) and by rank. Information gathered for this report is typically published in the March issue of the Notices of the AMS.
The 2010-2011 Doctoral Recipients and Starting Salary Survey of the 2010-2011 Doctoral Recipients. Each October, further information is gathered about new doctoral recipients. Using the names and addresses of new doctoral recipients provided earlier by departments granting the degrees, a questionnaire is sent to each new doctoral recipient asking for their current employment status, salary, gender, etc. This information, combined with the preliminary data, provides a more comprehensive look the new doctoral recipients as well as to give information about their starting salaries. This information is typically published in the August issue of Notices of the AMS.
The 2009-2010 Departmental Profile Report: Faculty Profile, Enrollment and Degrees Awarded Profile, Graduate Student Profile. In January, another questionnaire is sent to all departments of Mathematical Sciences in Groups I, II, III, IV, V and M, and to a stratified random sample of departments in Group B. It asks them for details about number and type of faculty, enrollments in courses by broad categories, number and type of graduate students in departments with graduate programs, etc. Information from this questionnaire provides a departmental profile for each department. The combined results are published as the 2009-2010 Departmental Profile Report in the November issue of Notices of the AMS.
Group definitions. For purposes of these surveys, the departments of Mathematical Sciences in the U.S. are broken into the groups, and whenever it makes sense, results are given for each of these groups in the reports mentioned earlier. For example, Groups I, II, and III are doctoral granting mathematics departments grouped according to their ranking in the 1995 NRC ranking of doctoral programs in the U.S. For more details see www.ams.org/annual-survey/groups_des.
Other activities. The Annual Survey Data Committee also offers guidance on the data gathered and published annually as a guidebook for prospective graduate students in the Mathematical Sciences. This guidebook is titled Assistantships and Graduate Fellowships in the Mathematical Sciences.
At times the committee advises other groups contemplating gathering data from departments of Mathematical Sciences. This may include informing them that such data is already available and steering them to it. When asked, the committee makes suggestions on questionnaires that other groups are planning to use to gather data.
From time to time departments ask for salary information for a peer group of their department. The staff at AMS provides this information whenever an appropriate peer group is available and the confidentiality of individual department responses can be assured. The committee currently holds a half-day meeting at the Joint Mathematics Meetings in January each year.
Attachment E6.1
2 of 2