Embed Size (px)
Citation preview

AMF1 MEASUREMENTS AT
NAINITAL AND RELATED
RESEARCH AT ARIES
Manish Naja
ASR Fall Working Group meeting[12-16 Sep 2011]
Aryabhatta Research Institute of Observational Sciences, Nainital
AMF1 deployment is under GVAX program, funded by ARM, DOEPI – Rao Kotamarthi, CO-PIs – SK Satheesh, R. Sagar

DirectorRam Sagar
ScientistsP. P.ant, M. Naja, N. Singh, Phani Kumar, U. C. Dumka, Vimlesh Kumar
EngineersS. Bhattacharjee, C. Prakash, Ashish Kumar
PDFS. Sahai
Ph D studentsRajesh Kumar, N. Ojha, T. Sarangi, H. Joshi, K. Shukla, P. Bhardwaj, R Solanki

~200 km2000 m
4000 m
Observation Sites:
Devasthal – 29.4N, 79.7E, ~ 2450 m
Nainital – 29.4N, 79.5E, ~ 1958 m
Pantnagar – 29.0N , 79.5E, ~ 231 m
Dehradun – 30.3N, 78E, ~700 m
China
India
Nepal
China
Nepal
India
Himalayan range4 - 8 km
IGP – 1000-more persons/km2
Nainital – 25-100 persons/km2
Population density
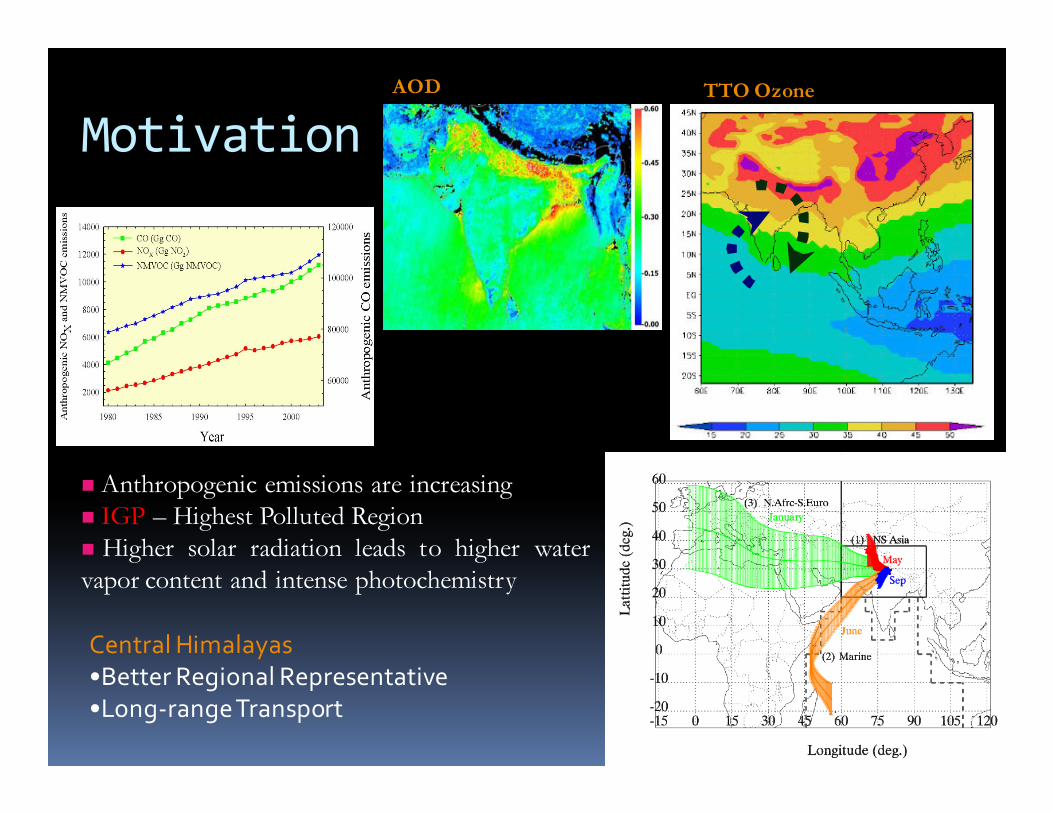
Motivation
Central Himalayas
•Better Regional Representative
•Long-range Transport
� Anthropogenic emissions are increasing
� IGP – Highest Polluted Region
� Higher solar radiation leads to higher water
vapor content and intense photochemistry
AOD TTO Ozone

To Nainital City
ARIES 29.36N, 79.45 E, 1958 m

� Aerosols (Since January 2002)
� Trace Gases (Since September 2006)
� Lidar
� ST Radar (upcoming)
Atmospheric Science Group
– AOD (MWR, Microtops & AERONET)
– Black Carbon– Aerosols number concentrations
– Particulate Matter
– Pollutants (Ozone, CO, NO, NOy, CH4 NMHCs , SO2)
– Greenhouse gases (CO2, N2O and SF6)
– Aerosols

Important Results
Lower value of AOD, particularly in winter. (JGR)
Aerosols RF is much lower at Nainital (JGR)
Air back-trajectories during dust episode period
50 60 70 80 90 100
Latitude (deg)
10
20
30
A r a b i a n S e a
*
[a]
Thar Desert Nainital
INDIA
PAKISTAN
Long-range transport from Thar Desert (GRL)Comparison
with MISR

Black Carbon at Nainital & Pantnagar
Pantnagar
Nainital
BC levels at Pantnagar– higher by 5-6 times
Diurnal changes at Nainital-Pantnagar

Ozone levels show clear
daytime peak at Pantnagar
and Dehradun in contrast
with Nainital
Nighttime ozone levels are lower at Pantnagar
(…… Ozone titration chemistry is stronger)
Diurnal Variations at Nainital, Pantnagar and Dehradun

Surface ozone at Pantnagar and NainitalOzone at Pantnagar (ppbv)
Ozone at Nainital
Daytime: the atmospheres of NTL and
PNT gets coupled due to boundary
layer evolution.

Surface Ozone Seasonality at Nainital
Jan Feb Mar Apr May Jun Jul Aug Sep Oct Nov Dec0
5
10
15
20Stratospheric Ozone
European Emissions
South Asia Emissions
[b]Average Ozone (ppbv)
20
30
40
50
60
70
80
Average Ozone (Observations)
Nainital_2000m (Model)
Nainital_surface (Model)
[a]
� Differences in model and observations may be due to coarser resolution, emissions
uncertainties and errors in meteorology of global model.
� Model and trajectory based estimates of contributions from downward transport is
about 4-6 ppbv
[JGR 2010]
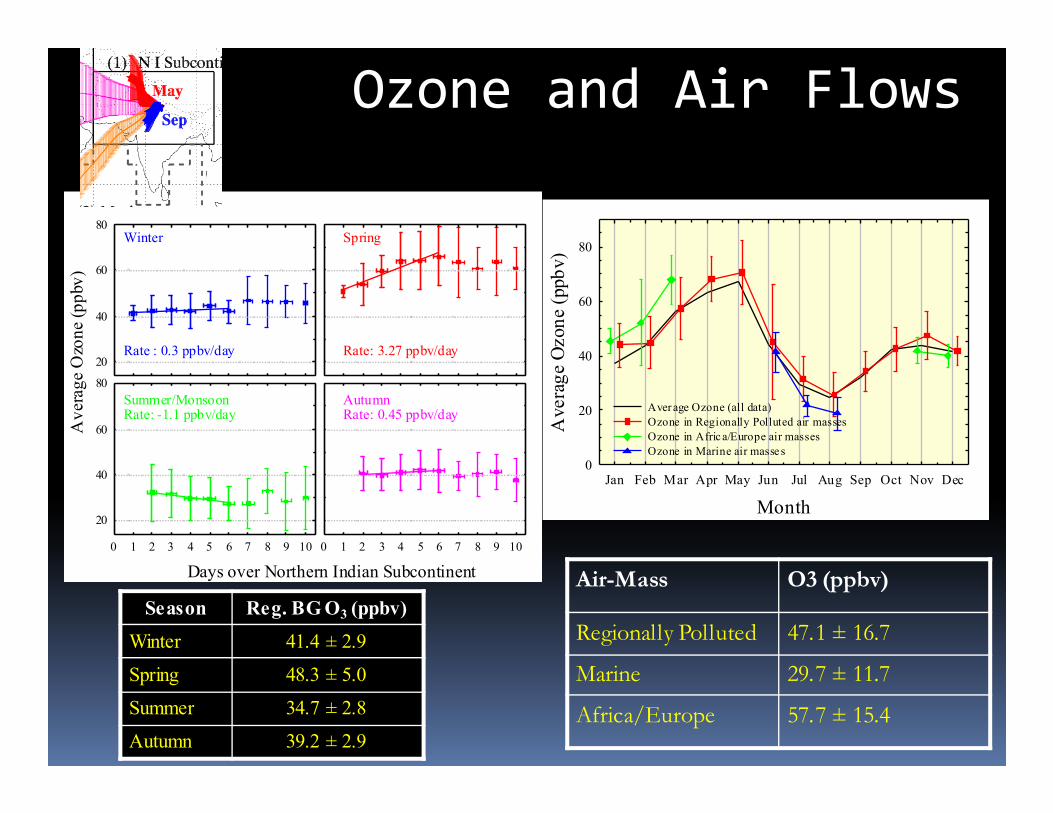
Ozone and Air Flows
0 1 2 3 4 5 6 7 8 9 10
Days over Northern Indian Subcontinent
0 1 2 3 4 5 6 7 8 9 10
Average Ozone (ppbv)
20
40
60
80
20
40
60
80Winter Spring
Summer/Monsoon Autumn
Rate : 0.3 ppbv/day Rate: 3.27 ppbv/day
Rate: -1.1 ppbv/day Rate: 0.45 ppbv/day
Season Reg. BG O3 (ppbv)
Winter 41.4 ± 2.9
Spring 48.3 ± 5.0
Summer 34.7 ± 2.8
Autumn 39.2 ± 2.9
Month
Jan Feb Mar Apr May Jun Jul Aug Sep Oct Nov Dec
Average Ozone (ppbv)
0
20
40
60
80
Average Ozone (all data)
Ozone in Regionally Polluted air masses
Ozone in Afric a/Europe air masses
Ozone in Marine air masse s
Air-Mass O3 (ppbv)
Regionally Polluted 47.1 ± 16.7
Marine 29.7 ± 11.7
Africa/Europe 57.7 ± 15.4

Pantnagar daytime
Nainital
�Ozone seasonality is characterized by springtime maxima (55-60 ppbv) and summer/
monsoon minima (10-15 ppbv).
�Mixing depth at Pantnagar (from HYSPLIT) also shows maxima (3 to 5 km) during spring.
�Interestingly, daytime ozone levels at Pantnagar show similar variations as at Nainital (Role
of Mixing)
Seasonal variations in surface ozone at Pantnagar
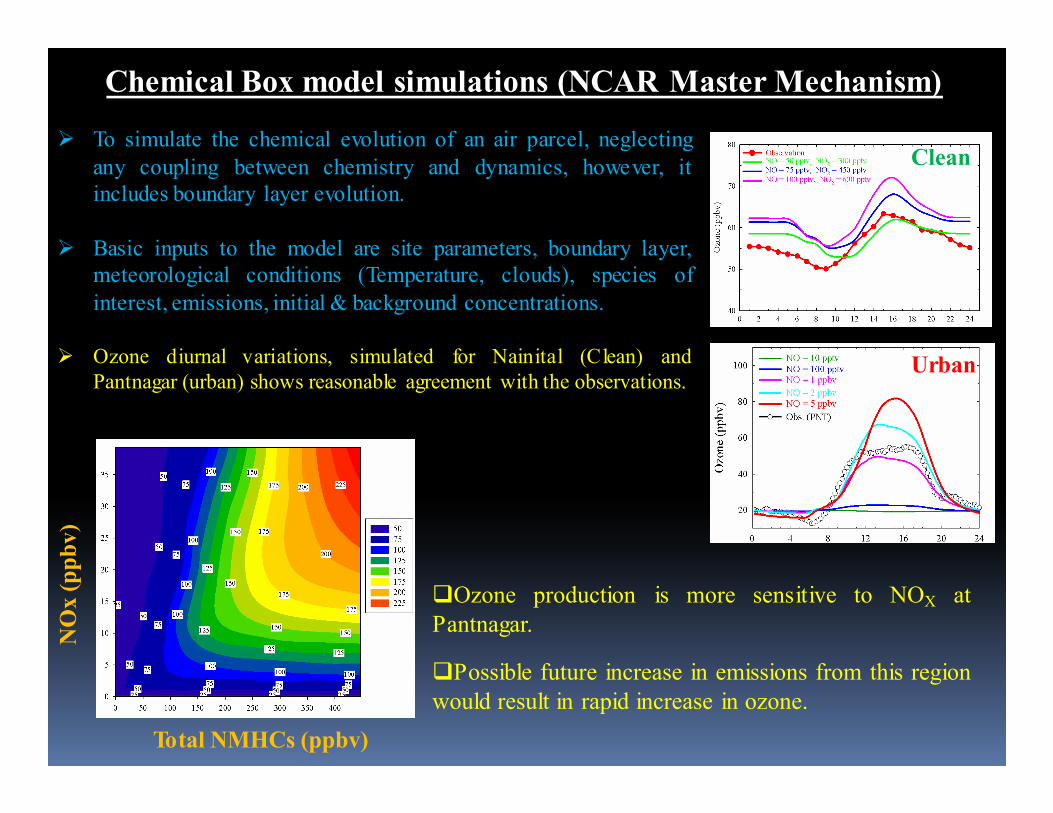
Chemical Box model simulations (NCAR Master Mechanism)
� To simulate the chemical evolution of an air parcel, neglecting
any coupling between chemistry and dynamics, however, it
includes boundary layer evolution.
� Basic inputs to the model are site parameters, boundary layer,
meteorological conditions (Temperature, clouds), species of
interest, emissions, initial & background concentrations.
� Ozone diurnal variations, simulated for Nainital (Clean) and
Pantnagar (urban) shows reasonable agreement with the observations.
Clean
Urban
NOx(ppbv)
Total NMHCs (ppbv)
�Ozone production is more sensitive to NOX at
Pantnagar.
�Possible future increase in emissions from this region
would result in rapid increase in ozone.

0
200
400
600
800 2007
Fire Counts
0
200
400
600
800
Month
Mar Apr May0
200
400
600
800
2009
2008
Biomass BurningBiomass Burning
Max fire activity
(15 April – 30 May)
M o n th
J an F eb M ar A p r M a y J u n J ul A u g Se p O c t N o v D ec
Fire Counts
0
1 0 0
2 0 0
3 0 0
4 0 0
5 0 0
6 0 0
7 0 0
8 0 0
M O D IS (2 0 0 8 )
Fire over the Northern India
Enhancement in BC and Ozone
Enhancement in Radiative forcing
[JGR 2011]

Temperature
Vertical distribution
of Temperature,
Relative Humidity
and Ozone at
ARIES, Nainital.

Occasionally very high
wind speed (50 m/s) are
observed in middle and
upper troposphere. (may
be associated with tropical
Jets)
Wind Speed
�Elevated ozone is noticed in the middle and upper troposphere.
�Signatures of Stratospheric intrusions are seen in preliminary analysis.
Ozone
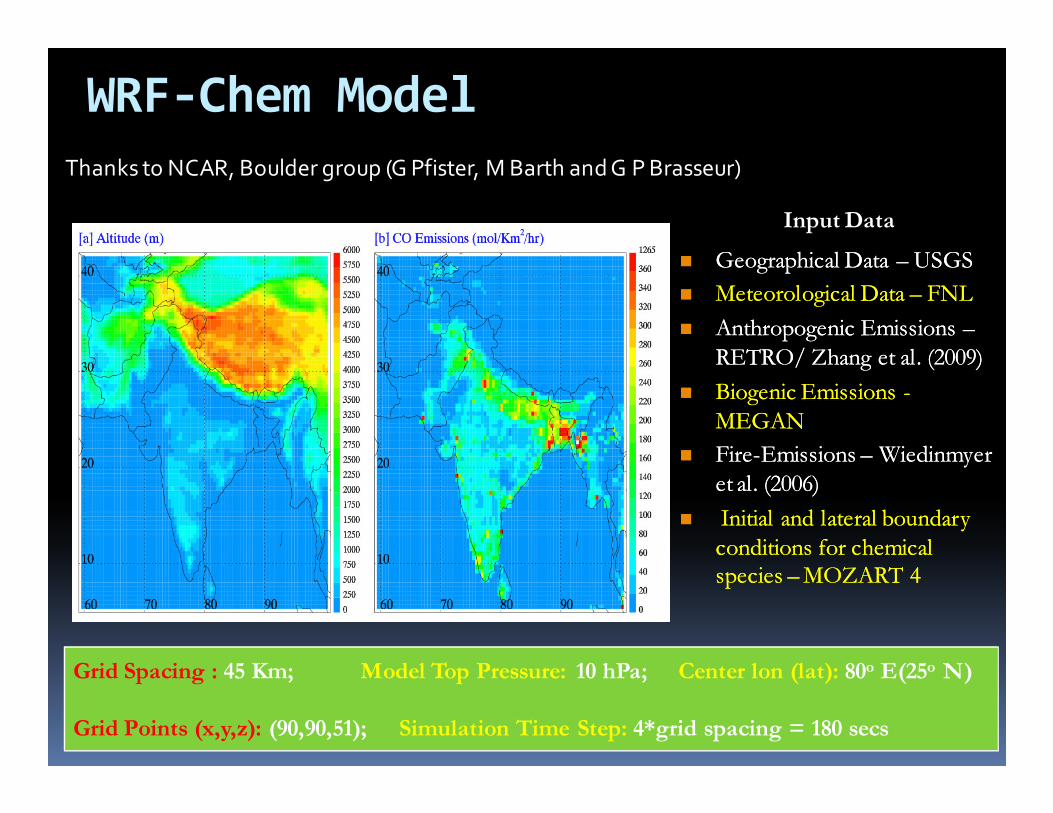
WRF-Chem Model
Input Data
Grid Spacing : 45 Km; Model Top Pressure: 10 hPa; Center lon (lat): 80o E(25o N)
Grid Points (x,y,z): (90,90,51); Simulation Time Step: 4*grid spacing = 180 secs
�� Geographical Data Geographical Data –– USGSUSGS
�� Meteorological Data Meteorological Data –– FNLFNL
�� Anthropogenic Emissions Anthropogenic Emissions ––
RETRO/ Zhang et al. (2009) RETRO/ Zhang et al. (2009)
�� Biogenic Emissions Biogenic Emissions --
MEGAN MEGAN
�� FireFire--Emissions Emissions –– Wiedinmyer Wiedinmyer
et al. (2006)et al. (2006)
�� Initial and lateral boundary Initial and lateral boundary
conditions for chemical conditions for chemical species species ––MOZART 4MOZART 4
Thanks to NCAR, Boulder group (G Pfister, M Barth and G P Brasseur)

WRF-Chem: comparison with RAOB
Radiosonde data from 34
stations within India are used
for evaluating temperature and
dew point temperature

WRF-Chem
Vs
AIRS
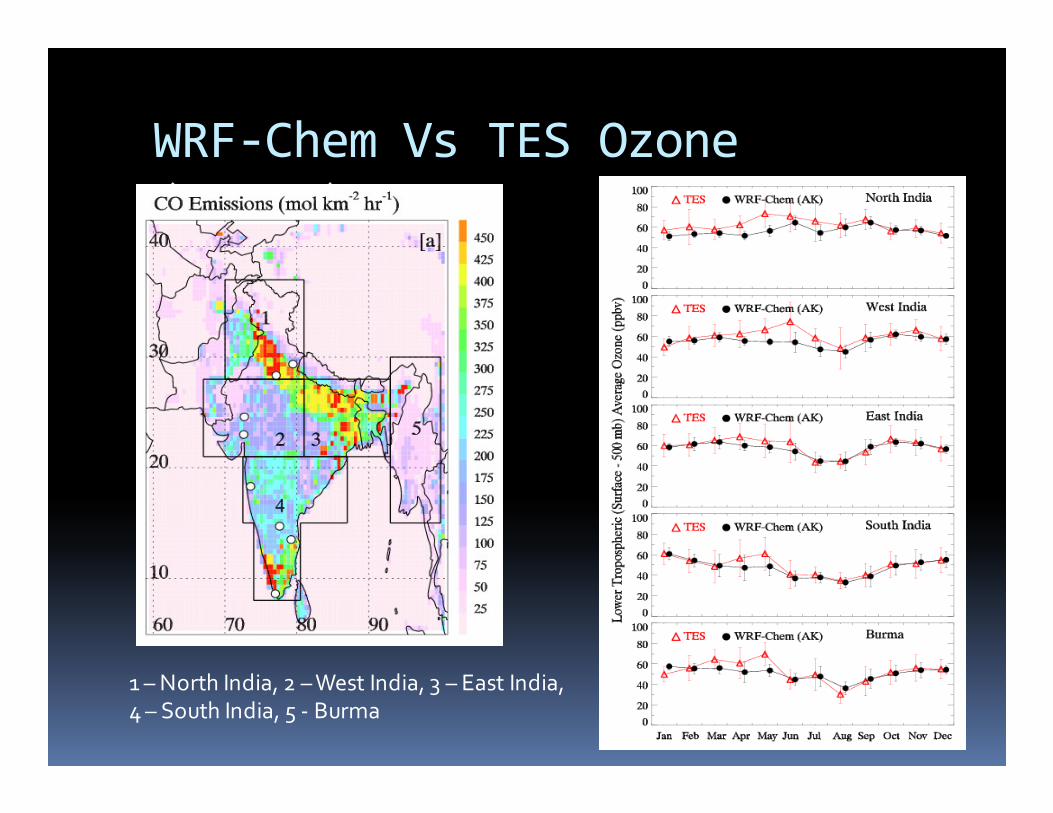
WRF-Chem Vs TES Ozone
(Cont…)
1 – North India, 2 – West India, 3 – East India, 4 – South India, 5 - Burma

WRF-Chem Vs. MODIS Terra AOD (550 nm)WRF-Chem (45 km)
MODIS (1 deg.)

Greenhouse gases
� Weekly Air samples (1400 Hours IST) are
collected at a cold trap (-300C)
� Analysis is done using NDIR analyzer and
GC at NIES, Japan
De-SeasonalizedLong term trend
CO2�1.65 -2.38 ppmv/yr, N2O� 0.75 ppbv/yr, SF6� 0.24 pptv/yr
Global growth rates:

Stratosphere Troposphere (ST) Radar (upcoming)
Highlights:� Studies on winds, monsoon dynamics and Troposphere Stratosphere exchange
� Frequency : 206.5 MHz
� Area Covered : 30x30 m
� Continuous and high resolution winds� ~10 min for full profile� 50 to 300 m� Velocity resolution : 0.1 m/s to 2 m/s
T/R module floor
(Ceiling for GF)
Arrangement to put
T/R modules
Ground Floor
(control room & work place)
Antenna floor
(Roof top)

Nainital
Kanpur
Agra
Shillong
Kolkata
Nagpur Bhubneshwar
Vishakhapatnam
Hyderabad
Gadanki
Thumba
Ahmedabad
Mt. Abu
Port Blair
ThalasseryOoty
Anantpur
Kullu
High altitude background sites under ISRO network
Mt. Abu
Nainital
Ooty
•Model Validation
•Background levels
•Regional Pollutions
•Long Range Transport

RAWEX-GVAXRegional Aerosols Warming Experiment
Ganges Valley Aerosols ExperimentA multi institutional project
DOE (USA), ISRO, IISc and ARIES
A major international initiative after about 13 years

AMF1 set up
atARIES
Nainital

Doppler Lidar

0 20000 40000 60000 80000 100000
-1000
0
1000
2000
3000
4000
5000
6000
7000
8000
Cloud Height (m)
Time(s)
Cloud base1
Cloud base 2
Ceilometer

Tropopause Characteristics over Nainital
�Tropopause characteristics show
significant variability over this region.
�Reasonably good agreement is seen
between radiosonde and satellite
observations.
�Generally Tropopause is located
between 14 to 18 km while on few
occasion it is observed at lower
altitudes (possibility of multiple
tropopause).
Tropopause estimation has been
made usingWMO criteria. .

Future Change ……..
……… it ……… it is in the tropicsis in the tropics