Embed Size (px)
Citation preview

BIODEGRADATION OF POLYLACTIC
ACID/STARCH BLENDS
ALVIN LEE WAN SIANG
UNIVERSITI TUNKU ABDUL RAHMAN
BIODEGRADATION OF POLYLACTIC ACID/ STARCH BLENDS
ALVIN LEE WAN SIANG
A project report submitted in partial fulfilment of the
requirements for the award of the degree of
Bachelor (Hons.) of Chemical Engineering
Faculty of Engineering and Science
Universiti Tunku Abdul Rahman
April 2012

ii
DECLARATION
I hereby declare that this project report is based on my original work except for
citations and quotations which have been duly acknowledged. I also declare that it
has not been previously and concurrently submitted for any other degree or award at
UTAR or other institutions.
Signature : _________________________
Name : Alvin Lee Wan Siang___
ID No. : _____ 08UEB05039________
Date : ______29 March 2012_______
iii
APPROVAL FOR SUBMISSION
I certify that this project report entitled “BIODEGRADATION OF
POLYLACTIC ACID/ STARCH BLENDS” was prepared by ALVIN LEE WAN
SIANG has met the required standard for submission in partial fulfilment of the
requirements for the award of Bachelor of Engineering (Hons.) Chemical
Engineering at Universiti Tunku Abdul Rahman.
Approved by,
Signature : _________________________
Supervisor : Ir. Dr. Tee Tiam Ting
Date : _________________________
iv
The copyright of this report belongs to the author under the terms of the
copyright Act 1987 as qualified by Intellectual Property Policy of University Tunku
Abdul Rahman. Due acknowledgement shall always be made of the use of any
material contained in, or derived from, this report.
© 2012, Alvin Lee Wan Siang. All right reserved.
v
Specially dedicated to
my beloved mother, father, sister, and all my friends and lecturers that have assisted
me in this study

vi
ACKNOWLEDGEMENTS
First and foremost, I would like to take an immense pleasure in thanking my research
supervisor, Ir. Dr. Tee Tiam Ting for his invaluable advice, guidance and his
enormous patience throughout the development of the research. I would also like to
express my deep sense of gratitude to my co-supervisor, Dr. Lee Tin Sin and also
lecturer, Ms. Bee Soo Tueen for their guidance, suggestion, and persistent help.
Without them this report would not have been possible.
In addition, I would also like to express my gratitude to all my friends who
had helped and given me encouragement especially to Ler Yew Tong, Goh Seng Xin,
and Law Ziy Lee. Their valuable assistance, time, and, effort had allowed me to
successfully complete this project. Besides, I would also like to thank Lab Assistant,
Mr. Ho Chan Cheong for providing his guidance and help.
Finally, I would need to express my heartfelt thanks to my parents for their
support and also Commerical Plastics Sdn. Bhd. for their assistance and permission
for me to carry out my project in their factory.

vii
BIODEGRADATION OF POLYLACTIC ACID/ STARCH BLENDS
ABSTRACT
Compression moulded polylactic acid (PLA) 100 % and PLA/ Starch blends of
PLA/Starch 80/20 and 50/50 respectively were buried in soil for 9 weeks to study the
effects of starch and the addition of effective microbes into the soil on rates of
biodegradation. Biodegradation of these samples were determined by appearance,
tensile stress and young modulus (elasticity). In terms of appearance, no significant
changes were observed in the samples buried under the soil without the addition of
effective microbes. However, changes were observed in samples buried under the
soil with the addition of effective microbes. PLA 100 % appeared to be decolourized
at the 9th
week. PLA/Starch 80/20 appeared to be distorted, displaying some
brownish colour on its surface at the 3rd
week. As for PLA/Starch 50/50, crevices
were observed to appear on the surface at the 9th
week. In general, PLA are slow to
degrade in soil as it illustrated a steep decline in its tensile stress and elasticity at
initial and then remain a fairly constant rate of declination throughout the burial
period. Tensile stress and elasticity of the samples obtained for both soil conditions
are decreasing in the order of PLA 100 % > PLA/Starch 80/20 > PLA/Starch 50/50.
However, samples buried in soil mixed with microbes give a lower tensile stress and
elasticity. This result shows that samples buried under the soil mixed with microbes
and PLA samples blended with starch affects the tensile stress and elasticity.
Addition of microbes into the soil enhances the biodegradation process of PLA. As
for starch, it would decrease the effective cross-section area of the PLA continuous
phase, resulting in decreases of tensile stress and elasticity. Therefore, based on this
study, it is evident that soil burials are not recommended for the disposal of PLA or
PLA/ Starch blends as they are slow to degrade in soil. Proper disposal alternatives
such as composting or recycling or both should be considered.
viii
TABLE OF CONTENTS
DECLARATION ii
APPROVAL FOR SUBMISSION iii
ACKNOWLEDGEMENTS vi
ABSTRACT vii
TABLE OF CONTENTS viii
LIST OF TABLES xi
LIST OF FIGURES xii
LIST OF SYMBOLS / ABBREVIATIONS xv
LIST OF APPENDICES xvi
CHAPTER
1 INTRODUCTION 1
1.1 Conventional Plastic Problems 1
1.2 Biopolymers as a Solution 2
1.3 The usage of Starch 2
1.4 Biodegradability of Polymers 3
1.5 Study of the Degradation Rate 4
1.6 Problem Statement 5
1.7 General Objectives 6
1.7.1 Specific Objective 6
1.8 Scope of Research 6
2 LITERATURE REVIEW 7
2.1 Biodiversity and Occurrence of Polymer-Degrading
Microorganisms
7

ix
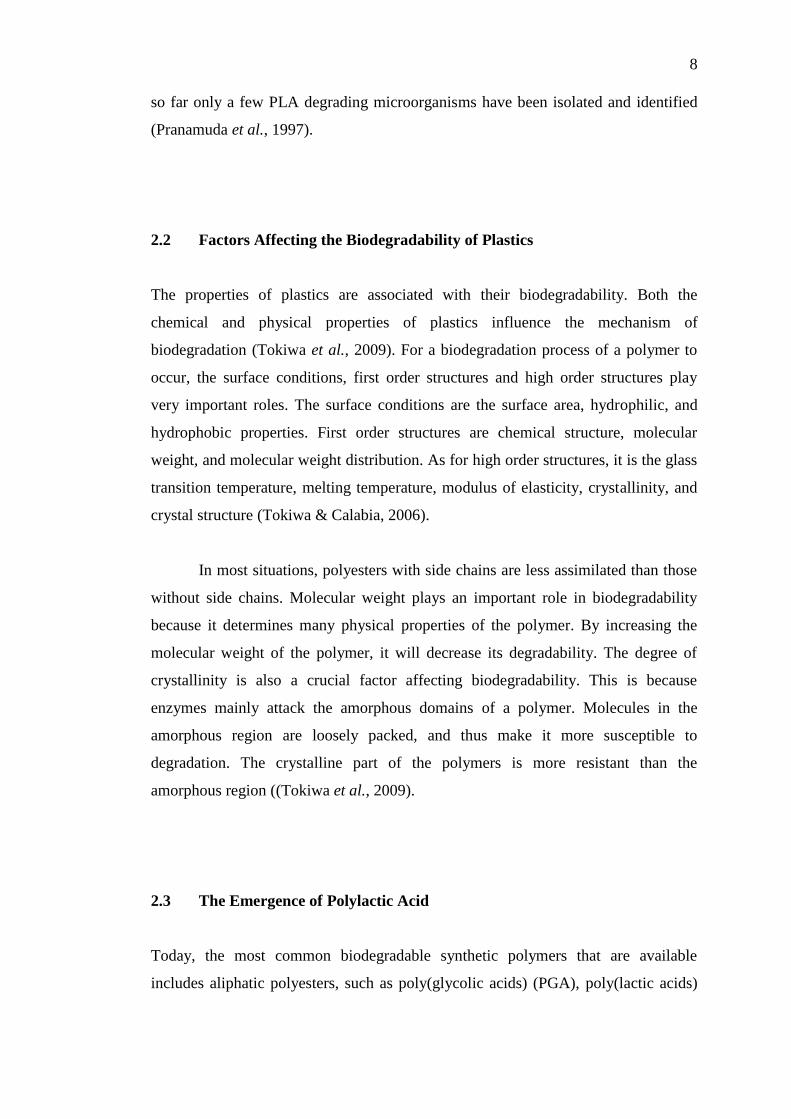
2.2 Factors Affecting the Biodegradability of Plastics 8
2.3 The Emergence of Polylactic Acid 8
2.4 Background of Polylactic Acid 10
2.4.1 Production of PLA 11
2.4.2 PLA Processing Technologies for Food
Applications
16
2.4.3 Extrusion of PLA 17
2.4.4 Thermal Stability of PLA 18
2.4.5 PLA Properties 18
2.4.6 Microbial Degradation of PLA 20
2.4.7 Enzymatic Degradation of PLA 21
2.4.8 PLA under Water Treatment Conditions 21
2.5 Blends of PLA Family 22
2.6 Blends of Hydrophobic and Hydrophilic Polymers 23
2.6.1 Starch as a Hydrophilic Polymer: Structure and
Properties
23
2.6.2 Blending of PLA and Starch 24
3 METHODOLGY 27
3.1 Materials Involved 27
3.2 Equipments 27
3.3 Formulations 29
3.4 Preparations 30
3.4.1 Preparation of PLA 100 % 30
3.4.2 Preparation of PLA/Starch 80/20 30
3.4.3 Preparation of PLA/Starch 50/50 32
3.5 Testing Procedures 32
3.5.1 Tensile Strength 32
4 RESULTS AND DISCUSSIONS 34
4.1 Processability 34
4.1.1 Processability of PLA 100 % 35
4.1.2 Processability of PLA/Starch 80/20 36

x
4.1.3 Processability of PLA/Starch 50/50 37
4.2 Appearance and Characteristics 38
4.2.1 Post-Compression Moulding 39
4.2.2 Post-Degradation 42
4.2.2.1 Appearance of PLA 100 % 42
4.2.2.2 Appearance of PLA/Starch 80/20 44
4.2.2.3 Appearance of PLA/Starch 50/50 46
4.3 Tensile Testing 48
4.3.1 Results of Tensile Tests of PLA 100 % 48
4.3.1.1 Buried under the soil without
Microbes
48
4.3.1.2 Buried under the soil with Microbes 50
4.3.2 Results of Tensile Tests of PLA/Starch 80/20 51
4.3.2.1 Buried under the soil without
Microbes
52
4.3.2.2 Buried under the soil with Microbes 53
4.3.3 Results of Tensile Tests of PLA/Starch 50/50 55
4.3.3.1 Buried under the soil without
Microbes
55
4.3.3.2 Buried under the soil with Microbes 57
5 CONCLUSIONS AND RECOMMENDATIONS 64
5.1 Conclusions 64
5.2 Recommendations 66
REFERENCES 67
APPENDICES 71

xi
LISTS OF TABLES
TABLE
TITLE PAGE
3.1
Formulation of PLA and PLA and Starch Blends 29
3.2
Set Point Parameters for Brabender Mixer 31
4.1
Tensile Stress of PLA 100 % without Microbes 48
4.2
Young Modulus of PLA 100 % without Microbes
49
4.3
Tensile Stress of PLA 100 % with Microbes 50
4.4
Young Modulus of PLA 100 % with Microbes 51
4.5
Tensile Stress of PLA/Starch 80/20 without Microbes
52
4.6
Young Modulus of PLA/Starch 80/20 without Microbes
52
4.7 Tensile Stress of PLA/Starch 80/20 with Microbes
53
4.8 Young Modulus of PLA/Starch 80/20 with Microbes
54
4.9 Tensile Stress of PLA/Starch 50/50 without Microbes
55
4.10 Young Modulus of PLA/Starch 50/50 without Microbes
56
4.11 Tensile Stress of PLA/Starch 50/50 with Microbes
57
4.12 Young Modulus of PLA/Starch 50/50 with Microbes 58

xii
LISTS OF FIGURES
FIGURE
TITLE PAGE
2.1
Molecular Structure of PLA 10
2.2 Shows PLA production steps by ring-opening polymerization
using stannous octoate as an initiator
15
2.3 Net greenhouse gas emission of commercial PLAs and other
polymers. PLA/NG = NatureWorks® PLA next generation,
PLA5 = NatureWorks® PLA in 2005, PLA6 =
NatureWorks® in 2006, HIPS = high impact poly(styrene),
PC = poly(carbonate), GPPS = general purpose poly(styrene),
PET am = PET amorph, PET ssp = PET solid sate
polycondensed.
16
3.1 The Brabender Plastograph EC
28
3.2 GOTECH Compression Moulding
28
3.3 Instron 5848 MicroTester
29
4.1 Fusion Torque and Fusion Time of PLA 100 %
35
4.2 Fusion Torque and Fusion Time of PLA/Starch 80/20
36
4.3 Fusion Torque and Fusion Time of PLA/Starch 50/50
37
4.4 General Appearance of PLA pellets
38
4.5 Granulated PLA with yellow pigment
38
4.6 Appearance of PLA 100 % plate
39
4.7 Appearance of PLA/Starch 80/20 plate
40
4.8 Appearance of PLA/Starch 50/50 plate
41

xiii
4.9 Appearance of PLA 100 % - (a) Initial; (b) Buried 3 weeks
without microbes; (c) Buried 3 weeks with microbes; (d)
Buried 6 weeks without microbes; (e) Buried 6 weeks with
microbes; (f) Degraded 9 weeks without microbes; (g)
Degraded 9 weeks with microbes
43
4.10 Appearance of PLA/Starch 80/20 - (a) Initial; (b) Buried 3
weeks without microbes; (c) Buried 3 weeks with microbes;
(d) Buried 6 weeks without microbes; (e) Buried 6 weeks with
microbes; (f) Buried 9 weeks without microbes; (g) Buried 9
weeks with microbes
45
4.11 Appearance of PLA/Starch 50/50 - (a) Initial; (b) Buried 3
weeks without microbes; (c) Buried 3 weeks with microbes;
(d) Buried 6 weeks without microbes; (e) Buried 6 weeks with
microbes; (f) Buried 9 weeks without microbes; (g) Buried 9
weeks with microbes
47
4.12 Tensile Stress versus buried time in soil without Microbes for
PLA 100 %
49
4.13 Young Modulus versus buried time in soil without Microbes
for PLA 100 %
49
4.14 Tensile Stress versus buried time in soil with Microbes for
PLA 100 %
50
4.15 Young Modulus versus buried time in soil with Microbes for
PLA 100 %
51
4.16 Tensile Stress versus buried time in soil without Microbes for
PLA/Starch 80/20
52
4.17 Young Modulus versus buried time in soil without Microbes
for PLA/Starch 80/20
53
4.18 Tensile Stress versus buried time in soil with Microbes for
PLA/Starch 80/20
54
4.19 Young Modulus versus buried time in soil with Microbes for
PLA/Starch 80/20
55
4.20 Tensile Stress versus buried time in soil without Microbes for
PLA/Starch 50/50
56
4.21 Young Modulus versus buried time in soil without Microbes
for PLA/Starch 50/50
56
xiv
4.22 Tensile Stress versus buried time in soil with Microbes for
PLA/Starch 50/50
57
4.23 Young Modulus versus buried time in soil with Microbes for
PLA/Starch 50/50
58
4.24 Tensile Stress of PLA and PLA and Starch Blends versus
Time under the burial of soil without Microbes
59
4.25 Tensile Stress of PLA and PLA and Starch Blends versus
Time under the burial of soil with Microbe
59
4.26 Young Modulus of PLA and PLA and Starch Blends versus
Time under the burial of soil without Microbes
60
4.27 Young Modulus of PLA and PLA and Starch Blends versus
Time under the burial of soil with Microbes
60
4.28 Effect of time of soil burial on tensile strength of moulded
Starch/PLA bars by Shogren et al (2002). Where: denotes
PLA 100 %; denotes PLA/Starch 80/20; denotes
PLA/Starch 60/40; denotes PLA/Starch 40/60
62
xv
LISTS OF SYMBOLS / ABBREVIATIONS
L length
D diameter
v/v volume over volume
w/w weight over weight
ρ density, g/cm3
MFI melt index, g/10 min
xvi
LISTS OF APPENDICES
APPENDIX TITLE PAGE
A Certificate of Analysis of Polylactic Acid
72

CHAPTER 1
INTRODUCTION
1.1 Conventional Plastic Problems
Plastic materials have played an important role in many applications in our life for
many years. Every year the world production of plastic is estimated to be more than
100 million tonnes (Sriroth, Chollakup, Piyachomkwan, & Oates, 2000). The main
reason for such an enormous amount of needs is due to their dominance over other
materials in its exceptional properties. These properties include resistance to
chemical reactions, high mechanical performances, good barrier properties and also
good heat seal ability (Jamshidian, Tehrany, Imran, Jacquot & Desorby, 2010).
Unfortunately, most conventional plastic products are manufactured from
polyethylene, polypropylene, polystyrene, poly(vinyl chloride) and poly(ethylene
terephthalate), where they are all non-biodegradable or their recycling process is
either difficult or not economical (Tokiwa, Calabia, Ugwa, & Aiba, 2009).
This has been a very serious problem as the increasing amount of these
conventional plastics have made acquiring sufficient areas for landfill sites to be
more difficult and its accumulation in the environment will soon become a threat to
the planet. Other then the non-biodegradability factor of these plastics, another
serious environmental issue would be its manufacturing materials. Most of these
conventional plastics are manufactured from fossil fuels which are non-renewable
fuels. With the exceptional amount of plastics produced every year, high
consumption of these non-renewable resources are required and this would one day
lead to the depletion of these precious resources.

2
1.2 Biopolymers as a Solution
To solve these increasingly serious environmental issues, the society has raised its
demands and directed many researches into biodegradable polymers which are called
biopolymers. The word biodegradable or biodegradation is defined as the
degradation of a polymer in natural environment that includes changes in chemical
structure, loss of mechanical and structural properties, and finally, changing into
other compound like water, carbon dioxide, minerals and intermediate products like
biomass and humic materials (Jamshidian et al., 2010).
Biopolymers are polymers that can be produced from natural and renewable
resources and also from crude oil. There are a total of four categories of biopolymers
that are widely recognized. The first category of biopolymer is polymers extracted
directly from natural raw materials, such as polysaccharides like starch and cellulose.
Some other examples are proteins like gelatine, casein, and silk and also marine
prokaryotes. The second category of biopolymer is polymers produced by chemical
synthesis from bio-derived monomers such as polylactic acid (PLA). The third
category would be polymers produced by microorganisms or genetically modified
bacteria such as polyhydroxyalkanoates (PHA), polyhydroxybutyrate (PHB),
hydroxyl-valerate (PHV), bacterial cellulose, xanthan, and pullan. As for the last and
fourth category of biopolymer, these polymers are produced from crude oil like
aliphatic and aromatic polyesters, polyvinyl alcohol (PVA), and modified polyolefins
(Jamshidian et al., 2010).
1.3 The Usage of Starch
Starch may offer a substitute for petroleum-based plastics. It is a renewable,
degradable, carbohydrate biopolymer derived from various sources. However, starch
by itself has severe limitations because of its sensitivity to water. Articles made from
starch will swell and deform upon exposure to moisture. Starch often has been
blended with petroleum polymers to improve its properties, to increase its
biodegradability, and to reduce the usage of petroleum polymer. For example, starch
3
was blended with polyethylene (PE), low-density polyethylene (LDPE),
poly(ethylene-co-acrylic acid) (EAA, polystyrene (PS), poly(ethylene-vinyl alcohol)
(EVA), etc. However, the fraction of petroleum polymers in the blends still remains
non degradable. Blending starch with biodegradable synthetic polymers became an
interesting and promising target (Ke & Sun, 2000).
1.4 Biodegradability of Polymers
Between October 1990 and June 1992, confusion as to the proper definition of
“biodegradable” led to lawsuits regarding misleading and deceitful environmental
advertising. Thus, it became evident to the ASTM and ISO that common test
methods and protocols for degradable plastics were essential. The American Society
for Testing of Materials (ASTM) and the International Standards Organization (ISO)
define degradable plastics as those which undergo a significant change in chemical
structure under specific environmental conditions. These significant changes result in
a loss of physical and mechanical properties, as measured by standard methods.
Biodegradable plastics degrade from the action of naturally occurring
microorganisms such as bacteria, fungi, and algae. Plastics may also be term as
photodegradable, oxidatively degradable, hydrolytically degradable, or those which
may be composted.
In order to be classified as biodegradable, materials must meet specific
criteria set out by the ASTM and ISO. In general, the likelihood of microbial attack
on a material is dependent on the structure of the polymer. When polymer materials
were exam from a scientific standpoint, there are certain ingredients that must be
present in order for biodegradation to occur. Most importantly, the active
microorganisms such as fungi, bacteria, actinomycetes, etc. must be present in the
disposal site. The microorganism type determines the appropriate degradation
temperature, which usually falls between 20 to 60 . The disposal site must be in the
presence of oxygen, moisture, and mineral nutrients, while the site pH must be
neutral or slightly acidic at the range of 5 to 8.

4
Biodegradation of materials occurs in various steps. Firstly, the digestible
macromolecules, which join to form a chain, experience a direct enzymatic scission.
This is followed by metabolism of the split portions, which leads to a progressive
enzymatic dissimilation of the macromolecule from the chain ends. However,
oxidative cleavage of the macromolecules may occur instead, which leads to the
metabolization of the fragments. Either way, the chain fragments will finally become
short enough to be converted by microorganisms.
Innovative polymer research and development leads to large scale production
by plastic converters (Lorcks, 1998). Biodegradable polymers are mostly
manufactured from renewable resources, usually in the form of starch or cellulose.
The biopolymers are formed into the specific end products and used by a consumer.
Ideally, the biopolymer will be disposed in a bio waste collection, and later
composted. This process will ultimately leave behind carbon dioxide and water,
which are environmentally friendly by-products (Kolybaba, Tabil, Panigrahi, Crerar,
Powell, & Wang, 2003).
1.5 Study of the Degradation Rate
The study of biopolymer’s degradation rate is very important. This is because
different kind of biopolymers provides different rate of degradability in different
kind of environments. These situations can be due to temperature, types and presence
of microorganism, intensity of sunlight and also various combinations or mixtures
with other compounds such as organic compounds and also other elements. The
result of this study will provide essential information on which type of biopolymers
that are suitable in certain application and in certain environment. This is because
some applications require its biopolymers to sustain for a longer life compare to
other applications.
Though it seems that the production of biopolymer would be the key solution
for all environmental problems caused by accumulation of plastics including changes
to the carbon dioxide cycle, problems in composting and increasing toxic emmisions

5
to come to an end, but many research and studies are still required before biopolymer
could be widely applied in our daily life. Currently, the price for a conventional
plastic is still too cheap, at least compared with the alternatives.
1.6 Problem Statements
Polylactic Acid (PLA) has the highest potential for widespread use and it is the most
commonly applied biopolymer in our daily life. However, PLA does not come with
the best biodegradability properties amongst biopolymers. Degradation of PLA has
been studied for several years, but understanding on this subject is still insufficient.
This is clearly supported by the lack of information on the mechanisms involved and
the microorganisms associated with the degradation. Many report states that PLA
degradation occurred strictly through hydrolysis with no enzymatic involvement
(Tokiwa & Calabia, 2006).
Several reports showed that the crystalline part of the PLA was more resistant
to degradation than the amorphous part, and that the rate of degradation decreases
with an increase in crystallinity (Tokiwa & Calabia, 2006). Stability of PLA also
plays a very important role in its degradable rate. This is because stability of PLA in
water and the scarcity of PLA-degrading microorganisms in soil environments may
cause the degradation of PLA in natural environments to be very slow (Pranamuda,
Tokiwa, & Tanaka, 1997).
Starch have many limitations mainly due to its solubility and poor water-
resistance, thus, making starch products very sensitive to the relative humidity at
which they are stored and used (Siew, Han, & Hanna, 2008). In order to overcome
these challenges, several researchers have successfully blended starch with other
synthetic polymers. Starch and PLA can be blended at varying concentrations to
achieve the desired mechanical properties in a material for a variety of applications.
However, the effect of the synthetic polymer matrix on the degradation of the starch
remains unknown (Russo, O’Sullivan, Rounsefell, Halley, Truss, & Clarke, 2008).
6
Starch is a hydrophilic material and does not interact well with hydrophobic
polyesters such as PLA, thus, resulting in unfavourable qualities of the blends.
1.7 General Objectives
The objective of this research is to investigate the degradable rate of PLA and PLA
and starch blends.
1.7.1 Specific Objective
1. To determine the degradable rate of various types of biopolymers under the
burial of soil with the presence of additional microbes.
2. To determine the degradable rate of various types of biopolymers under the
burial of soil without the addition of microorganism.
1.8 Scope of Research
The scope of this research covers the following biopolymer materials, which are neat
PLA, blend of PLA and tapioca starch. These materials were experimented under the
following conditions which is under the burial of soil with and without the addition
of effective microbes. Results were recorded beginning from the third week on a 3
weeks basis until the 9th
week. The result of these experiments which is the
degradable rate that were determined by visual inspection (phototaking) and by
measuring its tensile strength. The degradablity of the particular polymer were
deemed as high as the mechanical strength of the particular biopolymer becomes
weaker.

CHAPTER 2
LITERATURE REVIEW
2.1 Biodiversity and Occurrence of Polymer-Degrading Microorganisms
Biodiversity and occurrence of polymer-degrading microorganisms vary depending
on the environment, such as soil, sea, compost, activated sludge, etc. Thus, it is
necessary to investigate the distribution and population of polymer-degrading
microorganisms in various ecosystems. The major mechanisms involve in the
microbial degradation of plastics is basically the adherence of the microorganisms on
the surface of the plastics which is then followed by the colonization of the exposed
surface. For enzymatic degradation of plastics by hydrolysis, it involves a two step
process. In the first step, the enzyme would bind to the polymer substrate. As for the
second step, it would catalyze a hydrolytic cleavage. Polymers are then degraded into
low molecular weight oligomers, dimers and monomers and finally mineralized to
CO2 and H2O (Tokiwa, Calabia, Ugwa, & Aiba, 2009).
The clear zone method with agar plates is a widely used technique for
screening polymer degraders and for assessment of the degradation potential of
different microorganisms towards a polymer (Tokiwa et al., 2009). Agar plates that
contain emulsified polymers are inoculated with microorganisms. Presence of the
polymer degrading microorganisms can be verified by observing the formation of
clear halo zones around the colonies. Such formation happens when the polymer-
degrading microorganisms excrete extracellular enzymes which diffuse through the
agar and degrade the polymer into water soluble materials. By using this technique,
8
so far only a few PLA degrading microorganisms have been isolated and identified
(Pranamuda et al., 1997).
2.2 Factors Affecting the Biodegradability of Plastics
The properties of plastics are associated with their biodegradability. Both the
chemical and physical properties of plastics influence the mechanism of
biodegradation (Tokiwa et al., 2009). For a biodegradation process of a polymer to
occur, the surface conditions, first order structures and high order structures play
very important roles. The surface conditions are the surface area, hydrophilic, and
hydrophobic properties. First order structures are chemical structure, molecular
weight, and molecular weight distribution. As for high order structures, it is the glass
transition temperature, melting temperature, modulus of elasticity, crystallinity, and
crystal structure (Tokiwa & Calabia, 2006).
In most situations, polyesters with side chains are less assimilated than those
without side chains. Molecular weight plays an important role in biodegradability
because it determines many physical properties of the polymer. By increasing the
molecular weight of the polymer, it will decrease its degradability. The degree of
crystallinity is also a crucial factor affecting biodegradability. This is because
enzymes mainly attack the amorphous domains of a polymer. Molecules in the
amorphous region are loosely packed, and thus make it more susceptible to
degradation. The crystalline part of the polymers is more resistant than the
amorphous region ((Tokiwa et al., 2009).
2.3 The Emergence of Polylactic Acid
Today, the most common biodegradable synthetic polymers that are available
includes aliphatic polyesters, such as poly(glycolic acids) (PGA), poly(lactic acids)

9
(PLA), polycaprolactone (PCL), polyhydroxybutyrate (PHB) and
poly(hydroxybutyrate-co-hydroxyvalerate) (PHBV).
Under the trade name of Dexon since 1970 (Frazza & Schmitt, 1971), PGA
was first developed as a fully synthetic absorbable suture that has been commercially
available, but the suture tended to lose mechanical strength rapidly due to the
hydrophilic nature of PGA (Reed & Gilding, 1981). PCL is a semicystalline polymer
with a melting temperature of 59–64 °C and a glass transition of –60 °C. By
comparing PCL with PGA or PLA, PCL has a significantly slower degradation rate
and is suitable for relevant long-term application (Pitt, 1990). Unfortunately, its low
melting temperature greatly limits the application. In the 1980s, PHB was identified
as a promising biomaterial, and PHB and PHBV were commercially available under
the trade name of Biopol in the late 1980s (Miller & Williams, 1987). Unfortunately,
interest faded when it became clear that the cost of material was too high, and its
properties could not match those of propylene.
Among these biopolymers, PLA is the most widely used synthetic degradable
polymers in human medicine (Huang, 1989) and has been studied extensively for
tissue engineering and drug delivery systems since the 1980s. PLA has good
mechanical properties that are comparable to those of polystyrene (Martin &
Averous, 2001) and good biodegradability. Other than that, the semicrystalinity of
PLA is preferred in cases where high mechanical strength and toughness are
required. All these properties have made PLA a better choice for disposable and
biodegradable plastic substitutes. However, in some instances, PLA is still more
expensive than conventional plastics, and the degradation rate is still slow compared
with the waste accumulation rate (Ramsay, Langlade, Carreau, & Ramsay, 1993).
10
2.4 Background of Polylactic Acid
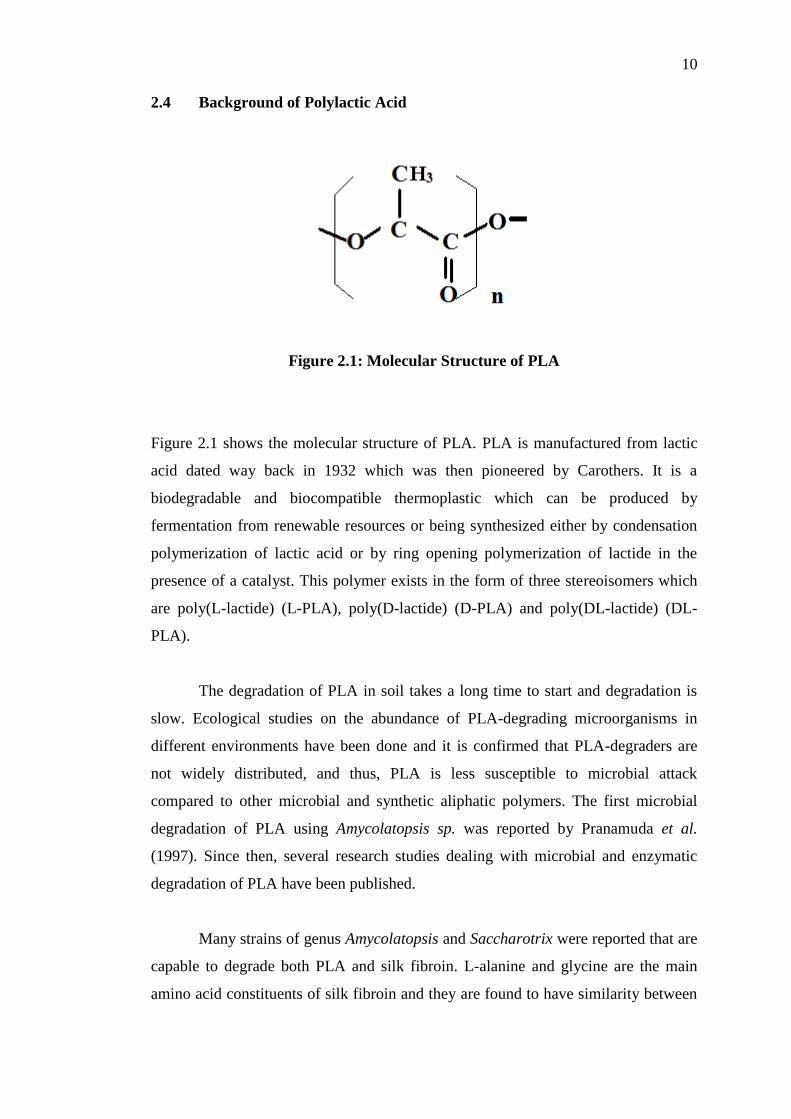
Figure 2.1: Molecular Structure of PLA
Figure 2.1 shows the molecular structure of PLA. PLA is manufactured from lactic
acid dated way back in 1932 which was then pioneered by Carothers. It is a
biodegradable and biocompatible thermoplastic which can be produced by
fermentation from renewable resources or being synthesized either by condensation
polymerization of lactic acid or by ring opening polymerization of lactide in the
presence of a catalyst. This polymer exists in the form of three stereoisomers which
are poly(L-lactide) (L-PLA), poly(D-lactide) (D-PLA) and poly(DL-lactide) (DL-
PLA).
The degradation of PLA in soil takes a long time to start and degradation is
slow. Ecological studies on the abundance of PLA-degrading microorganisms in
different environments have been done and it is confirmed that PLA-degraders are
not widely distributed, and thus, PLA is less susceptible to microbial attack
compared to other microbial and synthetic aliphatic polymers. The first microbial
degradation of PLA using Amycolatopsis sp. was reported by Pranamuda et al.
(1997). Since then, several research studies dealing with microbial and enzymatic
degradation of PLA have been published.
Many strains of genus Amycolatopsis and Saccharotrix were reported that are
capable to degrade both PLA and silk fibroin. L-alanine and glycine are the main
amino acid constituents of silk fibroin and they are found to have similarity between

11
the stereochemical position of the chiral carbon of L-lactic acid unit of PLA and L-
alanine unit in the silk fibroin. Silk fibroin is identified as one of the natural
analogues of poly(L-lactide), thus, this may probably cause the PLA degrading
microorganisms to identify the L-lactate unit as an analogue of L-alanine unit in silk
fibroin. A number of proteinous materials such as silk fibroin, elastin, gelatin and
some peptides and amino acids were found to stimulate the production of enzymes
from PLA-degrading microorganisms.
Enzymatic degradation of PLA using proteinase K, bromelain and pronase
have been studied. Among these enzymes, proteinase K from Tritirachium album
was found to be most effective for PLA degradation. Unfortunately, proteinase K and
other serine proteases are only capable of degrading L-PLA and DL-PLA but not D-
PLA. Furthermore, proteinase K preferentially hydrolyzes the amorphous part of L-
PLA where the rate of degradation decreases with an increase in the crystalline part.
Degradation of PLA oligomers accelerated by several esterase-type enzymes was
reported by Fukuzaki et al. (1989). The purified PLA depolymerase from
Amycolatopsis sp. was also capable of degrading casein and silk fibroin. Other than
that, several serine proteases such as trypsin, elastase, subtilisin were able to
hydrolyze L-PLA (Tokiwa et al., 2009).
2.4.1 Production of PLA
Lactic acid (2-hydroxy propionic acid), the single monomer of PLA, is produced via
fermentation or chemical synthesis. Its two optically active configurations, the L(+)
and D(−) stereoisomers are produced by bacterial (homofermentative and
heterofermentative) fermentation of carbohydrates. Industrial lactic acid production
utilizes the lactic fermentation process rather than synthesis because the synthetic
routes have many major limitations, including limited capacity due to the
dependency on a by-product of another process, inability to only make the desirable
L-lactic acid stereoisomer, and high manufacturing costs (Datta & Henry, 2006).
12
The homofermentative method is preferably used for industrial production
because its pathways lead to greater yields of lactic acid and to lower levels of by-
products. The general process consists of using species of the Lactobacillus genus
such as Lactobacillus delbrueckii, L. amylophilus, L. bulgaricus, and L. leichmanii, a
pH range of 5.4 to 6.4, a temperature range of 38 to 42 , and a low oxygen
concentration. Generally, pure L-lactic acid is used for PLA production (Mehta,
Kumar, Bhunia, & Upadhyay, 2005).
PLA has a variable molecular weight and only its high molecular weight
polymer is used in the packaging industry. Three ways are possible for the
polymerization of lactic acid; (a) direct condensation polymerization; (b) direct
polycondensation in an azeotropic solution; and (c) polymerization through lactide
formation. Other than these methods, PLA can also be produced by ring-opening
polymerisation using stannous octoate as an initiator as shown in Figure 2.2. The first
method is based on esterification of monomers by the aid of some solvents and
exudated water is removed using progressive vacuum and high temperatures.
Obtaining high molecular weight polyesters with good mechanical properties via this
method is not easy, although precondensates may be of interest for the preparation of
biodegradable glues or lacquers, since the –OH and -COOH end groups allow cross-
linking with suitable inorganic or organic multivalent additives (Hartmann, 1998).
Producing high molecular weight PLA polymers by direct polycondensation
in an azeotropic solution and also application of some catalysts is more practicable.
The azeotropic solution helps to decrease the distillation pressures and facilitates
PLA separation from the solvent by application of molecular sieves. The variety and
content of catalysts, solvent volume percentages, and the reaction time on the
preparation of PLA have been studied. The results identified by using improved
experimental equipment, the proper complex catalyst, and solvent volume ratio, in
order to obtain a molecular weight of PLA of 6.6 × 10⁴ (Li, Tang, Wang, Pan, &
Wang, 2006).
Polymerization through lactide formation is being industrially accomplished
for high molecular weight PLA production. Lactide is a cyclic dimer formed by
removing water under mild conditions and without solvent. L-lactide, meso (L,D)

13
lactide, and D-lactide are products of L-lactic acid and D-lactic acid. The terms
polylactide and poly (L-lactide) have been used in many references instead of PLA.
Lactide purification is accomplished by vacuum-distillation of high
temperatures. After the vacuum-distillation of L-lactide, high molecular weight PLA
with a controlled optical and crystal purity is formed by ring-opening
polymerization. Ring-opening polymerization of lactide can be carried out in melt or
solution by cationic, anionic, and coordination mechanisms, depending on the
initiator utilized. The most considered active initiator for the L-lactide ring-opening
polymerization is stannous octoate (bis 2-ethyl hexanoate, SnOct2), which causes a
low degree of racemisation at high temperature. It has a low toxicity and is accepted
by FDA (Puaux, Banu, Nagy, & Bozga, 2007).
A kinetics study for ring-opening polymerization of L-lactide with stannous
octoate has been done and a correlated mathematical modelling developed for that
(Mehta, Kumar, & Upadhyay, 2007).
The choice of initiator system, co-initiator as chain control agent, catalyst
concentration, monomer-to-initiator ratio, and polymerization temperature and time
significantly affect the polymer properties. Properties such as molecular weight,
degree of crystallinity, and residual monomer content, in turn affect the physico-
mechanical properties of polylactide and its copolymers (Vink, Rajbago, Glassner,
Springs, O’Connor, Kolstad, & Gruber, 2004).
New ideas for decreasing PLA final price and making production processes
more eco-friendly, in comparison to earlier production process, include usage of crop
residue such as stems, straw, husks, and leaves from corn or, potentially, other crops,
and use of unfermentable residues as a heat source, as well as substituting some part
of electricity energy by wind power energy. These approaches decrease the
consumption of fossil fuels and corn starch as raw materials and also diminish
polluting air, water, and waste emissions to the environment (Vink, Rabago,
Glassner, & Gruber, 2003).
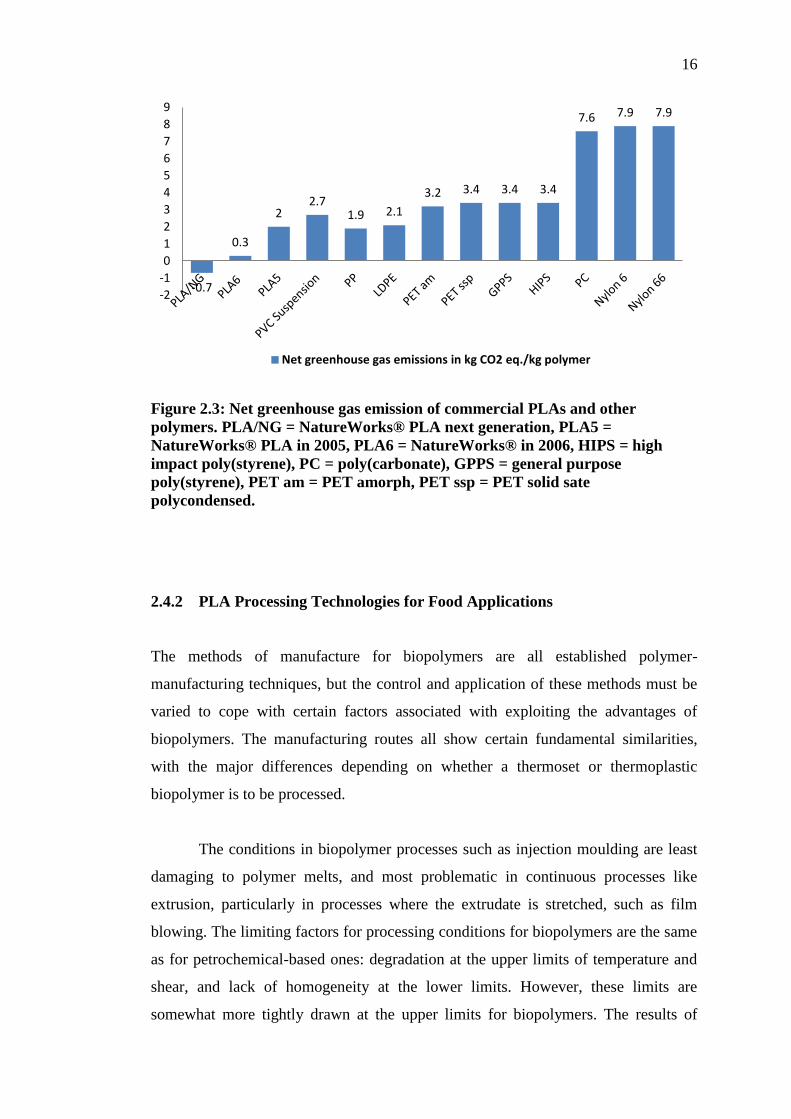
14
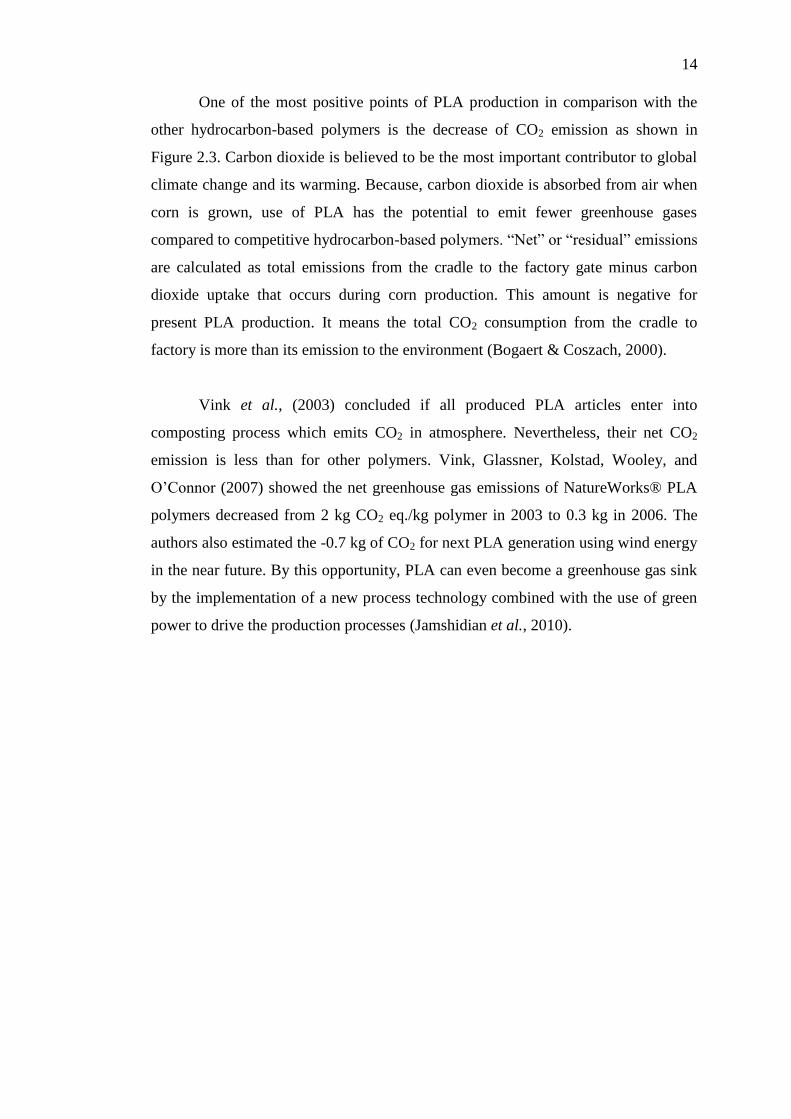
One of the most positive points of PLA production in comparison with the
other hydrocarbon-based polymers is the decrease of CO2 emission as shown in
Figure 2.3. Carbon dioxide is believed to be the most important contributor to global
climate change and its warming. Because, carbon dioxide is absorbed from air when
corn is grown, use of PLA has the potential to emit fewer greenhouse gases
compared to competitive hydrocarbon-based polymers. “Net” or “residual” emissions
are calculated as total emissions from the cradle to the factory gate minus carbon
dioxide uptake that occurs during corn production. This amount is negative for
present PLA production. It means the total CO2 consumption from the cradle to
factory is more than its emission to the environment (Bogaert & Coszach, 2000).
Vink et al., (2003) concluded if all produced PLA articles enter into
composting process which emits CO2 in atmosphere. Nevertheless, their net CO2
emission is less than for other polymers. Vink, Glassner, Kolstad, Wooley, and
O’Connor (2007) showed the net greenhouse gas emissions of NatureWorks® PLA
polymers decreased from 2 kg CO2 eq./kg polymer in 2003 to 0.3 kg in 2006. The
authors also estimated the -0.7 kg of CO2 for next PLA generation using wind energy
in the near future. By this opportunity, PLA can even become a greenhouse gas sink
by the implementation of a new process technology combined with the use of green
power to drive the production processes (Jamshidian et al., 2010).
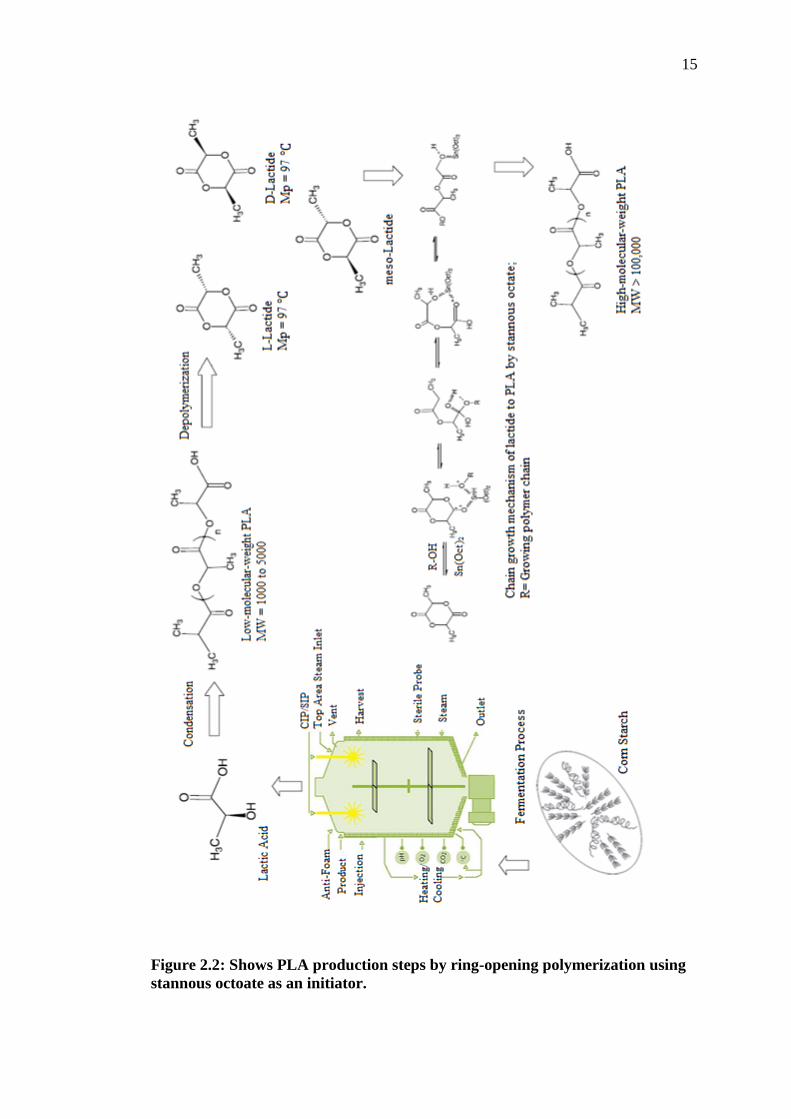
15
Figure 2.2: Shows PLA production steps by ring-opening polymerization using
stannous octoate as an initiator.
16
Figure 2.3: Net greenhouse gas emission of commercial PLAs and other
polymers. PLA/NG = NatureWorks® PLA next generation, PLA5 =
NatureWorks® PLA in 2005, PLA6 = NatureWorks® in 2006, HIPS = high
impact poly(styrene), PC = poly(carbonate), GPPS = general purpose
poly(styrene), PET am = PET amorph, PET ssp = PET solid sate
polycondensed.
2.4.2 PLA Processing Technologies for Food Applications
The methods of manufacture for biopolymers are all established polymer-
manufacturing techniques, but the control and application of these methods must be
varied to cope with certain factors associated with exploiting the advantages of
biopolymers. The manufacturing routes all show certain fundamental similarities,
with the major differences depending on whether a thermoset or thermoplastic
biopolymer is to be processed.
The conditions in biopolymer processes such as injection moulding are least
damaging to polymer melts, and most problematic in continuous processes like
extrusion, particularly in processes where the extrudate is stretched, such as film
blowing. The limiting factors for processing conditions for biopolymers are the same
as for petrochemical-based ones: degradation at the upper limits of temperature and
shear, and lack of homogeneity at the lower limits. However, these limits are
somewhat more tightly drawn at the upper limits for biopolymers. The results of
-0.7
0.3
2 2.7
1.9 2.1
3.2 3.4 3.4 3.4
7.6 7.9 7.9
-2
-1
0
1
2
3
4
5
6
7
8
9
Net greenhouse gas emissions in kg CO2 eq./kg polymer

17
exceeding these upper limits are degradation of the polymer, resulting in moulding
defects such as weld lines, discoloration, or a strong odour in the final product
(Johnson, Mwaikambo, & Tucker, 2003).
2.4.3 Extrusion of PLA
The first major step in the conversion of plastic resin into films, sheets, containers
and so on, is to change the pellets from solid to melt or molten phase in an extruder.
Extrusion is a common way for processing thermoplastics and it is used for
extrusion coating, cast film extrusion, blown film extrusion, and other polymer
processes.
Screw extruders are typically used in the polymer industry. They consist of an
electrically heated metal barrel, a hopper for feeding the resin, a motor for rotating a
screw, and a die where the polymer melt exists. So, the combination of thermal
energy generated by a heater and frictional heat due to friction between the plastic
and the screw and barrel provide sufficient heat to melt the pellets.
The ratio of flight length of the screw to its outer diameter, which is the L/D
ratio, determines the shear and residence time of the melt. Screws with a large L/D
ratio provide greater shear heating, better mixing, and longer melt residence time in
the extruder. Another important screw parameter is the compression ratio, which is
the ratio of the flight depth in the feed section to the flight depth in the metering
section. The greater the compression ratio a screw possesses, the greater the shear
heating it provides (Giles, Wagner, & Mount, 2005).

18
2.4.4 Thermal Stability of PLA
PLA is thermally unstable and exhibits rapid loss of molecular weight as the result of
thermal treatment at processing temperatures. The ester linkages of PLA tend to
degrade during thermal processing or under hydrolytic conditions. PLA undergoes
thermal degradation at temperatures (200 lower than the melting point (130 - 230
) of the polymer, but the degradation rate rapidly increases above the melting
point. It has been postulated that thermal degradation mainly occurs by random
main-chain scissions. Several reactions such as hydrolysis, depolymerization,
oxidative degradation, and interand intramolecular trans-esterification reactions to
mononmer and oligomeric esters, are suggested to be involved in the degradation
process during thermal treatments (Jamshidian et al., 2010).
2.4.5 PLA Properties
PLA has unique properties like good appearance, high mechanical strength, and low
toxicity; and good barrier properties have broadened its applications. Numerous
researchers have studied the different properties of neat PLA and in combination
with other polymers as blend or copolymer; and here some of them will be
introduced.
Auras, Harte, Selke, and Hernandez (2003) studied mechanical, physical, and
barrier properties of 2 PLA films by the names of 4030-D, which was made with
nominally 98 % L-lactide, and 4040-D, which was made with nominally 94 % L-
lactide resins. Finally, the data from these 2 PLA film samples were compared to
those of polystyrene (PS) and polyethylene terephthalate (PET). PLA films showed
good tensile strength with higher values than PS but lower than PET. Both 4030-D
and 4040-D had lower Tm (melting point) and Tg (glass transition temperature) than
PET and PS, which makes PLA better for heat-sealing and thermal processing. In
terms of barrier properties of PLA, the permeability coefficients of CO2 and O2 were
lower than those of PS and comparable to those of PET.
19
For tensile modulus and flexural modulus, PLA has the highest value in
comparison to PS, PP, and HDPE. For notched izod impact, PLA has the lowest one
between PS, PP, and HDPE. The elongation at break is low and nearly 4 % that is
just higher than that of PS (Dorgan, Lehermeier, & Mang, 2000).
Low glass transition temperature of PLA limits its usages in thermally
processed packages. Because of its deformation and its low melting temperature, it is
better to use it for heat-sealing and thermoforming applications.
The other important property of polymers is their rate of crystallinity.
Crystallinity is the indication of amount of crystalline region in the polymer with
respect to amorphous content. Crystallinity influences many polymer properties
including hardness, modulus, tensile strength, stiffness, crease point, and melting
point. So, while selecting a polymer for a required application its crystallinity plays
the foremost role.
PLA crystals can grow in 3 structural positions called α, β, and γ forms. They
are characterized by different helix conformations and cell symmetries, which
develop upon different thermal and/or mechanical treatments. The α form grows
upon melt or cold crystallization, the β form develops upon mechanical stretching of
the more stable α form, and the γ form, which only recently has been reported to
develop on hexamethylbenzene substrate (Di Lorenzo, 2005).
Di Lorenzo (2005) measured crystallization rates of PLA over a wide
temperature range, using both isothermal and nonisothermal methods. He determined
that the crystallization rate of PLA at temperatures between 100 and 118 is very
high. He concluded that the high crystallization rate of PLA below 120 has to be
ascribed to the high rate of radial growth of the spherulites.
By modification of the chain architecture through the introduction of
branching, different melt flow properties will be obtained. Thermal and rheological
properties of 2 commercial types of PLA, linear and branched, were investigated by
Dorgan et al., (2000). The crystallization kinetic of the branched polymer was faster
than that of the linear analogue. Longer relaxation times in the terminal region of the
20
branched material introduced it as a higher zero shear rate viscosity. They concluded
that by utilizing the structure modifications through polymer branching, the ability of
using PLA in many processing operations will be extended (Jamshidian et al., 2010).
2.4.6 Microbial degradation of PLA
In spite of the great need for PLA as a biodegradable plastic, till today studies on
PLA degradation have focused only on enzymatic or hydrolytic degradation, and no
study of microbial degradation has been reported. The study of microbial degradation
is crucial because microorganisms are involved in the biodegradation of plastic
polymers in the environment. Thus, the microbial degradability of PLA must be
confirmed before it is widely distributed. (Pranamuda et al., 1997)
The biodegradability of PLA relies heavily on the environment to which it is
exposed. When it is in either the human or animal bodies, it is believed that PLA is
initially degraded by hydrolysis and the soluble oligomers formed are then
metabolized by cells. Upon disposal in the environment, it is hydrolyzed into low
molecular weight oligomers and then mineralized into CO2 and H2O by the
microorganisms present in the environment (Lunt, 1998). As mention previously,
degradation of PLA in soil is slow and that it takes a long time for degradation to
start. Ohkita and Lee (2006) reported that no degradation was observed on PLA
sheets after 6 weeks in soil.
Urayama, Kanamori, and Kimura (2002) reported that the molecular weight
of PLA films with different optical purity of the lactate units (100 % L and 70 % L)
decreased by 20 and 75 %, respectively, after 20 months in soil. On the other hand,
PLA can be degraded in a composting environment where it is hydrolyzed into
smaller molecules which are oligomers, dimers, and monomers after 45–60 days at
50–60 °C. These smaller molecules are then degraded into CO2 and H2O by
microorganisms in the compost (Tokiwa & Calabia, 2006).
21
2.4.7 Enzymatic Degradation of PLA
Polyhydroxybutyrate (PHB) depolymerases and lipases are the most extensively
studied enzymes. Little information on L-PLA degrading enzymes has been reported
so far. Williams (1981) first reported the degradation of L-PLA by proteinase K from
Tritirachiam album. Since then, this enzyme has been used in studying the
degradation mechanisms of L-PLA, copolymers of PLA, and PLA. Oda, Yonetsu,
Urakami, and Tomomura (2000) examined the enzymatic degradation of L-PLA at
50 °C using 56 commercially available proteases. They found out that acid and
neutral proteases had a little or no effect on L-PLA degrading activity but some
alkaline proteases derived from Bacillus spp. showed appreciable L-PLA degrading
activity.
In 2006, Tokiwa and Calabia have purified a commercially available α-
chymotrypsin and compared its PLA-degrading activity with other serine proteases
such as trypsin, elastase, subtilisin, and proteinase K. All tested serine proteases were
able to hydrolyze L-PLA. Contrary to Oda et al.’s (2000) report that subtilisin could
not degrade L-PLA, it is found out that the L-PLA degrading activity of subtilisin
was similar to the purified α-chymotrypsin (Lim, Raku, & Tokiwa, 2005). The
difference in the results was probably due to the assay method used. It should be
noted that in measuring the degrading activity of L-PLA, control experiment which is
reaction mixture without enzyme or with inactivated enzyme is necessary to confirm
if the degradation is due to the enzyme or due to chemical hydrolysis (Tokiwa &
Calabia, 2006).
2.4.8 PLA under Water Treatment Conditions
PLA under water treatment conditions was first reported by Rudeekit, Numnoi,
Tajan, Chaiwutthinan, and Leejarkpai (2009). It is observed that PLA sheets slowly
degraded after 1 month and small white spots on the surface of the PLA sheet could
be visually observed. There were also some areas where the sheet unchanged. After
15 months, small white spots were found more distributed across the surface of the

22
PLA sheet. PLA sheet degrades slowly probably because of the slow rate of
hydrolysis at 25-32 °C which was waste water treatment conditions. It was suggested
that PLA does not biodegrade readily at temperatures less than 60 °C due to its ‘glass
transition’ temperature being close to 60 °C (Rudeekit et al., 2009).
2.5 Blends of PLA Family
PLA have been a much focused attention among most of the biodegradable polyester
because of its biodegradability and compostable. It also have very low or no toxicity
and high mechanical performance, comparable to those of commercial polymers.
However, the thermal stability of PLAs is simply not high enough to be used as an
alternative in many commercial polymers applications. Ikada, Jamshidi, Tsuji, and
Hyon (1987) studied various PLA blends to improve their thermal properties. X-ray
diffractometry and differential scanning calorimetry (DSC) shows that all the
initially amorphous PLA films remained amorphous, even after autocatalytic
hydrolysis for 16 and 24 months.
The ability to control the hydrolytic degradability of PLAs is very important,
and several studies have been done to elucidate the effects various components in the
systems. Poly(aspartic acid-co-lactic) (PAL) was used by Shinoda, Asou, Kashima,
Kato, Tseng, and Yagi (2003) to accelerate the degradation of PLA. PAL is an
amphiphilic copolymer obtained from aspartic acid and lactide. It is found to be
miscible with PLA and produced homogenous blend films without impairing the
inherent mechanical properties of PLA.
The blend films are capable of maintaining sufficient transparency, which is
one of the most valuable advantages of pure PLA. PAL and poly(sodium aspartate-
co-lactide) (PALNa) may be useful as antistatic agents for PLA films, as many
results shows that there is an increased in hydrophilicity of the surface. With just a
small amount of PAL being added into PLA in water, soil and compost can enhance
its degradation rate. Blended PAL will resist hydrolysis unless it contacts water,
which ensures that the blend products could have a long shelf life and be useful for a
23
wide variety of applications. Other than that, PAL is also found to be able to improve
the thermal stability of PLA containing an appreciable amount of residual catalyst
(Yu, Dean, & Lin, 2006).
2.6 Blends of Hydrophobic and Hydrophilic Polymers
Most natural polymers are hydrophilic materials. This is because they contain either
hydroxyl or polar groups. As for synthetic biodegradable polymers, specifically the
aliphatic polyesters are hydrophobic or sensitive to moisture. The blending of these
two kinds of polymers are gaining lots of interest as this could lead to the
development of new range of biodegradable polymeric materials (Yu et al., 2006).
2.6.1 Starch as a Hydrophilic Polymer: Structure and Properties
Starch is a hydrophilic material and are mainly made up of two homopolymers of D-
glucose which are amylase, a branched amylopectin, having the same backbone
structure as amylose but with many α-1, 6’-linked branch points, and a mostly linear
α-D(1, 4’)-glucan. There are a lot of hydroxyl groups on starch chains, two
secondary hydroxyl groups at C-2 and C-3 of each glucose residue, as well as one
primary hydroxyl group at C-6 when it is not linked.
Starch chains potentially exhibit reactivity specific for alcohols due to the
presence of hydroxyl groups. This allows them to be oxidized and reduced, and may
participate in the formation of hydrogen bonds, ethers and esters. Starch has different
proportions of amylose and amylopectin ranging from about 10–20 % amylase and
80–90 % amylopectin depending on the source. Amylose is soluble in water and
forms a helical structure. Starch occurs naturally as discrete granules because short
branched amylopectin chains are able to form helical structures which crystallize.
Starch granules exhibit hydrophilic properties and strong inter-molecular association
via hydrogen bonding formed by the hydroxyl groups on the granule surface.
24
The internal interaction and morphology of starch will be readily changed by
water molecules due to its hydrophilicity, and thereby its glass transition temperature
(Tg), the dimension and mechanical properties depend on the water content (Lu,
Xiao, & Xu, 2009). Glass transition temperature of native starch can be as low as 60
to 80 °C when the weight fraction of water is in the range 0.12 to 0.14. This allows
starch to be successfully injection moulded to obtain thermoplastic starch polymers
in the presence of water. Other than that, the hydrophilicity of starch can be used to
improve the degradation rate of some degradable hydrophobic polymers.
Starch is fully biodegradable in the environments. It can be hydrolyzed into
glucose by microorganism or enzymes, and then metabolized into carbon dioxide and
water. It is worth noting that carbon dioxide will recycle into starch again by plants
and sunshine. However, starch itself is poor in processability, and also in the
dimensional stability and mechanical properties for its end products. Therefore,
native starch is not used directly (Lu, Xiao, & Xu, 2009).
2.6.2 Blending of PLA and Starch
Blends of synthetic polymers and starch offers many benefit and one of the important
benefit is the cost performance benefits because starch is renewable, cheap and
available year-round. Blending of polymers with starch under controlled conditions
could lead to co-polymerization that in turn results in high molecular polymers with
thermoplastic properties. To blend or mix these polymers requires special machinery,
such as an extruder but these polymers can be handled as easily as conventional
plastic resin (Sriroth et al., 2000).
Before blending of PLA and starch was reported, several blends of PLA with
various non-biodegradable polymers have been investigated. Biodegradable blends
of PLA with other aliphatic polyesters such as poly( -caprolactone), poly(butylene
succinate) and poly(hydroxy butyrate) were reported. The problem with this blends
are some of these blends were found to be immiscible, resulting in fairly poor
mechanical properties (Martin & Averous, 2001).

25
PLA and starch are good candidates for polymer blends because both are
biodegradable and derivable from renewable resources. Starch can improve the
biodegradability and plays an important role in lowering the cost while PLA controls
the mechanical properties of the blend. Starch granules become swollen and
gelatinized when water is added or when they are heated, and water is often used as a
plasticizer to obtain desirable product properties (Yu et al., 2006).
Blends of PLA and starch are characterized in the presence of various water
contents by Ke and Sun. Initial moisture content of the starch has no significant
effect on its mechanical properties, but has a significant effect on the water
absorption of the blends. The thermal and crystallization properties of PLA in the
blend were not affected by moisture content. Blends prepared by injection moulding
had lower crystallinities than those prepared by compression moulding. However,
blends prepared by compression moulding had lower tensile strengths and
elongations and higher water absorption values than those made by injection
moulding. The crystallinities of the blends increased greatly with annealing treatment
at the PLA second crystallization temperature which is 155 . The decomposition
of PLA indicated that PLA degraded slightly in the presence of water under the
processing temperatures used (Yu et al., 2006).
Talc is a nucleating agent was blended with PLA at 1 % by volume (v/v) as a
comparison. Starch effectively increased the crystallization rate of PLA, even at 1 %
content, but the effect was less than that of talc. When the starch content was
increased from 1 to 40 %, it can be seen that the crystallization rate of PLA increased
slightly. An additional crystallization of PLA can be observed, and it affected the
melting point and degree of crystallinity of PLA (Yu et al., 2006).
PLA and starch might seem like a promising future for biodegradable
polymer blends. However, starch is a hydrophilic material, which does not interact
well with hydrophobic polyesters and this gives a thermodynamically immiscible
product and hence, poor and irreproducible performance.
To solve this issue, several approaches have been proposed and developed to
overcome the problem of incompatibility of starch and synthetic polymer blends.

26
Very good interfacial adhesions of PLA and starch blends were achieved by grafting
PLA using maleic anhydride (MA). Jang, Shin, Lee, and Narayan (2007) investigated
the interfacial adhesion between PLA and starch using MA and maleated
thermoplastic starch (MATPS). Scanning electron microscopy (SEM) showed that
MA is a good compatibilizer and PLA and starch blends had increased crystallinity.
On the other hand, MATPS is not effective for PLA and starch blends. PLA and
starch blends which were compatibilized with MA showed higher biodegradability
than ordinary PLA and starch blends at the same PLA ratio (Tokiwa et al., 2009).
Unfortunately, adding of MA could have an adverse effect due to chain scission
(Leadprathom, Suttiruengwong, Threepopnatkul, & Seadan, 2010).
Wang, Sun, and Seib (2001) used methylenediphenyl diisocyanate (MDI) to
improve the interface and studied a blend of 55/45 (w/w) mixture of PLA and dried
wheat starch in an intensive mixer with or without a low level of MDI. Blends with
MDI can enhance mechanical properties and this could be explained by the in situ
formation of a block copolymer acting as a compatibilizer (Yu et al., 2006).
CHAPTER 3
METHODOLOGY
3.1 Materials Involved
The PLA used is an injection grade (ρ = 1.31 g/cm3 and MFI = 10~11 g/10 min)
from ESUN BrightChina Industrial Co. Ltd, Shenzhen, China. The tapioca starch
used in this research is from Thye Huat Chan Sdn Bhd. The soil used to bury the
biopolymers is black soil which was purchased from Tesco stores. The microbes
used to degrade the biopolymers are natural food grade microbes which is WA-
BeneficialMicrobes purchased from Worldwide Alliance Sdn. Bhd. These specific
culture microbe solutions are mainly used for general purpose.
3.2 Equipments
The equipments used to blend and mix the required materials are the Brabender
Plastograph EC (as shown in Figure 3.1) and then it is compression moulded using a
GOTECH press as shown in Figure 3.2. The tensile strengths of the biopolymer
blends were obtained from the Instron 5848 MicroTester as shown in Figure 3.3. To
visually inspect the appearance of the degraded biopolymers, a conventional digital
camera was used.

28
Figure 3.1: The Brabender Plastograph EC
Figure 3.2: GOTECH Compression Moulding

29
Figure 3.3: Instron 5848 MicroTester
3.3 Formulation Table
The following formulations as shown in Table 3.1 were tested in a 3 weeks basis
starting from the 3rd
week after the materials were compounded and the experiment
were proceeded until the 9th
week. This formulation was also tested under two
conditions which are with the presence of additional microbes and without additional
microbes in the soil.
Table 3.1: Formulation of PLA and PLA and Starch Blends
Material Weight Distribution (%)
PLA 100 % PLA 80 % PLA 50 %
PLA 100 80 50
Tapioca Starch 0 20 50
30
3.4 Sample Preparation
3.4.1 Preparation of PLA 100 %
The PLA purchased comes in a granulated pellet form and it has some yellow
pigmentation on it. The preparation of PLA 100 % is rather simple as no mixing is
required. Thus, dismissing the need of using the Brabender mixer, the PLA pellets
was compressed immediately in the compression moulding process.
Before the sample is prepared, the compression moulding machine was
heated up to a temperature of 220 . After the desired temperature is reached, an
excess amount of PLA is placed on the heated mould. The PLA placed on the heated
mould were heated for 20 minutes until all pellets were melted. The mould was then
closed with a top force, and a pressure of 2000 kPa was applied by jacking the lower
mould up to force the PLA into contact with all mould areas. The heat and pressure
were maintained until the moulding material has cured. Finally, the heated mould
was removed from the compression moulding machine and left in a bucket full of
water for cooling.
After the heated mould has cooled down, the moulded PLA was removed
from the mould. The PLA samples obtained were in a plate form of 19 cm 19 cm
0.2 cm.
3.4.2 Preparation of PLA/Starch 80/20
The preparation of PLA/Starch 80/20 requires mixing; thus, necessitate the usage of
Brabender mixer. Brabender Plastograph EC is a measuring mixer. It is capable of
not only mixing but also measuring the processibility of plastic and testing of
plastifiable substances. Apart from these measuring tasks, the mixer is also suited for
producing sample material or for reactive processing.
31
Before mixing, an adequate amount of samples to be prepared were
determined. Similar with the PLA 100 % formulation, this PLA/Starch 80/20 sample
were also prepared in the form of a 19 cm 19 cm 0.2 cm plate. The total volume
of the plate was 19 cm 19 cm 0.2 cm = 72.2 cm3. The density of PLA is 1.31
g/cm3 and the density of starch is 1.5 g/cm
3. Since the composition of this blend
contains 80 % of PLA and 20 % of starch this gives a total density of 1.348 g/cm3
and a total weight of 97.3256 g. However, the Brabender mixer could not mix sample
homogeneously at sample weighing more than 50 g; thus, the sample would need to
be broken down into 42 g per sample. At 42 g per sample, the total amount of PLA at
80 % is 33.6 g and the amount of starch would be 8.4 g. Therefore, to form one
single plate of sample, it would require three 42 g samples to be mixed and then
moulded by compression moulding (requires excess amount of sample).
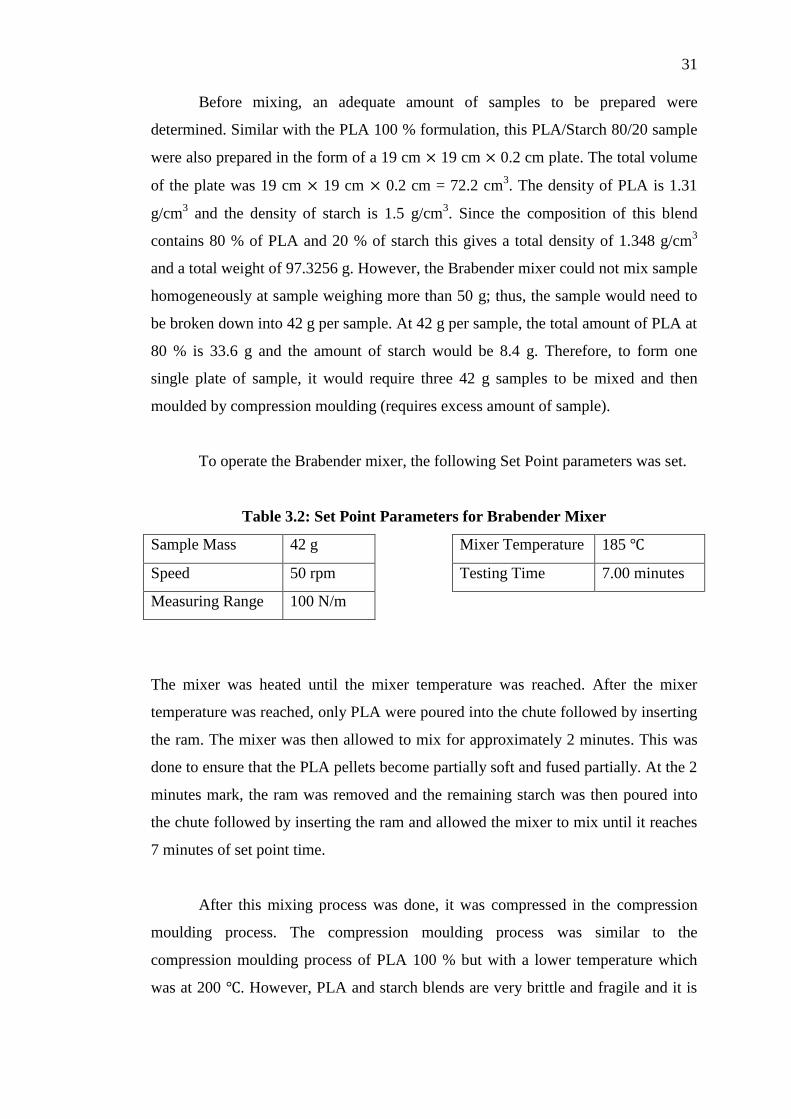
To operate the Brabender mixer, the following Set Point parameters was set.
Table 3.2: Set Point Parameters for Brabender Mixer
Sample Mass 42 g Mixer Temperature 185
Speed 50 rpm Testing Time 7.00 minutes
Measuring Range 100 N/m
The mixer was heated until the mixer temperature was reached. After the mixer
temperature was reached, only PLA were poured into the chute followed by inserting
the ram. The mixer was then allowed to mix for approximately 2 minutes. This was
done to ensure that the PLA pellets become partially soft and fused partially. At the 2
minutes mark, the ram was removed and the remaining starch was then poured into
the chute followed by inserting the ram and allowed the mixer to mix until it reaches
7 minutes of set point time.
After this mixing process was done, it was compressed in the compression
moulding process. The compression moulding process was similar to the
compression moulding process of PLA 100 % but with a lower temperature which
was at 200 . However, PLA and starch blends are very brittle and fragile and it is
32
not easily removable from the mould. Thus, two pieces of OHP transparencies were
used to cover the sample and then placed it on the mould while it was compressed.
3.4.3 Preparation of PLA/Starch 50/50
Preparation methods for this sample were similar with PLA/Starch 80/20 sample but
with different amount of PLA and Starch. Here, the amount of PLA and starch
required would be 21 g each and summing it up would give a total amount of 42 g
per sample.
3.5 Testing Procedures
The mechanical testing conduct in this research was based on the America Society
for Testing and Materials (ASTM) standards testing methods. The samples were first
prepared according to the ASTM and then buried into two different soil conditions
with one soil containing microbes and the other without microbes. 1 Litre of
microbes was added on every 3 kg of soil. Both soils are exposed under
environmental condition for 9 weeks with each testing done on a 3 weeks interval.
3.5.1 Tensile Strength
The ASTM standard used in this testing method is the ASTM D638-10 Standard Test
Method for Tensile Properties of Plastics. The tensile stress and Young Modulus
were measured on the tester.
Based on the ASTM standard, samples were prepared in a dumbbell shape.
The type of dumbbell shape prepared is Type IV. To prepare the dumbbell shape, a
dumbbell cutter was used. Pressure was applied from the top of the cutter and bottom

33
of the sample to give the desired dumbbell shape. However, this method can only be
applied on PLA 100 % as it has a small amount of ductile property. As for PLA and
starch blends, the samples were very brittle, thus it requires the usage of an electric
saw. After the samples were prepared in Type IV, they were buried into the soil. The
samples were prepared in 4 batches where the first batch were tested as an initial for
result comparison, as for the other 3 batches, they were buried in the soil and were
tested at the 3rd
week, 6th
week, and finally the 9th
week.
To begin testing on the samples, the samples were first removed from the soil
and all soils or dirt staining on the surface of the samples was removed. After that,
the sample was placed on the grips at the Instron 5848 Mircostester with a crosshead
speed set at 1 mm/min. The test was completed once the sample was snap at its
breaking point.
CHAPTER 4
RESULTS AND DISCUSSIONS
4.1 Processability
The processability results were obtained from the Brabender mixer where the fusion
time and fusion torque data of the PLA and PLA and starch blends were determined.
These data are essential as it is greatly affected by the composition of the compound,
molecular weight of the resin, and also the method of starch addition. Thus, it is very
important to specify the formulation ingredients, testing conditions, type of mixing
vessel and volume, batch load, and the sample preparation when providing the
processability results.
Fusion can be defined as the process whereby, the PLA agglomerates,
primary particles, domain and microdomains are attached together during processing.
Previous studies have shown that fusion has a profound influence on mechanical,
physical, and chemical properties. In order to obtain optimum mechanical properties
an appropriate level of fusion is needed (Azman, Yee, Ko, & Lukman, 2002).

35
4.1.1 Processability of PLA 100 %
Figure 4.1: Fusion Torque and Fusion Time of PLA 100 %
From Figure 4.1, it can be observed that the temperature curve decreases at the start
and increases gradually with time till a point and remain constant throughout the
mixing process. Meanwhile, at the time where the temperature decreases, it can be
seen that the torque increases to its peak and then decreases gradually until it reaches
a constant state. The drop in temperature and the increased in torque indicating the
presence of PLA pellets entering into the mixer. As the mixing process progresses,
the PLA pellets begins to fused and this leads to the decrease in torque. As for the
temperature it slowly roses back to its initial temperature.

36
4.1.2 Processability of PLA/Starch 80/20
Figure 4.2: Fusion Torque and Fusion Time of PLA/Starch 80/20
Figure 4.2 shows the PLA /Starch 80/20 processability results. Initially, PLA /Starch
80/20 processability results are similar to the results obtained from the PLA 100 %.
However, at approximately the 2 minute mark, there is a small increase on the torque
as well as a small decrease on the temperature. This is because at this time, starch
was added into the mixer. At this state, the PLA pellets are soft and sticky due to the
high temperature from the Brabender mixer and the pellets are also partially fused
after being mixed for 2 minutes. Thus, adding starch at this moment would allow the
blends to mix homogeneously and enhance its adhesiveness. The reason starch was
not added initially together with PLA are due to concerns that the outcome of the
blend might not mix homogeneously. After the addition of starch, the torque’s curve
increases slightly from its previous state and slowly reaching a constant state.

37
4.1.3 Processability of PLA/Starch 50/50
Figure 4.3: Fusion Torque and Fusion Time of PLA/Starch 50/50
The processability result for PLA/Starch 50/50 (as shown in Figure 4.3) and
PLA/Starch 80/20 are similar with only slight difference. In PLA/starch 50/50 blend,
the mixing time was extended to 9 minutes so that the mixing process would be more
homogenize due to the higher amount of starch being added. Here, the PLA was
allowed to mix for a longer period of time till approximately the 3 minute mark
before starch was added. Another difference that can be observed is the sudden drop
of the torque curve at approximately the 3 minute mark and then proceeded by a high
increase in torque at the 3 minute 36 seconds mark. The peak of this torque curve is
higher as compared with the peak of the torque obtained from the PLA/Starch 80/20.
When starch was added into the chute, the sudden drop in torque is due to the large
amount of starch presence into the internal mixer and it clogs the twin screws that
were rotating to mix the samples. The torque increases immediately after starch was
completely added in order to mix homogeneously with the PLA. As the mixing
progresses, the torque slowly decreases and reaches a constant state.

38
4.2 Appearance and Characteristics
Figure 4.4: General Appearance of PLA pellets
Figure 4.5: Granulated PLA with yellow pigment
PLA comes in the form of pellets before it is compounded into the samples by
mixing with Brabender mixer or compression moulding. Generally, the appearances
of PLA pellets are colourless as shown in Figure 4.4. However, the PLA used in this
project are granulated and it is pigmented with a yellowish colour as shown in Figure
4.5. But these factors did not affect the general properties of the PLA.

39
4.2.1 Post-Compression Moulding
When PLA pellets or PLA and starch blends (after the mixing process) were heated
up and being jacked up to come in contact with all mould areas on the compression
moulding machine, the excess heated PLA or PLA and starch can be seen flowing
out of the mould. These PLA and PLA and starch blends are very sticky and they
have high tendencies to stain on the surface area of the mould; thus, making the
cleaning process of the mould to be very difficult.
After the PLA pellets and PLA and Starch blends gone through the cooling process,
there are several differences that can be observed between PLA 100 %, PLA/Starch
80/20, and PLA/Starch 50/50 plates.
Figure 4.6: Appearance of PLA 100 % plate
For PLA 100 % as shown in Figure 4.6, the surface of the plate is relatively smooth
and the colour of the plate is relatively dull in yellowish colour. This sample of PLA
is considerably brittle and has small amount of ductility. However, it will crack or
breaks into pieces if moderate pressure were applied forcefully.

40
Figure 4.7: Appearance of PLA/Starch 80/20 plate
For PLA/Starch 80/20 as shown in Figure 4.7, it is observed to be beige in colour and
the surface of the plate is reflective and smooth but uneven due to the OHP
transparencies being used to cover the sample that might have been distorted during
the heating process in compression moulding. The outcome of this formulation is a
very fragile, brittle and weak sample. It is so weak that with a small amount of
pressure applied on it, will cause it to shatters into pieces.

41
Figure 4.8: Appearance of PLA/Starch 50/50 plate
Figure 4.8 shows the PLA/Starch 50/50 sample, it has a similar appearance with
PLA/Starch 80/20. However, this formulation is a lot weaker and more brittle then
PLA/Starch 80/20. A slight pressure applied on it will cause it to fragmentize. Based
on this observation, the relationship between the presence of starch and the amount
of starch can be related with the integrity of the sample. As the amount of starch
increases, the mechanical properties of the sample decreases.

42
4.2.2 Post-Degradation
The appearance of the PLA and PLA and starch blends are observed to have
noticeable changes after being buried under the soil especially under the soil that
contains microbes.
4.2.2.1 Appearance of PLA 100 %
Figure 4.9 shows the appearance of various samples of PLA 100 %. For the first 6
weeks no noticeable changes were observed in both samples either being buried
under the soil with microbes and without microbes. However, at the 9th
week, some
changes in appearance are observed. The samples buried under the soil with
microbes appear to be decolourized. This observation probably indicates degradation
executed by the microbes. As for the samples buried under the soil without microbes,
no noticeable differences were observed in compared with the previous samples.

43
(a)
(b) (c)
(d) (e)
(f) (g)
Figure 4.9: Appearance of PLA 100 % - (a) Initial; (b) Buried 3 weeks without
microbes; (c) Buried 3 weeks with microbes; (d) Buried 6 weeks without
microbes; (e) Buried 6 weeks with microbes; (f) Buried 9 weeks without
microbes; (g) Buried 9 weeks with microbes
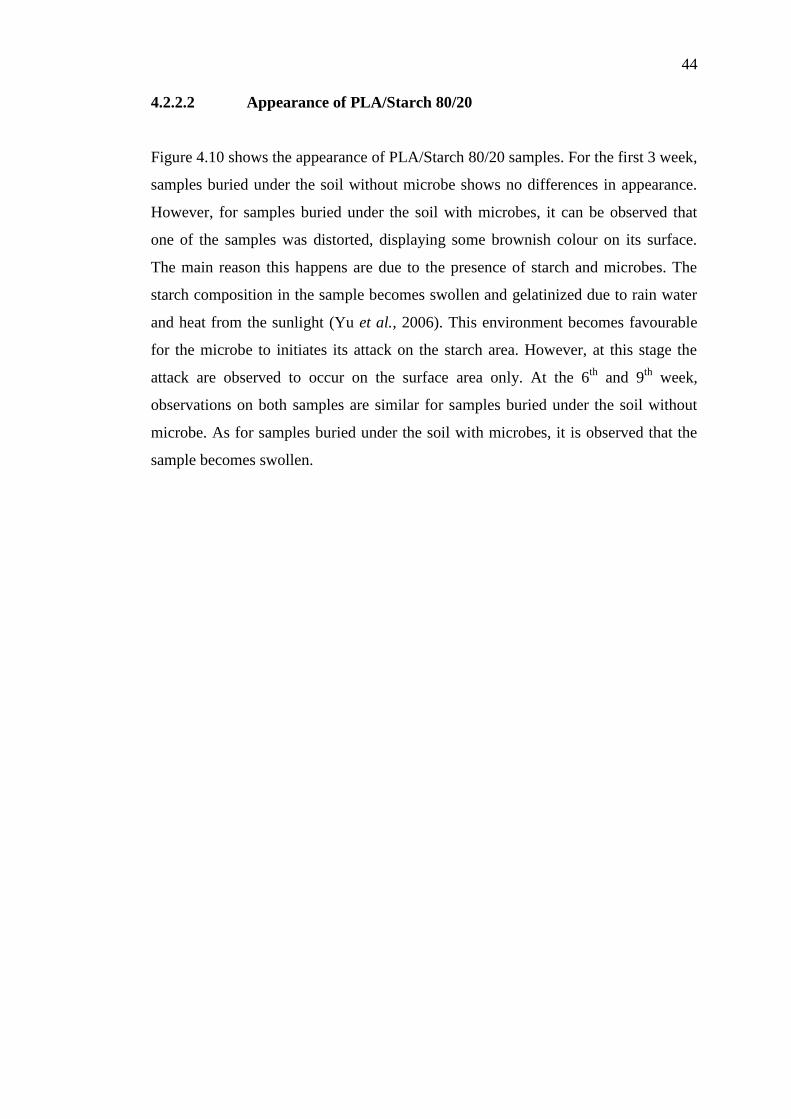
44
4.2.2.2 Appearance of PLA/Starch 80/20
Figure 4.10 shows the appearance of PLA/Starch 80/20 samples. For the first 3 week,
samples buried under the soil without microbe shows no differences in appearance.
However, for samples buried under the soil with microbes, it can be observed that
one of the samples was distorted, displaying some brownish colour on its surface.
The main reason this happens are due to the presence of starch and microbes. The
starch composition in the sample becomes swollen and gelatinized due to rain water
and heat from the sunlight (Yu et al., 2006). This environment becomes favourable
for the microbe to initiates its attack on the starch area. However, at this stage the
attack are observed to occur on the surface area only. At the 6th
and 9th
week,
observations on both samples are similar for samples buried under the soil without
microbe. As for samples buried under the soil with microbes, it is observed that the
sample becomes swollen.

45
(a)
(b) (c)
(d) (e)
(f) (g)
Figure 4.10: Appearance of PLA/Starch 80/20 - (a) Initial; (b) Buried 3 weeks
without microbes; (c) Buried 3 weeks with microbes; (d) Buried 6 weeks without
microbes; (e) Buried 6 weeks with microbes; (f) Buried 9 weeks without
microbes; (g) Buried 9 weeks with microbes

46
4.2.2.3 Appearance of PLA/Starch 50/50
Figure 4.11 shows the appearance of PLA/Starch 50/50 samples. Observations for
PLA/Starch 50/50 and 80/20 are similar. The only difference would be the
characteristics of the sample. Samples of PLA/Starch 50/50 are softer due to the
higher content of starch in the samples and the starch area becomes very moisture
after being buried under the soil. At the 9th
week, samples buried under the soil with
microbe were observed to have crevice on its surface. This observation indicates the
degradation due to microbial invasion after a period of time.

47
(a)
(b) (c)
(d) (e)
(f) (g)
Figure 4.11: Appearance of PLA/Starch 50/50 - (a) Initial; (b) Buried 3 weeks
without microbes; (c) Buried 3 weeks with microbes; (d) Buried 6 weeks without
microbes; (e) Buried 6 weeks with microbes; (f) Buried 9 weeks without
microbes; (g) Buried 9 weeks with microbes
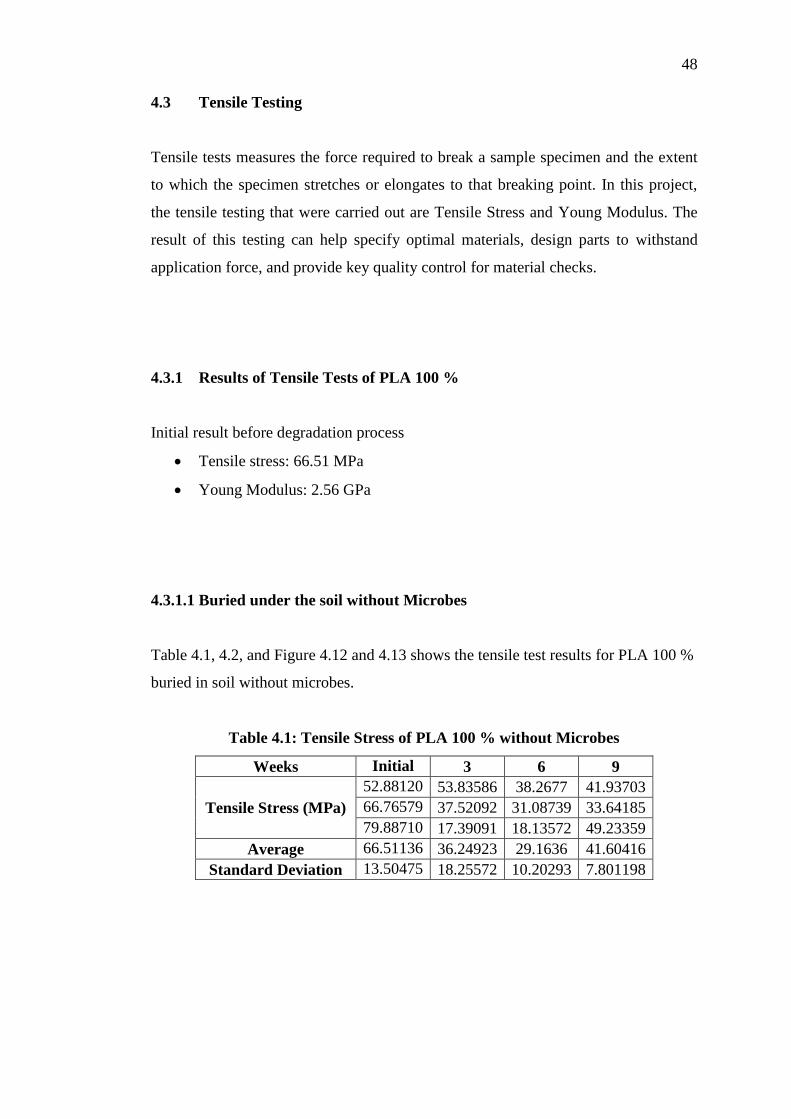
48
4.3 Tensile Testing
Tensile tests measures the force required to break a sample specimen and the extent
to which the specimen stretches or elongates to that breaking point. In this project,
the tensile testing that were carried out are Tensile Stress and Young Modulus. The
result of this testing can help specify optimal materials, design parts to withstand
application force, and provide key quality control for material checks.
4.3.1 Results of Tensile Tests of PLA 100 %
Initial result before degradation process
Tensile stress: 66.51 MPa
Young Modulus: 2.56 GPa
4.3.1.1 Buried under the soil without Microbes
Table 4.1, 4.2, and Figure 4.12 and 4.13 shows the tensile test results for PLA 100 %
buried in soil without microbes.
Table 4.1: Tensile Stress of PLA 100 % without Microbes
Weeks Initial 3 6 9
52.88120 53.83586 38.2677 41.93703
Tensile Stress (MPa) 66.76579 37.52092 31.08739 33.64185
79.88710 17.39091 18.13572 49.23359
Average 66.51136 36.24923 29.1636 41.60416
Standard Deviation 13.50475 18.25572 10.20293 7.801198

49
Figure 4.12: Tensile Stress versus buried time in soil without Microbes for PLA
100 %
Table 4.2: Young Modulus of PLA 100 % without Microbes
Weeks Initial 3 6 9
2.75 0.739 0.949 1.752
Young Modulus (GPa) 2.55 2.786 0.932 1.643
2.38 1.835 0.884 1.637
Average 2.56 1.786667 0.921667 1.677333
Standard Deviation 0.185203 1.024356 0.03371 0.064733
Figure 4.13: Young Modulus versus buried time in soil without Microbes for
PLA 100 %
0
5
10
15
20
25
30
35
40
45
50
55
60
65
70
0 3 6 9
Ten
sile
Ste
ss (
MP
a)
Weeks
0
0.5
1
1.5
2
2.5
3
0 3 6 9
You
ng M
od
ulu
s (G
Pa)
Weeks

50
From the results above, the tensile strength of PLA 100 % at initial (Tensile
stress: 66.51 MPa; Young Modulus: 2.56 GPa) shows a steep decline after 3 weeks
and not much changes were observed in the following 6th
and 9th
weeks.
4.3.1.2 Buried under the soil with Microbes
Table 4.3, 4.4 and Figure 4.14 and 4.15 shows the tensile test results PLA 100 %
buried in soil with microbes.
Table 4.3: Tensile Stress of PLA 100 % with Microbes
Weeks Initial 3 6 9
52.88120 25.24982 28.44394 27.06046
Tensile Stress (MPa) 66.76579 25.18982 21.85999 25.84748
79.88710 13.23401 15.22723 17.27032
Average 66.51136 21.22455 21.84372 23.39275
Standard Deviation 13.50475 6.920076 6.60837 5.336757
Figure 4.14: Tensile Stress versus buried time in soil with Microbes for PLA 100
%
0 5
10 15
20 25
30 35
40 45
50 55
60 65
70
0 3 6 9
Ten
sile
Str
ess
(MP
a)
Weeks

51
Table 4.4: Young Modulus of PLA 100 % with Microbes
Weeks Initial 3 6 9
2.75 0.741 0.78 1.128
Young Modulus (GPa) 2.55 0.716 0.797 0.789
2.38 0.445 0.866 0.855
Average 2.56 0.634 0.814333 0.924
Standard Deviation 0.185203 0.164155 0.045545 0.179725
Figure 4.15: Young Modulus versus buried time in soil with Microbes for PLA
100 %
Based on this result, it is observed that the tensile strength of the PLA
samples buried with microbe shows a steeper decline compare with the PLA samples
buried without the microbe. However, similar traits of PLA samples buried in soil
without microbe were observed on the PLA samples buried in soil with microbe on
the 6th
week and 9th
week as it shows little changes on that period of time.
4.3.2 Results of Tensile Test of PLA/Starch 80/20
Initial result before degradation process
Tensile stress: 22.18 MPa
Young Modulus: 0.92 GPa
0
0.5
1
1.5
2
2.5
3
0 3 6 9
You
ng M
od
ulu
s (G
Pa)
Weeks

52
4.3.2.1 Buried under the soil without Microbes
Table 4.5, 4.6 and Figure 4.16 and 4.17 shows the tensile test result for PLA/Starch
80/20 buried in soil without microbes.
Table 4.5: Tensile Stress of PLA/Starch 80/20 without Microbes
Weeks Initial 3 6 9
21.68247 13.98007 12.5667 9.0777
Tensile Stress (MPa) 30.33864 18.67474 16.2022 10.2678
14.50498 17.851 14.56789 13.5567
Average 22.17536 16.83527 14.4456 10.9674
Standard Deviation 7.928329 2.506743 1.820833 2.320009
Figure 4.16: Tensile Stress versus buried time in soil without Microbes for
PLA/Starch 80/20
Table 4.6: Young Modulus of PLA/Starch 80/20 without Microbes
Weeks Initial 3 6 9
0.579 0.581 0.552 0.322
Young Modulus (GPa) 1.795 1.395 0.615 0.317
0.370 0.754 0.456 0.309
Average 0.915 0.910 0.541 0.316
Standard Deviation 0.76952 0.428837 0.080069 0.006557
0
5
10
15
20
25
0 3 6 9
Ten
sile
Str
ess
(MP
a)
Weeks

53
Figure 4.17: Young Modulus versus buried time in soil without Microbes for
PLA/Starch 80/20
Refer to Figure 4.16, it is observed that the tensile strength of these samples
are generally lower compare with pure PLA. However, the decrease in tensile
strength was not as steep as compared with pure PLA as it was observed to decrease
at a much more constant rate with time.
4.3.2.2 Buried under the soil with Microbes
Table 4.7, 4.8 and Figure 4.18 and 4.19 shows the tensile test result for PLA/Starch
80/20 buried in soil with microbes.
Table 4.7: Tensile Stress of PLA/Starch 80/20 with Microbes
Weeks Initial 3 6 9
21.68247 16.6052 12.4456 8.765
Tensile Stress (MPa) 30.33864 11.7865 14.2567 10.2525
14.50498 9.7611 13.9888 11.6982
Average 22.17536 12.7176 13.5637 10.23857
Standard Deviation 7.928329 3.51577 0.977524 1.46665
0
0.2
0.4
0.6
0.8
1
1.2
1.4
1.6
1.8
0 3 6 9
You
ng M
od
ulu
s (G
Pa)
Weeks

54
Figure 4.18: Tensile Stress versus buried time in soil with Microbes for
PLA/Starch 80/20
Table 4.8: Young Modulus of PLA/Starch 80/20 with Microbes
Weeks Initial 3 6 9
0.579 0.065 0.046 0.031
Young Modulus (GPa) 1.795 0.057 0.052 0.044
0.370 0.077 0.043 0.042
Average 0.915 0.066333 0.047 0.039
Standard Deviation 0.76952 0.010066 0.004583 0.007
Figure 4.19: Young Modulus versus buried time in soil with Microbes for
PLA/Starch 80/20
0
5
10
15
20
25
30
35
0 3 6 9
Ten
sile
Str
ess
(MP
a)
Weeks
0
0.2
0.4
0.6
0.8
1
1.2
1.4
1.6
1.8
0 3 6 9
You
ng M
od
ulu
s (G
Pa)
Weeks

55
These samples however show a steep decrease in its tensile strength at the 3rd
week under the soil. Based on this result, it clearly indicates that the presence of
microbes plays an important role in degradation as the tensile strength are observed
to be much lower compared with the sample buried without microbes.
4.3.3 Results of Tensile Test of PLA/Starch 50/50
Initial result before degradation process
Tensile stress: 10.87 MPa
Young Modulus: 0.27 GPa
4.3.3.1 Buried under the soil without Microbes
Table 4.9, 4.10 and Figure 4.20 and 4.21 shows the tensile test result for PLA/Starch
50/50 buried in soil without microbes.
Table 4.9: Tensile Stress of PLA/Starch 50/50 without Microbes
Weeks Initial 3 6 9
7.91589 7.58318 6.2234 5.1257
Tensile Stress (MPa) 13.69790 5.10953 5.1257 5.8211
10.98220 6.57181 6.3216 5.0766
Average 10.86533 6.421507 5.890233 5.341133
Standard Deviation 2.892776 1.243656 0.663923 0.416388

56
Figure 4.20: Tensile Stress versus buried time in soil without Microbes for
PLA/Starch 50/50
Table 4.10: Young Modulus of PLA/Starch 50/50 without Microbes
Weeks Initial 3 6 9
0.139 0.267 0.223 0.199
Young Modulus (GPa) 0.298 0.157 0.253 0.1764
0.377 0.319 0.255 0.155
Average 0.271 0.247667 0.243667 0.1768
Standard Deviation 0.121 0.082712 0.017926 0.022003
Figure 4.21: Effect of Young Modulus with time of PLA/Starch 50/50 without
Microbes
0
2
4
6
8
10
12
14
16
0 3 6 9
Ten
sile
Str
ess
(MP
a)
Weeks
0
0.05
0.1
0.15
0.2
0.25
0.3
0.35
0.4
0.45
0 3 6 9
You
ng M
od
ulu
s (G
Pa)
Weeks

57
Results from Figure 4.20 show that the tensile strength of these samples are
lower compare with the PLA/Starch 80/20 and a lot lower than pure PLA. Based on
this observation it can be seen that the relationship between the amount of starch and
the strength of the blends are once again proven to be valid, where the higher the
amount of starch in the sample gives a lower mechanical properties of blends.
4.3.3.2 Buried under the soil with Microbes
Table 4.11, 4.12 and Figure 4.22 and 4.23 shows the tensile test result for
PLA/Starch 50/50 buried in soil with microbes.
Table 4.11: Tensile Stress of PLA/Starch 50/50 with Microbes
Weeks Initial 3 6 9
7.91589 5.16926 4.076 3.7777
Tensile Stress (MPa) 13.69790 5.11509 3.678 4.1224
10.98220 5.13022 4.253 2.9763
Average 10.86533 5.13819 4.002333 3.625467
Standard Deviation 2.89278 0.027951 0.294493 0.58802
Figure 4.22: Tensile Stress versus buried time in soil with Microbes for
PLA/Starch 50/50
0
2
4
6
8
10
12
14
16
0 3 6 9
Ten
sile
Str
ess
(MP
a)
Weeks

58
Table 4.12: Young Modulus of PLA/Starch 50/50 with Microbes
Weeks Initial 3 6 9
0.139 0.059 0.058 0.044
Young Modulus (GPa) 0.298 0.067 0.0567 0.021
0.377 0.055 0.059 0.0199
Average 0.271 0.060333 0.0579 0.0283
Standard Deviation 0.121 0.00611 0.001153 0.013608
Figure 4.23: Young Modulus versus buried time in soil with Microbes for
PLA/Starch 50/50
The tensile strength result of this sample is the lowest among all samples and
tests being done in this project. This is due to the higher amount of starch presence in
the sample and also the presence of microbe in the soil, thus making its
biodegradation rate higher compare to other test conditions and formulations in this
project.
Figure 4.24 to 4.27 shows the comparison of the test results.
0
0.05
0.1
0.15
0.2
0.25
0.3
0.35
0.4
0.45
0 3 6 9
You
ng M
od
ulu
s (G
Pa)
Weeks
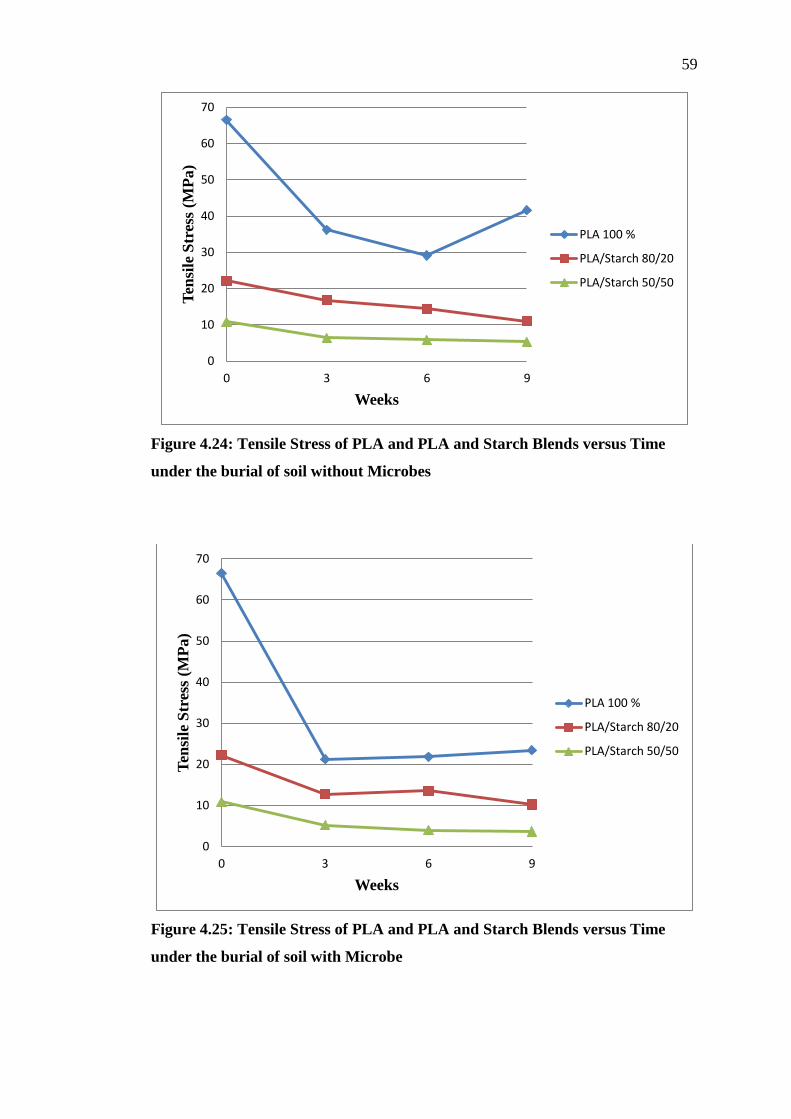
59
Figure 4.24: Tensile Stress of PLA and PLA and Starch Blends versus Time
under the burial of soil without Microbes
Figure 4.25: Tensile Stress of PLA and PLA and Starch Blends versus Time
under the burial of soil with Microbe
0
10
20
30
40
50
60
70
0 3 6 9
Ten
sile
Str
ess
(MP
a)
Weeks
PLA 100 %
PLA/Starch 80/20
PLA/Starch 50/50
0
10
20
30
40
50
60
70
0 3 6 9
Ten
sile
Str
ess
(MP
a)
Weeks
PLA 100 %
PLA/Starch 80/20
PLA/Starch 50/50
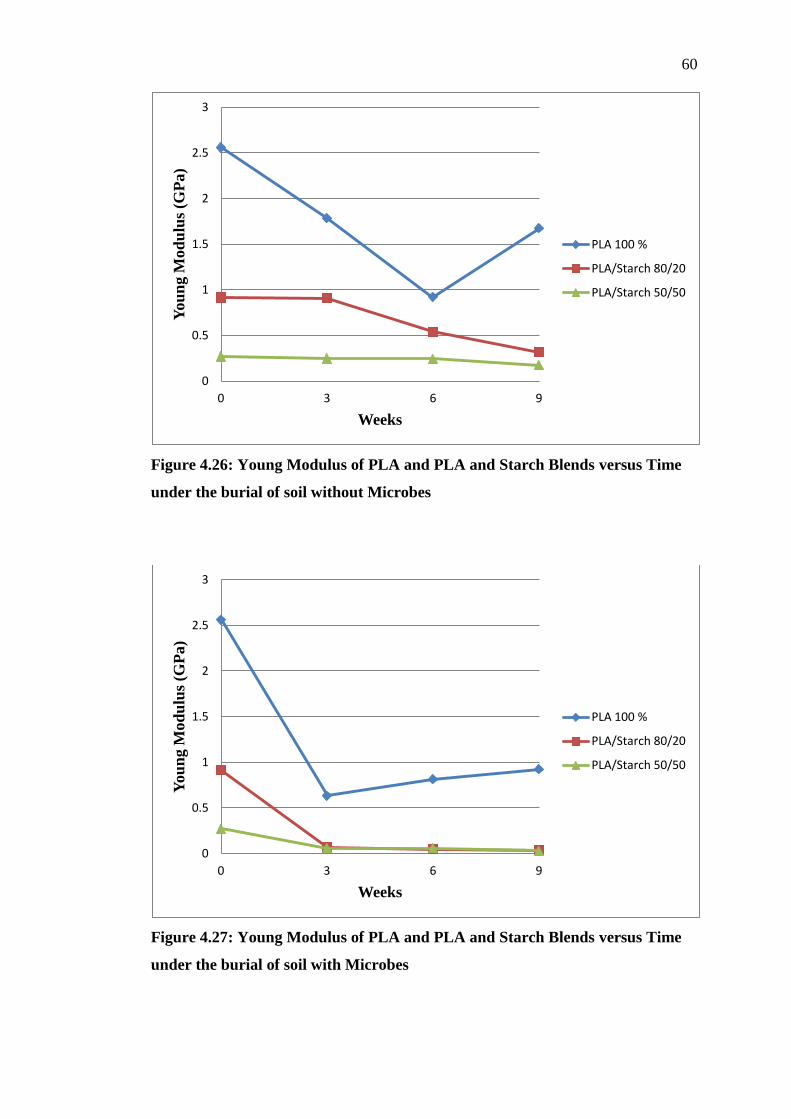
60
Figure 4.26: Young Modulus of PLA and PLA and Starch Blends versus Time
under the burial of soil without Microbes
Figure 4.27: Young Modulus of PLA and PLA and Starch Blends versus Time
under the burial of soil with Microbes
0
0.5
1
1.5
2
2.5
3
0 3 6 9
Yo
un
g M
od
ulu
s (G
Pa
)
Weeks
PLA 100 %
PLA/Starch 80/20
PLA/Starch 50/50
0
0.5
1
1.5
2
2.5
3
0 3 6 9
Yo
un
g M
od
ulu
s (G
Pa)
Weeks
PLA 100 %
PLA/Starch 80/20
PLA/Starch 50/50
61
Biodegradation of PLA is generally slow in ambient temperature in soils.
This case can be clearly evidenced by the little changes in tensile strength and
modulus of pure PLA after a matter of time. Similar results were obtained in samples
buried with microbe although a steep decline at initial and a generally lower tensile
strength and modulus were observed. The slow degradation rates of PLA are due to
its high molecular weight. For PLA to degrade and disintegrate quickly, it will need
to be placed under high temperature and high humidity, as in active compost.
Tensile strength of PLA and starch blends also illustrated a steep decline at
initial and than a fairly constant rate of declination for the remainder of the burial
period. This is due to the absorption of water during soil burial with consequent
weakening of the PLA and starch adhesion. The fairly constant rate of declination in
tensile strength with concurrent loss of starch suggests that there was little or no
adhesion of starch to the polymer matrix once moistened in soil.
From Figure 4.24 and 4.25, it can be observed that samples buried under the
soil with the addition of microbes generally produces a lower tensile strength as time
progresses compare to samples buried under the soil without the addition of
microbes. In this study, all samples were placed under the conditions where they
were exposed to sunlight, rain drops and the environment during the testing period.
This exposure created an environment that enables the growth of microbes on both
soil conditions. Presence of microbes in the soil is important. This is because without
the presence of microbes to hydrolyse the PLA, biodegradation process will not
occur. For soil mixed with microbes, these environmental conditions promoted the
growth of microbes that was initially present in the soil. Thus, the concentration of
microbes in the soil mixed with microbes will be higher than the microbes present in
the soil without the addition of microbes.
Based on the results obtained, it can be observed that samples having a higher
content of starch typically give a lower strength. This is because having a higher
content of starch generally gives a relatively weak PLA and starch adhesion and it
also provide a larger surface area for enzymatic degradation of microbes. As the
starch content increases it also decreases the effective cross-section area of the
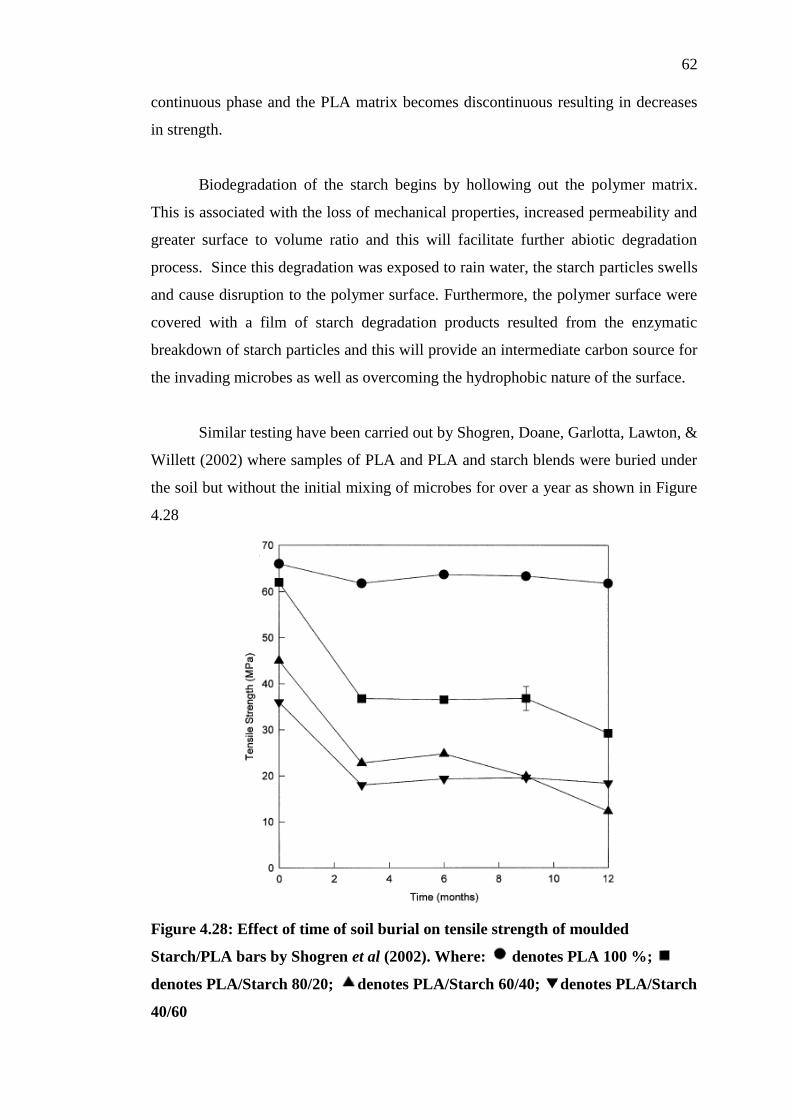
62
continuous phase and the PLA matrix becomes discontinuous resulting in decreases
in strength.
Biodegradation of the starch begins by hollowing out the polymer matrix.
This is associated with the loss of mechanical properties, increased permeability and
greater surface to volume ratio and this will facilitate further abiotic degradation
process. Since this degradation was exposed to rain water, the starch particles swells
and cause disruption to the polymer surface. Furthermore, the polymer surface were
covered with a film of starch degradation products resulted from the enzymatic
breakdown of starch particles and this will provide an intermediate carbon source for
the invading microbes as well as overcoming the hydrophobic nature of the surface.
Similar testing have been carried out by Shogren, Doane, Garlotta, Lawton, &
Willett (2002) where samples of PLA and PLA and starch blends were buried under
the soil but without the initial mixing of microbes for over a year as shown in Figure
4.28
Figure 4.28: Effect of time of soil burial on tensile strength of moulded
Starch/PLA bars by Shogren et al (2002). Where: denotes PLA 100 %;
denotes PLA/Starch 80/20; denotes PLA/Starch 60/40; denotes PLA/Starch
40/60
63
Based on the result obtained by Shogren et al. (2002), it can be observed that
the tensile strength of the PLA and starch blends obtained by Shogren et al. are
generally higher than the result obtained in this research. This is because samples
prepared by Shogren et al. (2002) were done by injection moulding. This observation
clearly evidenced that the increased in crystallinity due to compression moulding
process will give a lower tensile strength than injection moulding as explained by Yu
et al. (2006). A summary of Shogren et a.l (2002) results indicates that injection
moulded PLA are slow to degrade in soil. Even with the addition of starch for up to
60 % by weight in the PLA and starch blends, it does not significantly accelerate the
degradation of PLA and most of the starch remains intact after 1 year in soil.
The Young Modulus for PLA and starch blends decreases with time as the
starch content increases as shown in Figure 4.26 and 4.27. Similar testing was done
by Ke and Sun (2000) using corn starch and wheat starch and it shows that the
modulus of the blends increases slightly as the starch content increases. However, in
this study the starch used is tapioca starch and from Figure 4.26 and 4.27 it shows
that the increased in starch content decreases the modulus of the blends. This is
probably due to the increased in the discontinuous phase of PLA matrix which is
stiffer then the tapioca starch granules.
In this study, no compatibilizers or additives were used in the PLA and starch
blends thus resulting in a blend of high brittleness and low impact resistance. This is
due to the hydrophobic PLA and hydrophilic starch that leads to a poor adhesion
between two components. To improve the interfacial interactions of these blends,
many types of compatibilizer and additives have been investigated. Additives such as
methylenediphenyl diisocyanate (MDI) as proposed by Wang et al. (2001) or
compatibilizer such as dioctyl maleate (DOM) as proposed by Zhang and Sun (2004)
have shown to provide better interfacial interactions between the two components.
CHAPTER 5
CONCLUSIONS AND RECOMMENDATIONS
5.1 Conclusions
PLA polymers have recently gained enormous attention as a replacement for
conventional synthetic packaging materials. By being truly biodegradable and
derived from renewable resources, this could provide customers with extra end-use
benefits such as avoiding paying “green tax” in Germany or meeting environmental
regulations in Japan, thus, making PLA a growing alternative for packaging material
in numerous demanding markets (Yu et al., 2006).
In terms of appearance and characteristics, neat PLA and PLA blends had
slight variations due to the presence and amount of starch addition. The appearance
of PLA 100 % samples was observed to have a relatively smooth surface and a
relatively dull yellowish colour. As for PLA/Starch 80/20 and 50/50 samples, it is
beige in colour and has a reflective and smooth surface but uneven due to the usage
OHP transparencies during compression moulding. In terms of characteristics, PLA
100 % samples were observed to be considerably brittle and has small amount of
ductility. PLA/Starch 80/20 samples were very fragile, brittle and weak. However,
PLA/Starch 50/50 samples were observed to be even weaker and fragile then
PLA/Starch 80/20. These observations clearly states that relationship between the
presence of starch and the amount of starch are related with the integrity of the
sample where the presence and increment of starch decreases the mechanical
properties of the samples.
As for post-degradation appearance, generally no significant changes were
observed in samples buried under the soil without addition of microbes. However,

65
several changes were observed in the samples buried under the soil with addition of
microbes. PLA 100 % samples appear to be decolourized after being buried under
the soil mixed with microbes for 9 weeks. PLA/Starch 80/20 appears to be distorted
and swollen, displaying some brownish colour on its surface due to rain water and
heat from the sunlight that causes microbes to attack on its surface area. As for
PLA/Starch 50/50 samples, similar observations with PLA/Starch 80/20 samples
were observed for the first 6 weeks. However, crevices were observed to appear on
the surface at the 9th
week.
Based on this study, it can be summarised that neat PLA are generally slow to
degrade in soil. It is observed to have steep decline in its tensile stress and elasticity
at initial and than a fairly constant rate of declination for the remainder of the burial
period. However, with the addition of microbes into the soil and tapioca starch into
the PLA samples the degradation rates are higher so a significant decreased in tensile
stress and elasticity were observed. Addition of microbes into the soil increases the
hydrolysis rate to initiate the biodegradation process of PLA. Furthermore, addition
of tapioca starch would give a weak adhesion against the PLA surface, a larger
surface area for enzymatic degradation of microbes, and also decreased in the
effective cross-section area of the PLA continuous phase, thus, resulting in decreases
of tensile stress and elasticity. Other than the presence of tapioca starch, the
increment in the amount of tapioca starch added in the samples were also observed to
decrease the tensile stress and elasticity as it would give an weaker adhesion against
the PLA surface.
66
5.2 Recommendations
Based on the results from this study, it appears that soil burial might not be an
acceptable way to dispose of such materials either intentionally or by careless
littering. This is because PLA materials may require years to fully degrade depending
on the particular environment. Problems previously seen on the use of other types of
biodegradable polymers such as partially degraded plastic bags or mulch blowing
around and strangulation or intestinal blockage in animals could be potential
problems for PLA as well. Thus, it is important to understand that PLA articles
should not be randomly discarded in the environment although it would be
compostable.
For proper disposal of PLA in the natural environment, alternatives such as
copolymerization and blending in acidic compounds have been suggested. Other than
that, addition of proteins which might induce the production of proteases by
microorganisms that had been found to degrade PLA could also be considered.
However, preferred methods of disposal would be composting or recycling or both.

67
REFERENCES
Auras, R., Harte B., Selke, S., & Hernandez, R. (2003). Mechanical, physical, and
barrier properties of poly(lactide) films. J Plastic Film Sheet 19,123–35.
Azman, H., Yee, J.W., Ko, C.Y., & Lukman U.A.J. (2002). The Use of Brabender
Plasticorder to Study the Fusion Behaviour of Calcium Carbonate Filled Impact-
Modified PVC-U. Department of Polymer Engineering University Technology
Malaysia, 2.
Bogaert, J.C. & Coszach, P. (2000). Poly(lactic acids): a potential solution to
plasticwaste dilemma. Macromol Symp 153, 287–303.
Datta, R., & Henry, M. (2006). Lactic acid: recent advances in products, processes
and technologies: a review. J Chem Technol Biotechnol 81,1119–129.
Di Lorenzo, M.L. (2005). Crystallization behavior of poly(l-lactic acid). EurPolym J
41, 569–75.
Dorgan, J.R., Lehermeier, H., & Mang, M. (2000). Thermal and rheological
properties of commercial-grade poly(lactic acids)s. J Polym Environ 8,1–9.
Lu, D.R., Xiao,C.M., & Xu, S.J. (2009). Starch-based completely biodegradable
polymer materials. eXPRESS Polymer Letters 3(6), 367.
Frazza, E. J., & Schmitt, E. E. (1971). A new absorbable suture. J. Biomed. Mater.
Res. Symp. 1,43-58.
Giles, F.H., Wagner, J.R., & Mount, E.M. (2005). Extrusion, the definitive
processing guide and handbook. 1st ed. New York: William Andrew Publishing,
547 p.
Pranamuda, H., Tokiwa, Y., & Tanaka, H. (1997). Polylactide Degradation by an
Amycolatopsis sp. Applied and Environmental Microbiology Vol.63, No.4, 169.
Hartmann, M.H. (1998). High-molecular-weight polylactic acid polymers. In:Kaplan
DL, editor. Biopolymers from renewable resources. Berlin: Springer. p 367–411.
Huang, S. J. (1989). Biodegradable polymers. Polymers—Biomaterials and Medical
Applications. J. J. Kroschwitz, ed. Wiley and Sons: New York.
68
Ikada, Y., Jamshidi, K., Tsuji, H., & Hyon, S.H. (1987). Stereocomplex formation
between enantiomeric poly(lactides). Macromolecules1987; 20,904–6.
Jang, W.J., Shin, B.Y., Lee, T.J., & Narayan, R. (2007). Thermal properties and
morphology of biodegradable PLA/starch compatibilized blends. J. Ind. Eng.
Chem. 2007, 13, 457-464.
Leadprathom, J., Suttiruengwong, S., Threepopnatkul, P., & Seadan, M. (2010).
Compatibilized Polylactic Acid/ Thermoplastic Starch by Reactive Blend. Journal
of Metals, Materials and Minerals 20(3). 87.
Johnson, R.M., Mwaikambo, L.Y., & Tucker, N. (2003). Biopolymers. Rapra
RevRep 43, 1–26.
Sriroth, K., Chollakup, R., Piyachomkwan, K., & Oates, C.G. (2000). Biodegradable
Plastics From Cassava Starch in Thailand, 538-541.
Li, L., Tang, S.C., Wang, Q.H., Pan, Y.K., & Wang, T.L. (2006). Preparation of
poly(lactic acid) by direct polycondensation in azeotropic solution. J East China
Univ Sci Technol 32,672–5.
Lim, H.A., Raku, T., & Tokiwa, Y. (2005). Hydrolysis of polyesters by serine
proteases. Biotechnol Lett 27,459–464.
Yu, L., Dean, K., & Lin, L. (2006). Polymer blends and composites from
renewable resources. Prog. Polym. Sci 3, 583.
Lunt, J. (1998). Large-scale production, properties and commercial applications of
polylactic acid polymers. Polym Degrad Stab 59,145–152.
Kolybaba, M., Tabil, L.G., Panigrahi, S., Crerar, W.J., Powell, T., & Wang, B.
(2003). Biodegradable Polymers: Past, Present, and Future. An ASAE Meeting
Presentation. RRV03-0007, 3-4.
Jamshidian, M., Tehrany, E.A., Imran, M., Jacquot, M., & Desorby, S. (2010). Poly-
Lactic Acid: Production, Applications, Nanocomposites, and Release Studies,
Comprehensive Reviews in Food Science and Food Safety, 1-16.
Mehta, R., Kumar, V., Bhunia, H., & Upadhyay, S.N. (2005). Synthesis of
poly(lactic acid): a review. J Macromol Sci Polym Rev 45,325–49.
Mehta, R., Kumar, V., & Upadhyay, S.N. (2007). Mathematical modeling of the
poly(lactic acid) ring-opening polymerization using stannous octoate as a catalyst.
Polym Plast Technol Eng 46,933–7.
Russo, M.A.L., O’Sullivan, C., Rounsefell, B., Halley, P. J., Truss, R., & Clarke, W.
P. (2008). The anaerobic degradability of thermoplastic starch: Polyvinyl alcohol
blends: Potential biodegradable food packaging materials. Bioresource
Technology Vol.100, No.5, 1.

69
Miller, N. D., & Williams, D. F. (1987). On the biodegradation of poly-b-
hydroxybutyrate (PHB) homopolymer and poly-b-ydroxybutyratehydroxyvalerate
copolymers. Biomaterials 8, 129-137.
Martin, O. & Averous, L. (2001). Poly(lactic acid): plasticization and properties of
biodegradable multiphase systems. Polymer 42, 6209.
Oda, Y., Yonetsu, A., Urakami, T., & Tomomura, K. (2000). Degradation of
polylactide by commercial proteases. J Polym Environ 8, 29–32.
Ohkita, T. & Lee, S.H. (2006). Thermal degradation and biodegradability of
poly(lactic acid)/corn starch biocomposites. J Appl Polym Sci 100,3009–3017.
Pitt, C. G. (1990). Poly(e-caprolactone) and its copolymer. Biodegradable Polymers
as Drug Delivery Systems. R. Langer and M. Chasin, eds. Marcel Dekker: New
York.
Puaux, J.P, Banu, I., Nagy, I., & Bozga, G. (2007). A study of L-lactide ring-opening
polymerization kinetics. Macromol Symp 259,318–26.
Shogren, R.L., Doane, W.M., Garlotta, D., Lawton, J.W., & Willett, J.L. (2002).
Biodegradation of starch/polylactic acid/ poly(hydroxyester-ether) composite bars
in soil. Polymer Degradation and Starbility 79(2003), 409-411.
Ramsay, B. A., Langlade, V., Carreau, P. J., & Ramsay, J. A. (1993).
Biodegradability and mechanical properties of poly-(b-hydroxybutyrateco-b-
hydrixyvalerate)-starch blends. Appl. Environ. Microbiol. 59,1242-1246.
Reed, A. M., & Gilding, D. K. (1981). Biodegradable polymers for use in surgery-
poly(glycolic acid)/poly(lactic acid) homo and copolymers: 2. In vitro
degradation. Polymer 22,494-498.
Shinoda, H., Asou, Y., Kashima, T., Kato, T., Tseng, Y., & Yagi, T. (2003).
Amphiphilic biodegradable copolymer, poly(aspartic acid-co-lactide):
acceleration of degradation rate and improvement of thermal stability for
poly(lactic acid), poly(butylenes succinate) and poly( -caprolactone). Polym
Degrad Stabil 2003;80:241-50.
Siew, Y.L., Han, C., & Hana, M.A. (2008). Preparation and characterization of
tapioca starch-poly(lactic acid) nanocomposite foams by melt intercalation based
on clay type. Industrial Crops and Products 28, 95.
Ke,T. & Sun, X. (2000). Physical Properties of Poly(Lactic Acid) and Starch
Composites with Various Blending Ratios. Cereal Chem. 77(6), 764-765.
Urayama, H., Kanamori, T., & Kimura, Y. (2002). Properties and biodegradability of
polymer blends of poly(l-lactide)s with different optical purity of the lactate units.
Macromol Mater Eng 287,116–121.
70
Vink, E.T.H., Rabago, K.R, Glassner, D.A, & Gruber, P.R. (2003). Applications of
life cycle assessment to NatureWorks® polylactide (PLA) production. Polym
Degrad Stab 80,403–19.
Vink, E.T.H., Rajbago, K.R., Glassner, D.A., Springs, B., O’Connor, R.P., Kolstad,
J., & Gruber, P.R. (2004). The sustainability of NatureWorks polylactide
polymers and ingeo polylactide fibers: an update of the future. Initiated by the 1st
International Conference on Bio-based Polymers (ICBP 2003), November 2003,
Saitama, Japan. Macromol Biosci 4,551–64.
Vink, E.T.H., Glassner, D.A., Kolstad, J.J., Wooley, R.J., & O’Connor, R.P. (2007).
The eco-profiles for current and near-future NatureWorks® polylactide (PLA)
production. Ind Biotechnol 3:58-81.
Wang, H., Sun, X., & Seib, P.(2001). Strengthening blends of poly(lactic acid) and
starch with methylenediphenyl diisocyanate. J Appl Polym Sci 2001;82:1761–7.
Williams, D.F. (1981). Enzymatic hydrolysis of polylactic acid. EngMed 10, 5–7.
Rudeekit, Y., Numnoi, J., Tajan, M., Chaiwutthinan, P., & Leejarkpai, T. (2009).
Determining Biodegradability of Polylactic Acid under Different Environments.
Journal of Metals, Materials and Minerals 18(2), 84.
Tokiwa, Y. & Calabia, B.P. (2006). Biodegradability and biodegradation of
poly(lactide). Appl Microbiol Biotechnol, 72, 244-245.
Tokiwa, Y., Calabia, B.P., Ugwa, C.U., & Aiba, S. (2009). Biodegradability of
Plastics, International Journal of Molecular Sciences, 3723-3732.
Zhang, J.F. & Sun, X.(2004). Mechanical and thermal properties of poly(lactic
acid)/starch blends with dioctyl maleate. J Appl Polym Sci 2004;94, 1697–704.

APPENDIX A
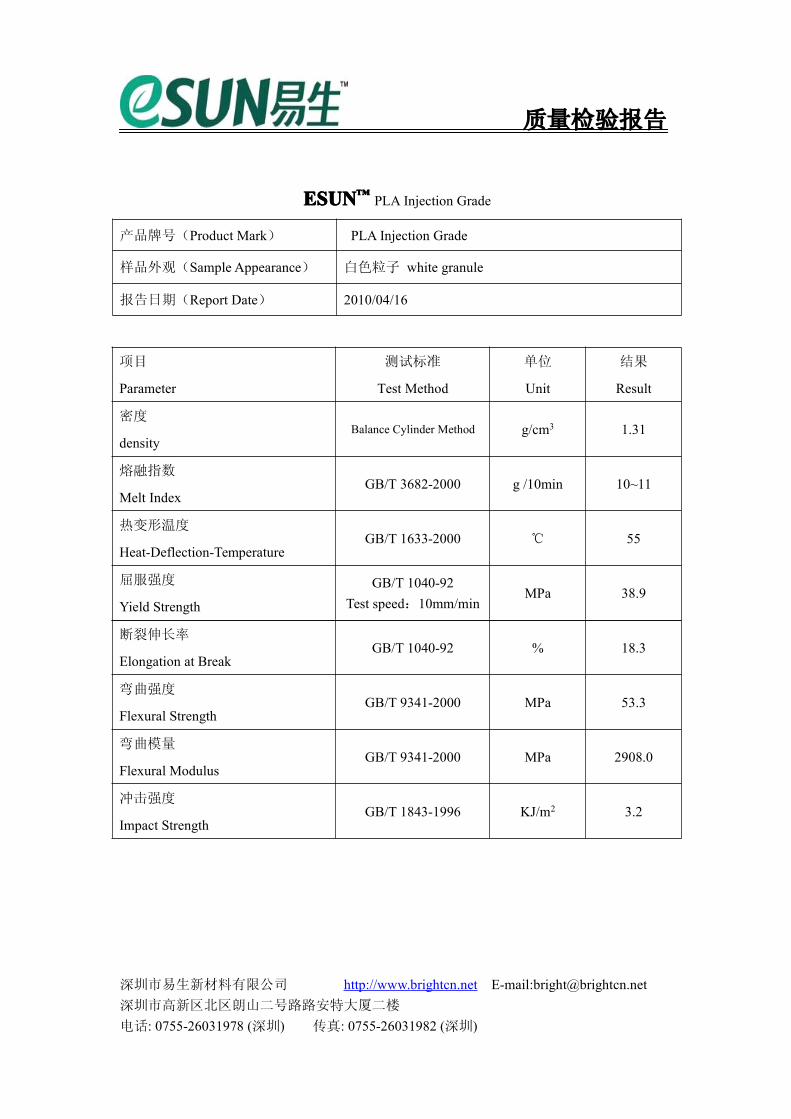
质量检验报告
ESUNESUNESUNESUN™™™™ PLA Injection Grade
产品牌号(Product Mark) PLA Injection Grade
样品外观(Sample Appearance) 白色粒子 white granule
报告日期(Report Date) 2010/04/16
项目
Parameter
测试标准
Test Method
单位
Unit
结果
Result
密度
densityBalance Cylinder Method g/cm3 1.31
熔融指数
Melt IndexGB/T 3682-2000 g /10min 10~11
热变形温度
Heat-Deflection-TemperatureGB/T 1633-2000 ℃ 55
屈服强度
Yield Strength
GB/T 1040-92Test speed:10mm/min
MPa 38.9
断裂伸长率
Elongation at BreakGB/T 1040-92 % 18.3
弯曲强度
Flexural StrengthGB/T 9341-2000 MPa 53.3
弯曲模量
Flexural ModulusGB/T 9341-2000 MPa 2908.0
冲击强度
Impact StrengthGB/T 1843-1996 KJ/m2 3.2
深圳市易生新材料有限公司 http://www.brightcn.net E-mail:[email protected]深圳市高新区北区朗山二号路路安特大厦二楼
电话: 0755-26031978 (深圳) 传真: 0755-26031982 (深圳)