Embed Size (px)
Citation preview

Alumni Report
Data Current as of September 2017
Prepared by Office of Alumni Affairs

Office of Alumni Affairs 801 N. Rutledge St. • PO Box 19650 • Springfield, IL 62794-9650 217.545.7800 • siumed.edu/alumni
TO: Executive Committee Alumni Society Board of Governors FROM: Julie Robbs, M.A. Director, Office of Alumni Affairs DATE: October 10, 2017 RE: Alumni Report 2017 The Office of Alumni Affairs prepared the following 2017 Alumni Report that reflects selected characteristics of graduates of SIU School of Medicine. Throughout the years that this office has provided this report, the percentages have only slightly changed re: Current Specialty of Alumni in Practice. The data is current as of September 2017. Following are some highlights:
1. A total of 2,818 SOM students have graduated from the class of 1975 through the class of 2017. 2. Of those alumni in practice (2,176), the specialties that have attracted the greatest numbers are
Family Medicine (475/22%), Internal Medicine (416/19%), and Surgery (289/13%). I have provided a breakdown with the subspecialties.
3. Thirty-eight percent of alumni in practice are in one of the primary care specialties of Family
Medicine, General Internal Medicine, General Pediatrics or Medicine/Pediatrics. This remained the same percentage since 2015.
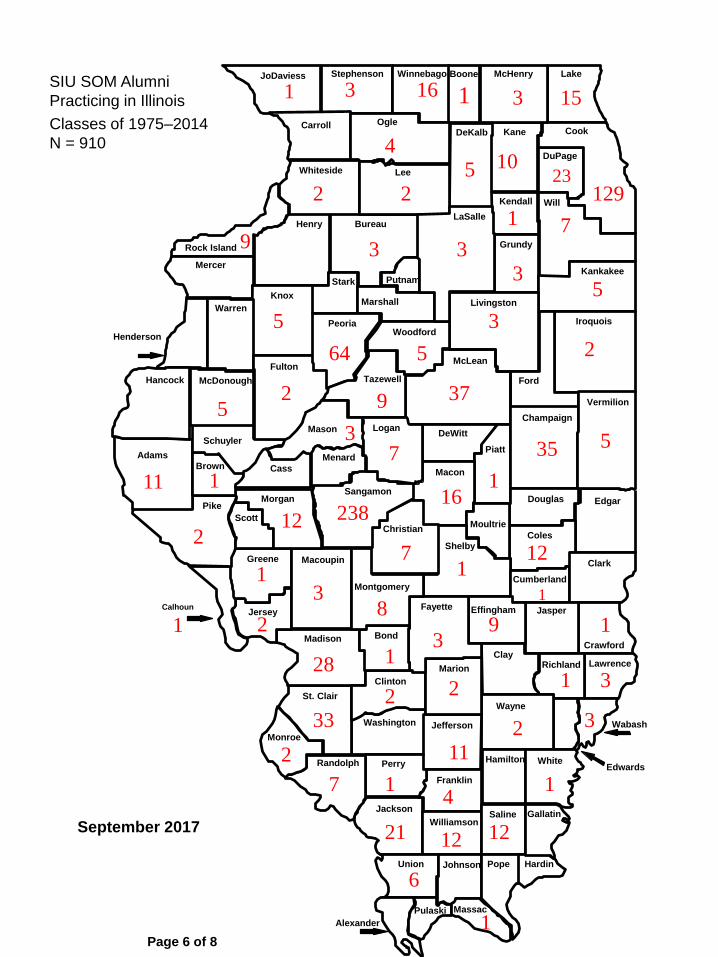
4. Alumni are currently practicing in most of the 50 states except Vermont. The largest number
(910/42%) is practicing in 72 counties in Illinois. There were increases in Arizona, California, Colorado, Florida, Georgia, New York, North Carolina, Pennsylvania, Texas, and Washington. States which decreased are Indiana, Missouri, and Virginia.
5. 29 alumni retired since November 2015
12 alumni have died since November 2015
In reviewing the M/F ratios, female graduates increased from 7 to 23 in the class of ’79 and then accounted for almost half of the class of ’87 but dropped until the class of ’94.
If you have any questions about this report, please contact me by email or at (217) 545-7800.

Other 124 (4%)
Practicing2,176 (78%)
Retired 98 (3%)
Deceased 64 (2%)
Total: 2,818
This figure includes all graduates of the School of Medicine through the class of 2017. The"practicing" category is comprised of those in private, academic, military or administrativepractice. The "other" category includes those not in practice, research, sabbatical or forwhom no practice status information was available.
CURRENT PROFESSIONAL STATUS OF ALUMNISIU SCHOOL OF MEDICINECLASSES 1975 - 2017
Residency/Fellowship356 (13%)
Page 1 of 8
Figure 1:

Anesthesiology102 (5%) Emergency
Medicine170 (8%)
Family Medicine475 (22%)
Internal Medicine416 (19%)
Medicine Pediatrics55 (2%)
ObstetricsGynecology146 (7%)
Pathology50 (2%)
Pediatrics200 (9%)
Neurology and Psychiatry 132 (6%)
Radiology102 (5%)
Surgery289 (13%)
All Others39 (2%)
CURRENT SPECIALTY OF ALUMNI IN PRACTICESIU SCHOOL OF MEDICINECLASSES OF 1975 - 2014
Total: 2,176
Page 2 of 8
Figure 2:

DISCIPLINE SUBSPECIALTIES OF PRACTICING ALUMNI
Critical Care 4 Total 55
Pain Medicine 11
Pediatric 7
General 80 Child Neurology 6
Total 102 Clinic Neurophysiology 3
Neuro Critical Care 1
Neuro Sleep Medicine 1
Medical Toxicology 1 Neuro Physical Medicine & Rehab 2
Pediatric 2 Neurology General 9
General 167 Child & Adolescent Psych 17
Total 170 Forensic Psych 1Geriatric Psych 4
Psych/Family Medicine 1
Emergency Medicine 8 Psych/Neurology General 5
Geriatric Medicine 2 Addiction Psych 1
Hospice & Palliative Medicine 4 Psychiatry General 81
Hospitalist 12 Total 132
Sleep Medicine 1
Sports Medicine 20
Family Med w/OB 5 Advanced Minimal Invasive Gynecology 1
General 423 Maternal & Fetal Medicine 3
Total 475 Reproductive Endocrinology/Infertility 2
Gynecologic Oncology 2
Reproductive 4
Dermatopathology 1 General 134
Pediatric Dermatology 2 Total 146
Dermatology 24
Clinical Cardiac Electrophysiology 1
Endocrinology, Diabetes &
Metabolism 8 Allergy & Immunology General 5
Hospice & Palliative Medicine 4 Phlebology 4Interventional Cardiology 9 Physical Med & Rehab Spinal Cord Injury 2Pulmonary Disease & Critical Care 11 Physical Med & Rehab 14Cardiovascular Disease 48 Physical Med & Rehab Pain Medicine 2
Critical Care Medicine 1 Preventive Medicine General 1
Gastroenterology 20 Preventive Med: Aerospace Medicine 2
Geriatric Medicine 7 Preventive Med: Occupational Medicine 9Hematology 4 Total 39
Hematology & Oncology 17
Hospitalist 31
Infectious Disease 10 Blood Banking/Transfusion Med 1
Nephrology 21 Anatomic & Clinical 35
Oncology 4 Cytopathology 1
Pulmonary Disease 11 Dermatopathology 1
Rheumatology 10 Forensic Pathology 9
Sleep Medicine 2 Hematology 2
Internal Med/Emergency Medicine 3 Pediatric 1
Internal Med/Family Medicine 1 Total 50
Internal Med/Neurology 1
Internal Med/Psychiatry 5
General 160 *All subspecialties are self-reported
Total 416
Other
Pathology
Anesthesiology
Emergency Medicine
Family Medicine
Internal Medicine
Neurology & Psychiatry
OB/GYN
Internal Medicine/Pediatrics
Page 3 of 8
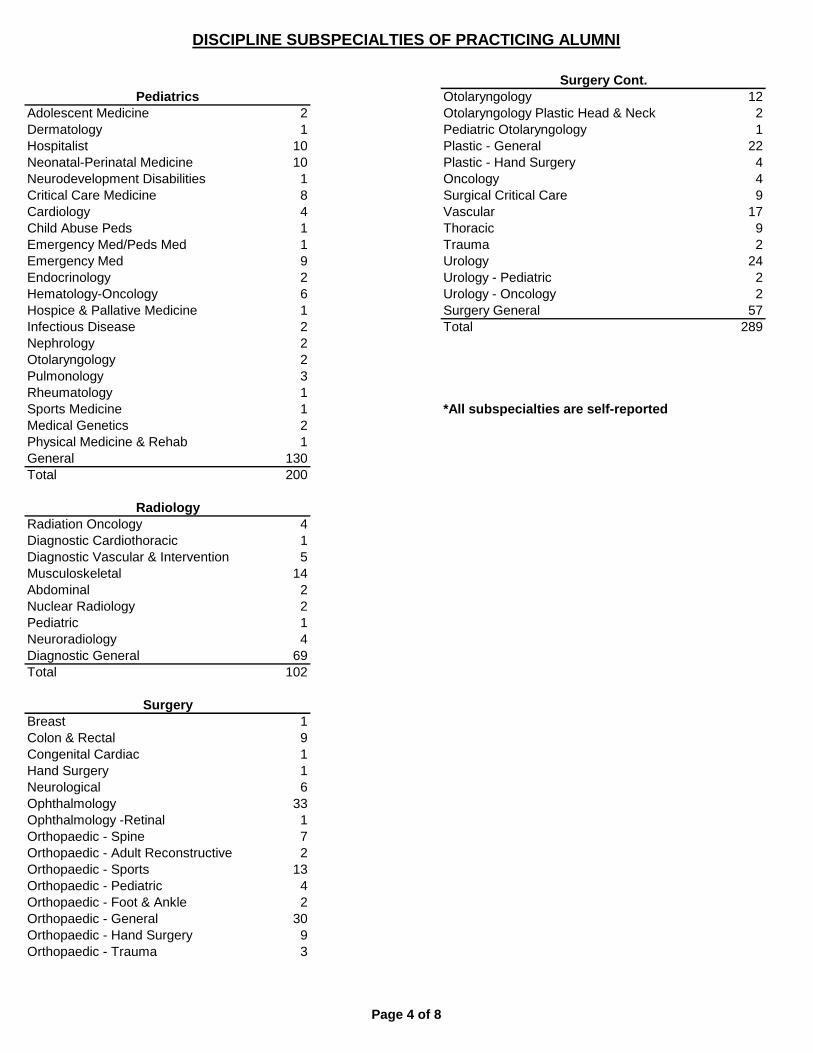
DISCIPLINE SUBSPECIALTIES OF PRACTICING ALUMNI
Otolaryngology 12
Adolescent Medicine 2 Otolaryngology Plastic Head & Neck 2
Dermatology 1 Pediatric Otolaryngology 1
Hospitalist 10 Plastic - General 22
Neonatal-Perinatal Medicine 10 Plastic - Hand Surgery 4
Neurodevelopment Disabilities 1 Oncology 4
Critical Care Medicine 8 Surgical Critical Care 9
Cardiology 4 Vascular 17
Child Abuse Peds 1 Thoracic 9
Emergency Med/Peds Med 1 Trauma 2
Emergency Med 9 Urology 24
Endocrinology 2 Urology - Pediatric 2
Hematology-Oncology 6 Urology - Oncology 2
Hospice & Pallative Medicine 1 Surgery General 57
Infectious Disease 2 Total 289
Nephrology 2
Otolaryngology 2
Pulmonology 3
Rheumatology 1
Sports Medicine 1 *All subspecialties are self-reported
Medical Genetics 2
Physical Medicine & Rehab 1
General 130
Total 200
Radiation Oncology 4
Diagnostic Cardiothoracic 1
Diagnostic Vascular & Intervention 5
Musculoskeletal 14
Abdominal 2
Nuclear Radiology 2
Pediatric 1
Neuroradiology 4
Diagnostic General 69
Total 102
Breast 1
Colon & Rectal 9
Congenital Cardiac 1
Hand Surgery 1
Neurological 6
Ophthalmology 33
Ophthalmology -Retinal 1
Orthopaedic - Spine 7
Orthopaedic - Adult Reconstructive 2
Orthopaedic - Sports 13
Orthopaedic - Pediatric 4
Orthopaedic - Foot & Ankle 2
Orthopaedic - General 30
Orthopaedic - Hand Surgery 9
Orthopaedic - Trauma 3
Pediatrics
Radiology
Surgery
Surgery Cont.
Page 4 of 8

4 OF 7Non-Primary Care
1,356 (62%)Primary Care820 (38%)
Family Medicine475 (22%)
Gen. Int. Medi.160 (7%)
Med./Peds.55 (2%)
Gen. Peds130 (6%)
Figure 3:ALUMNI IN PRIMARY CARE PRACTICESIU SCHOOL OF MEDICINEClasses of 1975 - 2014
TOTAL: 2,176
Page 5 of 8
1
LaSalleHenry Bureau
Rock Island
Mercer
Henderson
Warren
Knox
Stark Putnam
Marshall
Kendall Will
Grundy
Kankakee
PeoriaWoodford
Livingston
Iroquois
Vermilion
Ford
Champaign
McLean
Tazewell
Fulton
Mason
Cass
Menard
LoganDeWitt
Hancock McDonough
Schuyler
AdamsBrown
Pike
Scott
MorganSangamon
Calhoun
1
Greene
Jersey
Macoupin
Christian
Montgomery
Macon
Piatt
Moultrie
Shelby
Douglas Edgar
Coles
Cumberland
1
Clark
Madison Bond
Fayette Effingham Jasper
Crawford
St. Clair
Clinton
Marion
ClayRichland Lawrence
Monroe
Randolph
Washington
Perry
Jefferson
Wayne
Wabash
Edwards
Franklin
Hamilton White
Jackson
WilliamsonSaline Gallatin
Union Johnson Pope Hardin
Pulaski Massac
JoDaviess Stephenson
Carroll
Winnebago Boone McHenry Lake
OgleDeKalb Kane
DuPage
Cook
Whiteside Lee
Alexander
SIU SOM Alumni
Practicing in Illinois
Classes of 1975–2014
N = 910
1
3
3
23
3 16
1
5129
7
4
2
64 5
3
2
7
5
2
2
5
37
7
9
1116
1
535
212 238
3
28
8
1
2
33
11
3
12
7
11
1221
9
12
6
1
September 2017
3
2
2
41
9
5
3
1
3
2
10
15
3
3
1
2
1
Page 6 of 8
1

SIU SOM Alumni in Practice N = 2,176 Classes of 1975 – 2014
Page 7 of 8
WA
OR
CA NV
ID
MT
ND MN
WY
UT
AZ
CO
NM
SD
NE
KS
OK TX
LA
AR
MO
IA
WI
IL IN
MI
OH
TN
KY
MS AL GA
FL
SC
NC
VA
WV
DC - 3
MD - 12
DE
CT - 5
RI - 2
MA -6
PA
NJ - 3
NY
VT - 0
NH - 6 ME
1
HI 2 AK
38
19
62
4
7 2
4 5
5
39
45
9
73
7
22
8
37
26
136
5
19
104
910 126
38
38
36
10 16
71
39 15
45
18
16
18
4
42
2 - 1
Foreign: Greece – 1 Philippines – 1 Dominica – 2 Australia – 1 Cambodia – 1 Spain – 1 Netherlands – 1 New Zealand – 2 Nigeria – 1 Saudi Arabia – 1 United Arab Emirates – 1
September 2017
2

Page 8 of 8
SIU School of Medicine Alumni Overview – SEPTEMBER 2017
Total SIU-SOM Alumni (Classes 1975 – 2017): 2,818 Total Living Alumni: 2,754 Age Range Total 25 – 34 499 (18%) 35 – 44 675 (25%) 45 – 54 670 (24%) 55 – 64 699 (25%) 65+ 211 (8%)
2,754 Ages – Minimum: 25 Maximum: 81 Average: 47 Males 1,696 60% Females 1,122 40% Minority/Race: American Indian or Alaskan Native 11 Black or African American 211 Cuban 2 Hispanic/Other 18 Mexican American 28 Puerto Rican 10
Total Minority 280 (10%) Non—Minority: Asian or Pacific Islander 49 Chinese 17 Filipino 16 Indian or Pakistani 65 Japanese 6 Korean 14 No Response 5 Other Asian 20 Southeast Asian (not Vietnamese) 3 Vietnamese 10 White 2,333
Total Non-Minority 2,538 (90%)