Embed Size (px)
Citation preview

Engineering Report
Y
November 1984
ENVIRONMENTAL ENGINEERS, SCIENTISTS AND PLANNERS

1.0 INTRODUCTION 1.1 Background 1.2 Scope
TABLE OF CONTENTS
PAGE NO.
2.0 SLUDGE QUANTITIES
3.0 TESTS ON ALUM SLUDGE 3.1 Sludge Reduction 3.2 Sludge Settleability 3.3 Sludge Dewaterability 3.4 Aluminum Recovery
4.0 RECOVERED ALUM REUSE 4.1 Northside WWTP 4.2 Phosphorous Removal
2
4
6
7 8
9 13
15 15 16
TABLES
Follows Page
Table I - Solids Reduction Data 7 Table I1 - Sludge Settleability 8 Table I11 - Drying Bed Sizing Analysis 12 Table IV - Aluminum Recovery & Acid Demands 13
Follows Page
FIGURES
1. Sand Bed Test Cell Arrangement 7 2. Pilot Sand Drying Bed Tests 11 3. Flow Diagram Northside Sewage Treatment Plant 15 4. Northside Jar Test #1 16 5. Northside Jar Test # 2 16

L r
1.0 INTRODUCTION
A study of alum recovery and reuse was performed by Malcolm Pirnie, Inc. with assistance from the City of Durham, Division of Water Resources. The purpose of the study was to investigate the potential of alum recovery for solids reduction and improved solids handleability, and to produce a supply of recovered alum which can be recycled or reused by the City. The test results are presented and discussed in this report. It is anticipated that this report will be updated as additional pilot and full scale tests are performed.
1.1 Background
The Williams Water Treatment Plant is one of two water treatment plants which provide potable water to the City of Durham, North Carolina. Treatment processes at the water treatment plant (WTP) include the use of alum (aluminum sulfate) for coagulation of turbidity and for color removal. The raw water comes from a surface supply which feeds a 45 million gallon (MG) terminal reservoir adjacent to the plant.
Current practice at the water plant is to thicken sludge in one of two 75,000 gal concrete tanks. Polymer is then added and the sludge applied to one of four sand drying beds. Each bed is 5,148 sf for a total of 20,592 sf. The beds consist of approximately 1.5 € of sand media over an underdrain system of perforated pipe. Filtrate and decant from the drying beds, supernatant from the thickening tanks and backwash waste water are all collected in a wet well. The supernatant, filtrate and backwash wastewaters are then
-1-

I
. -
pumped back to the reservoir. The sludge is allowed to dry on the beds and the cake is ultimately disposed of in a landfill.
The currently available drying bed area is insufficient to treat the solids production. The capacity of the solids facility could be expanded so that current and future requirements for sludge processing can be met by construct- ing additional sand beds. The difficulty is that available property at the plant site is severely restricted. The site is shared by the WTP and part of the City's distribution maintenance crew. Room is available to construct two new beds for the addition of approximately 10,000 sf of bed area. Building more than two new beds would require demo- lition of the maintenance garage and its relocation to another site.
As an alternative to construction of some or all of the required new beds, this study has addressed the potential for alum recovery to reduce the solids handling problem.
1.2 Scope
The focus of this study was the potential for alum recovery to alleviate the solids handling problem at the Williams Water Treatment Plant. By dissolution of aluminum hydroxide precipitates, a significant fraction of the sludge total solids could be reduced. Drainage and drying may also be improved with a reduction 'of aluminum hydroxide which is typically difficult to dewater. Bench-scale tests were performed by both City and Malcolm Pirnie personnel. Solids reduction, sludge drainage rates, variable loading rates, PH adjustment and polymer conditioning were investigated on-site with thickened sludge which was acidified with sulfuric acid ( H 2 S 0 4 ) .
-2-

I ’ I
An important aspect of alum recovery is the reuse of the recovered alum. Reuse could lead to benefits in addi- tion to reducing solids handling. Recycle at the WTP for coagulation and use at the Wastewater Treatment Plants (WWTP) for phosphorus reduction were both investigated in bench-scale tests. The above options were analyzed to determine whether alum recovery and reuse are feasible for the City of Durham, and warrant further work.
-3-

2.0 SLUDGE QUANTITIES
It is possible to estimate the sludge production based on theoretically derived relationships between chemical addition, raw water characteristics and uItimate sludge production. Such a relationship is
S = 8.34 Q (xA + bTU) where,
S = lb of solids produced/day
Q = plant flow, mgd
A = alum dose, mg/l
TU = raw water turbidity, TU
x,b = relationship between the respective chemical contents and sludge production
The above relationship is fairly straightforward, except for defining the values of x and b. If it is assumed that every mole of alum addition produces two moles of Al(OH)3 then the value of x is 0.26. However, more realist- ically, every mole of alum produces two moles of A1(OH)3.3H20. The additional 3 moles of water are required to fill the coordination number of aluminum. In the later case, the value of x is 0.44. Past experience has shown a much better correlation between alum dose and solids production using the value of 0.44.
The relationship between turbidity and suspended solids is reflected in the value of b. This value is more difficult to define, and unfortunately very site specific.
-4-
r
Past experience has shown the value of b to vary between 0.5 and 2 for various studies conducted.
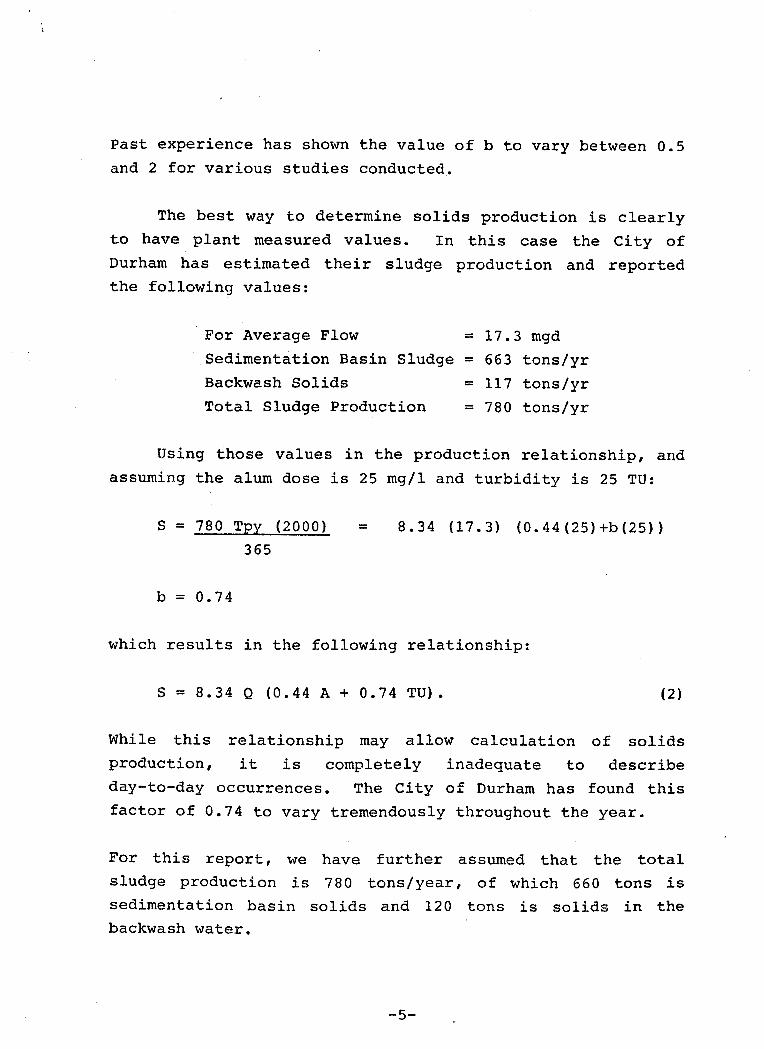
The best way to determine solids production is clearly to have plant measured values. In this case the City of Durham has estimated their sludge production and reported the following values:
For Average Flow Sedimentation Basin Sludge = 663 tons/yr Backwash Solids = 117 tons/yr Total Sludge Production = 780 tons/yr
= 17.3 mgd
Using those values in the production relationship, and assuming the alum dose is 25 mg/l and turbidity is 25 TU:
S = 780 Tpy (2000) = 8.34 (17.3) (0.44(25)+b(25)) 365
b = 0.74
which results in the following relationship:
S = 8.34 Q (0.44 A + 0.74 TU). (2)
While this relationship may allow calculation of solids production, it is completely inadequate to describe day-to-day occurrences. The City of Durham has found this factor of 0.74 to vary tremendously throughout the year.
For this report, we have further assumed that the total sludge production is 780 tons/year, of which 660 tons is sedimentation basin solids and 120 tons is solids in the backwash water.
-5 -
3.0 TESTS ON ALUM SLUDGE
The important factors associated with evaluating alum recovery are the acid demands to achieve recovery, the sludge reduction achieved, the settleability of the result- ing sludge, its ultimate dewaterability on drying beds and the percentage of total aluminum which is recovered. The City conducted tests over the course of several months, with Malcolm Pirnie personnel spending time on-site to help develop this information.
The test procedure was to take a sample of thickened sludge, acidify to pH 2 with 14-1 H 2 S 0 4 and settle overnight. Measurements were made of total suspended solids (TSS) on raw sludge, acidified sludge 30 minutes after H2S04 addition and acidified sludge after overnight settling. Aluminum measurements were made using an atomic absorption spectro- photometer with supernatant from the samples which settled overnight. A direct measurement was made on the overnight samples for the volumetric split between supernatant and sludge.
Both thickened sludge without polymer, and samples further thickened by polymer (Nalco 8181) addition and decanting were tested. The polymer thickened sludge samples had initial strengths of 4 . 7 - 8 . 4 % TSS. The non-polymer thickened samples had initial strengths of 3.0-3.9% TSS.
Another series of tests were performed to assess the effects of acidification on sludge drainage on drying beds. Pilot sludge drying beds were fabricated for this purpose.
The pilot sludge drying beds were constructed from three 6-inch diameter acrylic tubes, acrylic flanrJes and
-6-

base. The setup was similar to that represented in Figure 1. A support media (approximately 3-inches) of graded gravel was placed at the base of each tube. Twelve inches of sand media was placed on top of the gravel. In order to condition the media, the top sections of the tubes were connected and filled with plant finished water. Openings in the base plate below each tube allowed the water to drain freely (approximately 15 min). The media was washed three times in this manner in preparation for an application of sludge.
For this report eight ( 8 ) samples were analyzed in detail. Six were sample tested by City of Durham personnel during winter months and two were tested by representatives from Pirnie during the summer. The following discussion summarizes the results from those tests.
3.1 Sludge Reduction
The amount of solids reduction has an important impact on the eventual size of the drying bed facilities. The solids reduction should be directly proportional to the dissolution of aluminum hydroxide species. Table I shows the results for the eight samples. Polymer was added to three of the samples and pre-thickening took place prior to acid addition. All of the samples with polymer thickening appear to show a high solids reduction. Howeverp we do not feel that this is an accurate representation. It is likely that the addition of polymer bonds a significant amount of water in association with the large floc particles. Much of .
the water probably does not dry at the oven temperature of 103OC used for the suspended solids analyses. Therefore the results tend to show a higher solids content than is accu- rate and the data without polymer addition should be taken
-7-

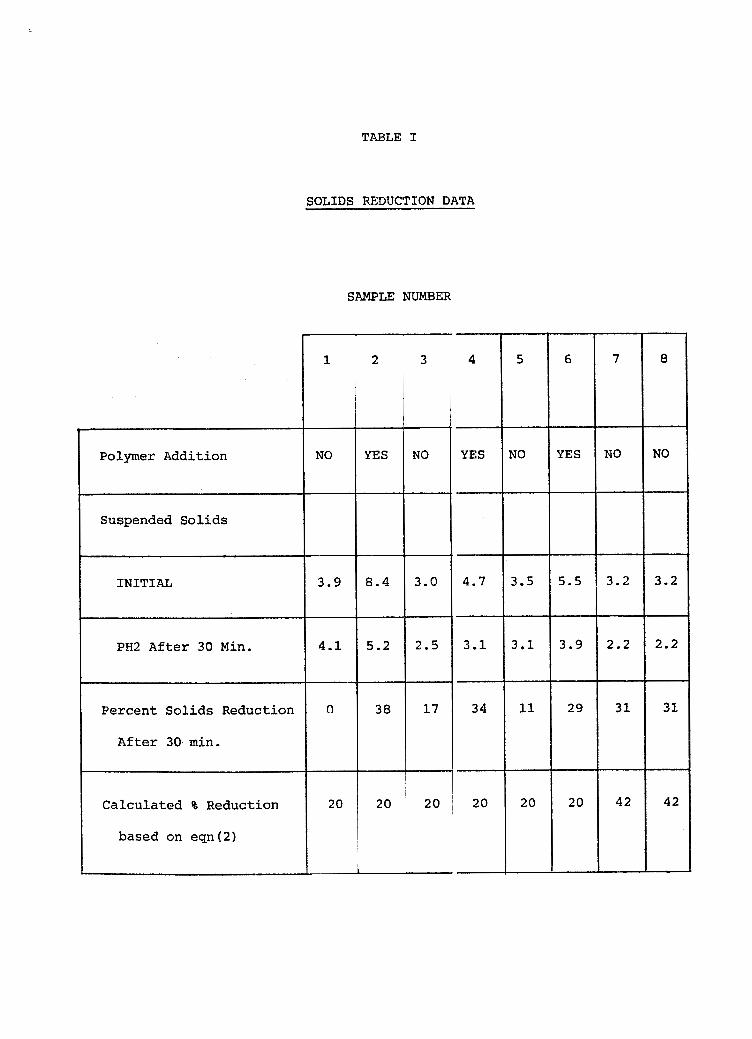
TABLE I
1
NO
3.9
4.1
0
20
Polymer Addition
2
YES
8.4
5.2
38
20
Suspended Solids
INITIAL
PH2 After 30 Min.
Percent Solids Reduction
After 30 min.
Calculated % Reduction
based on eqn (2)
SOLIDS REDUCTION DATA
SAMPLE NUMBER
3
NO
3.0
2.5
17
20
34 11
20 20
6
YES
5.5
3.9
29
20

as more accurate. The values for calculated percent reduc- tion are based on equation (2). For the first six samples the raw turbidity was about 70 TU and the alum 30 mg/l. For the last two the turbidity was 26 TU and the alum 32 mg/l. The actual reductions are lower than the estimated values which could reflect an incomplete acidification. When the samples were allowed to stand overnight some additional reduction did take place. For example, Samples 3 and 5 each achieved a 23% solid.; reduction after settling overnight.
Using equation (2) it is possible to calculate the annual average solids reduction which may be obtained:
ALUM = 25 mg/l Turbidity = 25 mg/l
Percent Reduction = 100 (0.44) (25 )
( 0 . 4 4 ) ( 2 5 j + 0.74 (25)
= 37%
If only 75% of that value is achieved then the range of The data appears expected reduction in solids is 28 to 37%.
to support this as a realistically expected result.
Conclusion - Expected Solids Reduction = 30%
3.2 Sludge Settleability
Table I1 shows the percent of original volume which is recoverable as supernatant and the suspended solids concen- tration of the thickened sludge. Almost independent of the initial solids concentration, approximately 50% of the volume would be recoverable as liquid alum. An important
-8-
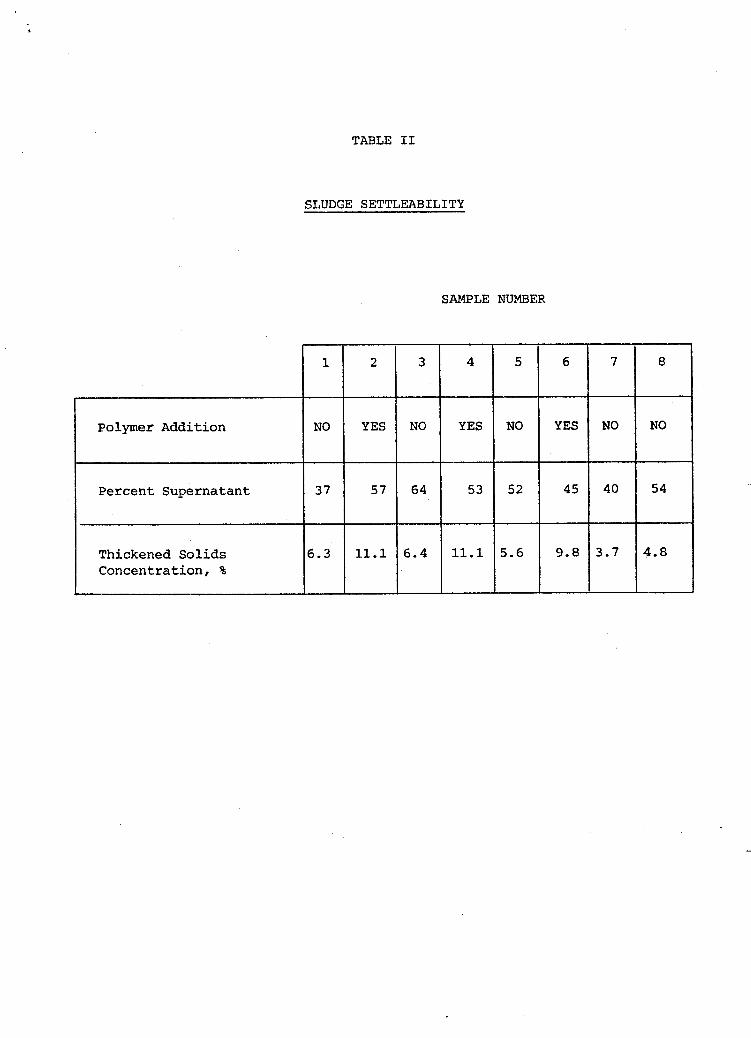
TABLE I1
Polymer Addition
SLUDGE SETTLEABILITY
1 2
NO YES
SAMPLE NUMBER
3
NO
64
6.4
4
YES
53
11.1
Percent Supernatant
I I I I
37 57
Thickened Solids Concentration, %
6.3 11.1
factor will be the ability to pump the remaining solids to the drying beds and achieve a uniform cover. Operationally, it will be necessary to control the initial solids concen- trations so that after acidification and thickening a handleable slurry results.
Conclusion: 50% of the volume is recoverable as alum from the holding thickening basin.
3 . 3 Sludge Dewaterability
In order to screen the effects of various parameters on the dewatering properties of the acidified sludge, the City conducted several tests using Capillary suction time (CST) and "bucket" drying beds. The test conclusions were that 1) polymer addition prior to acidification did not enhance dewatering, 2) raising the pH of the acidified sludge to 7 prior to drying did not significantly enhance drying, 3 )
polymer addition after acidification may enhance drying.
Two factors were important in considering the pH of the sludge which should be applied to the beds. First, in order to landfill the residual sludge the pH should be greater than 3 . Secondly, a significant portion of the recoverable aluminum would be applied to the drying beds. That solution would be lost if the pH were raised to the point of repre- eipitating the aluminum, which at the concentrations in- volved would probably occur above pH 4 . Also the repreci- pitation of aluminum hydroxide would probably inhibit dewatering. In order to further evaluate sludge dewatering, the drying bed pilot unit was utilized.
Two sets of pilot studies were conducted. For the first test, the sludge had the properties of Samples 7 and 8 as
-9-

described in previous Tables. These samples were thickened sludge which was collected from the sludge tank. The initial conditions were a total suspended solids (TSS) concentration of 3.24% and a pH of 6.20. Three 5-gallon buckets of this sludge were handled side-by-side, one for each tube.
The first bucket was not acidified but conditioned with polymer (Nalco 8181) as is normal practice at the solids facility. Polymer was added to the sludge until good water release was prompted. Water release was measured via the CST test. Typically, poor CSTs (100 sec) are produced until the optimum polymer dose is reached. A sharp cutoff point is then evident. CSTs at the optimum dose are generally 10-15 seconds. After polymer conditioning, this sludge was applied to the first tube at a loading of 2 lb/sq ft and used as the control.
Both the second and third buckets were acidified with reagent grade H 2 S 0 4 . The acidified sludge was then allowed to settle overnight. Supernatant was siphoned off and measured for aluminum.
The second sludge sample was applied at pH 2 at a loading of 2.9 lb/sq ft. The third sample was adjusted with NaOH (50%) to pH 3 . 5 . The third sample was loaded to the pilot sand bed at 3.2 lb/sq ft.
Filtrate was allowed to drain from the sludges through the sand beds. Tubing from the openings in the base plate to individual buckets (one for each tube) allowed collection and segregation of the filtrates. The volume of drainage was measured over time and filtrate samples were collected for TSS and aluminum measurements. Supernatant which was siphoned from above the applied sludges was added to the
-10-
filtrate buckets. This was consistent with the existing sand bed operation where adjustable drop tubes are used for decantation.
Curves of the drainage with time are presented in Figure 2. It is evident that most of the drainage (and decantation) occurred within 2 4 hours. Once drainage is near completion, further sludge drying is a result of evaporation.
The second test run with the pilot sand beds was performed to investigate the effect of polymer conditioning of sludge after acidification. Polymer was added to set- tled, acidified sludge. As with the earlier tests, a sharp decrease in CST was evident at the optimum polymer dose, with a decrease from over 100 to 16 sec. The optimum polymer does was significantly less than that required with non-acidified sludge.
The initial sludge had a suspended solids concentration of 1.63% and pH 6 . 3 8 . After 30 minutes, the suspended solids concentration was reduced to 1.09% for a solids reduction of 3 3 % , similar to the preceeding test.
The suspended solids concentration of the settled acidified sludge was 4.10%. The pH was then readjusted to 3.5. In one pilot sand bed, the sludge was applied without polymer at 2.0 lb / sq ft. In the other bed, the sludge was polymer conditioned prior to application at 2.0 lb/sq ft. The polymer dose was 6.5 lb/ton. In approximately 24 hours the non-polymer treated sludge drained 4 7 % . The polymer treated sludge drained 7 6 % , a significant increase over all previous evaluations.
-11- .

ru w
a 3
t?) H
LL
W
I- n
m
w
c3 z
H
t- II n
n
z
Q
cn I- O
J
H
e
0
I z
1 I
:I 1 I L v.
0
Q
Z
IZ
1
w
n. z
4
Ln
$1 1
1 L
L
Q
I i- z
1 H
I
h
After 24 hrs, the sludge samples were removed from the tubes and each blended until uniform. A portion of each was then weighed, dried at 103OC and weighed again to determine total solids concentration of the cake. Sample No. 1 (the control) drained to 6.3% after 50 hours. The pH 2 sludge without polymer had achieved a solids concentration of 12.7%. The polymer conditioned sludge had drained to a 26.1% concentration.
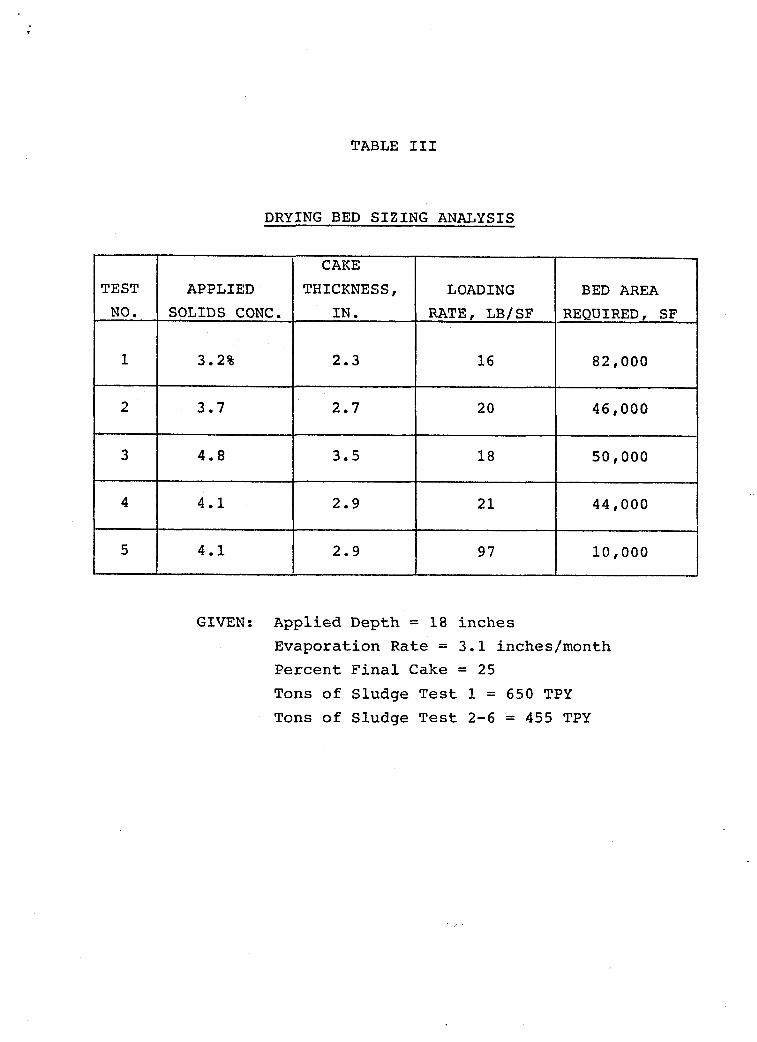
In order to compare the dewaterability on the dry beds of the five tests, an analyses of the data was performed on our computer program based on a paper prepared by Terry Rolan. To date we have not correlated the percent drainage to the applied solids concentration and therefore we feel the results are only accurate at the actual values used in the pilot tests. Table I11 shows the result of that analy- sis. While the conditions were not exactly the same, they are close enough for comparison. For the control condi- tions, Test No. 1 , 650 tons per year of sludge was used for sizing. For the remaining, acid treated sludge, a 30% reduction in sludge was assumed as shown in Section 3.1.
The results for Sludge Sample 1 indicate that for 650 TPY about 82,000 sf of drying area are required compared to the existing 20,000 sf available. The required area of 82,000 sf is very close to estimates prepared by the City of Durham following substantial operating experience. We therefore have additional confidence in the model results.
For Samples 2, 3 and 4 about 50,000 sf were required. Sample 2 was a pH 2 sludge and Samples 3 and 4 were both pH 2 sludges raised to pH 3.5 prior to application to the pilot sand bed.
i
-12-
TEST NO.
1
2
3
4
5
TABLE I11
DRYING BED SIZING ANALYSIS
I CAKE APPLIED THICKNESS, LOADING
SOLIDS CONC. IN. RATE, LB/SF
3.2% 1 2.3 16 1 3.5
BED AREA
REQUIRED, SF
82,000
46,000
50,000
44,000
10,000
GIVEN: Applied Depth = 18 inches Evaporation Rate = 3.1 inches/month Percent Final Cake = 25 Tons of Sludge Test 1 = 650 TPY Tons of Sludge Test 2-6 = 455 TPY
I ’

' . .
The final test was pH 2 sludge, raised to pH 3.5 and polymer treated prior to application. This test clearly showed the most drastic improvement. Results indicate that the existing sand drying bed area would be adequate for dewatering the acid treated sludge. Tests should be con- ducted on varying conditions to verify these results.
3 . 4 Aluminum Recovery
A factor of economic significance but also affecting the resultant handleability of the residual solids is the degree of aluminum recovery which is achieved. This is dependent upon two factors. First is the percentage of the total aluminum in the sludge which is dissolved at the pH utilized. Second is the volume of dissolved aluminum solution which can be recovered.
It is difficult to accurately estimate the percentage of aluminum which can be recovered by testing a few batch samples. Not only do the characteristics vary from season to season, but obtaining a representative sample is difficult due to natural separation of "aluminum-rich" solids from inert solids. However, we did attempt to bracket the results as shown in Table IV. By using equation (2) it is possible to calculate the expected aluminum content of the sludge, in terms of mg of aluminum per g of dry solids. This value was then compared to the actual amount dissolved. Except for Sample 2 which appears erroneous, all the first 6 samples showed 90+% recovery. Samples 7 and 8 showed only 70% recovery which may reflect I
the variation in calculation procedures or the incomplete mix obtained in the large buckets used for those tests.
For volumetric recovery, we can assume at least a 50% recovery of supernatant upon sedimentation. It would also
-13-
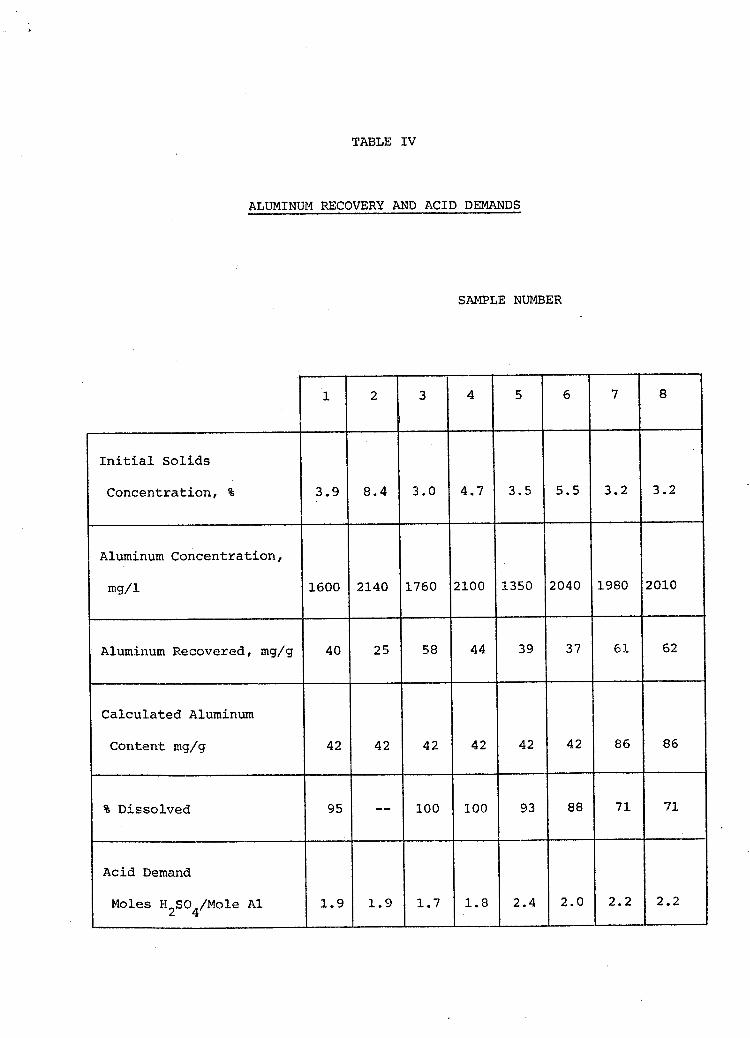
TABLE IV
ALUMINUM RECOVERY AND ACID DEMANDS
SAMPLE NUMBER
- 7
3.2
980
61
86
-
71
__.
2.2
I_
1 2 3 8 4
4.7
5
-
3.5
.350
- 39
Initial Solids
Concentration, 3.0 3.2 8.4 3 . 9
1600
Aluminum Concentration,
mg/l 010 !140 760 100
44 62 58
42
100
Aluminum Recovered, mg/g 40
-
42
-
95
1.9
Calculated Aluminum
Content mg/g
% Dissolved
42 42 86 42
88
2.0
93 71 100
I Acid Demand 2.2 1.3 1.7 1.8
- 2.4 -
Moles H2S04/Mole A1

be important to recover the filtrate from the drying beds, which conservatively was also 50% of the remaining volume. This gives an overall volumetric recovery of 75%. Actually, Sample 8 resulted in 75% recovery of supernatant and 75% drainage for an overall volumetric recovery of 93%.
The net aluminum recovery should be between 60% and 7 5 % , perhaps optimistically as high as 90%.
The acid demands are also shown in Table IV. The results consistently show a demand of approximately 2 moles of sulfuric acid per mole of aluminum dissolved. This is slightly higher than the theoretical demand of 1.5: 1, but not unreasonable.
-14-
4 . 0 RECOVERED ALUM REUSE
Tests conducted by City personnel have shown that recovered alum is effective as a recycled coagulant. In jar tests with raw water, zeta potential was reduced and turbid- ity removed with recovered alum to the same extent as with fresh alum. Thus, the recirculation of recovered alum at the Water Treatment Plant is a viable alternative, at least on a limited basis.
Concern would still exist as to build up of potential contaminants with continued recycle. However, the alum can be recycled once or twice with no expected affect on water quality. Following that recycle the alum can be used at the wastewater facilities for phosphorous removal, or every third batch of sludge could be treated without alum recov- ery.
4.1 Northside WWTP
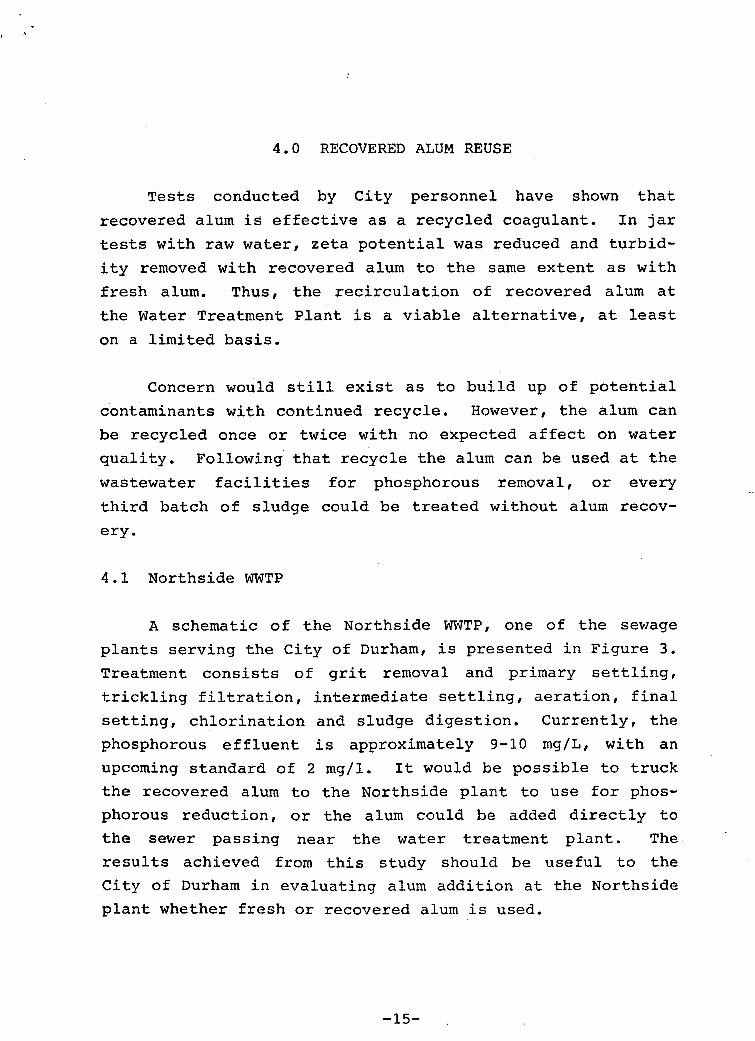
A schematic of the Northside WWTP, one of the sewage plants serving the City of Durham, is presented in Figure 3 .
Treatment consists of grit removal and primary settling, trickling filtration, intermediate settling, aeration, final setting, chlorination and sludge digestion. Currently, the phosphorous effluent is approximately 9-10 mg/L, with an upcoming standard of 2 mg/l. It would be possible to truck the recovered alum to the Northside plant to use for phos- phorous reduction, or the alum could be added directly to the sewer passing near the water treatment plant. The results achieved from this study should be useful to the City of Durham in evaluating alum addition at the Northside plant whether fresh or recovered alum is used.
-15-
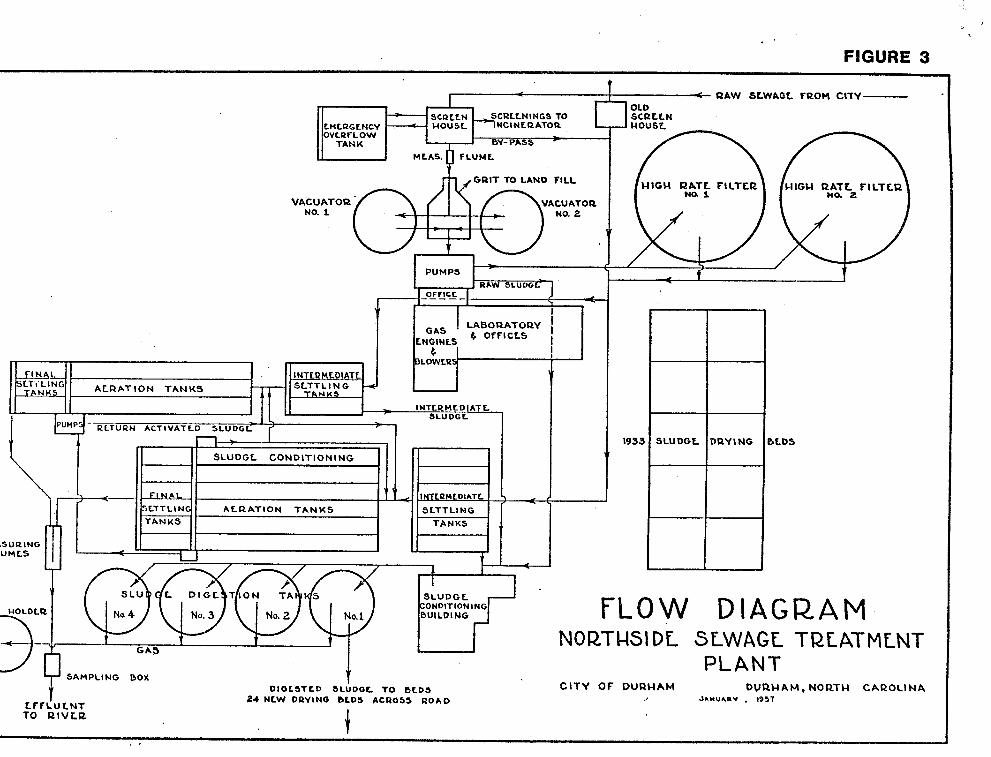
FIGURE 3
RAW SLWAGL FUOH CITY-
VACU A T 0 Q
FLOW D I A G R A M NORTCISIDL SLWAGL TRLATMLNT
PLANT SAMPCINO BOX
CITY OF DURHAM D U R H A M . NORTU CAROLINA c J*wu*sv . 1951
1933

4.2 Phosphorous Removal
Two tests were conducted to evaluate phosphorous removal, via alum addition. Alum is most effective in removing orthophosphate, therefore tests were conducted near the end of the aeration tank to maximize conversion of various forms of phosphorus to orthophosphate. To simulate the addition of alum within the aeration tank, a sample of aerated wastewater was collected at the seventh of nine bays toward the effluent end of the aeration tank. After alum addition, 30 min slow mixing and 20 min settling were provided in the jar test as an approximation of what would occur with alum added at the seventh bay. The other jar test simulated alum addition to the effluent of the aeration tank--rapid mixing during alum addition, no slow mixing and 20 min settling were provided.
In the first jar test, the aerated wastewater total phosphorus, orthophosphate and suspended solids concen- trations were 8.9 mg/l as P, 6.0 mg/l as P and 7 7 mg/L TSS, respectively. Jars were filled with 500 ml aerated wastewater and dosed with a wide range of alum concentrations. The stock alum solution (recovered alum) had a concentration of 2.3%. The results are shown in Figure 4 . It is evident that total phosphorous can be reduced to 2.0 mg/L P with approximately 155 mg/L alum. Orthophosphate can be completely removed with 117 mg/L alum.
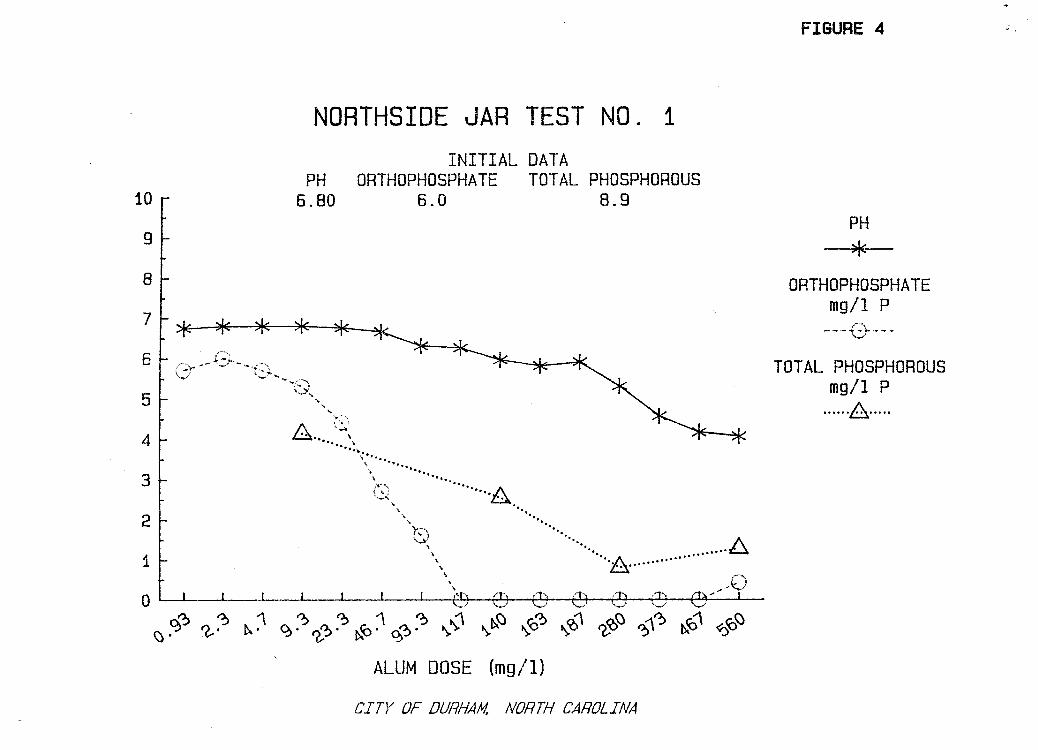
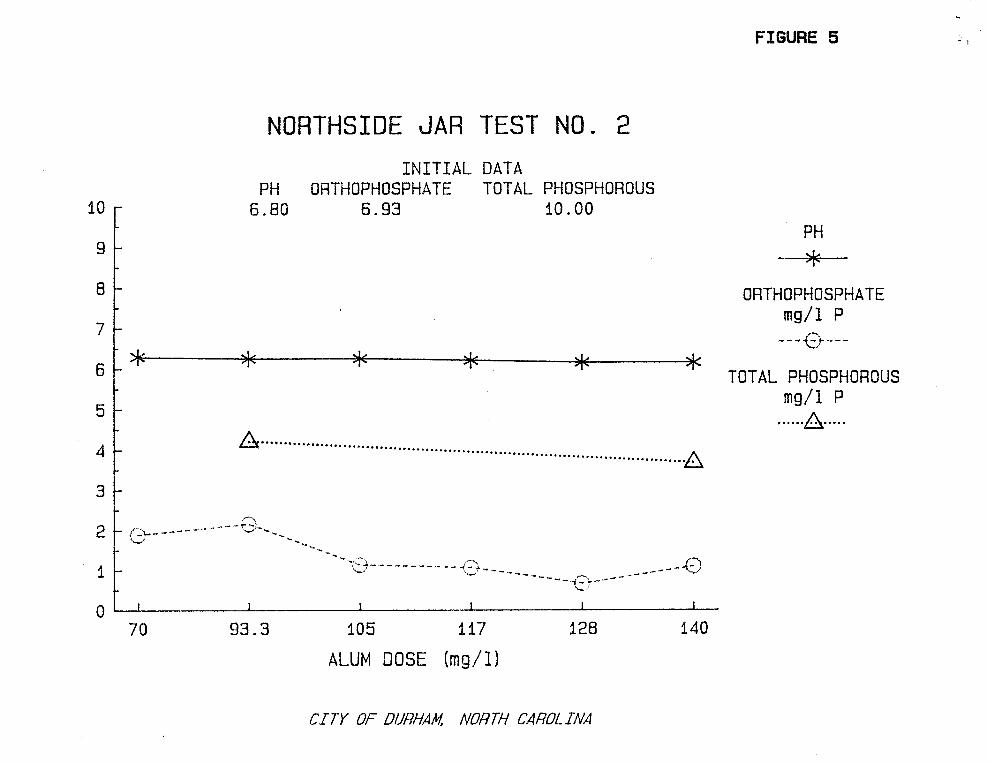
The second jar test results are presented in Figure 5. Within the range of alum dosages tested, total phosphorous was not reduced to or below 2.0 mg/l P. Orthophosphate was reduced to 0.67 mg/l P with 128 mg/l alum. Removals of phosphorous were not as good as in j a r test No. 1. Alum addition to the aeration tank at some point where the water
-16-
n
zcn z
xm
0‘
0
LL
I
d
- 1 FIGURE 5
NORTHSIDE JAR TEST NO. 2
10
~F INITIAL DATA
PH ORTHOPHOSPHATE TOTAL PHOSPHOROUS 6.80 6.93 10. 00
PH __jfc_
ORTHOPHOSPHATE mg/l P - - .- &Yp - -
TOTAL PHOSPHOROUS
5 1 m d l P
I.. . . .A.. . . .
CITY OF DURHAM, NORTH CAROLINA
would be mixed for at least 30 min followed by settling appeared to be more effective than addition to aeration tank effluent just ahead of settling.
Both tests show that recovered alum can be effective for the removal of phosphorous (total and orthophosphate) when added to aerated wastewater.
-17-