Embed Size (px)
Citation preview
Altered expression of O-GlcNAc-modified proteinsin a mouse model whose glycemic status is controlled by a lowcarbohydrate ketogenic diet
Tetsuya Okuda & Asami Fukui & Naoki Morita
Received: 16 April 2013 /Revised: 23 May 2013 /Accepted: 27 May 2013# Springer Science+Business Media New York 2013
Abstract Abnormal modification of proteins by O-linkedN-acetylglucosamine (O-GlcNAc) is known to be associatedwith the pathology induced by hyperglycemia. However, thedynamic mechanism of O-GlcNAc modification under hy-perglycemic conditions in vivo has not been fully character-ized. To understand the mechanism, we established an ani-mal model in which the glycemic status is controlled by thediet. A mutant mouse (ob/ob) which exhibits diet-inducedhyperglycemia when fed a regular chow (chow) was used toestablish this model; the mice were fed a very low carbohy-drate ketogenic diet (KD) to improve hyperglycemia. Usingthis model, we evaluated the levels of O-GlcNAc-modifiedproteins in tissues under a hyperglycemic or its improvedcondition. ELISA and Western blot analyses revealed thataltered expression of certain proteins modified byO-GlcNAcwere found in the mice tissues, although global O-GlcNAclevels in the tissues remained unaltered by improvement ofhyperglycemia. We also found the Akt protein kinase wasmodified by O-GlcNAc in the liver of ob/ob mice, and themodification levels were decreased by improvement of hy-perglycemia. Furthermore, aberrant phosphorylation of Aktwas found in the liver of ob/ob mice under hyperglycemiccondition. In conclusion, our established mouse model isuseful for evaluating the dynamics of O-GlcNAc-modifiedproteins in tissues associated with glycemic status. Thisstudy revealed that the expression level of certain proteins
modified by O-GlcNAc is altered when KD improves thehyperglycemia. These proteins could be prospective indexesfor nutritional therapy for hyperglycemia-associated dis-eases, such as diabetes mellitus.
Keywords Diabetes mellitus . Hyperglycemia . Ketogenicdiet . Obese mice .O-GlcNAc .O-GlcNAcase .O-GlcNActransferase
Introduction
The O-linked N-acetylglucosamine (O-GlcNAc) modifica-tion on proteins is a posttranslational modification, occurringon cytoplasmic and nuclear proteins in which a single O-linked N-acetylglucosamine residue attaches to serine orthreonine moieties [1]. There are two key enzymes catalyz-ing O-GlcNAc modification: O-GlcNAc transferase (OGT)and O-GlcNAcase (OGA). OGT transfers GlcNAc fromUDP-GlcNAc to a protein, and OGA removes the GlcNAcresidue from that protein [2, 3]. This reversible modificationregulates a variety of cellular processes, such as transcrip-tion, signal transduction, protein trafficking and turnover [4,5]. O-GlcNAc modification and phosphorylation of serineand threonine moieties are considered to be linked and playan important role in cellular processes.
Recent reports revealed that abnormal O-GlcNAc modifi-cation of proteins is associated with several pathologiesexhibiting hyperglycemia, a typical disease of which is diabe-tes mellitus [6]. Numerous studies have addressed the role ofproteins modified byO-GlcNAc on the molecular basis of thepathology of diabetes mellitus, including insulin resistance[6–8] and glucose intolerance [6, 9]. For example, the O-GlcNAc modification affects phosphorylation status of Aktprotein kinase that is related to insulin signaling. EnhancedO-GlcNAc modification of Akt induced by chemical treatment
Electronic supplementary material The online version of this article(doi:10.1007/s10719-013-9482-x) contains supplementary material,which is available to authorized users.
T. Okuda (*) :A. Fukui :N. MoritaMolecular and Biological Technology Research Group,Bioproduction Research Institute, National Institute of AdvancedIndustrial Science and Technology (AIST), 2-17-2-1Tsukisamu-higashi, Toyohira-ku,Sapporo 062-8517, Japane-mail: [email protected]
Glycoconj JDOI 10.1007/s10719-013-9482-x
or overexpression of OGT decrease phosphorylation level ofAkt at Thr 308 that is necessary for the activation of insulinsignaling pathway [8, 10].
UDP-GlcNAc, the donor of O-GlcNAc, is synthesizedfrom glucose in the cell via the hexosamine biosyntheticpathway (HBP) [6]. Thus, a hyperglycemic condition isexpected to influence the levels of O-GlcNAc modificationof intracellular proteins. However, neither intracellularlevels of glucose nor the kinetics of catabolic enzymes forO-GlcNAc are simply reflected in the levels of proteinsmodified by O-GlcNAc. These levels are intricately regu-lated under various cellular processes that include the al-tered expression of OGT and OGA [11–15]. Therefore, themolecular dynamics of O-GlcNAc modification and itsmodified proteins under physiological conditions remainselusive.
Several animal models whose glycemic status controlledsurgically [16] or pharmacologically [16–18] have been usedto evaluate the molecular dynamics of the O-GlcNAc mod-ification in vivo. Type 1 diabetic rodent models are frequent-ly used for the purpose of this evaluation, however, diabetesis induced by Streptozotocin injection which has an inhibi-tory effect on the cleavage of O-GlcNAc from proteins,leading to the accumulation of O-GlcNAc proteins in cellswithout hyperglycemia [19, 20]. To understand the molecu-lar dynamics of the O-GlcNAc modification and its patho-logical role, it is necessary to establish an animal model thatclosely reflects the physiological conditions and lifestyle ofhyperglycemic patients.
We have recently reported an animal model of which theglycemic status is controlled by diets [21]. An obese mutantmouse strain B6.V-Lepob/J (ob/ob) that exhibits diet-inducedhyperglycemia [22] was used to develop the model. Theob/obmouse exhibits hyperphagia with development of obe-sity, steatosis, hyperinsulinemia and hyperglycemia afterbeing fed a diet of regular chow (chow). We determined anoptimal condition to improve the hyperglycemic phenotypeof ob/ob mice by feeding a very low carbohydrate ketogenicdiet (KD). KD is theoretically a nutritionally balanced diet,composed of high fat, adequate protein and low carbohydrate[21, 23]. The KD mimics glucose starvation in the body,leading to production of ketone bodies from fat, whichsupplies energy to peripheral tissues [21, 23, 24]. By usingthis model, we revealed the KD feeding could improvehyperglycemia, hyperinsulinemia and hepatic steatosis inob/ob mice [21].
In this report, we describe the molecular dynamics ofthe O-GlcNAc-modified proteins in the mice model.Evaluation of the expression levels of O-GlcNAc-modi-fied proteins, its catabolic enzymes, and phosphorylationstatus of Akt in mice tissues revealed the molecular dy-namics of protein O-GlcNAc modification in tissues un-der hyperglycemia.
Materials and methods
Animals and dietary studies
All mice used in this study were female wild-type and ob/obmutant mice of the inbred strain C57BL/6 (Charles RiverLaboratories Japan, Yokohama, Japan). Mice were maintainedwith a 12 h-light/dark cycle in a temperature-controlled envi-ronment (21 °C±2 °C). CE-2 (CLEA Japan, Tokyo, Japan)and F3666 (Bio-Serv, Frenchtown, NJ) were used as regularchow and KD, respectively. The components of these diets aredescribed in Table 1. Five-week-old ob/obmice were raised oneither chow or KD until 12 weeks old. Wild-type mice raisedon chow and the same experimental conditions were used as areference. During this period, body weight and blood glucoselevels were monitored at the same time (3:00 p.m.) once aweek. The Committee for Experiments involving Animals ofthe National Institute of Advanced Industrial Science andTechnology (AIST) approved all animal experiments.
Blood chemical analysis
Blood glucose levels were examined using venous blood col-lected from the tail vain and the ACCU-CHEK™ Aviva metersystem (Roche, Penzberg, Germany). Serum insulin levels weremeasured with the Mouse Insulin ELISA Kit High RangeSpeedy (Morinaga Institute of Biological Science, Yokohama,Japan).
Preparation of protein extracts
Proteins were extracted from each isolated tissue (80 mg inweight) into 0.4 ml of 20 mM HEPES/0.25 M sucrose buffer(pH 7.5) supplemented with 0.1 mM phenylmethylsulfonylfluoride, a proteinase inhibitor cocktail (Complete mini
Table 1 Composition of the experimental dietsa
Ingredient CE-2 KD
Content profile (%)
Carbohydrate 50.0 3.2
Fat 4.8 78.8
Protein 25.1 8.4
Fiber 4.2 5.0
Ash 6.7 3.8
Moisture 9.3 <5.0
Caloric profile (Kcal/g)
Carbohydrate 2.00 0.13
Fat 0.43 7.09
Protein 1.00 0.33
Total 3.43 7.55
a The profiles of principle contents in the experimental diets are shown
Glycoconj J

EDTA-free™; Roche) and 2 μM of an OGA inhibitor O-(2-acetamido-2-deoxy-D-glucopyranosylidene)amino N-phenylcarbamate (PugNAc; Toronto Research Chemicals,North York, ON) using a disposable homogenizer (BiomasherII; Nippi, Tokyo, Japan). After centrifugation of the homoge-nates at 800 × g for 15 min at 4 °C, the supernatants werefiltered using an Ultrafree-MC (0.45 μm) centrifugal device(Millipore, Billerica, MA) at 13,000 × g for 3 min at 4 °C. Thefiltrates were used as protein samples in subsequent experi-ments. The concentration of protein in the sample was deter-mined using the Bio-Rad Protein Assay (Bio-Rad Laboratories,Hercules, CA).
Enzyme-linked immunosorbent assay (ELISA)
50 μl of protein extracts (final concentration 20 μg/ml) wereapplied onto a 96-well microtiter plate (Nunc MaxiSorp F96;Thermo Fisher Scientific, Waltham, MA), and incubated over-night at 4 °C.After washing twicewith phosphate buffered saline(PBS), 50 μl of blocking buffer (1 % bovine serum albumin inPBS) were added into each well and incubated for 15 min atroom temperature, followed by the addition of primary antibod-ies into the wells at an appropriate dilution ratio. After 3 hincubation at room temperature, wells were washed three timeswith 0.1%Tween-20 in PBS (PBST) before PBST-dilutedHRP-linked secondary antibody was added. A HRP substrate (1-StepUltra TMB-ELISA Substrate; Thermo Fisher Scientific) wasused to detect antibody binding, and the results were measuredas absorbance at 450 nm. Wells without the primary antibodyreaction were used to monitor background absorbance causedby non-specific binding of secondary antibody. Primary anti-bodies used were: anti-O-GlcNAc (CTD110.6; Sigma-Aldrich,St. Louis, MO), anti-OGT (SAB2500715; Sigma-Aldrich),anti-OGA (EPR7154B; Epitomics, Burlingame, CA) and anti-actin (C4; BD Biosciences, Franklin Lakes, NJ). The range oflinearity and detection limit of the ELISA were determinedusing a protein extract of human umbilical vein endothelialcells in which the O-GlcNAc protein excessively accumulatedafter treatment of 50 μM PugNAc for 16 h.
SDS-PAGE and Western blotting
Protein extracts containing 2 μg (fat tissue) or 5 μg (othertissues) of total protein were separated by sodium dodecylsulfate-polyacrylamide gel electrophoresis (SDS-PAGE) usinga polyacrylamide gel (SuperSep™ 5–20 % Gel; Wakochemicals, Osaka, Japan); the gel was stained with CoomassieBrilliant Blue (CBB) or used in Western blotting. For Westernblotting, the proteins in the gel were transferred onto Immobilon-P PVDF membranes (Millipore) by electroblotting at a constantcurrent of 90 mA for 1 h. After blotting, the membrane wasincubated with primary antibody, and then sequentially incubat-ed with HPR-linked secondary antibody. Antibody binding was
detected using ECL Plus Western Blotting Detection Reagents(GE Healthcare UK Ltd., Amersham, UK) and an imageanalyzer: ATTO Light-Capture (ATTO, Tokyo, Japan). Primaryantibodies used were: anti-O-GlcNAc (CTD110.6 or RL2;Thermo Fisher Scientific), anti-OGT (SAB2500715), anti-OGA (EPR7154B), anti-Akt (#9272; Cell SignalingTechnology, Danvers, MA), anti-phospho-Akt-Ser 473 (#9271;Cell Signaling Technology) and anti-phospho-Akt-Thr308 (#9275; Cell Signaling Technology).
Immunoprecipitation
Protein extracts containing 2 mg of total protein were incu-bated with 8 μg of primary antibody at 4 °C overnight, andthen incubated with 20 μl of 50 % Protein A Sepharose beadslurry (GE Healthcare, Piscataway, NJ) at 4 °C for 3 h. Thesamples were centrifuged at 14,000 × g for 1 min at 4 °C, andthe precipitates (beads) were washed five times with 0.5 mlof Wash Buffer (20 mM Tris–HCl pH 7.5, 150 mM NaCl,1 mM EDTA, 1 mM EGTA, 1 % Triton X-100, 2.5 mMsodium pyrophosphate, 1 mM β-glycerophosphate, 1 mMNa3VO4, 1 μg/ml Leupeptin, 1 mM phenylmethylsulfonylfluoride, 50 μM PugNAc), and were finally resuspended in20 μl of SDS-PAGE sample buffer (Wako chemicals). Theprecipitated proteins were used for Western blot analysis. Forthe immunoprecipitation, anti-Akt antibody (Cell SignalingTechnology) was used as primary antibody. For the blotanalysis of immunoprecipitates, the anti-Akt antibody (CellSignaling Technology) and anti-O-GlcNAc antibody (RL2)were used.
Statistical analysis
Statistical significance was determined using Student’s t-test,taking the case of *P<0.05, **P<0.01, ***P<0.001 asstatistically significance.
Results
Effect of KD feeding on glycemic status, body weightand serum insulin levels in the established animal model
An obese mutant mouse with the C57BL/6 genetic back-ground (ob/ob) is rapidly exhibits a hyperglycemic pheno-type after weaning, although the phenotype subsides around14 weeks of age [22]. We have recently developed an animalmodel that the hyperglycemic phenotype of ob/ob mice isimproved by feeding of KD [21]. Five-week-old mice wereused in this experiment and were fed by chow or KD until12 weeks old. In the model, the chronic hyperglycemicphenotype of ob/obmice is improved by feeding KD throughthe experimental period.
Glycoconj J
First, we confirmed the hyperglycemic phenotype of theob/ob mice when fed a regular chow (CE-2). The profiles ofprinciple contents of CE-2 are shown in Table 1. We con-firmed that chow-fed ob/ob mice continuously exhibitedhigh levels of blood glucose from 5 to 12 weeks of age inthis experiment (Supplemental Fig. S1a). The average bloodglucose level during the experimental period of chow-fedob/ob mice was 194.6 mg/dl. Constitutive hyperphagia withdevelopment of obesity, which is a major phenotype ofchow-fed ob/ob mice, was associated with the hyperglyce-mic phenotype. Next, we confirmed whether KD wouldimprove the chronic hyperglycemic phenotype. The profilesof principle contents of KD are shown in Table 1. Whilefeeding KD, ob/ob mice exhibited lower blood glucoselevels than those of chow-fed ob/ob mice (SupplementalFig. S1a). The average blood glucose level during the exper-imental period of KD-fed ob/ob mice was 103.6 mg/dl. Thelevels of blood glucose in chow-fed wild-type mice(c57BL/6), under the same experimental conditions was142.4 mg/dl (data not shown), thus, the levels in KD-fed ob/obmice were lower than in chow-fed wild-type mice. However,the KD-fed ob/obmice grew upwithout apparent abnormalitiesduring the experimental period. They exhibited an obese phe-notype at the same time as chow-fed ob/obmice (SupplementalFig. S1b), and there were no differences in the calorific intake(kcal/day) between both groups (data not shown). The KD-fedob/ob mice also exhibited lower blood levels of insulin com-pared to chow-fed ob/ob mice (Supplemental Fig. S1c). Otherdetails of the KD effects including biochemical parametersin serum and pathology of tissues were published else-where [21]. We isolated tissue samples from both chow-and KD-fed ob/ob mice at the endpoint of the feedingexperiment (12 weeks of age) for use in the experimentsdescribed below.
Analysis of protein O-GlcNAc modification by ELISA
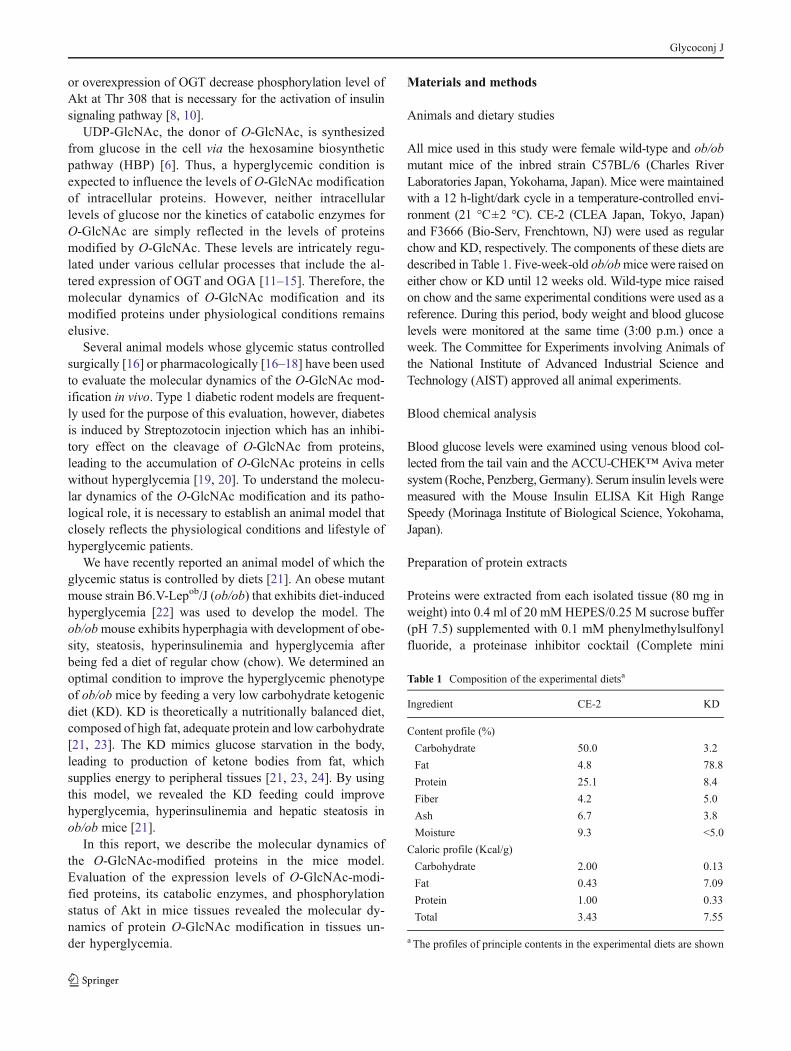
A monoclonal antibody (CTD110.6) which specifically rec-ognizes the β-O-linkage of GlcNAc to both serine andthreonine [25] was used in this analysis. We preliminarilyexamined the detection range of the ELISA (Fig. 1a) usingcell extracts in which O-GlcNAc-modified proteins accumu-lated after treatment with a potent inhibitor for OGA, de-scribed in Materials and methods. The result indicated thatthe ELISA reaction showed linearity in coated wells withprotein extracts in the range of 0.5 to 20 μg/ml. Because theexpression levels of O-GlcNAc-modified proteins in thetissue extracts were expected to be lower than in the cellextracts, which were treated with OGA inhibitor, weperformed the following ELISA analysis using protein ex-tracts at the maximum concentration determined (20 μg/ml).We also used ELISA to determine the relative content ofactin in each protein extract (Fig. 1c): the determined levels
were used as an internal control for normalization of ELISAanalysis (Figs. 1b and 2a, b).
We found that O-GlcNAc levels in each protein extractdiffered according to the tissue extract examined (Fig. 1b):O-GlcNAc was detected at a high level in liver and pancreas,at a moderate level in kidney and levels were relatively low
0.001
0.01
0.1
1
0.1 1 10 100Amount of protein g/ml)
A45
0
R2 = 0.99418
a
c
A45
0
0
0.1
0.2
1 2 3 4 5
O-G
lcN
Ac
/ Act
in
0
0.5
1
1.5
1 2 3 4 5
b
μ(
Fig. 1 ELISA analysis of O-GlcNAc-modified proteins in tissues fromestablished mice. a Reactivity of anti-O-GlcNAc monoclonal antibody(CTD110.6) to determine the concentration of O-GlcNAc-modified pro-teins in cellular extracts. A cellular protein extract in which O-GlcNAc-modified proteins accumulated with treatment of an OGA inhibitor(PugNAc) was used in this assay. The extract was coated onto each wellof a 96-well microtiter plate at the indicated protein concentrations(horizontal axis). The reactivity of anti-O-GlcNAc monoclonal antibody(CTD110.6) to the coated wells was measured by ELISA, and the results(absorbance at 450 nm) are as indicated (A450). The data is displayed as adouble logarithmic graph. The regression line and the correlation coeffi-cient (R2) are indicated in the graph. The globalO-GlcNAc levels (b) andrelative content of actin (A450) (c) in protein extracts of individual tissuesdetermined by ELISA. These globalO-GlcNAc levels in each tissue werenormalized with respect to the relative content of actin in each proteinextract and the relative levels (O-GlcNAc/Actin) were determined. Closedbars; chow-fed ob/ob mice, open bars; KD-fed ob/ob mice. 1, liver; 2,kidney; 3, pancreas; 4, skeletal muscle; 5, fat tissue. Error bars: mean ±S.D., n=9 (liver, kidney, pancreas) or 5 (skeletal muscle, fat tissue) fromtwo independent experiments
Glycoconj J
in skeletal muscle and fat tissue (intra-abdominal fat). Wethen examined the correlation between blood glucose and O-GlcNAc levels in these tissues by comparing chow- or KD-fed ob/ob mice groups: no significant differences weredetermined.
ELISA and Western blot analysis of OGT and OGA
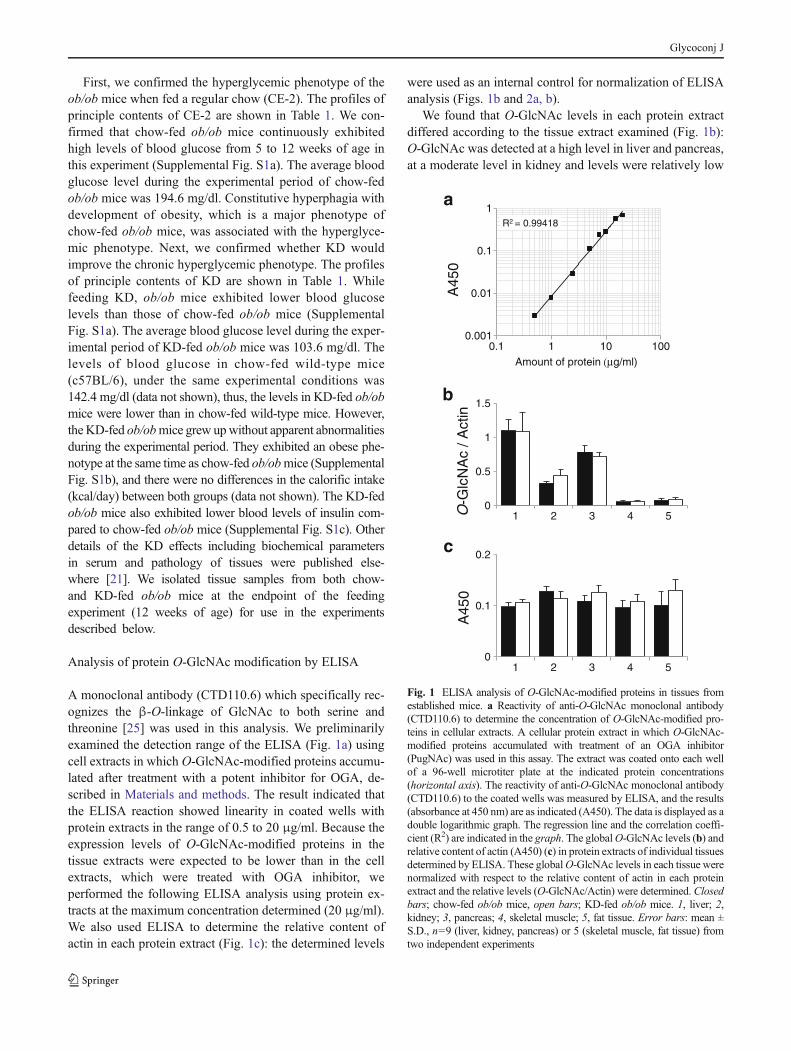
Next, we analyzed the relative contents of OGT and OGA inthese tissues of the established mouse model using ELISA(Fig. 2a, b). It is reported that OGT and OGA are not onlythe key enzymes for biosynthesis of O-GlcNAc [2, 3] but alsothe substrates for O-GlcNAc modification [26, 27]. We foundsignificant differences in these relative contents in the liver andfat tissue between the chow- and KD-fed ob/obmice groups; inob/ob mice, KD feeding decreased the expression levels ofOGT in liver (Fig. 2a) and OGA in fat tissue (Fig. 2b).
We further analyzed the isoform variation of OGTand OGAin these tissues by Western blotting (Fig. 2c, d). The Westernblot analysis of OGT in liver revealed that twomajor isoforms ofOGT were detected in the ob/ob mice liver (Fig. 2c). Theisoform detected in the high molecular weight is known asnucleocytoplasmic OGT (ncOGT), and the other is known asshortest form of OGT (sOGT) [28, 29]. The result indicated thatonly sOGTwas markedly decreased in the KD-fed ob/ob miceliver. Previous studies reveal that OGA has two isoforms, cyto-solic full-length form (OGA-FL) and nuclear variant (OGA-
NV) [29, 30]. The OGA-FL is also known to be detected asdouble bands in rat brain [29]. In the fat tissue, OGA waspredominantly detected as OGA-FL single band, and otherisoforms were hardly detected (Fig. 2d).
Western blot analysis of O-GlcNAc-modified proteinsin the liver of ob/ob mice
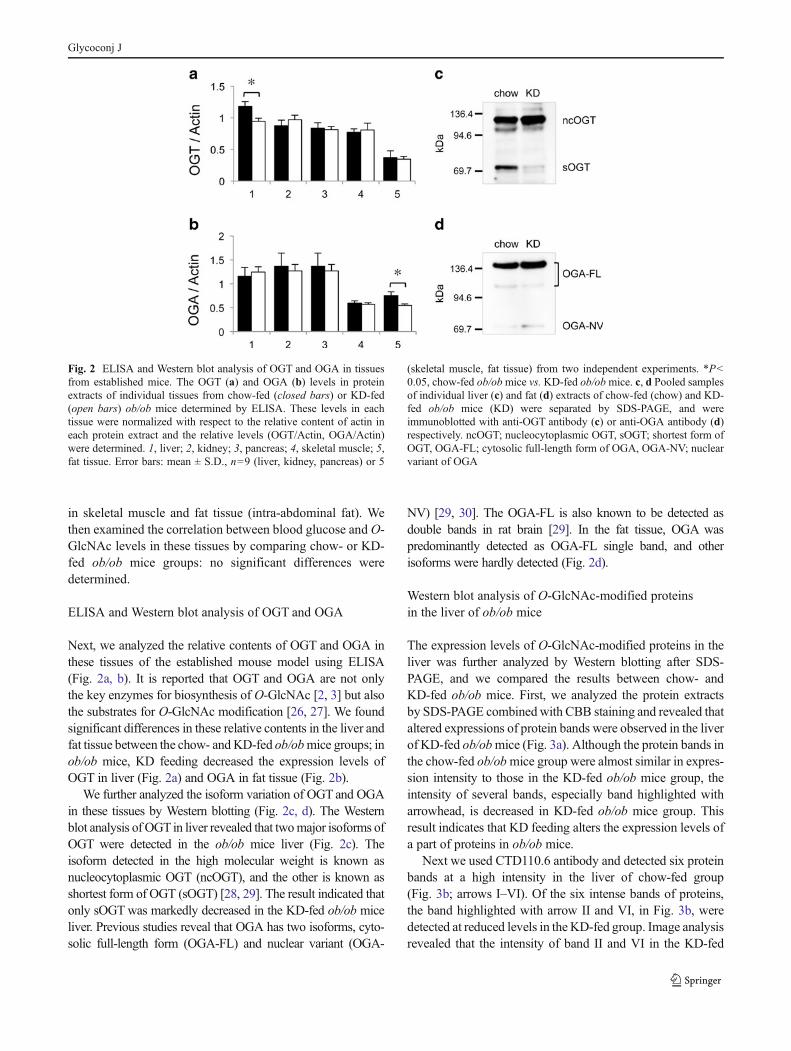
The expression levels of O-GlcNAc-modified proteins in theliver was further analyzed by Western blotting after SDS-PAGE, and we compared the results between chow- andKD-fed ob/ob mice. First, we analyzed the protein extractsby SDS-PAGE combinedwith CBB staining and revealed thataltered expressions of protein bands were observed in the liverof KD-fed ob/obmice (Fig. 3a). Although the protein bands inthe chow-fed ob/obmice group were almost similar in expres-sion intensity to those in the KD-fed ob/ob mice group, theintensity of several bands, especially band highlighted witharrowhead, is decreased in KD-fed ob/ob mice group. Thisresult indicates that KD feeding alters the expression levels ofa part of proteins in ob/ob mice.
Next we used CTD110.6 antibody and detected six proteinbands at a high intensity in the liver of chow-fed group(Fig. 3b; arrows I–VI). Of the six intense bands of proteins,the band highlighted with arrow II and VI, in Fig. 3b, weredetected at reduced levels in the KD-fed group. Image analysisrevealed that the intensity of band II and VI in the KD-fed
Fig. 2 ELISA and Western blot analysis of OGT and OGA in tissuesfrom established mice. The OGT (a) and OGA (b) levels in proteinextracts of individual tissues from chow-fed (closed bars) or KD-fed(open bars) ob/ob mice determined by ELISA. These levels in eachtissue were normalized with respect to the relative content of actin ineach protein extract and the relative levels (OGT/Actin, OGA/Actin)were determined. 1, liver; 2, kidney; 3, pancreas; 4, skeletal muscle; 5,fat tissue. Error bars: mean ± S.D., n=9 (liver, kidney, pancreas) or 5
(skeletal muscle, fat tissue) from two independent experiments. *P<0.05, chow-fed ob/obmice vs. KD-fed ob/obmice. c, d Pooled samplesof individual liver (c) and fat (d) extracts of chow-fed (chow) and KD-fed ob/ob mice (KD) were separated by SDS-PAGE, and wereimmunoblotted with anti-OGT antibody (c) or anti-OGA antibody (d)respectively. ncOGT; nucleocytoplasmic OGT, sOGT; shortest form ofOGT, OGA-FL; cytosolic full-length form of OGA, OGA-NV; nuclearvariant of OGA
Glycoconj J

group was significantly lower (II, P<0.001; VI, P<0.01) thanthat in the chow-fed group (Fig. 3c). Other bands showed nosignificant difference between the two groups (Fig. 3b, arrowsI, III–V). Such reduced level ofO-GlcNAc protein in the liverwas also detected by the other anti-O-GlcNAc antibody (RL2)whose specificity is different from CTD110.6 antibody [31,32]. The Western blot analysis of liver extracts using RL2
antibody showed a different detection pattern to the patternusing CTD110.6 antibody (Supplemental Fig. S2a). The RL2antibody detected some intense bands, and we found that theexpression level of one of them was significantly lower inKD-fed group than chow-fed group (Fig. S2b).
We also analyzed the expression patterns of O-GlcNAc-modified proteins in kidney, pancreas, skeletal muscle, andfat tissue of ob/ob mice (Supplemental Figs. S3, S4), andfound several bands which alter the expression levels by KDfeeding. The analysis was performed with CTD 110.6 anti-body. In pancreas and skeletal muscle, we found two proteinbands (Fig. S3e, arrow IV; Fig. S4b, arrow IV) that theexpression levels are decreased by KD feeding (p<0.05).In contrast, we found two bands that are increased in kidney(Fig. S3b, arrow IV) and fat tissue (Fig. S4e, arrow III) byKD feeding (p<0.05).
Western blot analysis of O-GlcNAc-modified Akt proteinsin the liver of ob/ob mice
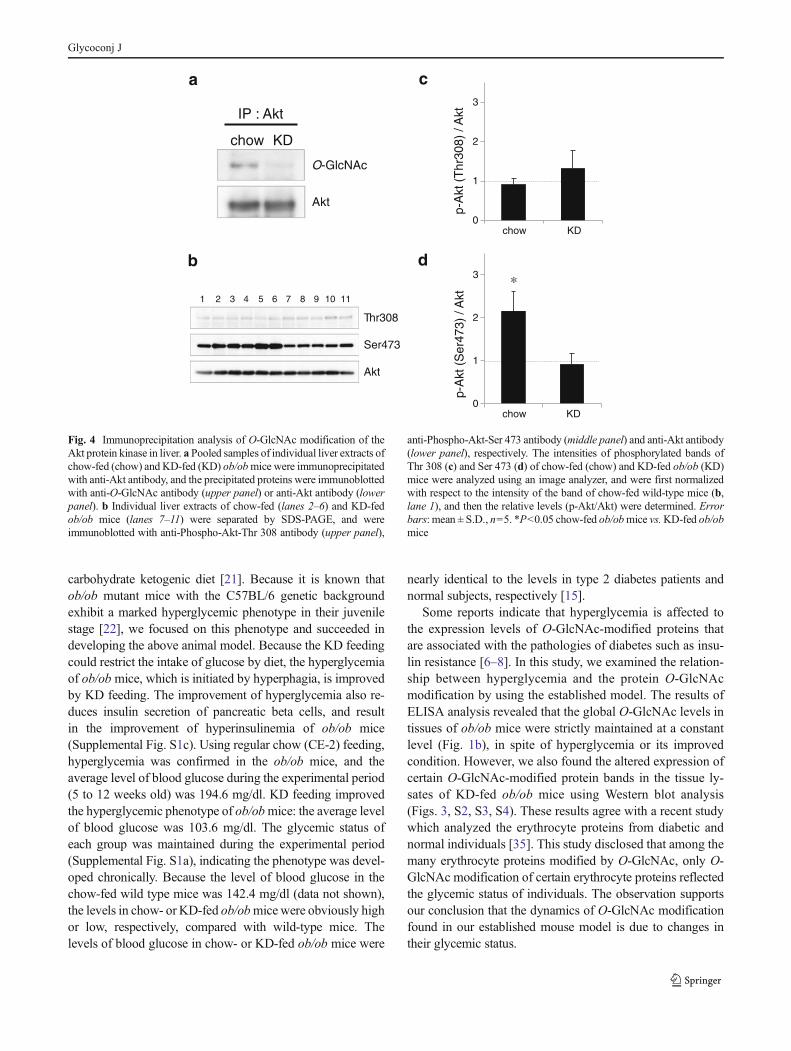
Because of the drastic decrease of serum insulin of the KD-fed ob/ob mice, (Supplemental Fig. 1c,), it was consideredthat the KD feeding has some effect on insulin signaling.Specifically, we investigated a phosphorylation status of Aktprotein kinase in the liver of both chow-fed and KD-fedob/ob mice by Western blotting. It is known that phosphor-ylation level of Akt at Ser 473 and Thr 308 are enhanced byinsulin stimulation and required for the activation of insulinsignaling pathway in the cell [33]. As expected, the phos-phorylation level of Akt at Ser 473 in chow-fed ob/ob micewas significantly higher than that of KD-fed ob/ob mice(Fig. 4b, d) due to the high level of serum insulin.However, there was no difference in the levels of phosphor-ylation of Akt at Thr 308 between two groups (Fig. 4b, c).The result indicates that the enhancement of Thr 308 phos-phorylation of Akt by high serum insulin is disturbed in theliver of chow-fed ob/ob mice. Because the Akt Thr 308phosphorylation is known to be attenuated by O-GlcNAcmodification of Akt protein [8, 10, 34], we investigated theO-GlcNAc modification of Akt protein in the both of ob/obmice group. We conducted Western blotting for the O-GlcNAc-modified protein which is immunoprecipitated byanti-Akt antibody. RL2 antibody was used in this assaybecause the O-GlcNAc-modified Akt was not detected bythe CTD110.6 antibody. As a result, the Akt protein in chow-fed ob/ob mice is modified by O-GlcNAc, and the modifi-cation level is decreased by KD feeding (Fig. 4a).
Discussion
We have recently reported a mouse model in which the gly-cemic status is controlled by feeding a regular or a low
Fig. 3 Western blot analysis of O-GlcNAc-modified proteins in liver.Individual liver extracts of chow-fed (lanes 2–6) and KD-fed ob/obmice (lanes 7–11) were separated by SDS-PAGE, and stained with CBB(a) or analyzed by Western blotting (b). Liver extract from a chow-fedwild-type mouse (lane 1) was loaded as a reference. The arrowhead in(a) highlighted a protein band in which different expression was ob-served between chow and KD-fed ob/ob mice. Arrows (I–VI) in (b)were highlighted major protein bands detected by anti-O-GlcNAc anti-body. The band highlighted by arrow x is immunoglobulin-μ chainwhich was detected as background by the secondary antibody reaction.The lower panel in (b) indicated the result of Western blotting of actincontents in the extracts. c The intensities of major bands detected byWestern blotting (arrows in b, I–VI) were analyzed using an imageanalyzer and are represented as relative intensity. Error bars: mean ±S.E., n=9 from two independent experiments. **P<0.01, ***P<0.001chow-fed ob/ob mice vs. KD-fed ob/ob mice
Glycoconj J
carbohydrate ketogenic diet [21]. Because it is known thatob/ob mutant mice with the C57BL/6 genetic backgroundexhibit a marked hyperglycemic phenotype in their juvenilestage [22], we focused on this phenotype and succeeded indeveloping the above animal model. Because the KD feedingcould restrict the intake of glucose by diet, the hyperglycemiaof ob/ob mice, which is initiated by hyperphagia, is improvedby KD feeding. The improvement of hyperglycemia also re-duces insulin secretion of pancreatic beta cells, and resultin the improvement of hyperinsulinemia of ob/ob mice(Supplemental Fig. S1c). Using regular chow (CE-2) feeding,hyperglycemia was confirmed in the ob/ob mice, and theaverage level of blood glucose during the experimental period(5 to 12 weeks old) was 194.6 mg/dl. KD feeding improvedthe hyperglycemic phenotype of ob/obmice: the average levelof blood glucose was 103.6 mg/dl. The glycemic status ofeach group was maintained during the experimental period(Supplemental Fig. S1a), indicating the phenotype was devel-oped chronically. Because the level of blood glucose in thechow-fed wild type mice was 142.4 mg/dl (data not shown),the levels in chow- or KD-fed ob/obmicewere obviously highor low, respectively, compared with wild-type mice. Thelevels of blood glucose in chow- or KD-fed ob/ob mice were
nearly identical to the levels in type 2 diabetes patients andnormal subjects, respectively [15].
Some reports indicate that hyperglycemia is affected tothe expression levels of O-GlcNAc-modified proteins thatare associated with the pathologies of diabetes such as insu-lin resistance [6–8]. In this study, we examined the relation-ship between hyperglycemia and the protein O-GlcNAcmodification by using the established model. The results ofELISA analysis revealed that the global O-GlcNAc levels intissues of ob/ob mice were strictly maintained at a constantlevel (Fig. 1b), in spite of hyperglycemia or its improvedcondition. However, we also found the altered expression ofcertain O-GlcNAc-modified protein bands in the tissue ly-sates of KD-fed ob/ob mice using Western blot analysis(Figs. 3, S2, S3, S4). These results agree with a recent studywhich analyzed the erythrocyte proteins from diabetic andnormal individuals [35]. This study disclosed that among themany erythrocyte proteins modified by O-GlcNAc, only O-GlcNAc modification of certain erythrocyte proteins reflectedthe glycemic status of individuals. The observation supportsour conclusion that the dynamics of O-GlcNAc modificationfound in our established mouse model is due to changes intheir glycemic status.
O-GlcNAc
Akt
IP : Akt
chow KD
p-A
kt(S
er47
3) /
Akt
p -A
kt(T
hr30
8) /
Akt
a c
d
Thr308
Akt
Ser473
1 2 3 4 5 6 7 8 9 10 11
b
0
1
2
3
chow KD
0
1
2
3
chow KD
∗
Fig. 4 Immunoprecipitation analysis of O-GlcNAc modification of theAkt protein kinase in liver. a Pooled samples of individual liver extracts ofchow-fed (chow) and KD-fed (KD) ob/obmice were immunoprecipitatedwith anti-Akt antibody, and the precipitated proteins were immunoblottedwith anti-O-GlcNAc antibody (upper panel) or anti-Akt antibody (lowerpanel). b Individual liver extracts of chow-fed (lanes 2–6) and KD-fedob/ob mice (lanes 7–11) were separated by SDS-PAGE, and wereimmunoblotted with anti-Phospho-Akt-Thr 308 antibody (upper panel),
anti-Phospho-Akt-Ser 473 antibody (middle panel) and anti-Akt antibody(lower panel), respectively. The intensities of phosphorylated bands ofThr 308 (c) and Ser 473 (d) of chow-fed (chow) and KD-fed ob/ob (KD)mice were analyzed using an image analyzer, and were first normalizedwith respect to the intensity of the band of chow-fed wild-type mice (b,lane 1), and then the relative levels (p-Akt/Akt) were determined. Errorbars: mean ± S.D., n=5. *P<0.05 chow-fed ob/obmice vs.KD-fed ob/obmice
Glycoconj J

Although the regulatory mechanism of altered expressionof the O-GlcNAc-modified protein observed in the KD-fedob/ob mice remains unclear, this study provided valuableinformation about the mechanism. In the liver, a decreasedexpression of OGT, especially sOGT isoform, was found inthe ob/ob mice after being fed KD (Fig. 2c). Previous reportshows that sOGT retains a potentially active catalytic do-main, but not the ability to glycosylate substrate proteins thatare glycosylated by other OGT isoforms [27]. The substratespecificity of sOGT might be involved in the altered expres-sion of certain O-GlcNAc proteins (Fig. 3b, arrow II and VI)in the KD-fed ob/ob mice. In the fat tissue, we found de-creased expression of OGA (Fig. 2b) and enhanced expres-sion of an O-GlcNAc modified protein (Fig. S4e, arrow III)in the ob/ob mice after being fed KD. Western blot analysisrevealed that a single isoform of OGA (OGA-FL) was pre-dominantly expressed in the fat tissue (Fig. 2d). Becauseisoform variations are not observed, the OGA-FL plays animportant role in the regulation of O-GlcNAc modified pro-teins in fat tissue. We consider that the alteration of OGA-FLkinetics to substrate proteins leads to such specific increaseof O-GlcNAc proteins. Protein analysis revealed that im-provement of hyperglycemia reduces not only the expressionlevels of OGT and OGA but also the expression levels ofseveral proteins in the ob/ob mice tissues (Fig. 3a, S3d, S4d,arrowheads). The results suggested that the decreased ex-pression of the O-GlcNAc-modified protein might be partlydue to the decreased expression of its core protein.
In this study, we found a protein modified by O-GlcNActhat is markedly decreased in the ob/ob mice liver by KDfeeding (Fig. 3b, arrow II). The protein property might be aprospective index for nutritional therapy for hyperglycemia-associated diseases. Although we have examined to identifythe O-GlcNAc-modified protein but we failed to identify theprotein substrate. Further investigation using our establishedmouse model will help to identify the protein, and clarify theability as a marker for hyperglycemia-associated diseases.
Immunoprecipitation analysis revealed that Akt proteinkinase is modified by O-GlcNAc in the liver of ob/ob mice,and the modification level is decreased by improvement ofhyperglycemia. The O-GlcNAc modification of Akt wasknown to be increased by treatment of OGA inhibitor(PugNAc) or overexpression of OGT [8, 10, 34, 36]. Ourresults demonstrated that the modification is also increasedby hyperglycemia in vivo. We also found a disturbance of thephosphorylation of Akt at Thr 308 in the liver under hyper-glycemia. It is known that the two phosphorylations (at Ser473 and Thr 308 of Akt), which are enhanced by insulinstimulation, are required for the full activation of Akt andinsulin signaling pathway in the cell [33]. Thus, it is consid-ered reasonable that the phosphorylation level of both AktSer 473 and Akt Thr 308 will be increased in the chow-fedmice, because of the high serum insulin level in these mice
(Fig. S1c). However, no increase in the phosphorylationlevel of Akt Thr 308 of chow-fed mice was observed com-pared to KD-fed mice, whereas the phosphorylation level ofSer 473 was significantly higher in chow-fed mice than KD-fed mice (Fig. 4c, d). Because it has been reported that O-GlcNAc modification of Akt attenuated the phosphorylationlevels of Akt at Thr 308 but not at Ser 473 [8], the distur-bance of Akt Thr 308 phosphorylation should be due to thehigh level of O-GlcNAc modification on Akt. This pheno-type might be related to insulin resistance that is observed inthe patients of diabetes mellitus. The phosphorylation andO-GlcNAc modification of Akt are dynamically regulated atthe phosphoinositide-containing membrane domain in thecell [8]. Like Akt, OGT has phosphoinositide-binding do-main, and the domain locates at the C-terminal region ofOGT. Insulin stimulation promotes the phosphoinositide-mediated interaction of Akt and OGT, and then enhancesthe O-GlcNAc modification of Akt. Because sOGT re-tains the phosphoinositide-binding domain [37] and in-creases the expression level in chow-fed ob/ob miceliver, this OGT isoform might promote the O-GlcNAcmodification of Akt under hyperglycemic condition.
Our study also showed that KD feeding improves not onlyhyperglycemia but also hyperinsulinemia in the ob/ob mice.It is reported that activation of insulin signaling pathway incells could also enhance the O-GlcNAc modification of Akt[36]. They showed that the activation of insulin signalingpathway by insulin-like growth factor 1 (IGF-1) stimulationinduces the simultaneous O-GlcNAc modification and Aktphosphorylations in neuroblastoma cells. Our result also in-dicates that improvement of hyperinsulinemia relates to thereduced level of O-GlcNAc modification of Akt in vivo,though it remains unclear whether directly or indirectly KDfeeding controls the O-GlcNAc modification of Akt. It isexpected to elucidate the mechanisms how hyperglycemiapromotes the O-GlcNAc modification of Akt in vivo andutilize KD feeding for the treatment of the pathologies in-volving O-GlcNAc modified Akt in near future.
In conclusion, the established mouse model is useful inevaluating the in vivo dynamics of O-GlcNAc modificationthat is associated with glycemic status. This study also re-vealed that global O-GlcNAc levels in tissue proteins werestrictly maintained at a constant level, in spite of their gly-cemic status, whereas the expression levels of certain O-GlcNAc-modified proteins responded to the glycemic status.We propose that the O-GlcNAc-modified proteins that re-spond to glycemic status will be a prospective index fornutritional therapy for hyperglycemia-associated diseases.
Acknowledgments This work was supported by JSPS KAKENHI(22700780 and 24700895) and by a Sasakawa Scientific ResearchGrant from The Japan Science Society.
Glycoconj J
References
1. Hart, G.W., Housley, M.P., Slawson, C.: Cycling of O-linked beta-N-acetylglucosamine on nucleocytoplasmic proteins. Nature 446,1017–1022 (2007)
2. Haltiwanger, R.S., Blomberg, M.A., Hart, G.W.: Glycosylation ofnuclear and cytoplasmic proteins. Purification and characterizationof a uridine diphospho-N-acetylglucosamine:polypeptide beta-N-acetylglucosaminyltransferase. J. Biol. Chem. 267, 9005–9013(1992)
3. Dong, D.L., Hart, G.W.: Purification and characterization of an O-GlcNAc selectiveN-acetyl-beta-D-glucosaminidase from rat spleencytosol. J. Biol. Chem. 269, 19321–19330 (1994)
4. Hu, P., Shimoji, S., Hart, G.W.: Site-specific interplay between O-GlcNAcylation and phosphorylation in cellular regulation. FEBS Lett.584, 2526–2538 (2010)
5. Butkinaree, C., Park,K.,Hart, G.W.:O-linked beta-N-acetylglucosamine(O-GlcNAc): extensive crosstalk with phosphorylation to regulate sig-naling and transcription in response to nutrients and stress. Biochim.Biophys. Acta 1800, 96–106 (2010)
6. Copeland, R.J., Bullen, J.W., Hart, G.W.: Cross-talk betweenGlcNAcylation and phosphorylation: roles in insulin resistance andglucose toxicity. Am. J. Physiol. Endocrinol. Metab. 295, E17–E28(2008)
7. Dias, W.B., Hart, G.W.: O-GlcNAc modification in diabetes andAlzheimer’s disease. Mol. Biosyst. 3, 766–772 (2007)
8. Yang, X., Ongusaha, P.P., Miles, P.D., Havstad, J.C., Zhang, F., So,W.V., Kudlow, J.E., Michell, R.H., Olefsky, J.M., Field, S.J., Ev-ans, R.M.: Phosphoinositide signaling links O-GlcNAc transferaseto insulin resistance. Nature 451, 964–969 (2008)
9. Dentin, R., Hedrick, S., Xie, J., Yates 3rd, J., Montminy, M.: Hepaticglucose sensing via the CREB coactivator CRTC2. Science 319,1402–1405 (2008)
10. Vosseller, K., Wells, L., Lane, M.D., Hart, G.W.: Elevatednucleocytoplasmic glycosylation by O-GlcNAc results in insulinresistance associated with defects in Akt activation in 3T3-L1 adipo-cytes. Proc. Natl. Acad. Sci. U. S. A. 99, 5313–5318 (2002)
11. Taylor, R.P., Parker, G.J., Hazel, M.W., Soesanto, Y., Fuller, W.,Yazzie, M.J., McClain, D.A.: Glucose deprivation stimulates O-GlcNAc modification of proteins through up-regulation of O-linkedN-acetylglucosaminyltransferase. J. Biol. Chem. 283, 6050–6057(2008)
12. Cheung, W.D., Hart, G.W.: AMP-activated protein kinase and p38MAPK activate O-GlcNAcylation of neuronal proteins during glu-cose deprivation. J. Biol. Chem. 283, 13009–13020 (2008)
13. Taylor, R.P., Geisler, T.S., Chambers, J.H., McClain, D.A.: Up-regulation of O-GlcNAc transferase with glucose deprivation inHepG2 cells is mediated by decreased hexosamine pathway flux.J. Biol. Chem. 284, 3425–3432 (2009)
14. Kang, J.G., Park, S.Y., Ji, S., Jang, I., Park, S., Kim, H.S., Kim,S.M., Yook, J.I., Park, Y.I., Roth, J., Cho, J.W.: O-GlcNAc proteinmodification in cancer cells increases in response to glucose depri-vation through glycogen degradation. J. Biol. Chem. 284, 34777–34784 (2009)
15. Park, K., Saudek, C.D., Hart, G.W.: Increased expression of beta-N-acetylglucosaminidase in erythrocytes from individuals with pre-diabetes and diabetes. Diabetes 59, 1845–1850 (2010)
16. Liu, K., Paterson, A.J., Chin, E., Kudlow, J.E.: Glucose stimulatesprotein modification by O-linked GlcNAc in pancreatic beta cells:linkage ofO-linked GlcNAc to beta cell death. Proc. Natl. Acad. Sci.U. S. A. 97, 2820–2825 (2000)
17. Housley, M.P., Rodgers, J.T., Udeshi, N.D., Kelly, T.J., Shabanowitz,J., Hunt, D.F., Puigserver, P., Hart, G.W.: O-GlcNAc regulates FoxOactivation in response to glucose. J. Biol. Chem. 283, 16283–16292(2008)
18. Levi, I., Segev, Y., Priel, E.: Type 1 diabetes affects topoisomerase Iactivity and GlcNAcylation in rat organs: kidney liver and pancre-as. Glycobiology 22, 704–713 (2012)
19. Roos, M.D., Xie, W., Su, K., Clark, J.A., Yang, X., Chin, E.,Paterson, A.J., Kudlow, J.E.: Streptozotocin, an analog of N-acetylglucosamine, blocks the removal of O-GlcNAc from intra-cellular proteins. Proc. Assoc. Am. Physicians 110, 422–432 (1998)
20. Hanover, J.A., Lai, Z., Lee, G., Lubas, W.A., Sato, S.M.: ElevatedO-linked N-acetylglucosamine metabolism in pancreatic beta-cells.Arch. Biochem. Biophys. 362, 38–45 (1999)
21. Okuda, T., Morita, N.: A very low carbohydrate ketogenic diet pre-vents the progression of hepatic steatosis caused by hyperglycemia ina juvenile obese mouse model. Nutr. Diabetes 2, e50 (2012)
22. Coleman, D.L., Hummel, K.P.: The influence of genetic back-ground on the expression of the obese (Ob) gene in the mouse.Diabetologia 9, 287–293 (1973)
23. Badman, M.K., Kennedy, A.R., Adams, A.C., Pissios, P., Maratos-Flier, E.: A very low carbohydrate ketogenic diet improves glucosetolerance in ob/obmice independent of weight loss. Am. J. Physiol.Endocrinol. Metab. 297, E1197–E1204 (2009)
24. Kennedy, A.R., Pissios, P., Out, H., Roberson, R., Xue, B.,Asakura, K., Furukawa, N., Marino, F.E., Liu, F.F., Kahn, B.B.,Libermann, T.A., Maratos-Flier, E.: A high-fat, ketogenic diet in-duces a unique metabolic state in mice. Am. J. Physiol. Endocrinol.Metab. 292, E1724–E1739 (2007)
25. Comer, F.I., Vosseller, K., Wells, L., Accavitti, M.A., Hart, G.W.:Characterization of a mouse monoclonal antibody specific for O-linked N-acetylglucosamine. Anal. Biochem. 293, 169–177 (2001)
26. Teo, C.F., Ingale, S., Wolfert, M.A., Elsayed, G.A., Nöt, L.G., Chatham,J.C.,Wells, L., Boons,G.J.: Glycopeptide-specificmonoclonal antibodiessuggest new roles for O-GlcNAc. Nat. Chem. Biol. 6, 338–343 (2010)
27. Lazarus, B.D., Love, D.C., Hanover, J.A.: Recombinant O-GlcNActransferase isoforms: identification ofO-GlcNAcase, yes tyrosine kinase,and tau as isoform-specific substrates. Glycobiology 16, 415–421 (2006)
28. Hanover, J.A., Yu, S., Lubas, W.B., Shin, S.H., Ragano-Caracciola,M., Kochran, J., Love, D.C.: Mitochondrial and nucleocytoplasmicisoforms of O-linked GlcNAc transferase encoded by a singlemammalian gene. Arch. Biochem. Biophys. 409, 287–297 (2003)
29. Liu, Y., Li, X., Yu, Y., Shi, J., Liang, Z., Run, X., Li, Y., Dai, C.L.,Grundke-Iqbal, I., Iqbal, K., Liu, F., Gong, C.X.: Developmentalregulation of proteinO-GlcNAcylation,O-GlcNAc transferase, andO-GlcNAcase in mammalian brain. PLoS One 7, e43724 (2012)
30. Macauley, M.S., Vocadlo, D.J.: Enzymatic characterization andinhibition of the nuclear variant of human O-GlcNAcase.Carbohydr. Res. 344, 1079–1084 (2009)
31. Snow, C.M., Senior, A., Gerace, L.: Monoclonal antibodies identifya group of nuclear pore complex glycoproteins. J. Cell. Biol. 104,1143–1156 (1987)
32. Holt, G.D., Snow, C.M., Senior, A., Haltiwanger, R.S., Gerace, L., Hart,G.W.: Nuclear pore complex glycoproteins contain cytoplasmically dis-posedO-linkedN-acetylglucosamine. J. Cell. Biol. 104, 1157–1164 (1987)
33. Manning, B.D., Cantley, L.C.: AKT/PKB signaling: navigatingdownstream. Cell 129, 1261–1274 (2007)
34. Wang, S., Huang, X., Sun, D., Xin, X., Pan, Q., Peng, S., Liang, Z.,Luo, C., Yang, Y., Jiang, H., Huang, M., Chai, W., Ding, J., Geng,M.: Extensive crosstalk between O-GlcNAcylation and phosphor-ylation regulates Akt signaling. PLoS One 7, e37427 (2012)
35. Wang, Z., Park, K., Comer, F., Hsieh-Wilson, L.C., Saudek, C.D., Hart,G.W.: Site-specific GlcNAcylation of human erythrocyte proteins:potential biomarker(s) for diabetes. Diabetes 58, 309–317 (2009)
36. Gandy, J.C., Rountree, A.E., Bijur, G.N.: Akt1 is dynamically mod-ified with O-GlcNAc following treatments with PUGNAc andinsulin-like growth factor-1. FEBS Lett. 580, 3051–3058 (2006)
37. Lazarus, B.D., Love, D.C., Hanover, J.A.: O-GlcNAc cycling:implications for neurodegenerative disorders. Int. J. Biochem. CellBiol. 41, 2134–2146 (2009)
Glycoconj J