Embed Size (px)
Citation preview

Altered corpus callosum morphologyassociated with autism over the first 2 yearsof life
Jason J. Wolff,1 Guido Gerig,2 John D. Lewis,3 Takahiro Soda,4,5 Martin A. Styner,5,6
Clement Vachet,2 Kelly N. Botteron,7 Jed T. Elison,8 Stephen R. Dager,9
Annette M. Estes,10 Heather C. Hazlett,5,6 Robert T. Schultz,11 Lonnie Zwaigenbaum12 andJoseph Piven5,6 for the IBIS Network†
†For details of the IBIS Network see Appendix 1
Numerous brain imaging studies indicate that the corpus callosum is smaller in older children and adults with autism spectrum
disorder. However, there are no published studies examining the morphological development of this connective pathway in infants
at-risk for the disorder. Magnetic resonance imaging data were collected from 270 infants at high familial risk for autism spectrum
disorder and 108 low-risk controls at 6, 12 and 24 months of age, with 83% of infants contributing two or more data points.
Fifty-seven children met criteria for ASD based on clinical-best estimate diagnosis at age 2 years. Corpora callosa were measured
for area, length and thickness by automated segmentation. We found significantly increased corpus callosum area and thickness in
children with autism spectrum disorder starting at 6 months of age. These differences were particularly robust in the anterior
corpus callosum at the 6 and 12 month time points. Regression analysis indicated that radial diffusivity in this region, measured by
diffusion tensor imaging, inversely predicted thickness. Measures of area and thickness in the first year of life were correlated with
repetitive behaviours at age 2 years. In contrast to work from older children and adults, our findings suggest that the corpus
callosum may be larger in infants who go on to develop autism spectrum disorder. This result was apparent with or without
adjustment for total brain volume. Although we did not see a significant interaction between group and age, cross-sectional data
indicated that area and thickness differences diminish by age 2 years. Regression data incorporating diffusion tensor imaging
suggest that microstructural properties of callosal white matter, which includes myelination and axon composition, may explain
group differences in morphology.
1 Department of Educational Psychology, University of Minnesota, Minneapolis, MN, USA2 Scientific Computing and Imaging Institute, University of Utah, Salt Lake City, UT, USA3 Montreal Neurological Institute, McGill University, Montreal, QC, Canada4 Health Sciences and Technology, Harvard Medical School and Massachusetts Institute of Technology, Boston, MA, USA5 Department of Psychiatry, University of North Carolina at Chapel Hill, Chapel Hill, NC, USA6 Carolina Institute for Developmental Disabilities, University of North Carolina at Chapel Hill, Chapel Hill, NC, USA7 Department of Psychiatry, Washington University at St. Louis, St. Louis, MO, USA8 Institute for Child Development, University of Minnesota, Minneapolis, MN, USA9 Department of Radiology, University of Washington, Seattle, WA, USA10 Department of Speech and Hearing Science, University of Washington, Seattle, WA, USA11 Centre for Autism Research, Children’s Hospital of Philadelphia, Philadelphia, PA, USA12 Department of Paediatrics, University of Alberta, Edmonton AB, Canada
doi:10.1093/brain/awv118 BRAIN 2015: Page 1 of 13 | 1
Received December 19, 2014. Revised February 24, 2015. Accepted March 6, 2015.
� The Author (2015). Published by Oxford University Press on behalf of the Guarantors of Brain. All rights reserved.
For Permissions, please email: [email protected]
Brain Advance Access published May 3, 2015by guest on M
ay 4, 2015D
ownloaded from

Correspondence to: Jason Wolff, Ph.D.,
Department of Educational Psychology
University of Minnesota
56 East River Road
Minneapolis, MN 55455, USA
E-mail: [email protected]
Keywords: autism; brain development; corpus callosum; infants
Abbreviations: ADOS = Autism Diagnostic Observation Schedule; ASD = autism spectrum disorder; DTI = diffusion tensorimaging
IntroductionAutism spectrum disorder (ASD) emerges early in life, un-
folding during a time of dynamic brain and behavioural
development. Though severity varies greatly across affected
individuals, ASD is characterized by core symptoms of im-
paired social communication and restricted and repetitive
behaviours, as well as associated features including intellec-
tual disability and impaired sensorimotor function.
Although less established than many of the behavioural
markers associated with the disorder, there has been re-
markable progress made toward identifying replicable
neural features of ASD. Prominent findings include evi-
dence of cerebral enlargement, evident particularly in
early childhood (Piven et al., 1995; Sparks et al., 2002;
Redcay and Courchesne, 2005; Schumann et al., 2010;
Hazlett et al., 2011; Shen et al., 2013; Zielinski et al.,
2014), as well as dynamic, age-dependent patterns of atyp-
ical structural and functional connectivity (Just et al., 2007;
Wolff et al., 2012; Khan et al., 2013; Nair et al., 2013;
Lewis et al., 2014). Identifying the neural markers of ASD
specific to infancy, before the consolidation of core behav-
ioural symptoms, may elucidate pathogenesis and provide
novel targets for screening and intervention.
Among the most replicated brain imaging findings in
ASD is that of a disproportionally small corpus callosum
relative to overall brain size. Early MRI studies of autism
found significant reductions in the corpus callosum, par-
ticularly among posterior regions, in children and adults
with autistic disorder relative to control subjects (Egaas
et al., 1995; Piven et al., 1997; Manes et al., 1999).
More recent work using higher resolution imaging proto-
cols have identified similar reductions in corpus callosum
size in adults (Freitag et al., 2009) and both children and
adults (Waiter et al., 2005; Just et al., 2007; Hardan et al.,
2009; Keary et al., 2009) with ASD. A meta-analysis of this
work indicates that decreased corpus callosum size asso-
ciated with ASD is observed in terms of total corpus callo-
sum area as well as most subdivisions (Frazier and Hardan,
2009). In addition to area and volume, differences have
also been observed in corpus callosum thickness, with the
splenium and genu particularly ‘thinner’ in school-age chil-
dren with the disorder (Vidal et al., 2006). Others have
found an inverse relationship between corpus callosum
size and symptom severity in addition to reduced corpus
callosum area in school-age children (Hardan et al., 2009)
and children and adults with ASD (Prigge et al., 2013). A
notable exception to this body of work comes from
Lefebvre et al. (2015), who found no evidence for corpus
callosum differences in a large sample of 7 to 40 year olds
with ASD obtained from the ABIDE database of multicen-
tre imaging data. While a notable null finding, that study
included only high-functioning individuals whose Autism
Diagnostic Observation Schedule (ADOS) severity was at
the threshold for ASD cut-off, and did not examine age
effects beyond its inclusion as a covariate.
Despite a wealth of cross-sectional data on the corpus
callosum in older children and adults with ASD, very
little is known about the early development of this struc-
ture. The closest exception comes from a study of 4-year-
olds indicating decreased total corpus callosum area in chil-
dren with ASD relative to typically developing peers
(Boger-Megiddo et al., 2006). This finding, which was evi-
dent only with adjustment for brain volume, extended to
five of seven corpus callosum subdivisions. A longitudinal
study of corpus callosum morphology in ASD by Frazier
et al. (2012) identified relatively stable trajectories of
decreased corpus callosum volume from ages 8 to 16
years in males with ASD relative to control subjects.
Together, these studies provide evidence that atypical
corpus callosum morphology may be present from pre-
school age in ASD, and that the phenomenon is relatively
fixed thereafter.
The past two decades of published literature includes
over a dozen independent studies identifying a relatively
smaller corpus callosum in children and adults with ASD.
It is yet unknown whether this morphological difference is
evident over the first years of life, during which time the
core symptoms of autism first emerge. It is also unknown
the extent to which corpus callosum differences extend to
unaffected family members who may share features of gen-
etic risk. Neural markers of ASD that emerge early and
persist across development may represent promising endo-
phenotypes (Gottesman and Gould, 2003; Iacono and
Malone, 2011). Family designs comparing probands with
unaffected siblings and control participants are uniquely
suited to identify heritable features of psychiatric disorders
such as ASD. In this study, we aimed to characterize
2 | BRAIN 2015: Page 2 of 13 J. J. Wolff et al.
by guest on May 4, 2015
Dow
nloaded from

developmental trajectories of corpus callosum morphology
from ages 6 to 24 months in a prospective sample of in-
fants at low and high familial risk for ASD. We were spe-
cifically interested in determining: (i) if and when corpus
callosum size in infants with ASD diverged from a typical
pattern of development; (ii) whether features of corpus cal-
losum morphology are unique to ASD or shared among
high-risk infants; and (iii) whether and how early morpho-
logical differences related to later behavioural features. As
an ancillary aim, we leveraged diffusion tensor imaging
(DTI) data to investigate microstructural properties contri-
buting to observed differences in morphology.
Materials and methods
Participants
Participants were part of the Infant Brain Imaging Study, anongoing longitudinal study of infants at low- and high-familialrisk for ASD. Infants were recruited, screened, and assessed atone of four sites: University of North Carolina, University ofWashington, Children’s Hospital of Philadelphia, andWashington University in St. Louis. Initial exclusion criteriaincluded: (i) evidence of a genetic condition or syndrome; (ii)significant medical condition affecting development; (iii) signifi-cant vision or hearing impairment; (iv) children with birthweight 52000 g or gestational age 536 weeks; (v) significantperinatal adversity or pre-natal exposure to neurotoxins; (vi)contraindication for MRI; (vii) predominant home languageother than English; (viii) children who were adopted or halfsiblings; (ix) first degree relative with psychosis, schizophrenia,or bipolar disorder; and (x) twins.
Infants at high familial risk were defined as such if they hadan older sibling with a community diagnosis of ASD, con-firmed by the SCQ (Social Communication Questionnaire;Rutter et al., 2003) and Autism Diagnostic Interview-Revised(Lord et al., 1994). Infants at low familial risk were defined byvirtue of having a typically developing older sibling whoscreened negative on the SCQ and no first degree relativeswith a developmental disability. All study procedures wereapproved by institutional review at each site, and informed,written consent was obtained from all participants.
This study included children with imaging data for at leastone time point and a complete diagnostic assessment at age 2years. Participants were grouped by familial risk status (low-or high-risk sibling) and diagnostic outcome based on clinicalbest estimate made by experienced, licensed clinicians using theDSM-IV-TR (Diagnostic and Statistical Manual of MentalDisorders, 4th Edition, Text Revision) checklist and supportedby all available behavioural assessment data. Diagnostic clas-sification for each case was independently verified based onvideo and record review by a second clinician naıve to riskand initial classification. Three low-risk children meeting cri-teria for ASD were excluded as this group was too small toanalyse separately. One child from the low-risk control groupwas excluded for evidence of severe/profound global develop-mental delay. This approach to group classification yielded378 total participants: 108 low-risk controls without ASD,213 children classified as high-risk ASD negative, and 57
children classified as high-risk ASD-positive. Children meetingcriteria for ASD or autism on the ADOS but who were deter-mined by clinicians not to have the disorder were included inthe high-risk ASD-negative group to maintain naturally occur-ring hetereogeneity. The majority of participants (83%) con-tributed imaging data for two or more time points. There wereno group differences in proportion of scan failures betweenrisk or diagnostic groups. Descriptive and demographic datafor study participants are presented in Table 1.
Clinical measures
The ADOS (Lord et al., 2000) is a semi-structured assessmentof behavioural symptoms associated with ASD. It providedinformation contributing to clinical best estimate determin-ation as well as an overall severity score (Gotham et al.,2009), a standardized measure reflecting social affect and re-petitive behaviour symptoms observed during administrationof the ADOS. The ADOS also yields domain scores forSocial Affect and Restricted and Repetitive Behaviours, theformer of which was used to characterize the relationship ofmorphological features to social-communicative symptomsassociated with ASD. The Repetitive Behaviour Scales–Revised (RBS-R; Bodfish et al., 2000) is a parent rated measureof severity and repertoire of repetitive behaviour. RBS-R ‘totalrepetitive behaviours endorsed’ shows good dimensionality atage 2 and was selected over the ADOS to characterize thissymptom domain in relation to imaging measures (Wolffet al., 2014). The Mullen Scales of Early Learning (Mullen,1995) is a standardized developmental assessment forchildren from birth to 68 months. The Mullen provides anEarly Learning Composite score, which reflects overallcognitive and motor skill development. Mullen scores fromage 12 months were used for two participants missing com-plete data at 24 months. Clinical assessment reliability wasestablished and maintained through monthly cross-sitecalibration.
Image acquisition
MRI scans were acquired on identical 3 T Siemens TIM Trioscanners equipped with 12-channel head coils during naturalsleep. The imaging protocol included: sagittal T1 MPRAGE(repetition time = 2400 ms, echo time = 3.16 ms, slice thick-ness = 1 mm, field of view = 256 mm, 256 � 160 matrix), 3DT2 fast spin echo (repetition time = 3200 ms, echotime = 499 ms, slice thickness = 1 mm, field of view = 256 mm,256 � 160 matrix), and 25-direction ep2d_diff sequence withfield of view = 190 mm (6 and 12 months) or field ofview = 209 mm (24 months), 75–81 transversal slices, slicethickness = 2 mm isotropic, 2 � 2 � 2 mm3 voxel resolution,repetition time = 12 800–13 300 ms, echo time = 102 ms,variable b-values between 0 and 1000 s/mm2. Intra- and inter-site reliability was initially established and maintained acrossclinical sites over time through traveling human phantoms(Gouttard et al., 2008).
Corpus callosum segmentation
Initial preprocessing of T1-weighted images provided a rigidalignment to normative atlas space where the cross-section ofthe corpus callosum was aligned with the midsagittal plane.
Early corpus callosum development in ASD BRAIN 2015: Page 3 of 13 | 3
by guest on May 4, 2015
Dow
nloaded from

Sagittal slices within �2 mm of the midsagittal plane (five totalslices) were averaged to create the single 2D image withinwhich the corpus callosum was segmented. Segmentation wasperformed via the CCSeg tool (Vachet et al., 2012) which usesa statistical model of contour shape and image appearance ofthe corpus callosum (Szekely et al., 1996; Vachet et al., 2012)based on the concept of active appearance models (Cooteset al., 2001). Starting from the average shape, the corpus cal-losum contour is iteratively deformed to match the imageintensities while restricting deformations to the model shapestatistics. In a final step, the contour is deformed without re-strictions but only within a close neighbourhood. The modelused here was trained with image data from an independentpaediatric study (Cascio et al., 2006). Through the model de-formation, this approach provides a direct point-to-point cor-respondence of corpus callosum boundaries for all subjectimages. Contours were visually inspected by a blind rater(T.S.) for quality of segmentation and manually correctedthrough re-initialization or insertion of a repulsion point torestrain the model (Vachet et al., 2012). Approximately 12%of cases required manual correction based on visual qualitycontrol. About 5% of image data required simple re-initializa-tion (i.e. the initial translation and rotation that aligns theaverage corpus callosum contour to the image prior to deform-ation), while for 7% manual expert refinement of contour seg-mentation was applied by adding a repulsion point (Kass,1988) to allow the contour to find a state of minimumenergy. Within- and between-rater reliability for manual refine-ment of corpus callosum contours has been previously re-ported for this sample as 0.99 (Vachet et al., 2012).There were no significant differences among groups for pro-portion of data requiring manual correction.
Brain volume segmentation
Brain tissue volumes were obtained through a framework ofatlas-moderated expectation-maximization with co-registration
of T1- and T2-weighted MRI images, bias correction, skullstripping, and multimodal tissue classification using theAutoSeg toolkit (http://www.nitrc.org/projects/autoseg/).Population average templates and corresponding probabilisticbrain tissue priors for grey and white matter were created forthe 6, 12, and 24 month old brain. Grey and white mattervolumes were summed to yield an estimate of total brainvolume.
Medial axis representation
Variability in corpus callosum shape is subject to extrinsicfactors such as rotation or bending, resulting from variancein brain shapes or type of image alignment, as well as intrinsicshape properties as measured by object length and local thick-ness, i.e. measurements that are invariant to the anatomicalcoordinate system. Whereas traditional methods of corpus cal-losum shape measurement are subject to both sources of vari-ance, our analysis focused on intrinsic shape properties. Wefollowed the framework of medial axis transformation, whichresults in a representation that is invariant to rotation, trans-lation and bending (Styner et al., 2003). Following Sun et al.(2007), the corpus callosum contour parameterization is trans-formed into a process-induced symmetric axis where corpuscallosum shapes are represented by the medial axis betweenthe end points of genu and splenium (length), with local width(or thickness) attributed to each medial axis point. Startingfrom 100 equidistant contour points and after resampling ofthe medial axis into equidistant length intervals, we computed25 medial axis points with attributed local thickness. It is im-portant to note that our segmentation results in parametricrepresentations of corpus callosum boundaries which afterconversion to invariant shapes leads to one-to-one point cor-respondences across subjects and age groups (Szekely et al.,1996). Supplementary Fig. 1 illustrates corpus callosumboundaries, medial axis definition and location, and thicknessmeasurements across age intervals.
Table 1 Descriptive and demographic data
High-risk ASD-positive High-risk ASD-negative Low-risk-Neg Pa
Total participants 57 213 108
6 m scan 9 14 8
12 m scan 1 18 7
24 m scan 6 8 4
6 and 12 m scans 2 32 33
6 and 24 m scans 5 15 11
12 and 24 m scans 10 42 8
6, 12 and 24 m scans 24 84 37
Age (Time 1) 6.6 (0.7) 6.6 (0.7) 6.7 (0.7) 0.78
Age (Time 2) 12.9 (0.8) 12.6 (0.6) 12.7 (0.7) 0.13
Age (Time 3) 24.8 (1.2) 24.8 (1.0) 24.7 (0.8) 0.92
ADOS severityb 5.8 (1.8) 1.6 (1.1) 1.5 (0.9) 50.001
IQc 79.8 (17.6) 101.7 (15.9) 110.9 (16.0) 50.001
Sex (% male)d 82.5 57.3 61.1 0.001
Mother’s educatione (% college or higher) 59.6 68.5 83.3 0.002
aOmnibus ANOVA (Age, ADOS severity, IQ) and Fisher’s exact tests (mother’s education, sex).bAvailable for 99% of total sample. Pairwise: high-risk ASD-positive4 high-risk ASD-negative, low-risk ASD-negative.cMullen Early Learning Composite. Pairwise: low-risk ASD-negative4 high-risk ASD-negative4 high-risk ASD-positive.dProportion of males: high-risk ASD-positive4 high-risk ASD-negative, low-risk-negative.eProportion of mothers with college degree or higher: low-risk ASD-negative4 high-risk ASD-negative, high-risk ASD-positive.
4 | BRAIN 2015: Page 4 of 13 J. J. Wolff et al.
by guest on May 4, 2015
Dow
nloaded from

DTI data processing
Diffusion-weighted images were first processed with DTIprepto automatically detect common artefacts, correct for motionand eddy current deformations, and exclude bad gradients (Liuet al., 2010; Oguz et al., 2014). Following this step, expertraters manually removed gradients presenting residual arte-facts. Data sets with fewer than 18 remaining gradients wereexcluded from further processing to ensure consistent signal-to-noise ratio. Post-processing analysis found no significantdifferences between diagnostic outcome groups in terms ofmotion or other artefacts affecting image quality. Group ana-lysis of diffusion weighted data used a previously reportedpipeline which provides consistent spatial parameterizationwithin and between individual data sets across age groups ina common atlas space (Goodlett et al., 2009; Verde et al.,2014).
Corpus callosum tractography was accomplished throughseed label mapping of the midsagittal atlas image using 3DSlicer (www.slicer.org), with acquired data limited to thethree centremost slices. Label maps for three subdivisions ofthe corpus callosum were created based on segmentationsdescribed by Witelson (1989). Resulting fibre track definitionswere processed for spurious or incomplete streamlines using3D Slicer and FibreViewerLight prior to fibre parameterizationand generation of fibre track data using DTIAtlasFibreAnalyzer (Verde et al., 2014). The open-source toolsconstituting this DTI processing pipeline are publicallyavailable through the UNC-Utah NA-MIC DTI fibre tract ana-lysis framework (www.nitrc.org/projects/namicdtifibre).
Statistical analysis
Longitudinal trajectories of corpus callosum morphologyacross 6, 12 and 24 months of age were analysed using re-peated measures mixed models with unstructured covariancematrices. This analytic approach allows for different patternsof missing data and accommodates an unbalanced design. Ourprimary set of dependent variables included total area, meanthickness, and mean length. Independent variables of interestincluded group, age, and the group � age interaction. A quad-ratic age term (age2) was added to the model for length basedon a priori visual analysis of graphed data. Total brain volumewas included as a covariate given its known relationship tocorpus callosum size as well as published data suggestingincreased brain volume among young children with ASD(Hazlett et al., 2011; Shen et al., 2013). Other control vari-ables included site, to account for possible variance related toscan sites, as well as factors which differed significantly be-tween groups: sex, Mullen Early Learning Composite,and mother’s education (Table 1). Potential effects of anage � site interaction were vetted and ultimately excludedfrom the primary analysis (Supplementary material). Toelucidate the effect of total brain volume on primary modelresults, follow-up analyses omitting this factor were alsogenerated.
Estimated marginal means for each imaging time point (6,12 and 24 months) were generated from our primary modeldescribed above and tested for cross-sectional group differ-ences. Following significant omnibus results, Bonferroni cor-rected pairwise comparisons were performed and estimates ofeffect size generated based on estimated marginal means and
standard errors. In a separate set of analyses, correlations con-trolling for total brain volume were generated to investigatewhether corpus callosum morphology (6 and 12 months) wasassociated with later clinical outcomes measured at age 24months. Clinical variables of interest included Mullen EarlyLearning Composite scores, ADOS social affect scores, andtotal inventory of repetitive behaviour from the RBS-R.These latter two measures were selected to disaggregatesocial affect and repetitive behaviour symptom domains. Alltests excepting post hoc comparisons were two-tailed with� = 0.05.
ResultsDemographic and clinical characteristics for participants
are presented in Table 1. Groups did not differ by age at
any of the three time points. Omnibus results indicated that
autism symptom severity based on the ADOS at age 2 dif-
fered significantly among groups, F(2,372) = 313.9,
P5 0.001. Consistent with classification according to clin-
ical outcome, autism severity was significantly higher
among children classified as high-risk ASD-positive relative
to either high-risk or low-risk ASD-negative groups
(P5 0.001), but did not differ between children classified
as high-risk ASD-negative and low-risk ASD-negative
(P = 0.61). There were significant group differences with
respect to sex (Fisher’s exact test, P = 0.001) and Mullen
Early Learning Composite score, F(2,375) = 69.4,
P5 0.000 (Table 1). Groups also differed in terms of
mother’s education (Fisher’s exact test, P = 0.002), with
low-risk controls having a higher proportion of mothers
with a college degree or greater.
Longitudinal and cross-sectionalcomparisons of corpus callosummorphology
Our primary set of analyses compared trajectories of mid-
sagittal corpus callosum total area, length, and thickness
between outcome groups over the 6- to 24-month age inter-
val with adjustment for total brain volume, sex, mother’s
education, site, and Mullen Early Learning Composite.
For total area, there was a significant effect for group,
F = 3.4, P = 0.036 and age, F = 538.7, P5 0.001, but not
group � age, F = 0.22, P = 0.80. Post hoc comparisons for
total area � group did not survive correction for multiple
comparisons.
We next proceeded to the primary components constitut-
ing area: length and thickness. For length, there was a sig-
nificant effect for age2 (F = 8.5, P = 0.004) but not group
(F = 0.4, P = 0.69) or the group � age2 interaction (F = 0.5,
P = 0.64). For thickness, there was a significant effect for
group (F = 6.1, P = 0.002) and age (F = 514.6, P = 50.001)
but not the group � age interaction (F = 0.42, P = 0.66).
Mixed-model adjusted trajectories for corpus callosum
total area, length, and thickness are presented in Fig. 1.
Early corpus callosum development in ASD BRAIN 2015: Page 5 of 13 | 5
by guest on May 4, 2015
Dow
nloaded from

Post hoc results indicated that thickness was significantly
greater for high-risk ASD-positive children relative to low-
risk ASD-negative (P = 0.008, d = 0.57) and near the
threshold for significance relative to high-risk ASD-negative
(P = 0.07, d = 0.40). High-risk- and low-risk ASD-negative
groups did not significantly differ from one another
(P = 0.29, d = 0.20).
Primary model results, as well as secondary analyses
omitting adjustment for total brain volume, are presented
in Table 2. Cross-sectional comparisons based on model
data made at each imaging time point (6, 12, and 24
months) indicated that the group effect for thickness was
strongest at age 6 months and statistically non-significant
by age 24 months (Table 3).
Localization of thickness differences
The main set of analyses pinpointed thickness as the pri-
mary driver of group differences in midsagittal corpus cal-
losum shape. To characterize this phenomenon in greater
detail, we generated effect size estimates (Cohen’s d) based
on primary model adjusted data for 25 regions comprising
the totality of the corpus callosum (Fig. 2). Cross-sectional
pair-wise comparisons for these regions did not survive
false-discovery rate correction. Per cent difference in
model-adjusted thickness values were also generated
(Supplementary Fig. 2). Pairwise differences were particu-
larly robust between high-risk ASD-positive and low-risk
ASD-negative groups at ages 6 and 12 months (Fig. 2).
At age 6 months, the strongest of these effects corres-
ponded to regions implicated in prefrontal, pre-/supplemen-
tary motor, and posterior-parietal connectivity (Hofer and
Frahm, 2006). At age 12 months, an increased effect was
seen in regions corresponding with primary motor connect-
ivity, while posterior differences became less robust. By age
24 months, effect sizes were weak overall, with posterior
regions showing an inverse pattern relative to that observed
at age 6 months.
Contribution of microstructuralproperties to thickness
Thickness results indicated that the anterior portion of the
corpus callosum was particularly enlarged in ASD from
ages 6 to 12 months. Based on previous work, we hypothe-
sized that corpus callosum overgrowth for this region in
human infants could stem from an excess of thin axons
secondary to excessive axon branching or deficient pruning
(Cowan et al., 1984; LaMantia and Rakic, 1990; Aboitiz
et al., 1992) as well as differences in myelination. To ad-
dress this hypothesis, we examined the contribution of
radial diffusivity in the centremost three slices of the anter-
ior third of the corpus callosum to thickness in this region.
We centred this analysis at the approximate midpoint of 12
months of age, which also represented the time point with
the largest number of subject scans. Radial diffusivity re-
flects diffusion orthogonal to the primary axis of the fibre
bundle. While not a direct measure of axon composition or
density, radial diffusivity was selected over alternative
measures (e.g. axial or mean diffusivity) given its higher
sensitivity to these factors (Klawiter et al., 2011). The an-
terior corpus callosum was selected given both its relevance
in the current findings as well as previous work suggesting
that size in this region is particularly linked to axon com-
position (Aboitiz et al., 1992; Hofer and Frahm, 2006).
A three-step hierarchical multiple regression analysis was
performed with mean thickness of the anterior third of the
corpus callosum fit as the dependent variable. Independent
variables entered into Step 1 included age, sex, site, total
brain volume, and Mullen Early Learning Composite. Step
2 added radial diffusivity for the anterior third of the
corpus callosum. Collinearity diagnostics indicated good
model stability (all VIF5 1.4, tolerance4 0.7). Variables
included in Step 1 accounted for R2 = 0.04 and differed
significantly from zero, F(5,258) = 2.3, P = 0.046. In Step
2, radial diffusivity of the anterior third of the corpus cal-
losum was added as an independent variable. The addition
of this variable resulted in a significant change in R2,
Figure 1 Mixed model adjusted trajectories for corpus callosum morphological features across risk-by-diagnosis groups.
6 | BRAIN 2015: Page 6 of 13 J. J. Wolff et al.
by guest on May 4, 2015
Dow
nloaded from
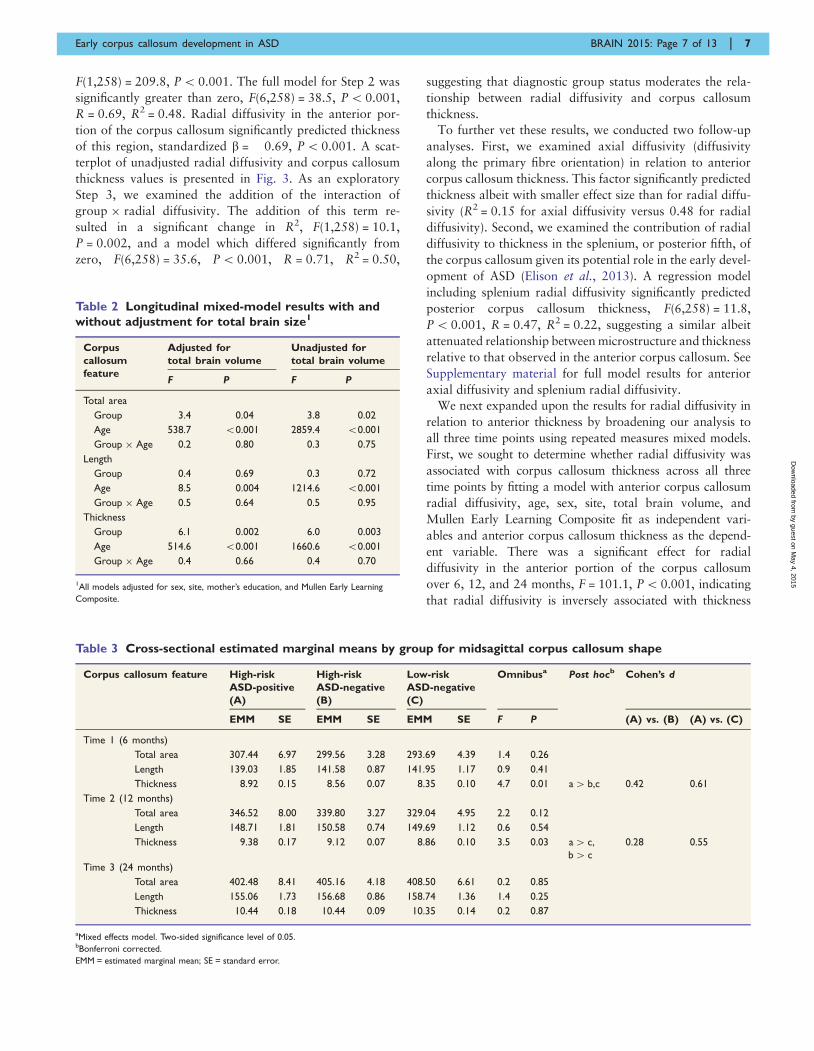
F(1,258) = 209.8, P5 0.001. The full model for Step 2 was
significantly greater than zero, F(6,258) = 38.5, P5 0.001,
R = 0.69, R2 = 0.48. Radial diffusivity in the anterior por-
tion of the corpus callosum significantly predicted thickness
of this region, standardized b = �0.69, P50.001. A scat-
terplot of unadjusted radial diffusivity and corpus callosum
thickness values is presented in Fig. 3. As an exploratory
Step 3, we examined the addition of the interaction of
group � radial diffusivity. The addition of this term re-
sulted in a significant change in R2, F(1,258) = 10.1,
P = 0.002, and a model which differed significantly from
zero, F(6,258) = 35.6, P5 0.001, R = 0.71, R2 = 0.50,
suggesting that diagnostic group status moderates the rela-
tionship between radial diffusivity and corpus callosum
thickness.
To further vet these results, we conducted two follow-up
analyses. First, we examined axial diffusivity (diffusivity
along the primary fibre orientation) in relation to anterior
corpus callosum thickness. This factor significantly predicted
thickness albeit with smaller effect size than for radial diffu-
sivity (R2 = 0.15 for axial diffusivity versus 0.48 for radial
diffusivity). Second, we examined the contribution of radial
diffusivity to thickness in the splenium, or posterior fifth, of
the corpus callosum given its potential role in the early devel-
opment of ASD (Elison et al., 2013). A regression model
including splenium radial diffusivity significantly predicted
posterior corpus callosum thickness, F(6,258) = 11.8,
P5 0.001, R = 0.47, R2 = 0.22, suggesting a similar albeit
attenuated relationship between microstructure and thickness
relative to that observed in the anterior corpus callosum. See
Supplementary material for full model results for anterior
axial diffusivity and splenium radial diffusivity.
We next expanded upon the results for radial diffusivity in
relation to anterior thickness by broadening our analysis to
all three time points using repeated measures mixed models.
First, we sought to determine whether radial diffusivity was
associated with corpus callosum thickness across all three
time points by fitting a model with anterior corpus callosum
radial diffusivity, age, sex, site, total brain volume, and
Mullen Early Learning Composite fit as independent vari-
ables and anterior corpus callosum thickness as the depend-
ent variable. There was a significant effect for radial
diffusivity in the anterior portion of the corpus callosum
over 6, 12, and 24 months, F = 101.1, P50.001, indicating
that radial diffusivity is inversely associated with thickness
Table 3 Cross-sectional estimated marginal means by group for midsagittal corpus callosum shape
Corpus callosum feature High-risk
ASD-positive
(A)
High-risk
ASD-negative
(B)
Low-risk
ASD-negative
(C)
Omnibusa Post hocb Cohen’s d
EMM SE EMM SE EMM SE F P (A) vs. (B) (A) vs. (C)
Time 1 (6 months)
Total area 307.44 6.97 299.56 3.28 293.69 4.39 1.4 0.26
Length 139.03 1.85 141.58 0.87 141.95 1.17 0.9 0.41
Thickness 8.92 0.15 8.56 0.07 8.35 0.10 4.7 0.01 a4 b,c 0.42 0.61
Time 2 (12 months)
Total area 346.52 8.00 339.80 3.27 329.04 4.95 2.2 0.12
Length 148.71 1.81 150.58 0.74 149.69 1.12 0.6 0.54
Thickness 9.38 0.17 9.12 0.07 8.86 0.10 3.5 0.03 a4 c,
b4 c
0.28 0.55
Time 3 (24 months)
Total area 402.48 8.41 405.16 4.18 408.50 6.61 0.2 0.85
Length 155.06 1.73 156.68 0.86 158.74 1.36 1.4 0.25
Thickness 10.44 0.18 10.44 0.09 10.35 0.14 0.2 0.87
aMixed effects model. Two-sided significance level of 0.05.bBonferroni corrected.
EMM = estimated marginal mean; SE = standard error.
Table 2 Longitudinal mixed-model results with and
without adjustment for total brain size1
Corpus
callosum
feature
Adjusted for
total brain volume
Unadjusted for
total brain volume
F P F P
Total area
Group 3.4 0.04 3.8 0.02
Age 538.7 50.001 2859.4 50.001
Group � Age 0.2 0.80 0.3 0.75
Length
Group 0.4 0.69 0.3 0.72
Age 8.5 0.004 1214.6 50.001
Group � Age 0.5 0.64 0.5 0.95
Thickness
Group 6.1 0.002 6.0 0.003
Age 514.6 50.001 1660.6 50.001
Group � Age 0.4 0.66 0.4 0.70
1All models adjusted for sex, site, mother’s education, and Mullen Early Learning
Composite.
Early corpus callosum development in ASD BRAIN 2015: Page 7 of 13 | 7
by guest on May 4, 2015
Dow
nloaded from

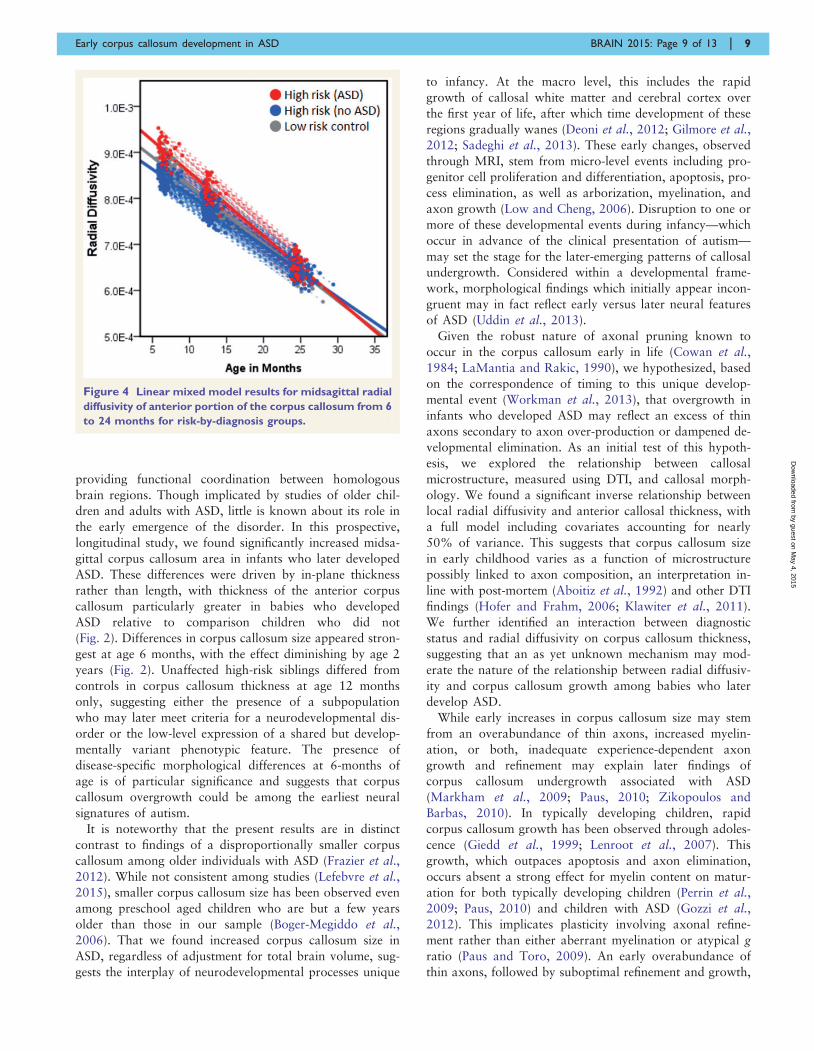
across these ages. Second, we fit a model with radial diffu-
sivity as the dependent variable, and age, sex, site, and
Mullen Early Learning Composite as independent variables.
Total brain volume was omitted from this model as local
diffusion properties should not theoretically vary as a func-
tion of brain size. We identified a significant effect for group
(F = 3.5, P = 0.03) characterized by higher radial diffusivity
among children with ASD, with group � time near the crit-
ical value, F = 2.9, P = 0.059 (Fig. 4). While appearing ini-
tially counter to the inverse relationship between radial
diffusivity and thickness, the pattern seen in Fig. 4 is con-
sistent with Step 3 of our regression model, wherein diag-
nostic group status exerts a significant moderating effect on
the relationship between radial diffusivity and corpus callo-
sum thickness.
Relationship of corpus callosumthickness to behavioural outcomes
Correlations controlling for total brain volume were gener-
ated for primary corpus callosum measures at ages 6 and
12 months, as well as change rate across this interval, with
select clinical outcome measures at age 24 months among
children with ASD. Mullen Early Learning Composite and
ADOS Social Affect domain scores at age 24 months were
not significantly correlated with 6 or 12 month measures of
total corpus callosum area, length, or thickness. Total re-
petitive behaviour endorsed on the RBS-R at age 24
months was significantly correlated with both corpus callo-
sum area (r = 0.52, P = 0.005) and thickness (r = 0.50,
P = 0.007), but not length (r = 0.29, P = 0.14), at the
6-month time point. Repetitive behaviour endorsed was
significantly correlated with thickness (r = 0.44, P = 0.03),
but not area or length, at age 12 months. For children with
data at both 6 and 12 months of age, monthly change rate
was not significantly associated with behavioural measures.
DiscussionThe corpus callosum is a prominent and highly-organized
white matter structure comprised of long-range nerve fibres
Figure 2 Longitudinal effect size. Longitudinal effect size data (Cohen’s d) for pairwise corpus callosum thickness differences among high-
risk infants who developed autism spectrum disorder (ASD), high-risk infants without ASD (HR-Neg), and low-risk controls (LR-Neg).
Figure 3 Unadjusted scatterplot of midsagittal radial
diffusivity values in relation to thickness for the anterior
third of the corpus callosum for total study sample centred
at age 12 months.
8 | BRAIN 2015: Page 8 of 13 J. J. Wolff et al.
by guest on May 4, 2015
Dow
nloaded from
providing functional coordination between homologous
brain regions. Though implicated by studies of older chil-
dren and adults with ASD, little is known about its role in
the early emergence of the disorder. In this prospective,
longitudinal study, we found significantly increased midsa-
gittal corpus callosum area in infants who later developed
ASD. These differences were driven by in-plane thickness
rather than length, with thickness of the anterior corpus
callosum particularly greater in babies who developed
ASD relative to comparison children who did not
(Fig. 2). Differences in corpus callosum size appeared stron-
gest at age 6 months, with the effect diminishing by age 2
years (Fig. 2). Unaffected high-risk siblings differed from
controls in corpus callosum thickness at age 12 months
only, suggesting either the presence of a subpopulation
who may later meet criteria for a neurodevelopmental dis-
order or the low-level expression of a shared but develop-
mentally variant phenotypic feature. The presence of
disease-specific morphological differences at 6-months of
age is of particular significance and suggests that corpus
callosum overgrowth could be among the earliest neural
signatures of autism.
It is noteworthy that the present results are in distinct
contrast to findings of a disproportionally smaller corpus
callosum among older individuals with ASD (Frazier et al.,
2012). While not consistent among studies (Lefebvre et al.,2015), smaller corpus callosum size has been observed even
among preschool aged children who are but a few years
older than those in our sample (Boger-Megiddo et al.,
2006). That we found increased corpus callosum size in
ASD, regardless of adjustment for total brain volume, sug-
gests the interplay of neurodevelopmental processes unique
to infancy. At the macro level, this includes the rapid
growth of callosal white matter and cerebral cortex over
the first year of life, after which time development of these
regions gradually wanes (Deoni et al., 2012; Gilmore et al.,2012; Sadeghi et al., 2013). These early changes, observed
through MRI, stem from micro-level events including pro-
genitor cell proliferation and differentiation, apoptosis, pro-
cess elimination, as well as arborization, myelination, and
axon growth (Low and Cheng, 2006). Disruption to one or
more of these developmental events during infancy—which
occur in advance of the clinical presentation of autism—
may set the stage for the later-emerging patterns of callosal
undergrowth. Considered within a developmental frame-
work, morphological findings which initially appear incon-
gruent may in fact reflect early versus later neural features
of ASD (Uddin et al., 2013).
Given the robust nature of axonal pruning known to
occur in the corpus callosum early in life (Cowan et al.,
1984; LaMantia and Rakic, 1990), we hypothesized, based
on the correspondence of timing to this unique develop-
mental event (Workman et al., 2013), that overgrowth in
infants who developed ASD may reflect an excess of thin
axons secondary to axon over-production or dampened de-
velopmental elimination. As an initial test of this hypoth-
esis, we explored the relationship between callosal
microstructure, measured using DTI, and callosal morph-
ology. We found a significant inverse relationship between
local radial diffusivity and anterior callosal thickness, with
a full model including covariates accounting for nearly
50% of variance. This suggests that corpus callosum size
in early childhood varies as a function of microstructure
possibly linked to axon composition, an interpretation in-
line with post-mortem (Aboitiz et al., 1992) and other DTI
findings (Hofer and Frahm, 2006; Klawiter et al., 2011).
We further identified an interaction between diagnostic
status and radial diffusivity on corpus callosum thickness,
suggesting that an as yet unknown mechanism may mod-
erate the nature of the relationship between radial diffusiv-
ity and corpus callosum growth among babies who later
develop ASD.
While early increases in corpus callosum size may stem
from an overabundance of thin axons, increased myelin-
ation, or both, inadequate experience-dependent axon
growth and refinement may explain later findings of
corpus callosum undergrowth associated with ASD
(Markham et al., 2009; Paus, 2010; Zikopoulos and
Barbas, 2010). In typically developing children, rapid
corpus callosum growth has been observed through adoles-
cence (Giedd et al., 1999; Lenroot et al., 2007). This
growth, which outpaces apoptosis and axon elimination,
occurs absent a strong effect for myelin content on matur-
ation for both typically developing children (Perrin et al.,2009; Paus, 2010) and children with ASD (Gozzi et al.,
2012). This implicates plasticity involving axonal refine-
ment rather than either aberrant myelination or atypical g
ratio (Paus and Toro, 2009). An early overabundance of
thin axons, followed by suboptimal refinement and growth,
Figure 4 Linear mixed model results for midsagittal radial
diffusivity of anterior portion of the corpus callosum from 6
to 24 months for risk-by-diagnosis groups.
Early corpus callosum development in ASD BRAIN 2015: Page 9 of 13 | 9
by guest on May 4, 2015
Dow
nloaded from

could plausibly explain the contrast between the present
findings and those from older children with ASD. While
we did not identify a statistically significant effect for
group � age, group differences in corpus callosum thick-
ness decreased from ages 6 to 24 months (Fig. 2). We an-
ticipate that typically developing children may ‘catch up’
with and surpass children with ASD in terms of corpus
callosum size by school age as increased axon calibre and
myelin content begins to outpace overgrowth initially asso-
ciated with thin axon over-abundance (Boger-Megiddo
et al., 2006). There is some evidence of this possibility in
our data at age 2 years, wherein the posterior corpus cal-
losum appears marginally thinner in children with ASD,
consistent with findings from older children (Vidal et al.,
2006).
With regard to the relationship between the corpus cal-
losum and clinical features among infants who developed
ASD, we found that morphological features at both 6 and
12 months of age positively predicted repetitive behaviours
measured at age 2 years. We did not, however, see a rela-
tionship between corpus callosum morphology and either
IQ or social symptoms despite precedence for this later in
life (Hardan et al., 2009; Keary et al., 2009; Prigge et al.,
2013). The link between corpus callosum morphology and
repetitive behaviour may reflect the scaffolding of neural
architecture and behaviour in support of functional special-
ization involving more complex skills. For example, recent
work from our group has implicated posterior corpus cal-
losum microstructure in basic visual orienting function in
7-month-old infants, an early structure–function relation-
ship likely supporting distal social skill development
(Elison et al., 2013). The relationship between morphology
and repetitive behaviour features of ASD in infants may
similarly reflect a fundamental but age-dependent role for
the corpus callosum in early sensory-motor development.
The robust differences in the anterior corpus callosum
lend credence to this interpretation. These regions, which
are involved in pre-/supplementary motor and orbitofrontal
circuitry, have been implicated in sensory function and be-
havioural inhibition generally and repetitive behaviours
specifically (Giedd et al., 1994; Langen et al., 2011).
Evidence for altered corpus callosum morphology in in-
fants who develop ASD is in keeping with evidence of
increased brain volume (Hazlett et al., 2011; Shen et al.,
2013) as well as prevailing theory concerning the essential
yet indeterminate role of connectivity (Uddin et al., 2013;
Lewis et al., 2014). Recent evidence of cortical surface area
expansion in the first year of life (Hazlett et al., submitted
for publication) and accounts of aberrant neurogenesis and
neuronal migration (Casanova et al., 2006; Courchesne
et al., 2011) implicate events unique to prenatal and early
postnatal development. For infants who develop ASD, these
neurodevelopmental events, including postnatal remodelling
of the corpus callosum, are co-occurring in an altered con-
text. The aberrant corpus callosum growth observed in the
present study, concomitant with brain enlargement, may
induce later conduction delays (Lewis and Elman, 2008)
and decreased network efficiency, particularly among
long-distance connections such as those supported by
corpus callosum fibres (Lewis et al., 2014).
Limitations
Participants in this study were grouped based upon clinical
best-estimate diagnosis made at age 2 years. While similar
work has found strong diagnostic stability from age 2 (e.g.
Shen et al., 2013), it is feasible that some children judged
high-risk ASD-negative or high-risk ASD-positive may
change diagnostic classification by school-age. Following
children past early childhood would offer the opportunity
to account for dynamic changes in diagnostic status and
more accurately establish patterns of brain–behaviour de-
velopment. Further, while our DTI data suggest axonal de-
velopment may explain morphological differences in the
corpus callosum, factors such as pruning, myelination,
and axon calibre change are not mutually exclusive phe-
nomenon, and each of these processes likely contributes
both to morphology and local diffusion values (Mori and
Zhang, 2006). This, along with other potential sources of
error inherent to DTI, limits the extent to which causal
inferences may be made and necessitates corroboration
through complimentary imaging measures and non-human
animal model work.
ConclusionAlthough atypical connectivity associated with autism is
not limited to commissural pathways, numerous studies
have identified corpus callosum differences among individ-
uals with ASD using functional MRI (Just et al., 2007;
Anderson et al., 2011; Schipul et al., 2012), DTI
(Alexander et al., 2007; Kumar et al., 2010; Shukla
et al., 2010; Lewis et al., 2013), magnetization transfer
imaging (Gozzi et al., 2012) and structural MRI (Frazier
and Hardan, 2009). Among toddlers with ASD, there is
evidence from functional MRI during natural sleep of
decreased interhemispheric synchronization associated
with symptom severity and language function (Dinstein
et al., 2011). Findings from multimodal imaging studies
of the corpus callosum have linked structure and function
by demonstrating that size is positively correlated with
functional synchrony in adolescents and adults with ASD
(Just et al., 2007; Schipul et al., 2012) and inversely asso-
ciated with measures of fibre length, suggesting diminished
connectivity (Lewis et al., 2013). On the basis of these
published data, we may conclude that corpus callosum con-
nectivity, broadly defined, is implicated in ASD. However,
given that much of the published literature involves indi-
viduals who already have the disorder, the pathogenic
versus collateral role of corpus callosum development in
ASD cannot be ascertained. The present work adds a
new dimension to existing knowledge by suggesting that
the corpus callosum is indeed temporally implicated in
10 | BRAIN 2015: Page 10 of 13 J. J. Wolff et al.
by guest on May 4, 2015
Dow
nloaded from

the emergence of ASD, but that the nature of this relation-
ship appears to materially differ from what has been re-
ported later in the course of the disorder.
AcknowledgementsThanks to J. Ryan Scotton and Rachel Gimpel Smith for
their assistance with data processing and quality control.
We sincerely thank our IBIS families for participating in
this research.
FundingThis study was supported by grants from the National
Institute of Child Health and Development (R01-055741,
055741-S1, and P30-03110, U54-079124), Autism Speaks,
and the Simons Foundation to J.P.; a grant from the
National Institute of Mental Health (K01-101653) to
J.J.W., a student fellowship award from the American
Academy of Child and Adolescent Psychiatry to T.S., and
the National Alliance for Medical Image Computing,
funded by the NIH Roadmap for Medical Research (U54-
EB005149).
Supplementary materialSupplementary material is available at Brain online.
ReferencesAboitiz F, Scheibel AB, Fisher RS, Zaidel E. Fiber composition of the
human corpus callosum. Brain Res 1992; 598: 143–53.Alexander AL, Lee JE, Lazar M, Boudos R, DuBray MB, Oakes TR,
et al. Diffusion tensor imaging of the corpus callosum in autism.
Neuroimage 2007; 34: 61–73.Anderson JS, Druzgal TJ, Froehlich A, DuBray MB, Lange N,
Alexander AL, et al. Decreased interhemispheric functional connect-
ivity in autism. Cereb Cortex 2011; 21: 1134–46.Bodfish JW, Symons FJ, Parker DE, Lewis MH. Varieties of repetitive
behavior in autism: comparisons to mental retardation. J Autism
Dev Disord 2000; 30: 237–43.Boger-Megiddo I, Shaw DWW, Friedman SD, Sparks BF, Artru AA,
Giedd JN, et al. Corpus callosum morphometrics in young
children with autism spectrum disorder. J Autism Dev Disord
2006; 36: 733–9.
Casanova MF, van Kooten IAJ, Switala AE, van Engeland H, Heinsen
H, Steinbusch HWM, et al. Minicolumnar abnormalities in autism.
Acta Neuropathol 2006; 112: 287–303.
Cascio C, Styner M, Smith RG, Poe MD, Gerig G, Hazlett HC, et al.
Reduced relationship to cortical white matter volume revealed by
tractography-based segmentation of the corpus callosum in young
children with developmental delay. Am J Psychiatry 2006; 163:
2157–63.
Cootes TF, Edwards GJ, Taylor CJ. Active appearance models. IEEE
Trans Pattern Anal Mach Intell 2001; 23: 681–5.
Courchesne E, Mouton PR, Calhoun ME, Semendeferi K, Ahrens-
Barbeau C, Hallet MJ, et al. Neuron number and size in prefrontal
cortex of children with autism. JAMA 2011; 306: 2001–10.
Cowan WM, Fawcett JW, O’Leary DD, Stanfield BB. Regressive
events in neurogenesis. Science 1984; 225: 1258–65.
Deoni SCL, Dean DC, O’Muircheartaigh J, Dirks H, Jerskey BA.
Investigating white matter development in infancy and early child-
hood using myelin water faction and relaxation time mapping.
Neuroimage 2012; 63: 1038–53.
Dinstein I, Pierce K, Eyler L, Solso S, Malach R, Behrmann M, et al.
Disrupted neural synchronization in toddlers with autism. Neuron
2011; 70: 1218–25.
Egaas B, Courchesne E, Saitoh O. Reduced size of corpus callosum in
autism. Arch Neurol 1995; 52: 794–801.
Elison JT, Paterson SJ, Wolff JJ, Reznick JS, Sasson NJ, Gu H, et al.
White matter microstructure and atypical visual orienting
in 7-month-olds at risk for autism. Am J Psychiatry 2013; 170:
899–908.
Frazier TW, Hardan AY. A meta-analysis of the corpus callosum in
autism. Biol Psychiatry 2009; 66: 935–41.Frazier TW, Keshavan MS, Minshew NJ, Hardan AY. A two-year
longitudinal MRI study of the corpus callosum in autism.
J Autism Dev Disord 2012; 42: 2312–22.Freitag CM, Luders E, Hulst HE, Narr KL, Thompson PM, Toga AW,
et al. Total brain volume and corpus callosum size in medication-
naıve adolescents and young adults with autism spectrum disorder.
Biol Psychiatry 2009; 66: 316–19.
Giedd JN, Blumenthal J, Jeffries NO, Rajapakse JC, Vaituzis AC, Liu
H, et al. Development of the human corpus callosum during child-
hood and adolescence: a longitudinal MRI study. Prog
Neuropsychopharmacol Biol Psychiatry 1999; 23: 571–88.
Giedd JN, Castellanos FX, Casey BJ, Kozuch P, King AC, Hamburger
SD, et al. Quantitative morphology of the corpus callosum in
attention deficit hyperactivity disorder. Am J Psychiatry 1994;
151: 665–9.
Gilmore JH, Shi F, Woolson SL, Knickmeyer RC, Short SJ, Lin W,
et al. Longitudinal development of cortical and subcor-
tical gray matter from birth to 2 years. Cereb Cortex 2012; 22:
2478–85.
Goodlett CB, Fletcher PT, Gilmore JH, Gerig G. Group analysis of
DTI fiber tract statistics with application to neurodevelopment.
Neuroimage 2009; 45: S133–42.
Gotham K, Pickles A, Lord C. Standardizing ADOS scores for a meas-
ure of severity in autism spectrum disorders. J Autism Dev Disord
2009; 39: 693–705.
Gottesman II, Gould TD. The endophenotype concept in psychiatry:
etymology and strategic intentions. Am J Psychiatry 2003; 160:
636–45.
Gouttard S, Styner M, Prastawa M, Piven J, Gerig G. Assessment of
reliability of multi-site neuroimaging via traveling phantom study.
Med Image Comput Comput Assist Interv 2008; 11: 263–70.
Gozzi M, Nielson DM, Lenroot RK, Ostuni JL, Luckenbaugh DA,
Thurm AE, et al. A magnetization transfer imaging study of
corpus callosum myelination in young children with autism. Biol
Psychiatry 2012; 72: 215–20.
Hardan AY, Pabalan M, Gupta N, Bansal R, Melhem NM, Fedorov S,
et al. Corpus callosum volume in children with autism. Psychiatry
Res 2009; 174: 57–61.
Hazlett HC, Poe MD, Gerig G, Styner M, Chappell C, Smith RG,
et al. Early brain overgrowth in autism associated with an increase
in cortical surface area before age 2 years. Arch Gen Psychiatry
2011; 68: 467–76.
Hofer S, Frahm J. Topography of the human corpus callosum
revisited–comprehensive fiber tractography using diffusion tensor
magnetic resonance imaging. Neuroimage 2006; 32: 989–94.
Iacono WG, Malone SM. Developmental Endophenotypes: indexing
genetic risk for substance abuse with the P300 brain event-related
potential. Child Dev Perspect 2011; 5: 239–47.
Just MA, Cherkassky VL, Keller TA, Kana RK, Minshew NJ.
Functional and anatomical cortical underconnectivity in autism:
Early corpus callosum development in ASD BRAIN 2015: Page 11 of 13 | 11
by guest on May 4, 2015
Dow
nloaded from

evidence from an FMRI study of an executive function task and
corpus callosum morphometry. Cereb Cortex 2007; 17: 951–61.
Kass M, Witkin A, Terzopoulos D. Snakes: active contour models. Int
J Comp Vision 1988; 1: 321–31.
Keary CJ, Minshew NJ, Bansal R, Goradia D, Fedorov S, Keshavan
MS, et al. Corpus callosum volume and neurocognition in autism.
J Autism Dev Disord 2009; 39: 834–41.
Khan S, Gramfort A, Shetty NR, Kitzbichler MG, Ganesan S, Moran
JM, et al. Local and long-range functional connectivity is reduced in
concert in autism spectrum disorders. Proc Natl Acad Sci USA 2013;
110: 3107–12.Klawiter EC, Schmidt RE, Trinkaus K, Liang H-F, Budde MD,
Naismith RT, et al. Radial diffusivity predicts demyelination in
ex vivo multiple sclerosis spinal cords. Neuroimage 2011; 55:
1454–60.Kumar A, Sundaram SK, Sivaswamy L, Behen ME, Makki MI, Ager J,
et al. Alterations in frontal lobe tracts and corpus callosum in young
children with autism spectrum disorder. Cereb Cortex 2010; 20:
2103–13.LaMantia AS, Rakic P. Axon overproduction and elimination in the
corpus callosum of the developing rhesus monkey. J Neurosci 1990;
10: 2156–75.Langen M, Durston S, Kas MJH, van Engeland H, Staal WG. The
neurobiology of repetitive behavior: . . . and men. Neurosci Biobehav
Rev 2011; 35: 356–65.Lefebvre A, Beggiato A, Bourgeron T, Toro R. Neuroanatomical diver-
sity of corpus callosum and brain volume in autism: meta-analysis,
analysis of the Autism Brain Imaging Data Exchange project, and
simulation. Biol Psychiatry 2015. Advance Access published on
February 17, 2015, doi: 10.1016/j.biopsych.2015.02.010.
Lenroot RK, Gogtay N, Greenstein DK, Wells EM, Wallace GL,
Clasen LS, et al. Sexual dimorphism of brain developmental trajec-
tories during childhood and adolescence. Neuroimage 2007; 36:
1065–73.
Lewis JD, Elman JL. Growth-related neural reorganization and the
autism phenotype: a test of the hypothesis that altered brain
growth leads to altered connectivity. Dev. Sci 2008; 11: 135–55.
Lewis JD, Evans AC, Pruett JR, Botteron K, Zwaigenbaum L, Estes A,
et al. Network inefficiencies in autism spectrum disorder at 24
months. Transl Psychiatry 2014; 4: e388.
Lewis JD, Theilmann RJ, Fonov V, Bellec P, Lincoln A, Evans AC,
et al. Callosal fiber length and interhemispheric connectivity in
adults with autism: brain overgrowth and underconnectivity. Hum
Brain Mapp 2013; 34: 1685–95.
Liu Z, Wang Y, Gerig G, Gouttard S, Tao R, Fletcher T, et al. Quality
control of diffusion weighted images. Proc Soc Photo Opt Instrum
Eng 2010; 7628.
Lord C, Risi S, Lambrecht L, Cook EH, Leventhal BL, DiLavore PC,
et al. The autism diagnostic observation schedule-generic: a
standard measure of social and communication deficits
associated with the spectrum of autism. J Autism Dev Disord
2000; 30: 205–23.
Lord C, Rutter M, Couteur A. Autism Diagnostic Interview-Revised: a
revised version of a diagnostic interview for caregivers of individuals
with possible pervasive developmental disorders. J Autism Dev
Disord 1994; 24: 659–85.
Low LK, Cheng H-J. Axon pruning: an essential step underlying the
developmental plasticity of neuronal connections. Philos Trans R
Soc Lond B Biol Sci 2006; 361: 1531–44.
Manes F, Piven J, Vrancic D, Nanclares V, Plebst C, Starkstein SE. An
MRI study of the corpus callosum and cerebellum in mentally re-
tarded autistic individuals. J Neuropsychiatry Clin Neurosci 1999;
11: 470–4.Markham JA, Herting MM, Luszpak AE, Juraska JM, Greenough
WT. Myelination of the corpus callosum in male and female rats
following complex environment housing during adulthood. Brain
Res 2009; 1288: 9–17.
Mori S, Zhang J. Principles of diffusion tensor imaging and its
applications to basic neuroscience research. Neuron 2006; 51:
527–39.
Mullen EM. Mullen scales of early learning. Circle Pines, MN: AGS
Publishing; 1995.
Nair A, Treiber JM, Shukla DK, Shih P, Muller R-A. Impaired
thalamocortical connectivity in autism spectrum disorder: a
study of functional and anatomical connectivity. Brain 2013; 136:
1942–55.
Oguz I, Farzinfar M, Matsui J, Budin F, Liu Z, Gerig G, et al.
DTIPrep: quality control of diffusion-weighted images. Front
Neuroinform 2014; 8: 4.
Paus T. Growth of white matter in the adolescent brain: myelin or
axon? Brain Cogn 2010; 72: 26–35.
Paus T, Toro R. Could sex differences in white matter be explained by
g ratio? Front Neuroanat 2009; 3: 14.Perrin JS, Leonard G, Perron M, Pike GB, Pitiot A, Richer L, et al. Sex
differences in the growth of white matter during adolescence.
Neuroimage 2009; 45: 1055–66.Piven J, Arndt S, Bailey J, Havercamp S, Andreasen NC, Palmer P. An
MRI study of brain size in autism. Am J Psychiatry 1995; 152:
1145–9.Piven J, Bailey J, Ranson BJ, Arndt S. An MRI study of the corpus
callosum in autism. Am J Psychiatry 1997; 154: 1051–6.
Prigge MBD, Lange N, Bigler ED, Merkley TL, Neeley ES, Abildskov
TJ, et al. Corpus callosum area in children and adults with autism.
Res Autism Spectr Disord 2013; 7: 221–34.
Redcay E, Courchesne E. When is the brain enlarged in autism? A
meta-analysis of all brain size reports. Biol Psychiatry 2005; 58: 1–9.
Rutter M, Bailey A, Lord C, Berument S. Social communication ques-
tionnaire. Los Angeles, CA: Western Psychological Services; 2003.
Sadeghi N, Prastawa M, Fletcher PT, Wolff J, Gilmore JH, Gerig G.
Regional characterization of longitudinal DT-MRI to study white
matter maturation of the early developing brain. Neuroimage
2013; 68: 236–47.
Schipul SE, Williams DL, Keller TA, Minshew NJ, Just MA.
Distinctive neural processes during learning in autism. Cereb
Cortex 2012; 22: 937–50.
Schumann CM, Bloss CS, Barnes CC, Wideman GM, Carper RA,
Akshoomoff N, et al. Longitudinal magnetic resonance imaging
study of cortical development through early childhood in autism.
J Neurosci 2010; 30: 4419–27.
Shen MD, Nordahl CW, Young GS, Wootton-Gorges SL, Lee A,
Liston SE, et al. Early brain enlargement and elevated extra-axial
fluid in infants who develop autism spectrum disorder. Brain 2013;
136: 2825–35.
Shukla DK, Keehn B, Lincoln AJ, Muller R-A. White matter com-
promise of callosal and subcortical fiber tracts in children with
autism spectrum disorder: a diffusion tensor imaging study. J Am
Acad Child Adolesc Psychiatry 2010; 49: 1269–78, 1278.e1–2.Sparks BF, Friedman SD, Shaw DW, Aylward EH, Echelard D, Artru
AA, et al. Brain structural abnormalities in young children with
autism spectrum disorder. Neurology 2002; 59: 184–92.Styner M, Gerig G, Lieberman J, Jones D, Weinberger D. Statistical
shape analysis of neuroanatomical structures based on medial
models. Med Image Anal 2003; 7: 207–20.
Sun H, Yushkevich PA, Zhang H, Cook PA, Duda JT, Simon TJ, et al.
Shape-based normalization of the corpus callosum for
DTI connectivity analysis. IEEE Trans Med Imaging 2007; 26:
1166–78.Szekely G, Kelemen A, Brechbuhler C, Gerig G. Segmentation of 2-D
and 3-D objects from MRI volume data using constrained elastic
deformations of flexible Fourier contour and surface models. Med
Image Anal 1996; 1: 19–34.Uddin LQ, Supekar K, Menon V. Reconceptualizing functional brain
connectivity in autism from a developmental perspective. Front Hum
Neurosci 2013; 7: 458.
12 | BRAIN 2015: Page 12 of 13 J. J. Wolff et al.
by guest on May 4, 2015
Dow
nloaded from

Vachet C, Yvernault B, Bhatt K, Smith RG, Gerig G, Hazlett HC,
Styner M. Automatic corpus callosum segmentation using a deform-
able active Fourier contour model. Proc Soc Photo Opt Instrum Eng
2012; 23: 8317.
Verde AR, Budin F, Berger J-B, Gupta A, Farzinfar M, Kaiser A, et al.
UNC-Utah NA-MIC framework for DTI fiber tract analysis. Front
Neuroinform 2014; 7: 51.
Vidal CN, Nicolson R, DeVito TJ, Hayashi KM, Geaga JA, Drost DJ,
et al. Mapping corpus callosum deficits in autism: an
index of aberrant cortical connectivity. Biol Psychiatry 2006; 60:
218–25.
Waiter GD, Williams JHG, Murray AD, Gilchrist A, Perrett DI,
Whiten A. Structural white matter deficits in high-functioning indi-
viduals with autistic spectrum disorder: a voxel-based investigation.
Neuroimage 2005; 24: 455–61.
Witelson SF. Hand and sex differences in the isthmus and genu of the
human corpus callosum: a postmortem morphological study. Brain
1989; 112: 799–835.
Wolff JJ, Botteron KN, Dager SR, Elison JT, Estes AM, Gu H, et al.
Longitudinal patterns of repetitive behavior in toddlers with autism.
J Child Psychol Psychiatry 2014; 55: 945–53.
Wolff JJ, Gu H, Gerig G, Elison JT, Styner M, Gouttard S, et al.
Differences in white matter fiber tract development present from 6
to 24 months in infants with autism. Am J Psychiatry 2012; 169:
589–600.
Workman AD, Charvet CJ, Clancy B, Darlington RB, Finlay BL.
Modeling transformations of neurodevelopmental sequences across
mammalian species. J Neurosci 2013; 33: 7368–83.
Zielinski BA, Prigge MBD, Nielsen JA, Froehlich AL, Abildskov TJ,Anderson JS, et al. Longitudinal changes in cortical
thickness in autism and typical development. Brain 2014; 137:
1799–812.
Zikopoulos B, Barbas H. Changes in prefrontal axons may disrupt thenetwork in autism. J Neurosci 2010; 30: 14595–609.
Appendix 1The Infant Brain Imaging Study (IBIS) Network is an NIH
funded Autism Centre of Excellence project and consists of
a consortium of eight universities in the U.S. and Canada.
Clinical Sites: University of North Carolina: J. Piven (IBIS
Network PI), H.C. Hazlett, C. Chappell; University of
Washington: S. Dager, A. Estes, D. Shaw; Washington
University: K. Botteron, R. McKinstry, J. Constantino, J.
Pruett; Children’s Hospital of Philadelphia: R. Schultz, S.
Paterson; University of Alberta: L. Zwaigenbaum;
University of Minnesota: J. Elison; Data Coordinating
Centre: Montreal Neurological Institute: A.C. Evans, D.L.
Collins, G.B. Pike, V. Fonov, P. Kostopoulos; S. Das; Image
Processing Core: University of Utah: G. Gerig; University of
North Carolina: M. Styner; Statistical Analysis Core:
University of North Carolina: H. Gu.
Early corpus callosum development in ASD BRAIN 2015: Page 13 of 13 | 13
by guest on May 4, 2015
Dow
nloaded from