Embed Size (px)
Citation preview

ALL THE BESTALL THE BEST 11
Process CostingProcess Costing
This is on the other side of the continuum from This is on the other side of the continuum from Job CostingJob Costing

ALL THE BESTALL THE BEST 22
Process CostingProcess Costing
Typical features of process costing are.Typical features of process costing are. The output is homogeneous.The output is homogeneous. Production is continuous.Production is continuous. The production precedes sales.The production precedes sales. It is feasible to segment the manufacturing It is feasible to segment the manufacturing
operations into clearly identifiable processes.operations into clearly identifiable processes. It assumes sequential flow of costs from one It assumes sequential flow of costs from one
process to another.process to another.
ALL THE BESTALL THE BEST 33
Process Costing v/sProcess Costing v/s Job Costing Job Costing
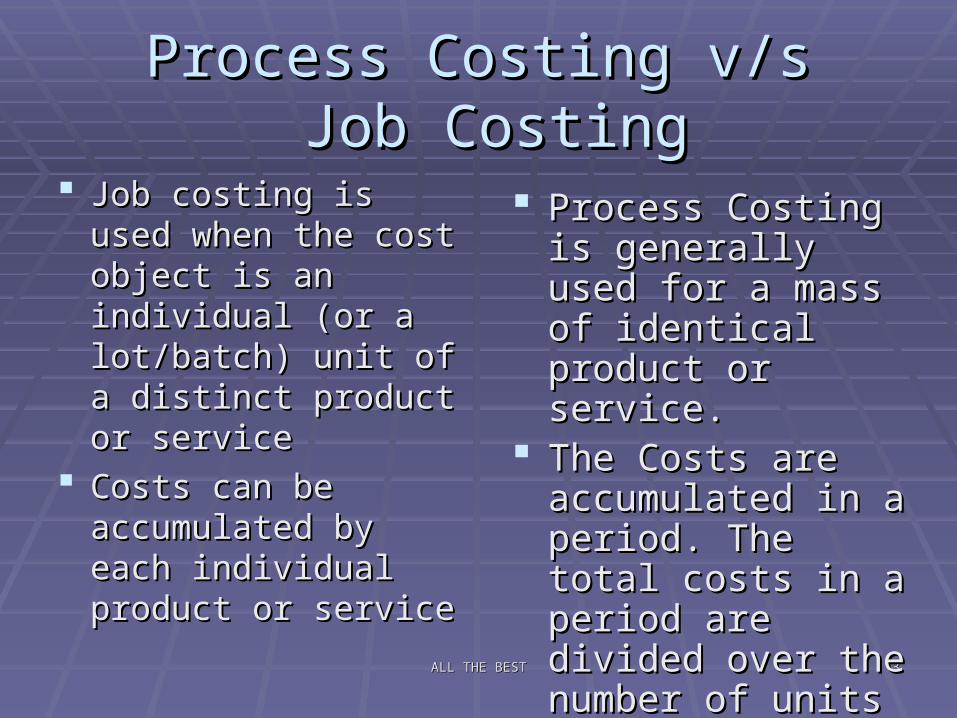
Process Costing is Process Costing is generally used for a generally used for a mass of identical mass of identical product or service.product or service.
The Costs are The Costs are accumulated in a accumulated in a period. The total costs period. The total costs in a period are divided in a period are divided over the number of over the number of units to get an units to get an average unit cost.average unit cost.
Job costing is used Job costing is used when the cost object when the cost object is an individual (or a is an individual (or a lot/batch) unit of a lot/batch) unit of a distinct product or distinct product or serviceservice
Costs can be Costs can be accumulated by each accumulated by each individual product or individual product or serviceservice

ALL THE BESTALL THE BEST 44
Process Costing v/s Process Costing v/s Job CostingJob Costing
Job costing is done Job costing is done against a specific against a specific order being produced.order being produced.
Costs are calculated Costs are calculated when a job is over.when a job is over.
There are usually no There are usually no transfers of costs transfers of costs from one job to from one job to another.another.
Costs are compiled for Costs are compiled for each process over time.each process over time.
Costs are calculated at Costs are calculated at the end of a cost period the end of a cost period like an accounting year.like an accounting year.
Transfer of costs from Transfer of costs from one process to another is one process to another is made as the product made as the product moves from one process moves from one process to the other.to the other.

ALL THE BESTALL THE BEST 55
Process Costing v/s Process Costing v/s Job CostingJob Costing
There is more paper There is more paper work.work.
There is little or no There is little or no inventory.inventory.
It is less amenable to It is less amenable to mechanization & mechanization & automation.automation.
It has lesser paper It has lesser paper work.work.
There is regular and There is regular and significant inventory.significant inventory.
It is more amenable It is more amenable to mechanization & to mechanization & automation.automation.

ALL THE BESTALL THE BEST 66
Process CostingProcess CostingIndustryIndustry Process Process JobJob
FoodFood 96%96% 4%4%
TextilesTextiles 91%91% 8%8%
Primary MetalsPrimary Metals 92%92% 25%25%
ChemicalsChemicals 75%75% 25%25%
Oil refiningOil refining 100%100% 25%25%
FurnitureFurniture 38%38% 63%63%
MachineryMachinery 43%43% 65%65%
ElectronicsElectronics 55%55% 58%58%

ALL THE BESTALL THE BEST 77
Process CostingProcess Costing
Service Sector eg.Service Sector eg. Compute the costs to process 100000 Fixed Compute the costs to process 100000 Fixed
Deposit Receipt Applications in a Bank.Deposit Receipt Applications in a Bank. Compute the costs to serve Customers in a Compute the costs to serve Customers in a
Call Centre.Call Centre.
Merchandizing Sector eg.Merchandizing Sector eg. Compute the costs to serve Coke in Compute the costs to serve Coke in
McDonalds.McDonalds.

ALL THE BESTALL THE BEST 88
Process CostingProcess Costing
Raw material Raw material Process 1Process 1
Process 1Process 1 Process 2Process 2
Process 2Process 2 Process 3Process 3
Process 3Process 3 Finished GoodsFinished Goods

ALL THE BESTALL THE BEST 99
Process CostingProcess Costing
Raw Material (Inputs)Raw Material (Inputs) Add Add Conversion Conversion CostsCosts
Finished Finished Goods of Goods of Process 1Process 1
Finished Goods of Finished Goods of Process 1= Raw Process 1= Raw Material of Process 2Material of Process 2
Add Add Conversion Conversion CostsCosts
Finished Finished Goods of Goods of Process 2Process 2
Finished Goods of Finished Goods of Process 2= Raw Process 2= Raw Material of Process 3Material of Process 3
Add Add Conversion Conversion CostsCosts
Finished Finished Goods Goods (Output)(Output)

ALL THE BESTALL THE BEST 1010
Process CostingProcess Costing
Materials: The raw material is taken at the cost Materials: The raw material is taken at the cost value for each process.value for each process.
Wages: The wages on each process are traced Wages: The wages on each process are traced clearly and allocated to that process.clearly and allocated to that process.
Direct expenses: The direct expenses of each Direct expenses: The direct expenses of each process are traced clearly and allocated to that process are traced clearly and allocated to that process.process.
Indirect expenses: They are allocated to each Indirect expenses: They are allocated to each process at predetermined rates.process at predetermined rates.

ALL THE BESTALL THE BEST 1111
Process CostingProcess Costing
A product passes through process A & process A product passes through process A & process B. In June 1500 units are made. There was no B. In June 1500 units are made. There was no WIP neither at the beginning nor at the end of WIP neither at the beginning nor at the end of the month. The cost structure is as below:the month. The cost structure is as below:Direct CostsDirect Costs Process A Process BProcess A Process BMaterialMaterial 9000090000 7500075000
LaborLabor 7500075000 150000 150000ExpensesExpenses 1500015000 1800018000
The Indirect Expenses worth 60000 are The Indirect Expenses worth 60000 are apportioned on the basis of Direct Labor Costs.apportioned on the basis of Direct Labor Costs.

ALL THE BESTALL THE BEST 1212
Process CostingProcess CostingProcess A Process A
Direct MaterialDirect Material 9000090000 Transfer to Transfer to Process BProcess B
200000200000
Direct LaborDirect Labor 7500075000
Direct ExpensesDirect Expenses 1500015000
Indirect Expenses Indirect Expenses 2000020000
Process BProcess B
Transfer from Process ATransfer from Process A 200000200000 Transfer to Transfer to Finished Finished GoodsGoods
483000483000
Direct MaterialDirect Material 7500075000
Direct LaborDirect Labor 150000150000
Direct ExpensesDirect Expenses 1800018000
Indirect ExpensesIndirect Expenses 4000040000

ALL THE BESTALL THE BEST 1313
Process CostingProcess Costing Cost per Unit of Process A = 200000/1500Cost per Unit of Process A = 200000/1500
= = 133.33133.33
Cost per Unit of Process B = 483000/1500Cost per Unit of Process B = 483000/1500 = =
322.00322.00
Direct Material Cost per Unit = Direct Material Cost per Unit = (90000+75000) / 1500 = 110(90000+75000) / 1500 = 110 Direct Labor Cost per Unit = Direct Labor Cost per Unit = (75000+150000) / 1500=150(75000+150000) / 1500=150 Direct Expenses Cost per Unit = Direct Expenses Cost per Unit = (15000+18000) / 1500 =(15000+18000) / 1500 = 22 22 Indirect Expense Cost per Unit = Indirect Expense Cost per Unit = (60000) / 1500 = (60000) / 1500 = 40 40 Total Costs Total Costs = = 322 322

ALL THE BESTALL THE BEST 1414
Process CostingProcess Costing
When there is Work In Progress Inventory at the end of the When there is Work In Progress Inventory at the end of the period, they are converted into period, they are converted into equivalent completed equivalent completed units.units.
E.g. 100 units of WiP which is 40% complete is considered E.g. 100 units of WiP which is 40% complete is considered as equivalent to 40 completed units.as equivalent to 40 completed units.
Procedure: Procedure: 1. Summarize the flow of units of output.1. Summarize the flow of units of output.2. Compute Output in terms o9f equivalent units.2. Compute Output in terms o9f equivalent units.3. Compute equivalent unit costs.3. Compute equivalent unit costs.4.Summarize total costs to account for.4.Summarize total costs to account for.5. Assign total costs to completed units and to units 5. Assign total costs to completed units and to units ending in WiP.ending in WiP.

ALL THE BESTALL THE BEST 1515
Process CostingProcess CostingIn Feb.’01 , the Assembly had the following data.In Feb.’01 , the Assembly had the following data.
Beginning WiP (Feb 1,’01) Beginning WiP (Feb 1,’01) = 0 units= 0 unitsStarted in Feb.’01Started in Feb.’01 = 400 units= 400 unitsCompleted & TransferredCompleted & Transferred = 175 units= 175 unitsClosing WiP InventoryClosing WiP Inventory = 225 units.= 225 units.
Total Costs incurred for Feb.’01Total Costs incurred for Feb.’01Direct MaterialDirect Material = 32000= 32000Conversion CostsConversion Costs = = 1860018600Total Assembly CostsTotal Assembly Costs = = 5060050600
The Supervisor estimates that the WiP is about 60% The Supervisor estimates that the WiP is about 60% complete.complete.

ALL THE BESTALL THE BEST 1616
Process CostingProcess Costing
Flow of ProductionFlow of Production Step 1Step 1 Step 2Step 2
Physical Physical UnitsUnits
Direct Direct MaterialMaterial
Conversion Conversion CostsCosts
Beginning WiPBeginning WiP 00
Started in Feb.’01 to Started in Feb.’01 to accountaccount
400400
Completed & TransferredCompleted & Transferred 175175 175175 175175
Ending WiPEnding WiP 225225
Material 100% of 225 Material 100% of 225 225225
Conversion 60% of 225Conversion 60% of 225 135135
Work Done in Feb.’01Work Done in Feb.’01 400400 310310
ALL THE BESTALL THE BEST 1717
Process CostingProcess Costing
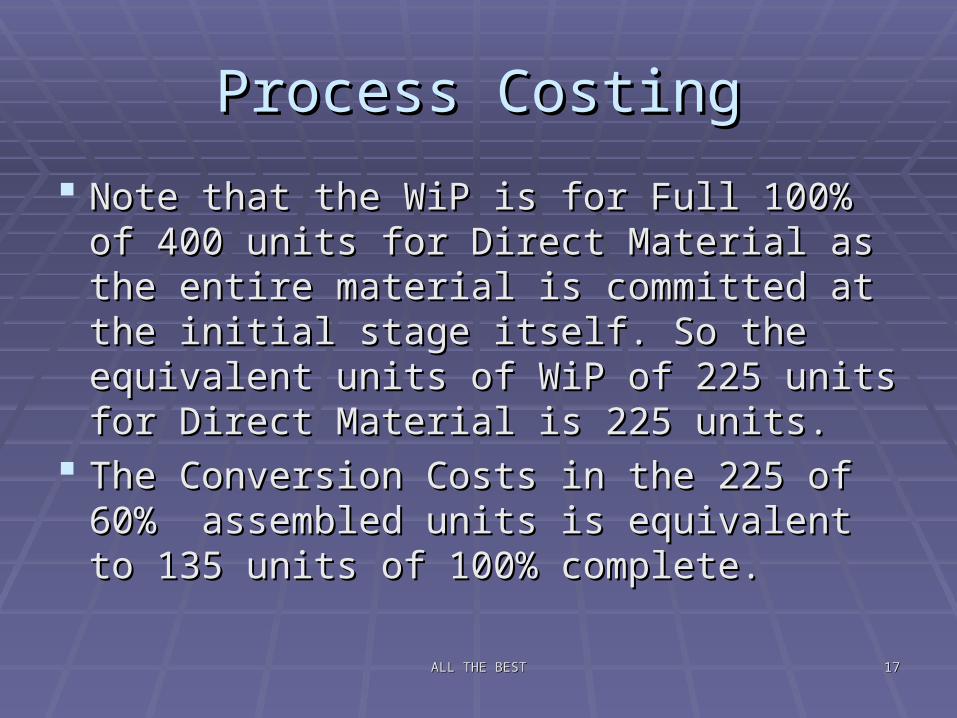
Note that the WiP is for Full 100% of 400 Note that the WiP is for Full 100% of 400 units for Direct Material as the entire units for Direct Material as the entire material is committed at the initial stage material is committed at the initial stage itself. So the equivalent units of WiP of itself. So the equivalent units of WiP of 225 units for Direct Material is 225 units.225 units for Direct Material is 225 units.
The Conversion Costs in the 225 of 60% The Conversion Costs in the 225 of 60% assembled units is equivalent to 135 units assembled units is equivalent to 135 units of 100% complete.of 100% complete.

ALL THE BESTALL THE BEST 1818
Total Total Production Production CostsCosts
Direct Direct MaterialMaterial
Conversion Conversion CostsCosts
Step 3Step 3 Costs incurred in Costs incurred in Feb.’01Feb.’01
5060050600 3200032000 1860018600
Equivalent Units of Equivalent Units of Work DoneWork Done
400400 310310
Step 4Step 4 Costs per equivalent UnitCosts per equivalent Unit 8080 6060
Step 5Step 5 Assignment of CostsAssignment of Costs
Complete 175 unitsComplete 175 units 2450024500 175 x 80175 x 80 175 x 60175 x 60
WiP (225 Units)WiP (225 Units)
Direct MaterialDirect Material 1800018000 225 x 80225 x 80
Conversion CostsConversion Costs 81008100 135 x 60135 x 60
Total CostsTotal Costs 5060050600
ALL THE BESTALL THE BEST 1919
Process CostingProcess Costing
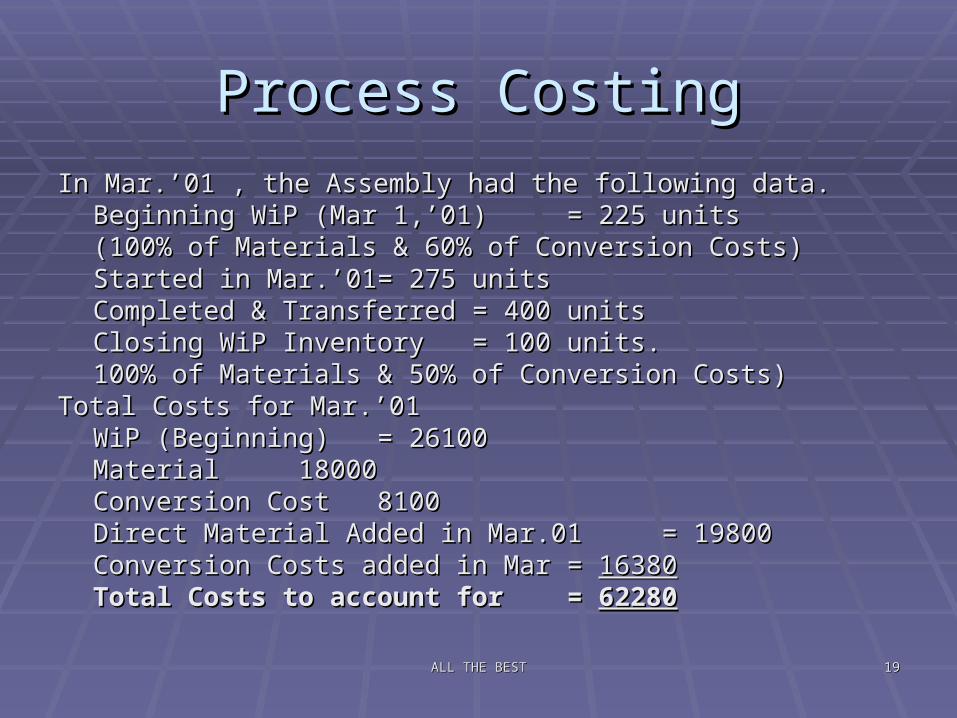
In Mar.’01 , the Assembly had the following data.In Mar.’01 , the Assembly had the following data.Beginning WiP (Mar 1,’01) Beginning WiP (Mar 1,’01) = 225 units= 225 units
(100% of Materials & 60% of Conversion Costs)(100% of Materials & 60% of Conversion Costs)Started in Mar.’01Started in Mar.’01 = 275 units= 275 unitsCompleted & TransferredCompleted & Transferred = 400 units= 400 unitsClosing WiP InventoryClosing WiP Inventory = 100 units.= 100 units.
100% of Materials & 50% of Conversion Costs)100% of Materials & 50% of Conversion Costs)Total Costs for Mar.’01Total Costs for Mar.’01
WiP (Beginning) WiP (Beginning) = 26100= 26100MaterialMaterial 18000 18000Conversion Cost 8100Conversion Cost 8100
Direct Material Added in Mar.01Direct Material Added in Mar.01 = 19800= 19800Conversion Costs added in MarConversion Costs added in Mar = = 1638016380Total Costs to account forTotal Costs to account for = = 6228062280

ALL THE BESTALL THE BEST 2020
Flow of ProductionFlow of Production Step 1Step 1
(Physical (Physical Units)Units)
Step 2 (Equivalent Units)Step 2 (Equivalent Units)
Direct Direct MaterialMaterial
Conversion Conversion CostsCosts
Beginning WiPBeginning WiP 225225
Started in Current PeriodStarted in Current Period 275275
To Account ForTo Account For 500500
Completed & TransferredCompleted & Transferred 400400 400400 400400
WiP EndingWiP Ending 100100
(100% x 100) & (50% x 100)(100% x 100) & (50% x 100) 100100 5050
Accounted ForAccounted For 500500
Work done till dateWork done till date 500500 450450
Weighted Average Cost Method

ALL THE BESTALL THE BEST 2121
Total Total Production Production CostsCosts
Direct Direct MaterialsMaterials
ConversiConversion Costson Costs
Step 3Step 3 WiP BeginningWiP Beginning 2610026100 1800018000 81008100
Costs Added in MarCosts Added in Mar 3618036180 1980019800 1638016380
Costs incurred till dateCosts incurred till date 3780037800 2448024480
Equivalent Units of Work DoneEquivalent Units of Work Done 500500 450450
Costs per equivalent unitCosts per equivalent unit 75.6075.60 54.4054.40
Step 4Step 4 Total Cost to Total Cost to Account ForAccount For
6228062280
Weighted Average Cost Method

ALL THE BESTALL THE BEST 2222
Step 5Step 5 Assignment of CostsAssignment of Costs
Completed & transferred out 400 UnitsCompleted & transferred out 400 Units 5200052000 400 x 75.60400 x 75.60 400 x 400 x 54.4054.40
WiP Ending (100 Units)WiP Ending (100 Units)
Direct MaterialDirect Material 75607560 100 x 75.60100 x 75.60
Conversion CostsConversion Costs 27202720 50 x 50 x 54.4054.40
Total WiP CostsTotal WiP Costs 1028010280
Total Costs Accounted ForTotal Costs Accounted For 6228062280
Weighted Average Cost Method

ALL THE BESTALL THE BEST 2323
First in First Out Method
Flow of ProductionFlow of Production Step 1Step 1
(Physical Units)(Physical Units)
Step 2 (Equivalent Units)Step 2 (Equivalent Units)
Direct Direct MaterialMaterial
Conversion Conversion CostsCosts
Beginning WiPBeginning WiP 225225
Started in Current PeriodStarted in Current Period 275275
To Account ForTo Account For 500500
Completed & TransferredCompleted & Transferred
From Beginning WiPFrom Beginning WiP 225225
225x(100%-100%) & 225x(100%-60%)225x(100%-100%) & 225x(100%-60%) 00 9090
Started & CompletedStarted & Completed 175175 175175 175175
WiP EndingWiP Ending 100100
100 x 100% & 100 x 50%100 x 100% & 100 x 50% 100100 5050
Accounted for work done Accounted for work done in current periodin current period
500500 275275 315315

ALL THE BESTALL THE BEST 2424
Total Total Production Production CostsCosts
Direct Direct MaterialsMaterials
ConversiConversion Costson Costs
Step 3Step 3 WiP BeginningWiP Beginning 2610026100
Costs Added in MarCosts Added in Mar 3618036180 1980019800 1638016380
Equivalent Units of Work Done in Current Equivalent Units of Work Done in Current PeriodPeriod
275275 315315
Cost per equivalent unit of work doneCost per equivalent unit of work done 7272 5252
Step 4Step 4 Total Cost to Total Cost to Account ForAccount For
6228062280
First in First Out Method
ALL THE BESTALL THE BEST 2525
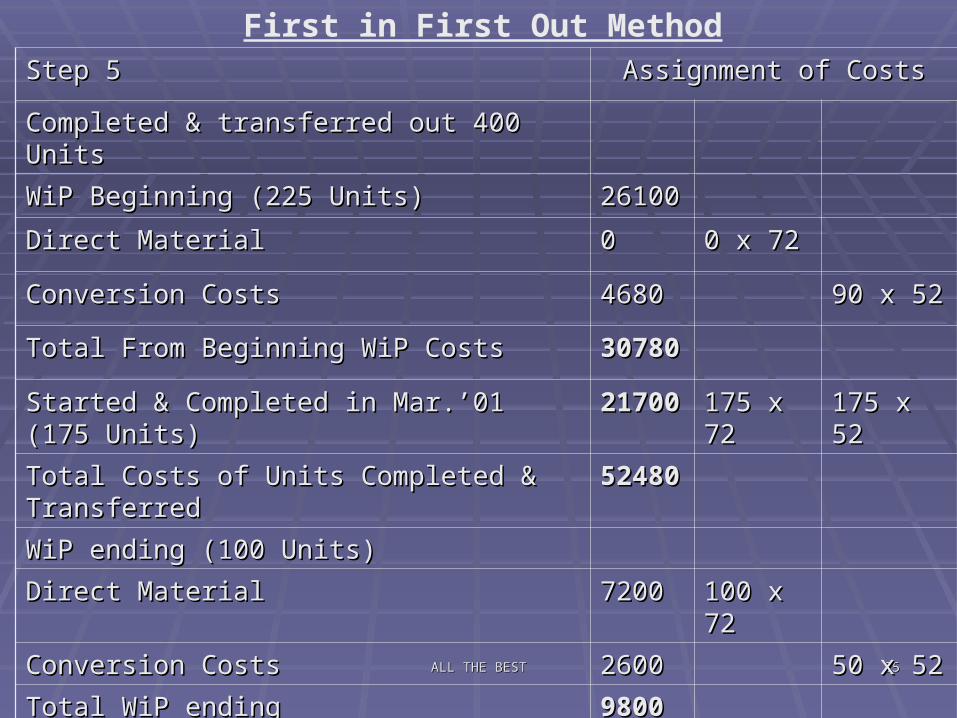
Step 5Step 5 Assignment of CostsAssignment of Costs
Completed & transferred out 400 UnitsCompleted & transferred out 400 Units
WiP Beginning (225 Units)WiP Beginning (225 Units) 2610026100
Direct MaterialDirect Material 00 0 x 720 x 72
Conversion CostsConversion Costs 46804680 90 x 5290 x 52
Total From Beginning WiP CostsTotal From Beginning WiP Costs 3078030780
Started & Completed in Mar.’01 (175 Units)Started & Completed in Mar.’01 (175 Units) 2170021700 175 x 72175 x 72 175 x 52175 x 52
Total Costs of Units Completed & TransferredTotal Costs of Units Completed & Transferred 5248052480
WiP ending (100 Units)WiP ending (100 Units)
Direct MaterialDirect Material 72007200 100 x 72100 x 72
Conversion CostsConversion Costs 26002600 50 x 5250 x 52
Total WiP endingTotal WiP ending 98009800
Total Costs Accounted ForTotal Costs Accounted For 6228062280
First in First Out Method

ALL THE BESTALL THE BEST 2626
Comparison of WAC v/s FIFO MethodsComparison of WAC v/s FIFO Methods
WACWAC FIFOFIFO DifferenceDifference
Cost of Units Cost of Units completed & completed & transferred outtransferred out
5200052000 5248052480 + 480+ 480
Work in Work in process,endingprocess,ending
1028010280 98009800 - 480- 480
Total costs Total costs accounted foraccounted for
6228062280 6228062280

ALL THE BESTALL THE BEST 2727
Comparison of WAC v/s FIFO MethodsComparison of WAC v/s FIFO Methods
The WAC method shows lower cost of goods sold which implies The WAC method shows lower cost of goods sold which implies higher profits in a declining cost scenario & vice versa in an higher profits in a declining cost scenario & vice versa in an increasing cost scenario. The direct material cost in the beginning increasing cost scenario. The direct material cost in the beginning WIP was 80 & conversion cost was 60 as compared to 72 & 52 WIP was 80 & conversion cost was 60 as compared to 72 & 52 respectively in the current period. Thus, WAC method smoothes out respectively in the current period. Thus, WAC method smoothes out the cost per equivalent unit by assuming that more of the lower cost the cost per equivalent unit by assuming that more of the lower cost units are completed & transferred out & some higher cost units are units are completed & transferred out & some higher cost units are placed in ending WiP.placed in ending WiP.
This can be material whenThis can be material when the direct material costs & conversion costs vary significantly between the direct material costs & conversion costs vary significantly between
periods periods The physical inventory level of WiP is large vis-a-vis the total no. of units The physical inventory level of WiP is large vis-a-vis the total no. of units
transferred out transferred out

ALL THE BESTALL THE BEST 2828
FIFO method does not merge the costs between the periods & so FIFO method does not merge the costs between the periods & so helps period to period comparison of costs.helps period to period comparison of costs.
WAC method is simpler in computation & is more representative of WAC method is simpler in computation & is more representative of the avg. unit cost as compared to FIFO.the avg. unit cost as compared to FIFO.
Comparison of WAC v/s FIFO MethodsComparison of WAC v/s FIFO Methods