Embed Size (px)
Citation preview

Alison King Principal Audiologist, Paediatric Services
A profile of hearing impaired children in Australia
Overview – 31 December 2009
15,515 Australian children who are fitted amplification for a permanent or long term hearing loss.
45.9% Female; 52.8% Male – 1.3% info unavailable
1,544 (10%) of aided children identify as Indigenous.
– 68% of these children seen on outreach visits
2035 children first fitted in 2009.– 310 Indigenous children first fitted in
2009 Highest so far
Highest so far
Highest so far

Where do our aided children live?

What sort of hearing loss do they have?
0%
5%
10%
15%
20%
25%
30%
35%
40%
45%
0-30 31-60 61-90 90+
3 FAHL in the better ear

Hearing loss distribution for aided children – Dec 2006 vs. Dec 2009
0%
5%
10%
15%
20%
25%
30%
35%
40%
45%
0-30 31-60 61-90 90+
3FAHL in the better ear
2006
2009

When did they get their first hearing aids?Children first fitted in 2009.
0
50
100
150
200
250
<1 1 2 3 4 5 6 7 8 9 10 11 12 13 14 15 16 17 18 19 20
Age in years
No
. Ch
ildre
n

Have fitting patterns changed over time?
0%
1%
2%
3%
4%
5%
6%
<1 1 2 3 4 5 6 7 8 9 10 11 12 13 14 15 16 17 18 19 20
Age group
Prop
ortio
n of
new
fitti
ngs
2006
2007
2008
2009

What is the hearing loss profile for each age group? Children first fitted in 2009.
Distribution of HL according to age at first fitting
0%
10%
20%
30%
40%
50%
60%
70%
80%
<1 1 2 3 4 5 6 7
Age (yrs)
Pro
po
rtio
n o
f ch
ildre
n in
ag
e g
rou
p
0-30
31-60
61-90
90+
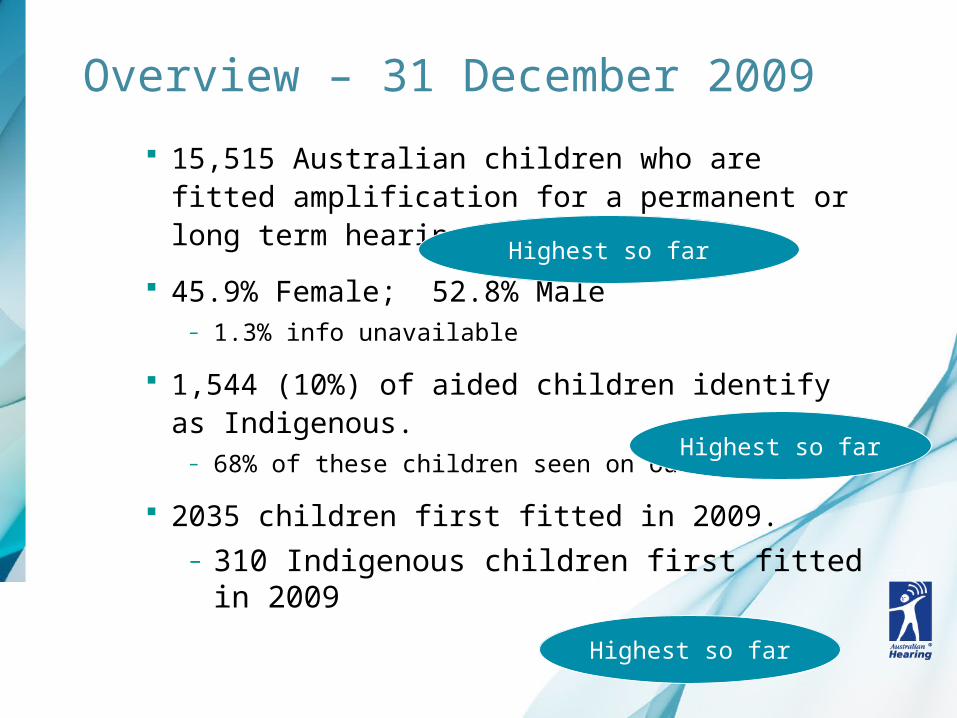
Newborn Hearing Screening has increased early fitting rates
0
50
100
150
200
250
2000 2001 2002 2003 2004 2005 2006 2007 2008 2009
Birth Year
No
. fit
ted
< 6
mo
nth
s
Not all HI babies born in 2009 will have been ascertained by 31/12/09

Summary Over ¾ of aided children have a mild or moderate
degree of hearing loss in their better ear.
The proportion of aided children who have a mild hearing loss has increased over the past 3 years.
Rollout of NHS continues to increase the proportion of children who receive their first hearing aids before 6 months of age
– However the numbers fitted are still less than predicted from an incidence of 1.2 per thousand births
Another large group of children are first fitted with hearing aids around school-entry age
– And these tend to be children with average hearing levels < 30dBHL in the better ear.
Aided Indigenous Children

Where do aided Indigenous children live?Distribution by state/territory
0%
5%
10%
15%
20%
25%
30%
35%
40%
NSW VIC QLD WA SA TAS ACT NT
% Total Aided Children
% Total Aided IndigenousChildren

The number of aided Indigenous children has increased by 67.5% over the past 3 years
0
200
400
600
800
1000
1200
1400
1600
1800
Mar-07
Jun-07
Sep-07
Dec-07
Mar-08
Jun-08
Sep-08
Dec-08
Mar-09
Jun-09
Sep-09
Dec-09
Mar-10

Fitting patterns differ for Indigenous children
0.0%
2.0%
4.0%
6.0%
8.0%
10.0%
12.0%
14.0%
16.0%
<1 1 2 3 4 5 6 7 8 9 10 11 12 13 14 15 16 17 18 19 20
Age at first fitting
Pro
po
rtio
n o
f n
ew
ly f
itte
d
Entire Client Base
Indigenous clients

Hearing Loss Distribution – Indigenous children compared with total aided children
0.0%
10.0%
20.0%
30.0%
40.0%
50.0%
60.0%
0-30 31-60 61-90 90+
Better Ear 3FAHL
Pro
po
rtio
n o
f c
hild
ren
Indigneous children
All aided children

Summary
Indigenous children form a higher proportion of the aided child client base than predicted from population data
– Reflects the higher rates of chronic OM
Increase in fittings over the past 3 years
Most fittings occur in early primary school– Reflects predominance of school-based service
delivery models of detection & intervention
Fitting rates for children < 3 years are low.– Exploring alternative service delivery models,
portable infant test equipment, educational strategies

Hearing Aid Usage – Children aged less than 13 years.
2705 respondents (40.7%)

Hours usage by age group – children <13yPaediatric Hearing Aid Use & Satisfaction Survey, 2008
“5” = 8 h/day
“3” = 4- 8 h/day

Hours usage by hearing loss – children <13yPaediatric Hearing Aid Use & Satisfaction Survey, 2008
“5” = 8+ hrs/day
“3” = 4-8 hrs/day

Fitting configuration – severe hearing loss
Never One AidTwo Aids
One Aid + CI
CI Only Two CI
0% 7% 71% 17% 2.1% 1.7%

Fitting configuration – children with profound Hearing Loss
0%
5%
10%
15%
20%
25%
30%
35%
40%
45%
Never One Aid TwoAids
One Aid+ CI
One CIonly
Two CI
% R
espo
nden
ts
< 3years
3-12 years

Summary
Older children use their hearing aids more often than younger children
– Greatest variability in usage amongst infants
HA usage increases with degree of hearing loss– Except for profound losses, probably due to
children using cochlear implants
The majority of children who have a profound loss have at least one cochlear implant and approximately one in five children with a severe loss in their better ear have a cochlear implant

Thanks to
– Ron Oong, Business Analyst, Australian Hearing
– Prof. Harvey Dillon, National Acoustic Laboratories.
Further demographic information can be found at
www.hearing.com.au