Embed Size (px)
DESCRIPTION
Alignment studies are made for tungsten near L3 sub-shell threshold using theoretical, experimental and empirical approaches. Experimentally to measure alignment parameter, the angular distribution of L x-rays of tungsten (W-74) is measured in the angular range 0° to 120°, where maximum anisotropy is expected. The experimental measurements are performed in XRF laboratories of Raja Ramanna Center for Advanced Technology (RRCAT), Indore, India using a three-dimensional double reflection set-up. The weighted average of alignment values with 10% error comes 0.155 ± 0.009. Theoretically, the value of alignment parameter A20 is calculated using non-relativistic dipole approximation in a point Coulomb potential and is found 0.151 at L3 threshold energy (10.676 keV). For empirical A20 evaluations, IGELCS interpolated experimental LXRF cross-section σ*Lg (g = α, ) values of Mann et al with 8% reported errors are used along with the radiative decay rates.
Citation preview

Journal of Nuclear Physics, Material
Sciences, Radiation and Applications
Vol. 1, No. 1 August 2013
pp. 79–96
©2013 by Chitkara University. All Rights
Reserved.
DOI: 10.15415/jnp.2013.11008
Alignment Studies for Tungsten Near L3 Sub-Shell Threshold Via Theoretical, Experimental and Empirical Methods
Ajay Sharma1* and Raj Mittal2
1Physics Department, Chitkara University, Himachal Pradesh-174103-INDIA2Nuclear science Laboratories, Physics department, Punjabi University Patiala-147002-INDIA
Email: [email protected]
Abstract Alignment studies are made for tungsten near L3 sub-shell threshold using theoretical, experimental and empirical approaches. Experimentally to measure alignment parameter, the angular distribution of L x-rays of tungsten (W-74) is measured in the angular range 0° to 120°, where maximum anisotropy is expected. The experimental measurements are performed in XRF laboratories of Raja Ramanna Center for Advanced Technology (RRCAT), Indore, India using a three-dimensional double reflection set-up. The weighted average of alignment values with 10% error comes 0.155 ± 0.009. Theoretically, the value of alignment parameter A
20 is calculated using non-relativistic dipole approximation in a point
Coulomb potential and is found 0.151 at L3 threshold energy (10.676 keV). For empirical A
20 evaluations, IGELCS interpolated experimental LXRF cross-section σ*Lg (g = α, )
values of Mann et al with 8% reported errors are used along with the radiative decay rates. The comparison among theoretical, experimental and empirical values are similar and values being >0.1 at L3 threshold energy are certainly higher than the 5 to 8 percent uncertainties quoted in earlier experimental results.
Keywords: Alignment, cross-section, anisotropy, angular distribution and x-ray fluorescence
1. INTRODUCTION
In an atom, vacancy alignment results from the fact that the ionization cross-sections have different values for different projections of total angular momentum j >1/2 on incident photons direction. Flugge et al. [1] were the first to study the alignment of atomic inner shell vacancies and exhibited significant anisotropy in explicit calculations and ended that the magnetic sub-state dependence of total photoelectric cross-sections can also be determined experimentally. Oh and Pratt [2] studied alignment and fractional photo-ionization cross-sections corresponding to the ejection from L3
and M3 sub-shells for Ca and Mg and predicted their
results below 20 keV using non-relativistic dipole approximation and above 20 keV using relativistic Born-approximation in screened potential. Ratios of the cross-sections were found to have an energy dependence ranging from 7 at high energies to 9/11 in low energy domain and dropping to 1/3 near threshold. On the other hand, Berezhko et al. [3] calculated the angular distribution of dipole radiation following the photo-ionization by unpolarized photon beam and predicted the maximum and minimum limits of alignment parameter as 0.5 and 0.05 for

Sharma, A.Mittal, R.
80
Journal of Nuclear Physics, Material Sciences, Radiation and Applications, Vol. 1, No. 1, August 2013
2p3/2
sub-state. Berezhko and Kabachnik [4] summarized that degree of alignment depends on the energy of incident photon, atomic number of the atom, the vacancy state of the atom and is also sensitive to the wave function, approximation used. Recently, Kleiman and Lohmann [5] have studied the orientation and alignment parameter for a several atoms undergoing photo-ionization in inner shells near ionization thresholds using Herman-Skillman wave functions. Kinetic energies of the emitted photoelectron up to at least 20 Rydbergs (~272 eV) have been considered. Experimentally alignment measurements are available from the work of eight different groups and predicted contradictory results [6-25]. Most of the measurements are for L sub-shell x-rays induced by ~ 60 and ~26 keV or threshold photons and M shell x-rays induced by 5.9 keV photons. First three groups [6-10; 11; 12-16] established the anisotropic distribution of L x-rays. The measured values of Group II [11] are slight and those of groups I [6-10] and III [12-16] are much higher than the theoretical predictions of Berezhko et al. [3], moreover, the L x-ray distribution patterns reported by groups I and III deviated from those for dipole character of x-rays. Whereas, the three other groups IV [17-19], V [20-22] and VI [23] predicted the isotropic distribution within the experimental uncertainties. Later on, Group V [21] reported anisotropy for Au L
and Lα emissions at 13 keV that culminated in an alignment value ~50% higher than the theoretical predictions. Group V [22] also studied the effect of Coster–Kronig transitions on the anisotropy of L x-rays of Au at incident photon energies selected above the threshold energy for each sub-shell with a crystal spectrometer. The experimental results have predicted a small influence of Coster–Kronig transitions on the anisotropy of x-ray emission. Group-VII -Barrea et al [24] measured the angular distribution of Er L x-rays following photo-ionization by linearly polarized monochromatic synchrotron radiation. Their experimental anisotropy parameter and degree of alignment show very good agreement with the predicted theoretical value. Santra et al. [25] measured the angular distribution of L x-ray fluorescent lines from Au and U at 22.6 keV and predicted a maximum anisotropy of 5% for Au and 2% for U. Recently, Mittal et al. [26] has made an attempt to study the angular distribution of L x-rays of tungsten (W-74) both theoretically and experimentally in the angular range 0° to 120° at 10.676 keV i. e. at photon energy lying between L3 and L2 edges of W where maximum anisotropy is expected and predicted significant anisotropy. As various groups predicted contradictory results therefore, to remove the existing ambiguity about alignment measurements presently, an attempt has been made to measure alignment parameter via experimental [26], empirical [27] and theoretical [28] formulations for tungsten near L3 sub-shell thresholds, where maximum anisotropy is expected. A comparison of empirical alignment parameter A
20 with theoretical and experimental values result in similar
trends and values being >0.1 at energy 10.676 keV are certainly higher than the 5 to 8 percent uncertainties quoted in earlier experimental results. The three methodologies adopted for evaluation of alignment parameter are being detailed in the following section.

Alignment Studies for Tungsten
Near L3 Sub-Shell Threshold Via Theoretical,
Experimental and Empirical Methods
81
Journal of Nuclear Physics, Material Sciences, Radiation and Applications, Vol. 1, No. 1, August 2013
2. METHODOLOGIES
2.1. Theoretical Formulation
At energies above thresholds, the overlapping chances of atom and outgoing electron wave functions are bleak or not there, therefore, Coulomb potential is the appropriate potential to build up an atomic model. Consequently, the present calculations of alignment are made using point Coulomb potential to build up an atomic model and non-relativistic dipole approximation for electron wave functions in different states as; the energy range, (near threshold) << mc2, satisfies the non-relativistic constraint on photon energies, element tungsten (W) satisfy the condition; (photon energy/mc2)
<< Zα (‘α’ the fine structure constant) that gives photon wavelength large compared to the radius of the bound electron. All this supports the dipole approximation.
The choice of Coulomb potential in the present circumstances also draws support from the statement quoted by Bechler and Pratt [29] that with increasing energy, when higher multipoles are needed point Coulomb calculations become quite accurate.
Therefore, because of the involvement of heavy elements and higher energies, the dipole approximation and Coulomb potential concepts are clubbed together.
Under non-relativistic dipole approximation for the ratio of the magnetic sub-state cross-sections, the expression for the alignment parameter A
2 becomes;
A
2 0
1
2
1
2
1
2
1
2
1
5
2 4=
− +
− +
+
+
R R
R R
(1)
with R rn
drp
±
= ℜℜ±
∞∫
13
10
*
,, as the single particle radial integral, comprising
‘ℜp,±1
’ and ‘ℜ n
’ for continuum and bound radial wave functions of the photoelectron. The angular momentum quantum number () for bound electron is denoted as L.
In point Coulomb potential [1], the normalized bound state wave function of the pho-toelectron is given as
ℜ = − + − +nL nL
Lr N r ar n F L n L ar n( ) exp( / ) [ ,( ), / ]1 1 1 2 2 2 (2)
where
N n L n n L a n LnL
L= + − − ++[( )!/ ( )!] ( / ) / ( )!/ /2 1 2 2 11 2 3 2 (3)
is the normalization constant, a = Zα as ‘α’ is the fine structure constant, 1F
1 is confluent
hyper-geometric function.

Sharma, A.Mittal, R.
82
Journal of Nuclear Physics, Material Sciences, Radiation and Applications, Vol. 1, No. 1, August 2013
For a continuum state, the normalized wave function is
ℜ = − ′ + + ′ +′ ′
′
p p
r N r ipr F ia p ipr,
( ) exp( ) ( / , , )
1 11 2 2 2 (4)
with
N p a p ia pp
′ = ′ + − ′ +′
( ) exp( / ) ( / ) | /( )!2 2 1 2 1π Γ (5)
Here ' = L ± 1 is the angular momentum of continuum state. The momentum of outgoing electron p = 2T , where ‘T’ is the kinetic energy of photoelectron in terms of mc2 i.e. (hν - BE)/mc2. Here ‘hν’, is the incident photon energy in keV, ‘BE’ is the binding energy of the electron.
For (2p3/2
) state (n = 2 and L = 1), the bound state wave function reduces to
ℜ = −21
5 2
1 10 2041 2 0 4( ) . ( ) [exp( / )] [ , , ]/r a r ar F ar (6)
For continuum states (' = 2 and 0), the continuum wave function (eq.4) reduces to
ℜ = −
−
pr p a p ia p
r ipr F
,( ) . [exp( . / )] ( / )
( )[exp( )].
2
2
2
1 1
0 0333 1 57 3Γ
[[ ( / ), , ]3 6 2+ i a p ipr (7)
and
ℜ = −
− +p
r a p ia p
ipr F i a p ip
,( ) exp( . / ) ( / )
[exp( )] [ ( / ), ,
0
1 1
1 57 1
1 2 2
Γ
rr] (8)
The single particle radial integral for bound (L = 1) and continuum ('=2) state reduces as;
R a p a p i a p
r ip
2
5 2 2
6
0 0068 1 57 3
0
= + ×
∞∫
. ( ) [exp( . ( / ))] ( ( / ))
{ [exp(
/ Γ
−− − −a r F i a p ipr dr/ ) ]. [ ( / ), ,( )]}2 3 6 21 1 (9)
Similarly, for L=1 and ' = 0 state
R a p a p i a p
r ip a
0
5 2 2
4
0 2041 1 57 1
02
= + ×
∞∫ −
. [exp( . / )] ( ( / ))
{ [exp( /
/ Γ
)) ] [ ( / ), ,( )]}r F i a p ipr dr1 1
1 2 2− − (10)
Thus for 2p3/2
state from relation (1)

Alignment Studies for Tungsten
Near L3 Sub-Shell Threshold Via Theoretical,
Experimental and Empirical Methods
83
Journal of Nuclear Physics, Material Sciences, Radiation and Applications, Vol. 1, No. 1, August 2013
Α20
0
2
2
2
0
2
2
2
1
5
2 4=
+
+
R R
R R (11)
In Mathematica version 2.2.1, the Confluent Hyper-Geometric Function 1F
1 with complex
arguments could not be computed. Therefore, the function 1F
1 are evaluated from its
series expression with argument parameters f, g and z as [30]
1 1
21 1 1 2F f g z fz g f f g g z
f gk k
( ; ; ) / ( ) / ( ) / ! ......
( ) / ( )
= + + + + +
= ∑
[ ]
{ }zz kk / ! (12)
For its computation, the series expansion is re-written as
1 1
11
11
F f g z
f k
fg k
g
( ; ; )
( )!( )!
( )!( )!
=
+ −−
+ −−
=
∞
∑k
kz
k0 ! (13)
In required evaluations of 1F
1 [3 – i] (a / p), 6, (–2ipr )]
and
1 11 2 2F i a p ipr[ ( / ), ,( )]− − ,
f = 3-ia/p and 1-ia/p g = 6 and 2 z = 2ipr.
In expression (13) with increasing momentum p of outgoing electron and variable k, the factor within the curly bracket reaches to steady state but the term zk increases continuously because of the presence of p in the terms f and z. Therefore, to make a judicious selection for variable k in computations, different ranges for k in expression (13) are tried. Variable k = 0 to 100, 50, 25, 20 and 15 are tried for the calculations of the fractional photo-ionization cross-sections for magnetic sub-states mj=3/2 and mj=1/2 for elements Mg and Ca using above formulation in the energy range threshold to 60 keV. Higher ranges, 0 to 100, 50 and 25 produce oscillating variations of the cross-sections at low photon energies. On moving from higher to lower values of k, 0 to 20 and 15, the results seem to approach the analytical results of Oh and Pratt [2].To accommodate the maximum number of terms, summation
over k = 0 to 20 is considered in the present calculations (Figure 1).
A crosscheck of present non-relativistic dipole calculations has been made with the predications of Berezhko et al [3] and that of Kleiman and Lohmann [5]. For this, alignment parameter for 2p
3/2 sub-shell of Mg and Ba is calculated as a function of
photoelectron energy (Ry) in the range 0 to 16 Ry as shown in (Figure 2) along with the results of Berezhko et al. [3].

Sharma, A.Mittal, R.
84
Journal of Nuclear Physics, Material Sciences, Radiation and Applications, Vol. 1, No. 1, August 2013
For both Mg and Ba there is similarity to some extent between the variation patterns of A
20 with photoelectron kinetic energy resulting from non-relativistic dipole calculations
and those reported by Berezhko et al [3]. Though, in case of Mg, alignment A20
from non-relativistic calculations is quite large as compared to that of Berezhko et al. But for Ba it is comparable. In case of Mg, Berezhko et al [3] quoted the marked increase in the value of alignment in the near threshold region and attribute it to the small barrier for the d-wave. For Ba the alignment parameter remains practically constant throughout the covered energy region including near threshold region, which suggests the almost total absence of a barrier. As per the predictions of Berezhko et al [3] the maximum and minimum limit of alignment parameter A
20 for 2P
3/2 state are 0.5 and 0.05, which
are in close agreement with the present results. A difference in the alignment values in case of Mg may be due to the change in the model used, as alignment is sensitive to the model used [3]. The comparison of the present alignment calculations with those of Kleiman and Lohman [5] for Ne and Mg (Figure 3) again supports the pattern of variation that away from thresholds, alignment decreases with kinetic energy of the outgoing electron. But the non-relativistic values are quite larger than those of Kleiman and Lohman in both the cases. This supports the same conclusion for low Z elements as drawn from the comparison of non-relativistic results with those of Berezhko et al [3], moreover, for Mg Berezhko et al’s results are higher than those of Kleiman and Lohman near the thresholds. This shows that the explanation provided by Kleiman and Lohman [5] is applicable to our results. That explains that whenever the main transition ( nL L→ +ε 1 ) dominates the alignment parameter takes values close
Figure 1: Plot of fractional photo-ionization cross-sections for L3 magnetic sub-states (mj=3/2,1/2) vs. Photon energy for Mg and Ca for k = 0 to 20.

Alignment Studies for Tungsten
Near L3 Sub-Shell Threshold Via Theoretical,
Experimental and Empirical Methods
85
Journal of Nuclear Physics, Material Sciences, Radiation and Applications, Vol. 1, No. 1, August 2013
to its lower limit and there are certain energy regions where main transition is weaker than the other one nL L→ −ε 1, in such cases alignment is close to its upper limit. After checking the credibility of the present formulation with the results from earlier theoretical calculations for alignment parameter the formulation is applied to tungsten, which is the feasible element with the existing experimental set-ups, and in the energy region near threshold. A
20 evaluations
are performed in mathematica and the generated
results are listed in table (2). The results interpret the maximum alignment of the order of ≈ 0.5 near threshold energy (10.676 keV), which tallies with the prediction of Berezhko et al [3].
2.2. Experimental Details
The experimental measurements are performed in XRF laboratories of Raja Ramanna Center for Advanced Technology (RRCAT), Indore, India. The experiment is performed using a three-dimensional double reflection geometrical set-up (Figure 4). In the set-up a Cu K x-ray tube with a 3mm window is used as the parent photon source. A pellet of As
2O
3 is used, in turn, as primary exciter to provide 10.676 keV of photon
incidence. The Cu K x-rays (8.136 keV) are unable to produce K shell vacancies in Arsenic, therefore, bremstrahlung radiation from the parent source is to be used for excitation of primary exciter.
For each measurement, the primary exciter (active area 4.8 cm2 each) is at a distance of 48 mm from the x-ray tube at an inclination of 45° to the incident beam. A symmetrical K x-ray beam at 90° from primary exciter is further used to create L sub-shell vacancies in W. A Mo collimator with a 10 mm window was used in between exciter and W target to collimate the K x-ray beam. Thick circular target of tungsten (99.9% pure) having thickness 0.527 mg/cm2 was on a solid support inclined at angle of 45° and
Figure 2: Comparison of alignment parameter A20 vs. kinetic energy (KE) of the photoelectron (Ry) with Berezhko et al [3] results, for the 2p3/2 sub-shell of Mg and Ba.

Sharma, A.Mittal, R.
86
Journal of Nuclear Physics, Material Sciences, Radiation and Applications, Vol. 1, No. 1, August 2013
at a distance of 50 mm from the Primary exciter. A Peltier cooled detector [10 mm2, Be window thickness 0.5 µm] with FWHM ~240 eV is in vertical configuration to detect the L x-rays emitted from the experimental target i.e. in a plane perpendicular to the plane formed by the tube, primary exciter and experimental target. Such an arrangement of the parent source, primary exciter, experimental target and the detector reduces the scattered background. The detector is clamped on a mount. The angle scanned by the detector is measured with respect to the direction of the electric vector of the exciting primary x-ray beam. The detector in the direction of the electric vector corresponds to 0° angle. The angle scan is from 0° to 120° at an interval of 30°. The obtained statistical uncertainty was ~2% with As
2O
3 exciter. A typical L x ray spectrum
of tungsten at 900 observation angle is shown in figure 5.
As Kαβ x-ray energy corresponds to ionization of only L3 sub-shell of W while individual Kβ of As also produces the vacancies in L2 sub-shell of W. Thus, with the inclusion of L2 sub-shell excitations in W due to As Kβ
i’s the total vacancy production
in W-L3 sub-shell because of individual AsKα
i and As
Kβ
i is given as;
σ
σ σ
α β
β β α αα
W L As
W L K i K i W L K i K iK i
E K and K
E f I E I
−
− −
=+ ∑( ) ( )
3
2 23 3
[ ( )]
∑
+ ∑∑K i
K i K iK iK i
I Iβ
β ααβ (14)
where I’s are relative intensities of K x-rays and σLi’s are sub-shell ionization cross-
sections and L2 to L3 CK transition probability f23
is 0.133 for W. Using all this data
Figure 3: Comparison of alignment parameter (A20) vs. kinetic energy (KE) of the photoelectron (Ry) with Kleiman and Lohman [5] results, for the 2p3/2
sub-shell of Ne and Mg.

Alignment Studies for Tungsten
Near L3 Sub-Shell Threshold Via Theoretical,
Experimental and Empirical Methods
87
Journal of Nuclear Physics, Material Sciences, Radiation and Applications, Vol. 1, No. 1, August 2013
in above expression, σα βW L As
E K and K− 3( ( )) comes out to be 38199.4 that is just
1% .Higher than the value 37758.0 σαβW L K
E− 3
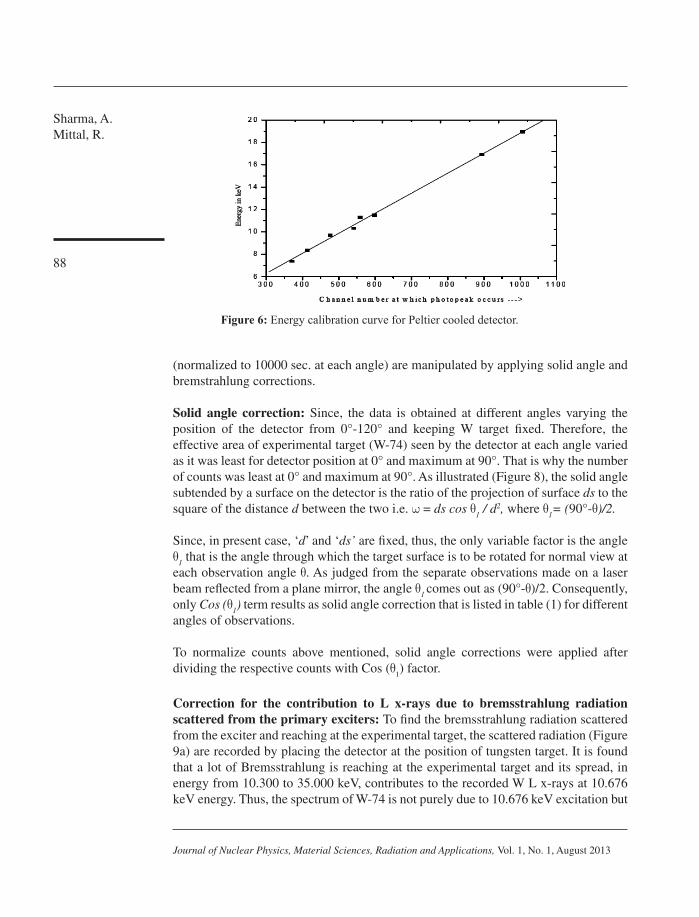
( ) . All this is very much within the experimental uncertainties. Therefore, for selective photo-ionization of L3 sub-shell, excitation energy as average energy of As Kαβ x-rays is used. For observing the detector calibration, the channel numbers corresponding to peaks of different L x-rays
and 90° scattered K x-rays of As is noted. By grouping W L x-ray lines under L
, Lα, Lβ and Lγ peaks under the constraints of resolution of detector, the weighted average energy of each peak is calculated with line intensities as their weights. The plot of the energies against the channel number is found to be linear in the L x-ray energy region
(Figure 6).
After applying the multi-peak Gaussian fits (Figure 7) for various L x-ray peaks (, α, β and γ) depending upon their relative intensities, the background subtracted counts
Figure 4: Schematic diagram of experimental set-up used for the measurements.
Figure 5: Typical L x ray spectrum of tungsten at As K x-ray energy.
Sharma, A.Mittal, R.
88
Journal of Nuclear Physics, Material Sciences, Radiation and Applications, Vol. 1, No. 1, August 2013
(normalized to 10000 sec. at each angle) are manipulated by applying solid angle and bremstrahlung corrections.
Solid angle correction: Since, the data is obtained at different angles varying the position of the detector from 0°-120° and keeping W target fixed. Therefore, the effective area of experimental target (W-74) seen by the detector at each angle varied as it was least for detector position at 0° and maximum at 90°. That is why the number of counts was least at 0° and maximum at 90°. As illustrated (Figure 8), the solid angle subtended by a surface on the detector is the ratio of the projection of surface ds to the square of the distance d between the two i.e. ω = ds cos θ
1 / d2, where θ
1= (90°-θ)/2.
Since, in present case, ‘d’ and ‘ds’ are fixed, thus, the only variable factor is the angle θ
1 that is the angle through which the target surface is to be rotated for normal view at
each observation angle θ. As judged from the separate observations made on a laser beam reflected from a plane mirror, the angle θ
1 comes out as (90°-θ)/2. Consequently,
only Cos (θ1) term results as solid angle correction that is listed in table (1) for different
angles of observations.
To normalize counts above mentioned, solid angle corrections were applied after dividing the respective counts with Cos (θ
1) factor.
Correction for the contribution to L x-rays due to bremsstrahlung radiation scattered from the primary exciters: To find the bremsstrahlung radiation scattered from the exciter and reaching at the experimental target, the scattered radiation (Figure 9a) are recorded by placing the detector at the position of tungsten target. It is found that a lot of Bremsstrahlung is reaching at the experimental target and its spread, in energy from 10.300 to 35.000 keV, contributes to the recorded W L x-rays at 10.676 keV energy. Thus, the spectrum of W-74 is not purely due to 10.676 keV excitation but
Figure 6: Energy calibration curve for Peltier cooled detector.

Alignment Studies for Tungsten
Near L3 Sub-Shell Threshold Via Theoretical,
Experimental and Empirical Methods
89
Journal of Nuclear Physics, Material Sciences, Radiation and Applications, Vol. 1, No. 1, August 2013
it includes the L x-rays due to the scattered Bremsstrahlung spread at energies >10.300 keV. To make evaluations for single energy photon excitations, the Bremsstrahlung correction is to be applied as under; Since, photo-ionization cross-sections are energy dependent, thus, 10.300 to 35.000 keV spread of scattered Bremsstrahlung is to be splited in to small strips of energy, each strip of 250 eV as illustrated (Figure 9b). To convert the counts collected under an energy strip into L sub-shell x-ray contribution, first L-shell ionization cross sections σ1, σ2 and σ3 at mean energy of the strip are generated using our program LSPICS [31]. The product of L sub-shell photo-ionization cross-sections and counts under the strip (representing as incident photons) provides its relative contribution to L sub-shell vacancy population (νp).
To make final data independent of detector efficiency, the corrected counts at each angle under each peak are normalized with the corresponding counts at 90°.
Figure 7:Typical L x-ray spectrum with multi-peak Gaussian fits for various L x-ray peaks (, α, β and γ) depending upon their relative intensities.
Figure 8: Illustration of the method applied for solid angle correction.

Sharma, A.Mittal, R.
90
Journal of Nuclear Physics, Material Sciences, Radiation and Applications, Vol. 1, No. 1, August 2013
Going through the paper of Barrea et al. [24], it is found that the co-ordinate system (x, y, z) in schematic diagram of present experimental set up (Figure 5) is very much similar to their dedicated instrumentation designed for an-isotropic distribution measurements. They interpreted that with incident photons oriented along z-axis and the emitted x-rays in the xy plane, the rotation of detector in xy plane with respect to x-axis is a variation of azimuth angle φ at a polar angle θ between incoming photon and the outgoing photon. On these guidelines, the present measurements come out to be distribution studies in the polarization plane at polar angle θ = 90°. The general expression for the x-ray angular variation for an incoming photon beam oriented along the z-axis is [24].
WW
A Jk
Yk
kkq kq
q
θ φ
πα
πθ φ,
, ......,( ) = + ∑
+∑
=
( ) ( )
0
2 441
4
2 1 (15)
Where; W0 is the total x-ray emission rate. α
k is the anisotropy co-efficient for a
particular transition. Akq
is the normalized statistical tensor of the decaying state with total angular momentum J and Y
kq (θ, φ) are the spherical harmonics. For L3 (J=3/2)
excitation, k is 2 and the expression (15) reduces to
WW
A J Yq qq
θ φ
πα
πθ φ, ,( ) = + ∑ ( ) ( )
02 2 2
41
4
5 (16)
Under dipole approximation, intrinsic alignment is A20
and any additional alignment A22
due to the polarization of the beam can be directly related to A
20 by the relation
(17)
A A i22 20 3 1
3
2= − +( )η η (17)
where η1 and η
3 are two of the Stokes parameters.
In the present case, the azimuth angle φ varies from 0° to 120° at polar angle θ = 90°, therefore, for x-rays oscillating along the x-axis, φ = 0° and the Stokes parameters η
1
= 0 and η3 = 1, the angular distribution expression becomes as
Angle of observation (θ) θ1 = (90° - θ)/2 Corr. FactorCos (θ1)
0° 45° 0.707
30° 30° 0.866
60° 15° 0.965
90° 0° 1.000
120° 15° 0.965
Table 1: Value of correction factor for solid angle normalization.

Alignment Studies for Tungsten
Near L3 Sub-Shell Threshold Via Theoretical,
Experimental and Empirical Methods
91
Journal of Nuclear Physics, Material Sciences, Radiation and Applications, Vol. 1, No. 1, August 2013
WLW
Ag
90 04
1 1 250
2 20° ° = + −( ) [ ]( ), ( . )
πα (18)
On the similar lines for φ = 30°, 60°, 90° and 120°,
WLW
A
WLW
g
g
90 304
1 0 875
90 604
1
0
2 20
0
2
° ° = + −
° ° = +
( ) [ ]( )
( )
, ( . )
, (
πα
πα −−
° ° = +
°
[ ]( )
( ) [ ]( )
0 125
90 904
1 0 250
90 1
20
0
2 20
. )
, ( . )
,
A
WLW
A
WL
g
g
πα
2204
1 0 1250
2 20° = + −( ) [ ]( )
WA
πα ( . ) (19)
Since at angle φ for each Lg peak, factor W
0/4π is same and only α
2 that depends on
the J values of the initial and final stages of the ionized atom has values 0.5, 0.1, -0.4
and 0.1 for L
, Lα1, Lα2
and Lβ2 respectively [3].
Figure 9a: The fluorescence spectrum of Mo, excited from bremstrahlung radiation of Cu x-ray tube at 35KV, 10mA with detector at the position of W target
Figure 9b: Minute view of each strip and corresponding L sub-shell vacancies at mean energy of the strip.

Sharma, A.Mittal, R.
92
Journal of Nuclear Physics, Material Sciences, Radiation and Applications, Vol. 1, No. 1, August 2013
2.3. Empirical Formulation
Among the L x-rays from the ionized L sub-shells, both Lα and L groups of L x-rays originate from L3 (2p
3/2) state and the Lα group of x-rays is combination of Lα1 and
Lα2 lines and their production cross-sections presuming isotropic distribution are
σ σ σ σ ωL L L L
f f f f F
* [ ( ) ]= + + +1 12 23 13 2 23 3 3 3
(20)
σ σ σ σ ωα αL L L L
f f f f F* [ ( ) ]= + + +1 12 23 13 2 23 3 3 3
(21)
where ωi is sub-shell fluorescence yield, F
i′s are radiative decay rates.
σ
σα αL
L
F
F
*
*
= 3
3
(22)
Ratios σ*Lα/σ*L nullify the effects of sub-shell fluorescence and Coster-Kronig yields at incident photon energies greater than L1 edges. The angular distribution of dipole x-rays originating from vacancies in L
3 State is governed by the equation,
WL WL P Cosθ π β θ( ) ( ) [ ][ ]= +/ .4 12 (23)
WL is the total x-rays emitted in 4π solid angle and P2
(Cosθ) is the second order Legendre polynomial. β is the coefficient of anisotropy and expressed as β = αA
20.
A20
is the degree of alignment. The resulting total intensities WL, WLα1 and WL2 are proportional to the total L
3 hole production cross-sections and to the radiative
transition probabilities F’s i.e., respective x-ray fluorescence (XRF) cross-sections
σ*L, σ*Lα1 and σ*Lα2. Therefore,
σ ασ
θα θ α θ
θ*
*
L
L
WL WL
WL
( )( ) ( )
( )=
+1 2 (24)
At θ = 90°, for F3α2/ F3α1 = 1/9 for hydrogen like wave functions of 3d and 2p states above expression becomes
Energy(keV)
Azimuthal angle (φ)
Alignment parameter (A20)
(Experimental) (Theoretical) (Empirical)
10.676 0° 0.138(0.014) 0.151 0.240
30° -0.775(-0.074)
60° -0.194(-0.019)
90° 0.153(0.015)
120° 0.700(0.070)
Table 2: Comparative values of alignment parameter (A20).

Alignment Studies for Tungsten
Near L3 Sub-Shell Threshold Via Theoretical,
Experimental and Empirical Methods
93
Journal of Nuclear Physics, Material Sciences, Radiation and Applications, Vol. 1, No. 1, August 2013
σ ασ
α α*
*.
L
L
F F
FA
903 1 3 2
31 0 225
20° =
++( )
( )[ ] (25)
Thus, the ratio σ*Lα /σ*L is a function of the degree of alignment A20
as well as of the radiative transition probabilities and is independent of the source and mode of vacancy production. For no alignment, A
20 = 0, the ratio of cross-sections is just the
ratio of the transition probabilities. Thus, one requires a preliminary scanning of the experimental data on Lα/L
cross-section ratios for dependence on incident energy for an element and then its comparison with respective transition probability ratio (F
3α1 +
F3α2
) / F3
. The difference between LXRF cross-sections ratio and transition probability ratio is used for the determination of A
20 parameter. A methodology has already been
developed in our laboratory [32] to evaluate L3 alignment from σ*Lα /σ*L. For A20
evaluations, the experimental LXRF cross-section σ*Lg (g = α, ) values of Mann et al [33] at incident photon energy 10.676 keV are used. The experimental values along with reported 8% errors are interpolated using the computer software IGELCS [32]. The ratios along with the values of radiative decay rates [32] are used to calculate A
20
in relation (25). The values are found to depend on incident photon energy.
3. CONCLUSIONS
Theoretically, alignment parameter A20
for tungsten is found 0.151 near L3 sub-shell threshold energy (10.676 keV). Observed variation in alignment parameter at threshold energy from the maximum limit 0.5, corresponds to some change in the point Coulomb potential due to even numbers of electrons < 5 in the 5d shell for elements 71 ≤ Z ≤ 80. Also the intermediate results of present calculation point towards the dominance
of radial wave function R
+1 over the R
-1 at thresholds and around 1 keV above
thresholds the dominance of R
+1 and
R
-1 reverses that also hints towards variation
in A20
from the maximum limit of 0.5. Moreover, the A20
values being > 0.1 at near threshold energies are certainly higher than 5-8% uncertainty quoted in experimental results of various groups. Experimentally, excluding the departed A
20 values at φ =
30° and 120° for 10.676 keV excitation and ignoring the negative sign, the weighted average of remaining values with 10% error comes 0.155 ± 0.009. Comparing the results from two methods the trends of alignment values are similar though the values
are not exactly same. With reference to equation (25) the errors in the σLα/σ
L
ratios
yield large uncertainties in A
20 parameter, which makes it inappropriate to compare
the empirical results with those from theoretical calculations or from experimental angular distribution measurements. In contrast to theoretical and experimental trends, the empirical result shows comparative rise in A
20. Therefore, more detailed and precise
measurements on energy dependence of σLα/σ
L
ratios are required.
REFERENCES
[1] S. Flugge, W. Mehlhorn and V. Schmidt,”Angular distribution of Auger electrons following photo-ionization”, Phys. Rev. Lett, Vol. 29, pp. 7, (1972).
http://dx.doi.org/10.1103/PhysRevLett.29.1288.2

Journal of Nuclear Physics, Material Sciences, Radiation and Applications, Vol. 1, No. 1, August 2013
[2] S. D. Oh and R. H. Pratt,”Dependence of atomic photo-effect on abound electron magnetic sub-state”, Phys. Rev, Vol. 10, pp. 1198, (1974).
http://dx.doi.org/10.1103/PhysRevA.10.1198[3] E. G. Berezhko, N. M. Kabachnik and V. S. Rostovsky,”Potential barrier effects in inner
shell photo-ionization and their influence on the anisotropy of x-rays and Auger electrons” J. Phys. B, Vol. 11, pp. 1749, (1978). http://dx.doi.org/10.1088/0022-3700/11/10/012
[4] E G Berezhko and N M Kabachnik,” Theoretical study of inner-shell alignment of atoms in electron impact ionisation: angular distribution and polarisation of X-rays and Auger electrons ” J. Phys. B10, pp. 2467, (1977).
http://dx.doi.org/10.1088/0022-3700/10/12/025[5] U. Kleiman and B. Lohmann, “Photo-ionization of closed shell atoms: Hartree Fock
calculations of orientation and alignment”, J. Elect. Spectro. and Rel. Phen., Vol. 131, pp. 29, (2003). http://dx.doi.org/10.1016/S0368-2048(03)00034-3
[6] K. S. Kahlon, S. Kumar, K. L. Allawadhi and B. S. Sood,”Total attenuation cross-sections of fluorescent x-rays of Zr, Sn, Ba, Au, Pb, Th and U elements ” Pramana, Vol. 33, pp. 505, (1989). http://dx.doi.org/10.1007/BF02846017
[7] K. S. Kahlon, H. S. Aulakh, N. Singh, R. Mittal, K. L. Allawadhi and B. S. Sood, “Experimental investigation of alignment of the L
3 subshell vacancy state produced after
photoionisation in lead by 59.57 keV photons” , Phys. B, Vol. 23, pp. 2733, (1990). http://dx.doi.org/10.1088/0953-4075/23/16/016[8] K. S. Kahlon, H. S. Aulakh, N. Singh, R. Mittal, K. L. Allawadhi and B. S. Sood,
“Measurement of angular distribution and polarization of photon-induced fluorescent x rays in thorium and uranium” Phys. Rev. A, Vol. 43, pp. 1455, (1991).
http://dx.doi.org/10.1103/PhysRevA.43.1455[9] K. S. Kahlon, N. Singh, R. Mittal, K. L. Allawadhi and B. S. Sood, “L
3-subshell vacancy
state alignment in photon-atom collisions”Phys. Rev. A,Vol. 44, pp. 4379, (1991). http://dx.doi.org/10.1103/PhysRevA.44.4379[10] J. K. Sharma and K. L. Allawadhi, “Angular distribution of L x-rays from decay of L
3
subshell vacancies in uranium and thorium following photoionization” J. Phys. B, Vol. 32, pp. 2343, (1999). http://dx.doi.org/10.1088/0953-4075/32/10/304
[11] T. Papp and J. L. Campbell, “Non-statistical population of magnetic substates of the erbium L
3 subshell in photoionization” J. Phys. B, Vol. 25, pp. 3765, (1992).
http://dx.doi.org/10.1088/0953-4075/25/18/007[12] M. Ertugrul, R. Durak, E. Tirasoglu, E. Buyukkasap and H. Erdogan, “Angular Dependence
of Differential Cross-Sections of L X-Rays from Hg, TI, and Pb at 59.5 keV”, Appl. Spectroscopy. Rev., Vol. 30, pp. 219 (1995).
http://dx.doi.org/10.1080/05704929508000909[13] M. Ertugrul, E. Buyukkasap, A. Kucukonder, A. I. Kopia and H Erdogan,” Anisotropy of
L -shell X-rays in Au and Hg excited by 59.5 keV photons” Nuovo Cimento D, Vol. 17, pp. 993, (1995). http://dx.doi.org/10.1007/BF02456787
[14] S. Seven and K. Kocak, “Angular dependence of L x-ray production cross sections in seven elements from Yb to Pt at a photon energy of 59.5 keV”, J. Phys. B, Vol. 34, pp. 2021, (2001). http://dx.doi.org/10.1088/0953-4075/34/10/315
[15] S. Seven and K. Kocak,” Angular dependence of L x-ray production cross-section in seven elements from Au to U at 59.5 keV photon energy” X Ray Spectrom., Vol. 31, pp. 75, (2002). http://dx.doi.org/10.1002/xrs.549

Journal of Nuclear Physics, Material Sciences, Radiation and Applications, Vol. 1, No. 1, August 2013
[16] L. Demir, M. Sahin, Y. Kurucu, A. Karabulut and Y. Sahin, “Angular dependence of Ll, Lα, Lβ and Lγ X-ray differential and fluorescence cross-sections for Er, Ta, W, Au, Hg and Tl” Rad. Phys. Chem., Vol. 67, pp.605, (2003).
http://dx.doi.org/10.1016/S0969-806X(02)00501-7
[17] D. Mehta, S. Puri, M. L. Garg, N. Singh and P. N. Trehan, “Angular dependence of L x-ray production cross sections in uranium at 22.6- and 59.5-keV photon energies” Phys. Rev. A, Vol. 59, pp.2723, (1999). http://dx.doi.org/10.1103/PhysRevA.59.2723
[18] A. Kumar, S. Puri, D. Mehta, M. L. Garg and N. Singh,” Angular dependence of L x-ray emission in Pb following photoionization at 22.6 and 59.5 keV”, J. Phys B, Vol. 32, pp. 3701, (1999). http://dx.doi.org/10.1088/0953-4075/32/15/305
[19] A. Kumar, S. Puri, J. S. Shahi, M. L. Garg, D. Mehta, and N. Singh,” L x-ray production cross sections in Th and U at 17.8, 25.8 and 46.9 keV photon energies”, J. Phys. B, Vol. 34, pp. 613, (2001). http://dx.doi.org/10.1088/0953-4075/34/4/309
[20] H. Yamaoka, M. Oura, K. Takahiro, N. Takeshima, K. Kawatsura, M. Mizumaki, U. Kleiman, N. M. Kabachnik and T. Mukoyama, “Angular distribution of Au and Pb L x rays following photoionization by synchrotron radiation” Phys. Rev. A, Vol. 65, pp. 062713-1, (2002). http://dx.doi.org/10.1103/PhysRevA.65.062713
[21] H. Yamaoka, M. Oura, K. Takahiro, T. Morikowa, S. ito, N. Takeshima, M. Mizumaki, S. Semenov, N. Cherepkov, N. M. Kabachnik and T. Mukoyama, “Alignment following Au L
3 photo ionization by synchrotron radiation”, J. Phys. B, Vol. 36, pp. 3889 (2003).
http://dx.doi.org/10.1088/0953-4075/36/19/001
[22] H. Yamaoka, M. Oura, K. Takahiro, K. Kawatsura, S. ito, M. Mizumaki, H. Oohashi, Y. Ito and T. Mukoyama, “The effect of Coster–Kronig transitions on the anisotropy of x-ray emission following Au L-shell photoionization” J Phys. B, Vol. 39, pp. 2747, (2006). http://dx.doi.org/10.1088/0953-4075/39/12/010
[23] A. Tartari, C. Baraldi, A. D. Re, J. E. Fernandez and S. Taioli, “On the angular dependence of L x-ray production cross sections following photo ionization at an energy of 59.54 keV”, J. Phys. B, Vol.36, pp. 843 (2003). http://dx.doi.org/10.1088/0953-4075/36/5/305
[24] R. A. Barrea, C. A. Perez, T. S. Plivelic, E. V. Bonzi and H. J. Sanchez,” Anisotropic angular distribution of Er L x-rays following photoionization by linearly polarized radiation” J. Phys. B, Vol.38, pp. 839, (2005). http://dx.doi.org/10.1088/0953-4075/38/7/006
[25] S. Santra, D. Mitra, M. Sarkar and D. Bhattacharya, “Angular distribution of Au and U L x rays induced by 22.6-keV photons”Phys. Rev. A, Vol. 75, pp. 022901-1, (1999).
http://dx.doi.org/10.1103/PhysRevA.75.022901
[26] A. Sharma and R. Mittal, “Experimental and theoretical anisotropy studies for tungsten”, Nuclear Instruments and Methods in Physics Research A, Vol. 619, pp. 55, (2010).
http://dx.doi.org/10.1016/j.nima.2009.12.081
[27] Raj Mittal and Vandana, Rad. Phys. Chem., Vol. 51, pp. 357, (1998).
[28] A. Sharma, M. Singh and R. Mittal,”Study of photon-induced L3 vacancy alignment for elements La to U” Pramana, Vol. 66, pp. 1111, (2006).
http://dx.doi.org/10.1007/BF02708464
[29] A. Bechler and R. H. Pratt, “Higher multipole and retardation effects in the spin and polarization correlations of polarized photoelectrons ejected from the 2p
J subshell by
polarized photons - a nonrelativistic approach”J. Phys. B, Vol. 32, pp. 2889, (1999).
http://dx.doi.org/10.1088/0953-4075/32/12/309
Journal of Nuclear Physics, Material Sciences, Radiation and Applications, Vol. 1, No. 1, August 2013
[30] S. Wolfram, ‘The Mathematica’ Cambridge University Press., pp.749, (1996).
[31] A. Sharma and R. Mittal, “Generation of L sub-shell photo-ionization cross-sections for elements 18 to 92 at energies .320–115.606 keV (A computer program ‘LSPICS’)”, J. Quantitative spectroscopy and radiative Transfer, Vol. 95, pp. 49, (2005).
http://dx.doi.org/10.1016/j.jqsrt.2004.09.029
[32] R. Mittal, M. Singh and Vandana, “Generation of experimental L x-ray fluorescence cross-sections for inter-elements at inter-energies EL1 ≤ E ≤ EK (computer program IGELCS)”, x-ray spectrometry, Vol. 32, pp. 285, (2003).
[33] K L Allawadhi, B S Sood, Raj Mittal, N Singh and K S Mann, J. Phys. B, Vol. 27, 1994, pp.15.J. H. Scofield, “Exchange corrections of K x-ray emission rates”, Phys. Rev. A, vol. 9, pp. 1041, (1974).
Dr Ajay Sharma is an Assistant Professor in Physics at Chitkara University, Himachal Pradesh-India. He obtained Ph.D. degree in 2007 from Nuclear Science Laboratories, Physics Department, Punjabi University, Patiala-India. His area of specialization is Atomic and Radiation Physics. He has a number of research papers to his credit published in reputed International Journals and the proceedings of the conferences/Symposia. He has published a book on ‘vacancy alignment in atomic inner shells’ with German publications. Dr. Sharma is a life member of Indian society for atomic and molecular Physics (ISAMP) and Indian society for radiation Physics (ISRP).
![Tungsten and Selected Tungsten Compounds · Tungsten and Selected Tungsten Compounds Tungsten [7440-33-7] Sodium Tungstate [13472-45-2] Tungsten Trioxide [1314-35-8] Review of Toxicological](https://img.dokumen.tips/doc/110x75/5b4beb687f8b9afe4d8b49dd/tungsten-and-selected-tungsten-compounds-tungsten-and-selected-tungsten-compounds.jpg)