Embed Size (px)
Citation preview

Aligning Utility Incentives with Investment in Energy Effi ciency
A RESOURCE OF THE NATIONAL ACTION PLAN FOR
ENERGY EFFICIENCY
NOVEMBER 2007
About This Document
This report on Aligning Utility Incentives with Investment in Energy Effi ciency is provided to assist gas and electric utilities, utility regulators, and others in the implementation of the recommendations of the National Action Plan for Energy Effi ciency (Action Plan) and the pursuit of its longer-term goals.
The Report describes the fi nancial effects on a utility of its spending on energy effi ciency programs, how those effects could constitute barriers to more aggressive and sustained utility investment in energy effi ciency, and how adoption of various policy mechanisms can reduce or eliminate these barriers. The Report also provides a number of examples of such mechanisms drawn from the experience of utilities and states.
The primary intended audiences for this paper are utilities, state policy-makers, and energy effi ciency advocates interested in specific options for addressing the fi nancial barriers to utility investment in energy effi ciency.

Aligning Utility Incentives with Investment in Energy
Effi ciency A RESOURCE OF THE NATIONAL ACTION PLAN FOR
ENERGY EFFICIENCY
NOVEMBER 2007
Aligning Utility Incentives with Investment in Energy Effi ciency is a product of the National Action Plan for Energy Effi
ciency Leadership Group and does not refl ect the views, policies, or otherwise of the federal government. The role of the
U.S. Department of Energy and U.S. Environmental Protection Agency is limited to facilitation of the Action Plan.
This document was fi nal as of December 2007 and incorporates minor modifi cations to the original release.
If this document is referenced, it should be cited as:
National Action Plan for Energy Effi ciency (2007). Aligning Utility Incentives with Investment in Energy Effi ciency. Pre
pared by Val R. Jensen, ICF International. <www.epa.gov/eeactionplan>
For More Information
Regarding Aligning Utility Incentives with Investment in Energy Effi ciency, please contact:
Joe Bryson
U.S. Environmental Protection Agency
Offi ce of Air and Radiation
Climate Protection Partnerships Division
Tel: (202) 343-9631
E-mail: [email protected]
Regarding the National Action Plan for Energy Effi ciency, please contact:
Stacy Angel
U.S. Environmental Protection Agency
Offi ce of Air and Radiation
Climate Protection Partnerships Division
Tel: (202) 343-9606
E-mail: [email protected]
Larry Mansueti
U.S. Department of Energy
Offi ce of Electricity Delivery and Energy Reliability
Tel: (202) 586-2588
E-mail: [email protected]
or visit www.epa.gov/eeactionplan

Table of Contents
List of Figures .................................................................................................................................................... i
List of Tables .....................................................................................................................................................ii
List of Abbreviations and Acronyms.................................................................................................................. iii
Acknowledgements ..........................................................................................................................................v
Executive Summary ................................................................................................................................. ES-1
The Financial and Policy Context ........................................................................................................... ES-1
Program Cost Recovery ......................................................................................................................... ES-2
Lost Margin Recovery and the Throughput Incentive ............................................................................. ES-2
Utility Performance Incentives ............................................................................................................... ES-3
Understanding Objectives—Developing Policy Approaches That Fit ........................................................ ES-4
Emerging Models.................................................................................................................................. ES-7
Final Thoughts ...................................................................................................................................... ES-7
Notes.................................................................................................................................................... ES-8
Chapter 1: Introduction ............................................................................................................................. 1-1
1.1 Energy Effi ciency Investment ............................................................................................................. 1-1
1.2 Aligning Utility Incentives with Investment in Energy Effi ciency Report ............................................... 1-8
1.3 Notes.............................................................................................................................................. 1-10
Chapter 2: The Financial and Policy Context for Utility Investment in Energy Effi ciency .................... 2-1
2.1 Overview .......................................................................................................................................... 2-1
2.2 Program Cost Recovery ..................................................................................................................... 2-2
2.3 Lost Margin Recovery........................................................................................................................ 2-3
2.4 Performance Incentives ..................................................................................................................... 2-7
2.5 Linking the Mechanisms.................................................................................................................... 2-8
2.6 “The DNA of the Company:” Examining the Impacts of Effective Mechanisms on the Corporate Culture............................................................................................................................. 2-9
2.7 The Cost of Regulatory Risk ............................................................................................................ 2-10
2.8 Notes.............................................................................................................................................. 2-11
Chapter 3: Understanding Objectives—Developing Policy Approaches That Fit .................................. 3-1
3.1 Potential Design Objectives ............................................................................................................... 3-1
3.2 The Design Context .......................................................................................................................... 3-3
3.3 Notes................................................................................................................................................ 3-5
National Action Plan for Energy Effi ciency
Table of Contents (continued)
Chapter 4: Program Cost Recovery ........................................................................................................... 4-1
4.1 Overview .......................................................................................................................................... 4-1
4.2 Expensing of Energy Effi ciency Program Costs ................................................................................... 4-1
4.3 Capitalization and Amortization of Energy Effi ciency Program Costs .................................................. 4-5
4.4 Notes................................................................................................................................................ 4-9
Chapter 5: Lost Margin Recovery.............................................................................................................. 5-1
5.1 Overview .......................................................................................................................................... 5-1
5.2 Decoupling ....................................................................................................................................... 5-1
5.3 Lost Revenue Recovery Mechanisms................................................................................................ 5-10
5.4 Alternative Rate Structures .............................................................................................................. 5-12
5.5 Notes.............................................................................................................................................. 5-13
Chapter 6: Performance Incentives........................................................................................................... 6-1
6.1 Overview .......................................................................................................................................... 6-1
6.2 Performance Targets ......................................................................................................................... 6-3
6.3 Shared Savings .................................................................................................................................. 6-4
6.4 Enhanced Rate of Return ................................................................................................................ 6-11
6.5 Pros and Cons of Utility Performance Incentive Mechanisms ............................................................ 6-11
6.6 Notes.............................................................................................................................................. 6-12
Chapter 7: Emerging Models..................................................................................................................... 7-1
7.1 Introduction ...................................................................................................................................... 7-1
7.2 Duke Energy’s Proposed Save-a-Watt Model ...................................................................................... 7-1
7.3 ISO New England’s Market-Based Approach to Energy Effi ciency Procurement ................................... 7-4
7.4 Notes................................................................................................................................................ 7-5
Chapter 8: Final Thoughts—Getting Started ........................................................................................... 8-1
8.1 Lessons for Policy-Makers.................................................................................................................. 8-1
Appendix A: National Action Plan for Energy Efficiency Leadership Group ....................... Appendix A-1
Appendix B: Glossary............................................................................................................... Appendix B-1
Appendix C: Sources for Policy Status Table .......................................................................... Appendix C-1
Appendix D: Case Study Detail ............................................................................................... Appendix D-1
Appendix E: References ............................................................................................................Appendix E-1
Aligning Utility Incentives with Investment in Energy Effi ciency
List of Figures
Figure ES-1. Cost Recovery and Performance Incentive Options ................................................................. ES-2
Figure 1-1. Annual Utility Spending on Electric Energy Effi ciency .................................................................. 1-1
Figure 1-2. National Action Plan for Energy Effi ciency Recommendations and Options ................................. 1-2
Figure 2-1. Linking Cost Recovery, Recovery of Lost Margins, and Performance Incentives ............................ 2-9
Figure 6-1. California Performance Incentive Mechanism Earnings/Penalty Curve ......................................... 6-9
National Action Plan for Energy Effi ciency i
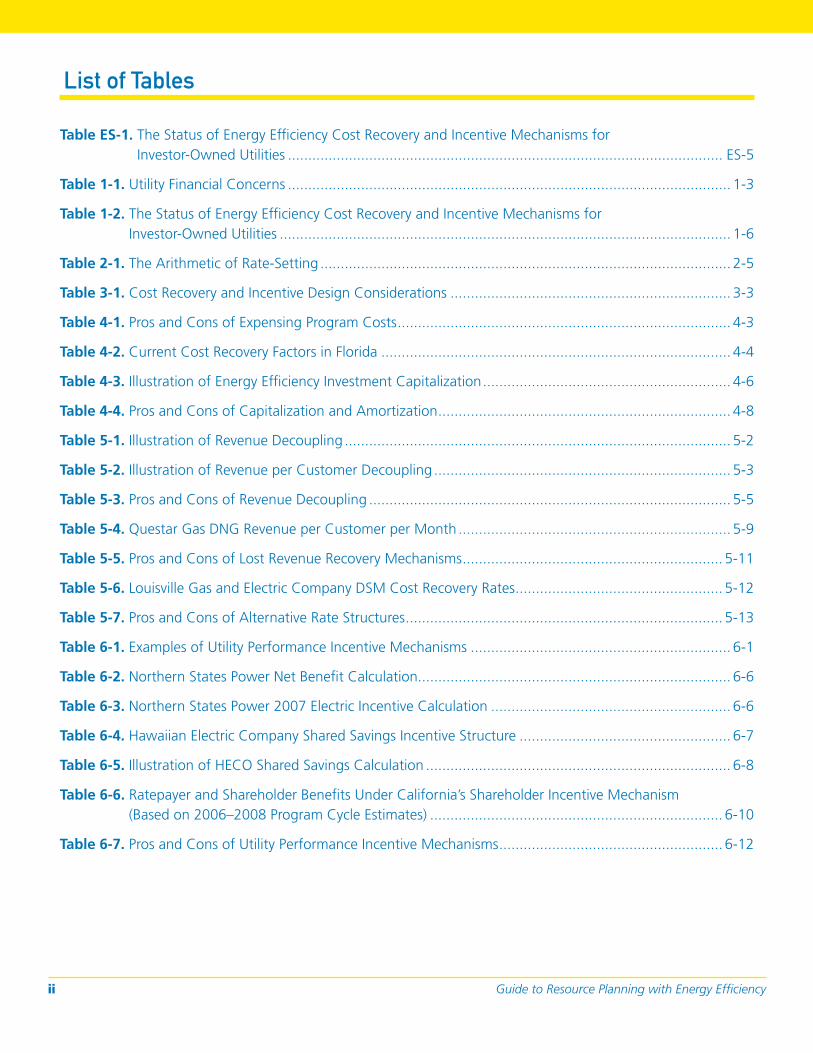
List of Tables
Table ES-1. The Status of Energy Effi ciency Cost Recovery and Incentive Mechanisms for Investor-Owned Utilities ........................................................................................................... ES-5
Table 1-2. The Status of Energy Effi ciency Cost Recovery and Incentive Mechanisms for
Table 6-6. Ratepayer and Shareholder Benefi ts Under California’s Shareholder Incentive Mechanism
Table 1-1. Utility Financial Concerns ............................................................................................................. 1-3
Investor-Owned Utilities ............................................................................................................... 1-6
Table 2-1. The Arithmetic of Rate-Setting ..................................................................................................... 2-5
Table 3-1. Cost Recovery and Incentive Design Considerations ..................................................................... 3-3
Table 4-1. Pros and Cons of Expensing Program Costs .................................................................................. 4-3
Table 4-2. Current Cost Recovery Factors in Florida ...................................................................................... 4-4
Table 4-3. Illustration of Energy Effi ciency Investment Capitalization ............................................................. 4-6
Table 4-4. Pros and Cons of Capitalization and Amortization ........................................................................ 4-8
Table 5-1. Illustration of Revenue Decoupling ............................................................................................... 5-2
Table 5-2. Illustration of Revenue per Customer Decoupling ......................................................................... 5-3
Table 5-3. Pros and Cons of Revenue Decoupling ......................................................................................... 5-5
Table 5-4. Questar Gas DNG Revenue per Customer per Month ................................................................... 5-9
Table 5-5. Pros and Cons of Lost Revenue Recovery Mechanisms ................................................................ 5-11
Table 5-6. Louisville Gas and Electric Company DSM Cost Recovery Rates................................................... 5-12
Table 5-7. Pros and Cons of Alternative Rate Structures .............................................................................. 5-13
Table 6-1. Examples of Utility Performance Incentive Mechanisms ................................................................ 6-1
Table 6-2. Northern States Power Net Benefi t Calculation............................................................................. 6-6
Table 6-3. Northern States Power 2007 Electric Incentive Calculation ........................................................... 6-6
Table 6-4. Hawaiian Electric Company Shared Savings Incentive Structure .................................................... 6-7
Table 6-5. Illustration of HECO Shared Savings Calculation ........................................................................... 6-8
(Based on 2006–2008 Program Cycle Estimates) ........................................................................ 6-10
Table 6-7. Pros and Cons of Utility Performance Incentive Mechanisms ....................................................... 6-12
Guide to Resource Planning with Energy Effi ciency ii

List of Abbreviations and Acronyms
A E
APS Arizona Public Service Company
B
BA balance adjustment
BGE Baltimore Gas & Electric
BGSS Basic Gas Supply Service
C
CCRA conservation cost recovery adjustment
CCRC conservation cost recovery charge
CET conservation enabling tariff
CIP conservation improvement program or Conservation Incentive Program
CMP Central Maine Power
CPUC California Public Utilities Commission
CUA conservation and usage adjustment
D
DBA DSM balance adjustment
DCR DSM program cost recovery
DNG distribution non-gas
DOE U.S. Department of Energy
DRLS DSM revenue from lost sales
DSM demand-side management
DSMI DSM incentive
DSMRC demand-side management recovery component
ECCR energy conservation cost recovery
EPA U.S. Environmental Protection Agency
ER earnings rate
ERAM electric rate adjustment mechanism
F
FCA fixed cost adjustment
FCM forward capacity market
FEECA Florida Energy Efficiency and Conservation Act
FPL Florida Power and Light
H
HECO Hawaiian Electric Company
I
ISO independent system operator
K
kW kilowatt
kWh kilowatt-hour
L
LG&E Louisville Gas & Electric
LRAM lost revenue adjustment mechanism
M
MW megawatt
MWh megawatt-hour
National Action Plan for Energy Effi ciency iii
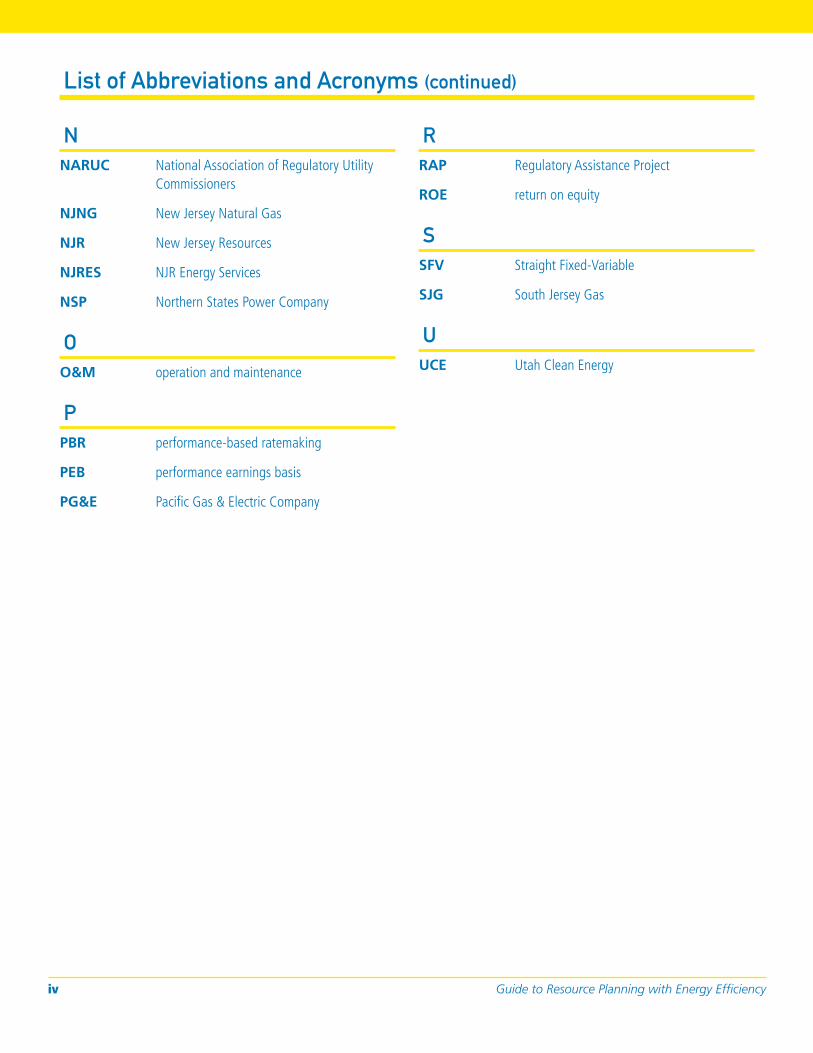
List of Abbreviations and Acronyms (continued)
N R
NARUC National Association of Regulatory Utility Commissioners
NJNG New Jersey Natural Gas
NJR New Jersey Resources
NJRES NJR Energy Services
NSP Northern States Power Company
O
RAP
ROE
Regulatory Assistance Project
return on equity
S
SFV
SJG
Straight Fixed-Variable
South Jersey Gas
U
UCE Utah Clean EnergyO&M operation and maintenance
P
PBR performance-based ratemaking
PEB performance earnings basis
PG&E Pacific Gas & Electric Company
Guide to Resource Planning with Energy Effi ciency iv
Acknowledgements
This report on Aligning Utility Incentives with Investment in Energy Effi ciency is a key product of the Year Two Work Plan for the National Action Plan for Energy Effi ciency. This work plan was developed based on feedback received from Action Plan Leadership Group members and observers during fall 2006. The work plan was further refi ned during the March 2007 Leadership Group meeting in Washington, D.C. A full list of Leadership Group members is provided in Appendix A.
In addition to direction and comment by the Action Plan Leadership Group, this Report was prepared with highly valuable input of an Advisory Group. Val Jensen of ICF International served as project manager and primary author of the Report, with assistance from Basak Uluca, under contract to the U.S. Environmental Protection Agency (EPA).
The Advisory Group members are:
• Lynn Anderson, Idaho Public Service Commission
• Jeff Burks, PNM Resources
• Sheryl Carter, Natural Resources Defense Council
• Dan Cleverdon, DC Public Service Commission
• Roger Duncan, Austin Energy
• Jim Gallagher, New York State Public Service Commission
• Marty Haught, United Cooperative Service
• Leonard Haynes, Southern Company
• Mary Healey, Connecticut Offi ce of Consumer Counsel
• Denise Jordan, Tampa Electric Company
• Don Low, Kansas Corporation Commission
• Mark McGahey, Tristate Generation and Transmission Association, Inc.
• Barrie McKay, Questar Gas Company
• Roland Risser, Pacifi c Gas & Electric
• Gene Rodrigues, Southern California Edison
• Michael Shore, Environmental Defense
• Raiford Smith, Duke Energy
• Henry Yoshimura, ISO New England Inc.
Rich Sedano of the Regulatory Assistance Project (RAP) and Alison Silverstein of Alison Silverstein Consulting provided their expertise during review and editing of the Report.
The U.S. Department of Energy (DOE) and EPA facilitate the National Action Plan for Energy Effi ciency, including this Report. Key staff include Larry Mansueti with DOE’s Offi ce of Electricity Delivery and Energy Reliability; Dan Beckley with DOE’s Offi ce of Energy Effi ciency and Renewable Energy; and Kathleen Hogan, Joe Bryson, Stacy Angel, and Katrina Pielli with EPA’s Climate Protection Partnerships Division.
Eastern Research Group, Inc., provided technical review, copyediting, graphics, and production services.
National Action Plan for Energy Effi ciency v

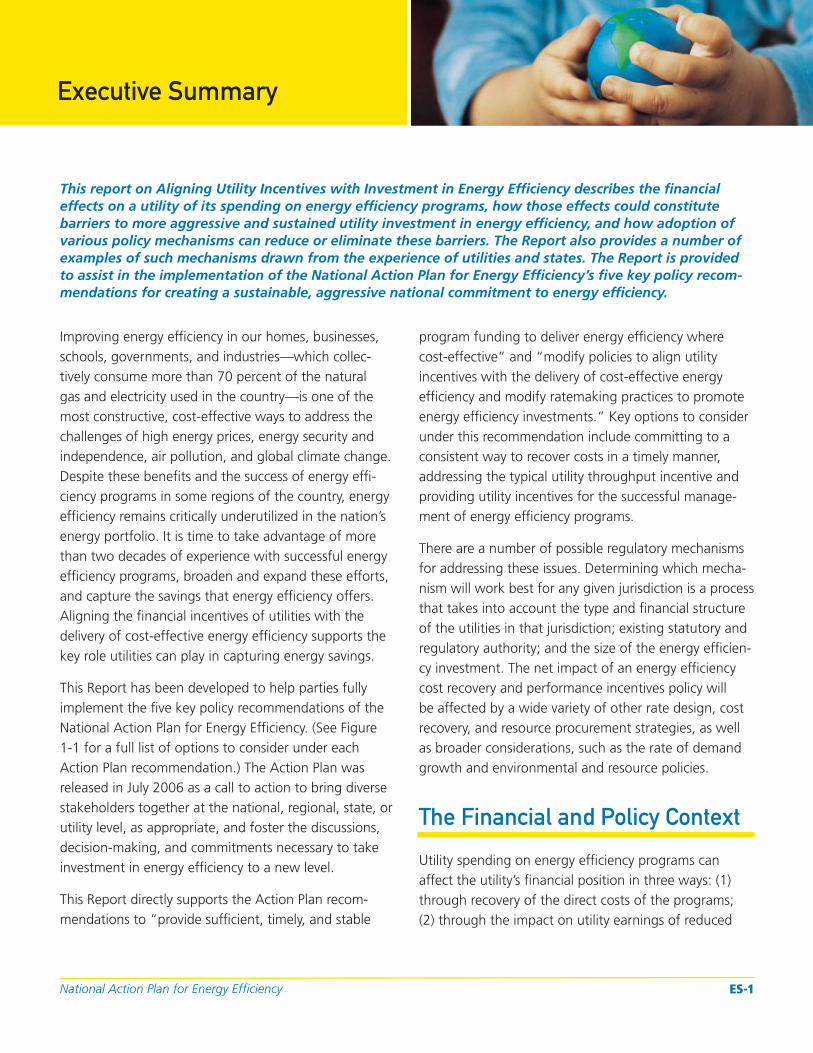
Executive Summary
This report on Aligning Utility Incentives with Investment in Energy Efficiency describes the fi nancial effects on a utility of its spending on energy efficiency programs, how those effects could constitute barriers to more aggressive and sustained utility investment in energy efficiency, and how adoption of various policy mechanisms can reduce or eliminate these barriers. The Report also provides a number of examples of such mechanisms drawn from the experience of utilities and states. The Report is provided to assist in the implementation of the National Action Plan for Energy Effi ciency’s five key policy recommendations for creating a sustainable, aggressive national commitment to energy effi ciency.
Improving energy effi ciency in our homes, businesses, schools, governments, and industries—which collectively consume more than 70 percent of the natural gas and electricity used in the country—is one of the most constructive, cost-effective ways to address the challenges of high energy prices, energy security and independence, air pollution, and global climate change. Despite these benefi ts and the success of energy effi ciency programs in some regions of the country, energy effi ciency remains critically underutilized in the nation’s energy portfolio. It is time to take advantage of more than two decades of experience with successful energy effi ciency programs, broaden and expand these efforts, and capture the savings that energy effi ciency offers. Aligning the fi nancial incentives of utilities with the delivery of cost-effective energy effi ciency supports the key role utilities can play in capturing energy savings.
This Report has been developed to help parties fully implement the fi ve key policy recommendations of the National Action Plan for Energy Effi ciency. (See Figure 1-1 for a full list of options to consider under each Action Plan recommendation.) The Action Plan was released in July 2006 as a call to action to bring diverse stakeholders together at the national, regional, state, or utility level, as appropriate, and foster the discussions, decision-making, and commitments necessary to take investment in energy effi ciency to a new level.
This Report directly supports the Action Plan recommendations to “provide suffi cient, timely, and stable
program funding to deliver energy effi ciency where cost-effective” and “modify policies to align utility incentives with the delivery of cost-effective energy effi ciency and modify ratemaking practices to promote energy effi ciency investments.” Key options to consider under this recommendation include committing to a consistent way to recover costs in a timely manner, addressing the typical utility throughput incentive and providing utility incentives for the successful management of energy effi ciency programs.
There are a number of possible regulatory mechanisms for addressing these issues. Determining which mechanism will work best for any given jurisdiction is a process that takes into account the type and fi nancial structure of the utilities in that jurisdiction; existing statutory and regulatory authority; and the size of the energy effi ciency investment. The net impact of an energy effi ciency cost recovery and performance incentives policy will be affected by a wide variety of other rate design, cost recovery, and resource procurement strategies, as well as broader considerations, such as the rate of demand growth and environmental and resource policies.
The Financial and Policy Context
Utility spending on energy effi ciency programs can affect the utility’s fi nancial position in three ways: (1) through recovery of the direct costs of the programs; (2) through the impact on utility earnings of reduced
National Action Plan for Energy Effi ciency ES-1
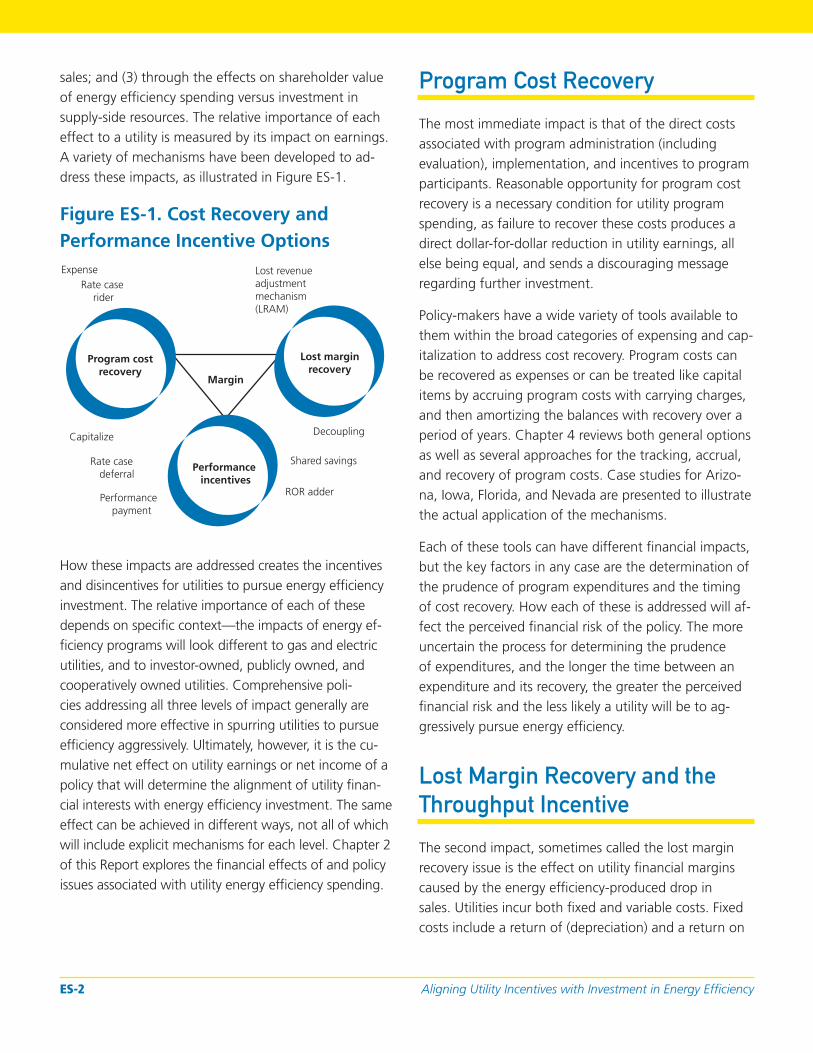
sales; and (3) through the effects on shareholder value of energy effi ciency spending versus investment in supply-side resources. The relative importance of each effect to a utility is measured by its impact on earnings. A variety of mechanisms have been developed to address these impacts, as illustrated in Figure ES-1.
Figure ES-1. Cost Recovery and Performance Incentive Options Expense Lost revenue
Rate case adjustment rider mechanism
(LRAM)
Performance incentives
Margin
Lost margin recovery
Program cost recovery
Shared savings deferral
ROR adder
Rate case
Performance payment
How these impacts are addressed creates the incentives and disincentives for utilities to pursue energy effi ciency investment. The relative importance of each of these depends on specifi c context—the impacts of energy effi ciency programs will look different to gas and electric utilities, and to investor-owned, publicly owned, and cooperatively owned utilities. Comprehensive policies addressing all three levels of impact generally are considered more effective in spurring utilities to pursue effi ciency aggressively. Ultimately, however, it is the cumulative net effect on utility earnings or net income of a policy that will determine the alignment of utility fi nancial interests with energy effi ciency investment. The same effect can be achieved in different ways, not all of which will include explicit mechanisms for each level. Chapter 2 of this Report explores the fi nancial effects of and policy issues associated with utility energy effi ciency spending.
Capitalize Decoupling
Program Cost Recovery
The most immediate impact is that of the direct costs associated with program administration (including evaluation), implementation, and incentives to program participants. Reasonable opportunity for program cost recovery is a necessary condition for utility program spending, as failure to recover these costs produces a direct dollar-for-dollar reduction in utility earnings, all else being equal, and sends a discouraging message regarding further investment.
Policy-makers have a wide variety of tools available to them within the broad categories of expensing and capitalization to address cost recovery. Program costs can be recovered as expenses or can be treated like capital items by accruing program costs with carrying charges, and then amortizing the balances with recovery over a period of years. Chapter 4 reviews both general options as well as several approaches for the tracking, accrual, and recovery of program costs. Case studies for Arizona, Iowa, Florida, and Nevada are presented to illustrate the actual application of the mechanisms.
Each of these tools can have different fi nancial impacts, but the key factors in any case are the determination of the prudence of program expenditures and the timing of cost recovery. How each of these is addressed will affect the perceived fi nancial risk of the policy. The more uncertain the process for determining the prudence of expenditures, and the longer the time between an expenditure and its recovery, the greater the perceived fi nancial risk and the less likely a utility will be to aggressively pursue energy effi ciency.
Lost Margin Recovery and the
Throughput Incentive
The second impact, sometimes called the lost margin recovery issue is the effect on utility fi nancial margins caused by the energy effi ciency-produced drop in sales. Utilities incur both fi xed and variable costs. Fixed costs include a return of (depreciation) and a return on
ES-2 Aligning Utility Incentives with Investment in Energy Effi ciency
(interest plus earnings) capital (a utility’s physical infrastructure), as well as property taxes and certain operation and maintenance (O&M) costs. These costs do not vary as a function of sales in the short-run. However, most utility rate designs attempt to recover a portion of these fi xed costs through volumetric prices—a price per kilowatt-hour or per therm. These prices are based on an estimate of sales: price = revenue requirement/ sales.1 If actual sales are either higher or lower than the level estimated when prices are set, revenues will be higher or lower. All else being equal, if an energy effi ciency program reduces sales, it reduces revenues proportionately, but fi xed costs do not change. Less revenue, therefore, means that the utility is at some risk for not recovering all of its fi xed costs. Ultimately, the drop in revenue will impact the utility’s earnings for an investor-owned utility, or net operating margin for publicly and cooperatively owned utilities.
Few energy effi ciency policy issues have generated as much debate as the issue of the impact of energy effi ciency programs on utility margins. Arguments on all sides of the lost margin issue can be compelling. Many observers would agree that signifi cant and sustained investment in energy effi ciency by utilities, beyond that required under statute or order, will not occur without implementation of some type of mechanism to ensure recovery of lost margins. Others argue that the lost margin issue cannot be treated in isolation; margin recovery is affected by a wide variety of factors, and special adjustments for energy effi ciency constitute single issue ratemaking.2
Care should be taken to ensure that two very different issues are not incorrectly treated as one. The fi rst issue is whether a utility should be compensated for the under-recovery of fi xed costs when energy effi ciency programs or events outside of the control of the utility (e.g., weather or a drop in economic activity) reduce sales below the level on which current rates are based. Lost revenue adjustment mechanisms (LRAMs) have been designed to estimate and collect the margin revenues that might be lost due to a successful energy effi ciency program. These mechanisms compensate utilities for the effect of reduced sales due to effi ciency, but they do not
change the linkage between sales and profi t. Few states currently use these mechanisms.
The second issue is whether potential lost margins should be addressed as a stand-alone matter of cost recovery or by decoupling revenues from sales—an approach that fundamentally changes the relationship between sales and revenues, and thus margins. Decoupling not only addresses lost margin recovery, but also removes the throughput incentive—the incentive for utilities to promote sales growth, which is created when fi xed costs are recovered through volumetric charges. The throughput incentive has been identifi ed by many as the primary barrier to aggressive utility investment in energy effi ciency.
Chapter 5 examines the cause of and options for recovery of lost margins, and case studies are presented for decoupling in Idaho, New Jersey, Maryland, and Utah, and for the application of a LRAM in Kentucky.
Utility Performance Incentives
The two impacts described above pertain to potential direct disincentives for utilities to engage in energy effi ciency program investment. The third impact concerns incentives for utilities to undertake such investment. Under traditional regulation, investor-owned utilities earn returns on capital invested in generation, transmission, and distribution. Unless given the opportunity to profi t from the energy effi ciency investment that is intended to substitute for this capital investment, there is a clear fi nancial incentive to prefer investment in supply-side assets, since these investments contribute to enhanced shareholder value. Providing fi nancial incentives to a utility if it performs well in delivering energy effi ciency can change that business model by making effi ciency profi table rather than merely a break-even activity.
The three major types of performance mechanisms have been most prevalent include:
• Performance target incentives.
• Shared savings incentives.
• Rate of return adders.
National Action Plan for Energy Effi ciency ES-3

Performance target incentives provide payment—often a percentage of the total program budget—for achievement of specifi c metrics, usually including savings targets. Most states providing such incentives set performance ranges; incentives are not paid unless a utility achieves some minimum fraction of proposed savings, and incentives are capped at some level above projected savings.
Shared savings mechanisms provide utilities the opportunity to share with ratepayers the net benefi ts resulting from successful implementation of energy effi ciency programs. These structures also include specifi c performance targets that tie the percentage of net savings awarded to the percentage of goal achieved. Some, but not all, shared savings mechanisms include penalty provisions requiring utilities to pay customers when minimum performance targets are not achieved.
Rate of return adders provide an increase in the return on equity (ROE) applied to capitalized energy effi ciency expenditures. This approach currently is not common as a performance incentive for several reasons. First, this mechanism requires energy effi ciency program costs to be capitalized, which relatively few utilities prefer. Second, at least as applied in several cases, the adder is not tied to performance—it simply is applied to all capitalized energy effi ciency costs as a way to broadly incent a utility for effi ciency spending. On the other hand, capitalization, in theory, places energy effi ciency on more equal fi nancial terms with supply-side investments to begin with. Thus, any adder could be viewed more as a risk-premium for investment in a regulatory asset.
The premise that utilities should be paid incentives as a condition for effective delivery of energy effi ciency programs is not universally accepted. Some argue that utilities are obligated to pursue energy effi ciency if that is the policy of a state, and that performance incentives require customers to pay utilities to do something that they should do anyway. Others have argued more directly that the basic business of a utility is to deliver energy, and that providing fi nancial incentives over-andabove what could be earned by effi cient management of the supply business simply raises the cost of service to all customers and distorts management behavior.
Chapter 6 reviews these mechanisms in greater detail and provides case studies drawn from Massachusetts, Minnesota, Hawaii, and California.
Table ES-1 summarizes the current level of state activity with regard to the fi nancial mechanisms describe above.
Understanding Objectives—
Developing Policy Approaches
That Fit
The overarching goal in every jurisdiction that considers an energy effi ciency investment policy is to generate and capture substantial net economic benefi ts. Achieving this goal requires aligning utility fi nancial interests with investment in energy effi ciency. The right combination of cost recovery and performance incentive mechanisms to support this alignment requires a balancing of a variety of more specifi c objectives common to the ratemaking process. Chapter 3 reviews how these objectives might infl uence design of a cost recovery and performance incentive policy, and highlights elements of the policy context that will affect policy design. Each of these objectives are not given equal weight by policy-makers, but most are given at least some consideration in virtually every discussion of cost recovery and performance incentives.
• Strike an Appropriate Balance of Risk/Reward Between Utilities/Customers. If a mechanism is well-designed and implemented, customer benefi ts will be large enough to allow sharing some of this benefi t as a way to reduce utility risk and strengthen institutional commitment; all parties will be better off than if no investment had been made.
• Promote Stabilization of Customer Rates and Bills. While it is prudent to explore policy designs that, among available options, minimize potential rate volatility, the pursuit of rate stability should be balanced against the broader interest of lowering the overall cost of providing electricity and natural gas.
• Stabilize Utility Revenues. Even if cost recovery policy covers program costs, fi xed cost recovery and performance incentives, how this recovery takes
ES-4 Aligning Utility Incentives with Investment in Energy Effi ciency
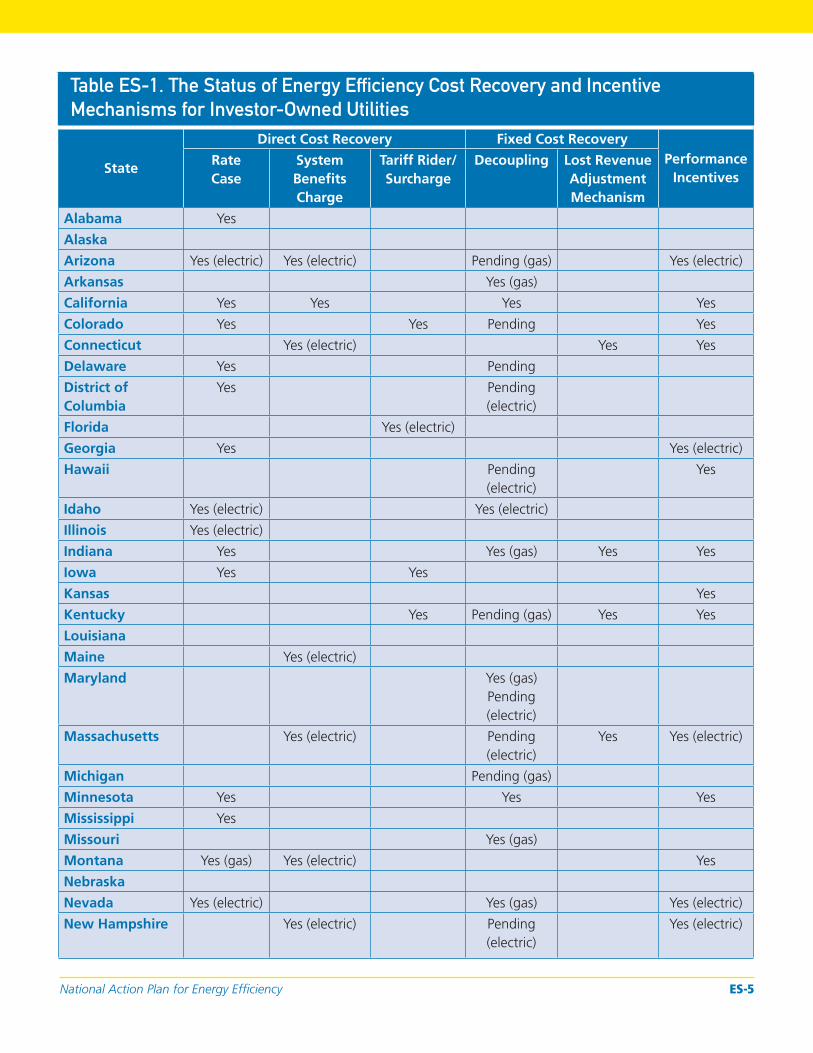
Table ES-1. The Status of Energy Efficiency Cost Recovery and Incentive
Mechanisms for Investor-Owned Utilities
State
Direct Cost Recovery Fixed Cost Recovery Performance
Incentives Rate Case
System Benefi ts Charge
Tariff Rider/ Surcharge
Decoupling Lost Revenue Adjustment Mechanism
Alabama Yes
Alaska
Arizona Yes (electric) Yes (electric) Pending (gas) Yes (electric)
Arkansas Yes (gas)
California Yes Yes Yes Yes
Colorado Yes Yes Pending Yes
Connecticut Yes (electric) Yes Yes
Delaware Yes Pending
District of Columbia
Yes Pending (electric)
Florida Yes (electric)
Georgia Yes Yes (electric)
Hawaii Pending (electric)
Yes
Idaho Yes (electric) Yes (electric)
Illinois Yes (electric)
Indiana Yes Yes (gas) Yes Yes
Iowa Yes Yes
Kansas Yes
Kentucky Yes Pending (gas) Yes Yes
Louisiana
Maine Yes (electric)
Maryland Yes (gas) Pending (electric)
Massachusetts Yes (electric) Pending (electric)
Yes Yes (electric)
Michigan Pending (gas)
Minnesota Yes Yes Yes
Mississippi Yes
Missouri Yes (gas)
Montana Yes (gas) Yes (electric) Yes
Nebraska
Nevada Yes (electric) Yes (gas) Yes (electric)
New Hampshire Yes (electric) Pending (electric)
Yes (electric)
National Action Plan for Energy Effi ciency ES-5
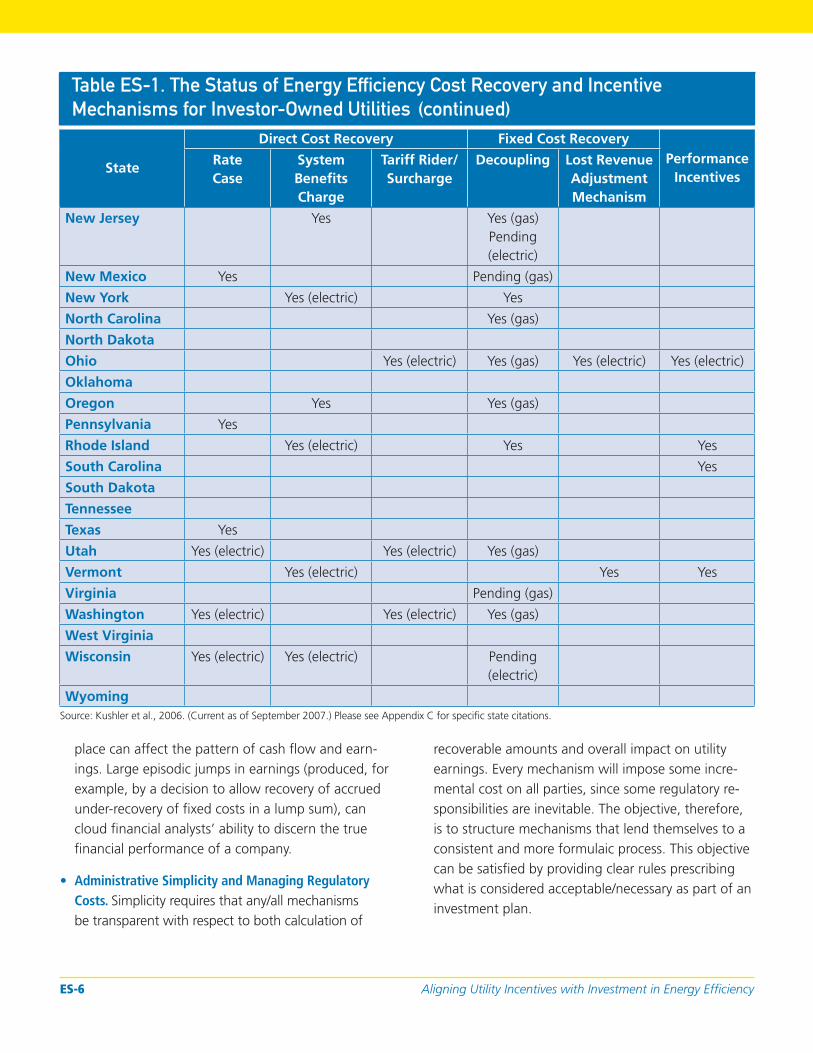
Table ES-1. The Status of Energy Efficiency Cost Recovery and Incentive
Mechanisms for Investor-Owned Utilities
State
Direct Cost Recovery Fixed Cost Recovery Performance
Incentives Rate Case
System Benefi ts Charge
Tariff Rider/ Surcharge
Decoupling Lost Revenue Adjustment Mechanism
New Jersey Yes Yes (gas) Pending (electric)
New Mexico Yes Pending (gas)
New York Yes (electric) Yes
North Carolina Yes (gas)
North Dakota
Ohio Yes (electric) Yes (gas) Yes (electric) Yes (electric)
Oklahoma
Oregon Yes Yes (gas)
Pennsylvania Yes
Rhode Island Yes (electric) Yes Yes
South Carolina Yes
South Dakota
Tennessee
Texas Yes
Utah Yes (electric) Yes (electric) Yes (gas)
Vermont Yes (electric) Yes Yes
Virginia Pending (gas)
Washington Yes (electric) Yes (electric) Yes (gas)
West Virginia
Wisconsin Yes (electric) Yes (electric) Pending (electric)
Wyoming
(continued)
Source: Kushler et al., 2006. (Current as of September 2007.) Please see Appendix C for specifi c state citations.
place can affect the pattern of cash fl ow and earnings. Large episodic jumps in earnings (produced, for example, by a decision to allow recovery of accrued under-recovery of fi xed costs in a lump sum), can cloud fi nancial analysts’ ability to discern the true fi nancial performance of a company.
• Administrative Simplicity and Managing Regulatory Costs. Simplicity requires that any/all mechanisms be transparent with respect to both calculation of
recoverable amounts and overall impact on utility earnings. Every mechanism will impose some incremental cost on all parties, since some regulatory responsibilities are inevitable. The objective, therefore, is to structure mechanisms that lend themselves to a consistent and more formulaic process. This objective can be satisfi ed by providing clear rules prescribing what is considered acceptable/necessary as part of an investment plan.
ES-6 Aligning Utility Incentives with Investment in Energy Effi ciency
Finding the right policy balance hinges on a wide range of factors that can infl uence how a cost recovery and performance incentive measure will actually work. These factors will include: industry structure (gas or electric utility, public or investor-owned, restructured or bundled); regulatory structure and process (types of test year, current rate design policies); and utility operating environment (demand growth and volatility, utility cost and fi nancial structure, structure of the energy effi ciency portfolio). Given the complexity of many of these issues, most states defer to state utility regulators to fashion specifi c cost recovery and performance incentive mechanism(s).
Emerging Models
Although the details of the policies and mechanisms for addressing the fi nancial impacts of energy effi ciency programs continue to evolve in jurisdictions across the country, the basic classes of mechanisms have been understood, applied, and debated for more than two decades. Most jurisdictions currently considering policies to remove fi nancial disincentives to utility investment in energy effi ciency are considering one or more of the mechanisms described above. Still, the persistent debate over recovery of lost margins and performance incentives in particular creates an interest in new approaches.
In April 2007, Duke Energy proposed what is arguably the most sweeping alternative to traditional cost recovery, margin recovery and performance incentive approaches since the 1980s. Offered in conjunction with an energy effi ciency portfolio in North Carolina, Duke’s Energy Effi ciency Rider encapsulates program cost recovery, recovery of lost margins, and shareholder incentives into one conceptually simple mechanism tied to the utility’s avoided cost. The approach is based on the notion that, if energy effi ciency is to be viewed from the utility’s perspective as equivalent to a supply resource, the utility should be compensated for its investment in energy effi ciency by an amount roughly equal to what it would otherwise spend to build the new capacity that is to be avoided. The Duke proposal would authorize the company, “to recover the amortization of and a return on 90 percent of the costs avoided by producing save-a-watts.”
The proposal clearly represents an innovation in thinking regarding elimination of fi nancial disincentives for utilities, and has intuitive appeal for its conceptual simplicity. The Duke proposal does represent a distinct departure from cost recovery and shareholder incentives convention. What is a simple and compelling concept is embedded in a formal mechanism that is quite complex, and the mechanism will likely engender substantial debate.
A second emerging model is represented by the ISO New England’s capacity auction process. This process allows demand-side resources to be bid into an auction alongside supply-side resources, and utilities and third-party energy effi ciency providers are allowed to participate in the auction with energy effi ciency programs. Winning bids receive a revenue stream that could, under certain circumstances, be used to offset direct program costs or lost margins, or could provide a source of performance incentives. The treatment of revenues received from the auction by a utility, however, is subject to allocation by its state utility commission(s), and the traditional approach to the treatment of off-system revenues is to credit them against jurisdictional revenue requirements. Therefore, the capability of this model to address the impacts described above depends largely on state regulatory policy. Whether this model ultimately is transferable to other areas of the country depends greatly on how power markets are structured in these areas.
Final Thoughts
The history of utility energy effi ciency investment is rich with examples of how state legislatures, regulatory commissions, and the governing bodies of publicly and cooperatively owned utilities have explored their cost recovery policy options. As these options are reconsidered and reconfi gured in light of the trend toward higher utility investment in energy effi ciency, this experience yields several lessons with respect to process.
• Set cost recovery and incentive policy based on the direction of the market’s evolution. The rapid development of technology, the likely integration of energy effi ciency and demand response, continuing evolution of utility industry structure, the likelihood of broader
National Action Plan for Energy Effi ciency ES-7

action on climate change, and a wide range of other uncertainties argue for cost recovery and incentive policies that can work with intended effect under a variety of possible futures.
• Apply cost recovery mechanisms and utility performance incentives in a broad policy context. The policies that affect utility investment in energy effi ciency are many and varied and each will control, to some extent, the nature of fi nancial incentives and disincentives that a utility faces. Policies that could impact the design of cost recovery and incentive mechanisms include those having to do with carbon emissions reduction; non-CO2 environmental control, such as NOX cap-and-trade initiatives; rate design; resource portfolio standards; and the development of more liquid wholesale markets for load reduction programs.
• Test prospective policies. Complex mechanisms that have many moving parts cannot easily be understood unless the performance of the mechanisms is simulated under a wide range of conditions. This is particularly true of mechanisms that rely on projections of avoided costs, prices, or program impacts. Simulation of impacts using fi nancial modeling and/ or use of targeted pilots can be effective tools to test prospective policies.
• Policy rules must be clear. There is a clear link between the risk a utility perceives in recovering its costs, and disincentives to invest in energy effi ciency. This risk is mitigated in part by having cost recovery and incentive mechanisms in place, but the effi cacy of these mechanisms depends very much on the rules governing their application. While state regulatory commissions often fashion the details of cost recovery, lost margin recovery, and performance incentive mechanisms, the scope of their actions is governed by legislation. In some states, signifi cant expenditures on energy effi ciency by utilities are precluded by lack of clarity regarding regulators’ authority to address one or more of the fi nancial impacts of these expenditures. Legislation specifi cally authorizing or requiring various mechanisms creates clarity for parties and minimizes risk.
• Collaboration has value. The most successful and sustainable cost recovery and incentive policies are those that are based on a consultative process that, in general, includes broad agreement on the aims of the energy effi ciency investment policy.
• Flexibility is essential. Most of the states that have had signifi cant effi ciency investment and cost recovery policies in place for more than a few years have found compelling reasons to modify these policies at some point. These changes refl ect an institutional capacity to acknowledge weaknesses in existing approaches and broader contextual changes that render prior approaches ineffective. Policy stability is desirable, and policy changes that have signifi cant impacts on earnings or prices can be particularly challenging. However, it is the stability of impact rather than adherence to a particular model that is important in addressing fi nancial disincentives to invest.
• Culture matters. One important test of a cost recovery and incentives policy is its impact on corporate culture. A policy providing cost recovery is an essential fi rst step in removing fi nancial disincentives associated with energy effi ciency investment, but it will not change a utility’s core business model. Earnings are still created by investing in supply-side assets and selling more energy. Cost recovery plus a policy enabling recovery of lost margins might make a utility indifferent to selling or saving a kilowatt-hour or therm, but still will not make the business case for aggressive pursuit of energy effi ciency. A full complement of cost recovery, lost margin recovery, and performance incentive mechanisms can change this model, and likely will be needed to secure sustainable funding for energy effi ciency at levels necessary to fundamentally change resource mix.
Notes
1. Revenue requirement refers to the sum of the costs that a utility is authorized to recover through rates.
2. For example, see the National Association of State Utility Consumer Advocates’ Resolution on Energy Conservation and Decoupling, June 12, 2007.
ES-8 Aligning Utility Incentives with Investment in Energy Effi ciency
1994
1995
1996
1997
1998
1999
2000
2001
2002
2003
2004
2005
2006
1: Introduction
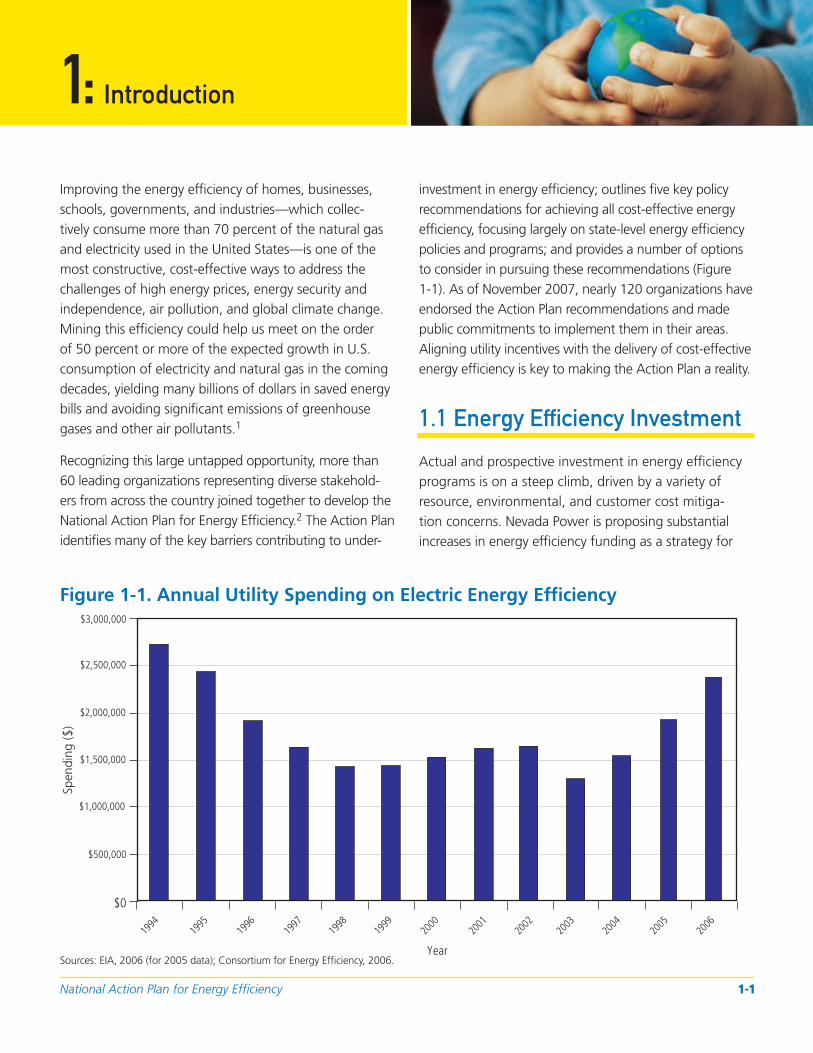
Improving the energy efficiency of homes, businesses, schools, governments, and industries—which collectively consume more than 70 percent of the natural gas and electricity used in the United States—is one of the most constructive, cost-effective ways to address the challenges of high energy prices, energy security and independence, air pollution, and global climate change. Mining this efficiency could help us meet on the order of 50 percent or more of the expected growth in U.S. consumption of electricity and natural gas in the coming decades, yielding many billions of dollars in saved energy bills and avoiding significant emissions of greenhouse gases and other air pollutants.1
Recognizing this large untapped opportunity, more than 60 leading organizations representing diverse stakeholders from across the country joined together to develop the National Action Plan for Energy Efficiency.2 The Action Plan identifies many of the key barriers contributing to under-
investment in energy efficiency; outlines five key policy recommendations for achieving all cost-effective energy efficiency, focusing largely on state-level energy efficiency policies and programs; and provides a number of options to consider in pursuing these recommendations (Figure 1-1). As of November 2007, nearly 120 organizations have endorsed the Action Plan recommendations and made public commitments to implement them in their areas. Aligning utility incentives with the delivery of cost-effective energy efficiency is key to making the Action Plan a reality.
1.1 Energy Efficiency Investment
Actual and prospective investment in energy efficiency programs is on a steep climb, driven by a variety of resource, environmental, and customer cost mitigation concerns. Nevada Power is proposing substantial increases in energy efficiency funding as a strategy for
Figure 1-1. Annual Utility Spending on Electric Energy Efficiency $3,000,000
$2,500,000
$2,000,000
$1,500,000
$1,000,000
$500,000
$0
Year
Spen
ding
($)
Sources: EIA, 2006 (for 2005 data); Consortium for Energy Efficiency, 2006.
National Action Plan for Energy Efficiency 1-1
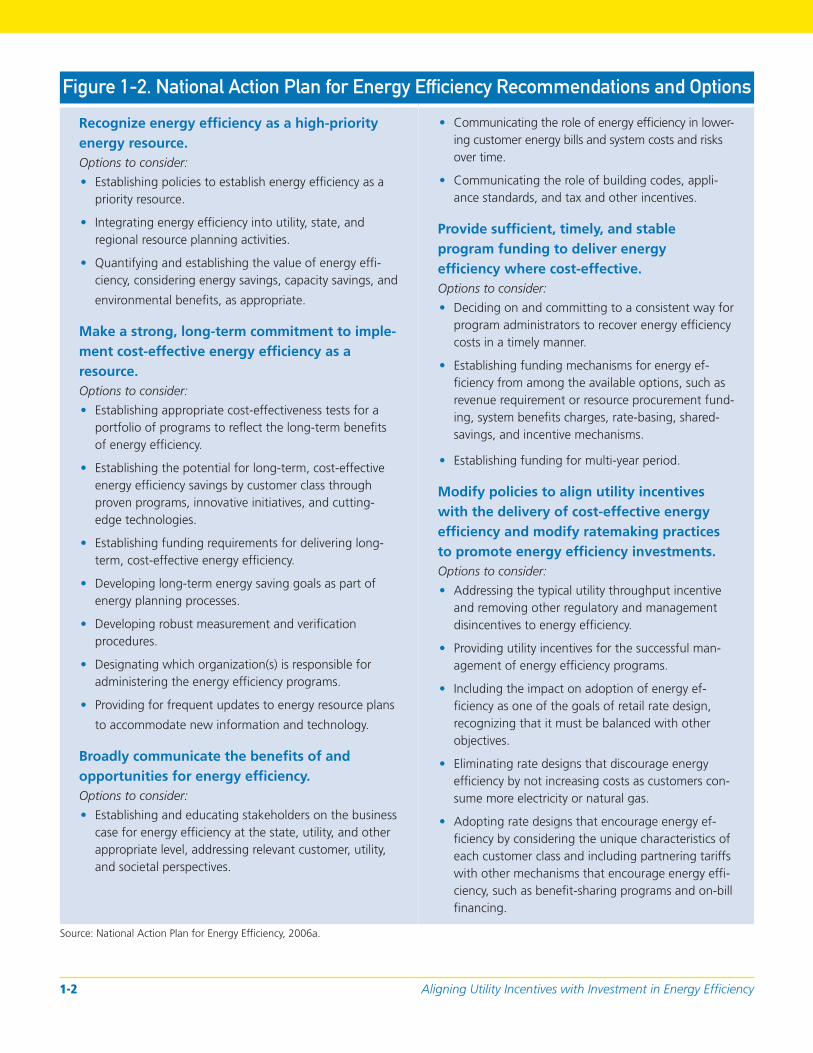
Figure 1-2. National Action Plan for Energy Efficiency Recommendations and Options
Recognize energy efficiency as a high-priority energy resource. Options to consider:
Establishing policies to establish energy efficiency as a • priority resource.
Integrating energy efficiency into utility, state, and • regional resource planning activities.
Quantifying and establishing the value of energy effi• ciency, considering energy savings, capacity savings, and
environmental benefits, as appropriate.
Make a strong, long-term commitment to implement cost-effective energy efficiency as a resource. Options to consider:
Establishing appropriate cost-effectiveness tests for a • portfolio of programs to reflect the long-term benefits of energy efficiency.
Establishing the potential for long-term, cost-effective • energy efficiency savings by customer class through proven programs, innovative initiatives, and cutting-edge technologies.
Establishing funding requirements for delivering long-• term, cost-effective energy efficiency.
Developing long-term energy saving goals as part of• energy planning processes.
Developing robust measurement and verification • procedures.
Designating which organization(s) is responsible for • administering the energy efficiency programs.
Providing for frequent updates to energy resource plans •
to accommodate new information and technology.
Broadly communicate the benefits of and opportunities for energy efficiency. Options to consider:
Establishing and educating stakeholders on the business• case for energy efficiency at the state, utility, and other appropriate level, addressing relevant customer, utility, and societal perspectives.
Communicating the role of energy efficiency in lower• ing customer energy bills and system costs and risks over time.
Communicating the role of building codes, appli• ance standards, and tax and other incentives.
Provide sufficient, timely, and stable program funding to deliver energy efficiency where cost-effective. Options to consider:
Deciding on and committing to a consistent way for• program administrators to recover energy efficiency costs in a timely manner.
Establishing funding mechanisms for energy ef• ficiency from among the available options, such as revenue requirement or resource procurement funding, system benefits charges, rate-basing, shared-savings, and incentive mechanisms.
Establishing funding for multi-year period.•
Modify policies to align utility incentives with the delivery of cost-effective energy efficiency and modify ratemaking practices to promote energy efficiency investments. Options to consider:
Addressing the typical utility throughput incentive • and removing other regulatory and management disincentives to energy efficiency.
Providing utility incentives for the successful man• agement of energy efficiency programs.
Including the impact on adoption of energy ef• ficiency as one of the goals of retail rate design, recognizing that it must be balanced with other objectives.
Eliminating rate designs that discourage energy• efficiency by not increasing costs as customers consume more electricity or natural gas.
Adopting rate designs that encourage energy ef• ficiency by considering the unique characteristics of each customer class and including partnering tariffs with other mechanisms that encourage energy efficiency, such as benefit-sharing programs and on-bill financing.
Source: National Action Plan for Energy Efficiency, 2006a.
Aligning Utility Incentives with Investment in Energy Efficiency 1-2
compliance with the state’s aggressive resource portfolio standard. Funding in California has roughly doubled since 2004 as utilities supplement public charge monies with “procurement funds.”3 Michigan and Illinois have been debating significant efficiency funding requirements, and the Texas legislature has doubled the percentage of load growth that must be offset by energy efficiency, implying a significant increase in efficiency program funding. Integrated resource planning cases and various regulatory settlements from Delaware to North Carolina and Missouri are producing new investment in energy efficiency. Data recently compiled by the Consortium for Energy Efficiency (2006) show total estimated energy efficiency spending by electric utilities exceeding $2.3 billion in 2006, on par with peak energy efficiency spending in the mid-1990s. With the rise in funding, there is broad interest across the country in refashioning regulatory policies to eliminate financial disincentives and barriers to utility investment in energy efficiency.
1.1.1 Understanding Financial Disincentives to Utility Investment
Not unexpectedly, the rise in interest in energy efficiency investment has produced a resurgent interest in how the costs associated with energy efficiency programs are recovered, and whether, in the light of what many believe to be compelling reasons for greater program
spending, utilities have sufficient incentive to aggressively pursue these investments.
Energy efficiency programs can have several financial impacts on utilities that create disincentives for utilities to promote energy efficiency more aggressively. Policy-makers have developed several mechanisms intended to minimize or eliminate these impacts.
Utility concerns for these three impacts have had a profound effect on energy efficiency investment policy at the corporate and state level for over 20 years, and the concerns continue to create tension as utilities are called upon to boost energy efficiency spending.
Although the nature of today’s cost recovery and incentives discussion may be reminiscent of a similar discussion almost two decades ago, the context in which this discussion is taking place is very different. Not only have parties gained valuable experience related to the use of various cost recovery and incentive mechanisms, but the policy landscape has also been reshaped fundamentally.
Industry Structure
The past two decades have witnessed significant industry reorganization in both wholesale and retail power and natural gas markets. Investor-owned electric utilities, particularly in the Northeast and sections of
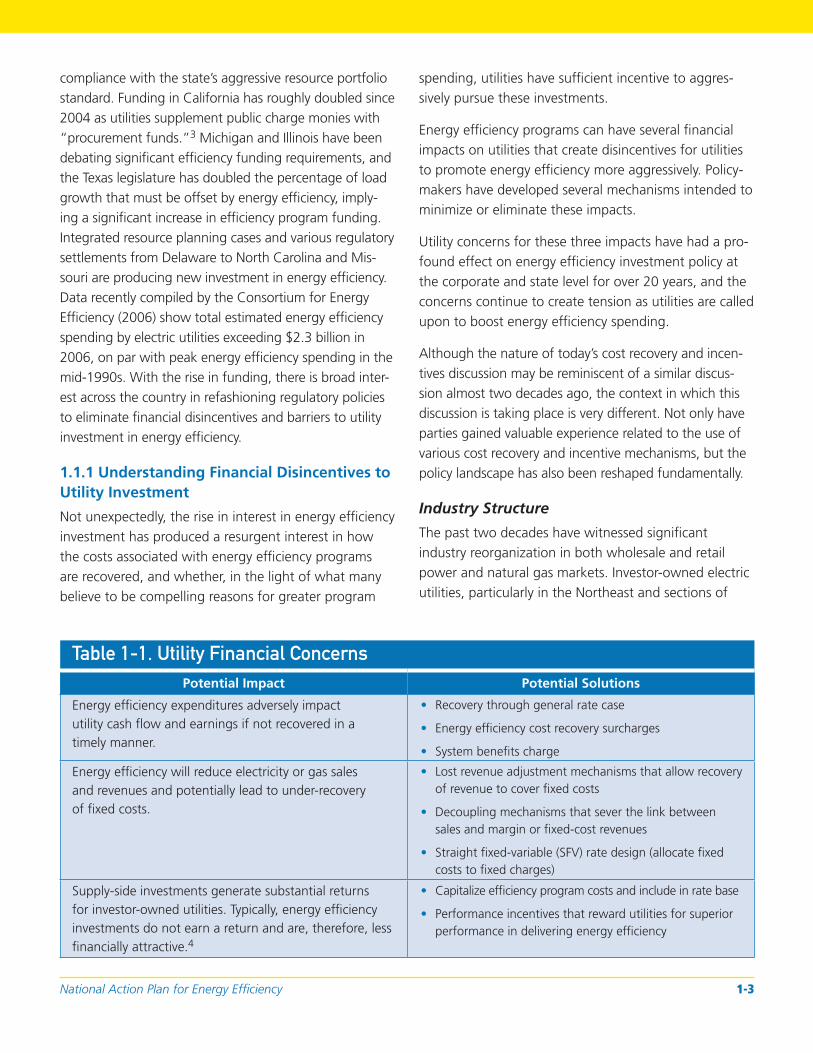
Table 1-1. Utility Financial Concerns Potential Impact Potential Solutions
Energy efficiency expenditures adversely impact utility cash flow and earnings if not recovered in a timely manner.
• Recovery through general rate case
• Energy efficiency cost recovery surcharges
• System benefits charge
Energy efficiency will reduce electricity or gas sales and revenues and potentially lead to under-recovery of fixed costs.
• Lost revenue adjustment mechanisms that allow recovery of revenue to cover fixed costs
• Decoupling mechanisms that sever the link between sales and margin or fixed-cost revenues
• Straight fixed-variable (SFV) rate design (allocate fixed costs to fixed charges)
Supply-side investments generate substantial returns for investor-owned utilities. Typically, energy efficiency investments do not earn a return and are, therefore, less financially attractive.4
• Capitalize efficiency program costs and include in rate base
• Performance incentives that reward utilities for superior performance in delivering energy efficiency
National Action Plan for Energy Efficiency 1-3
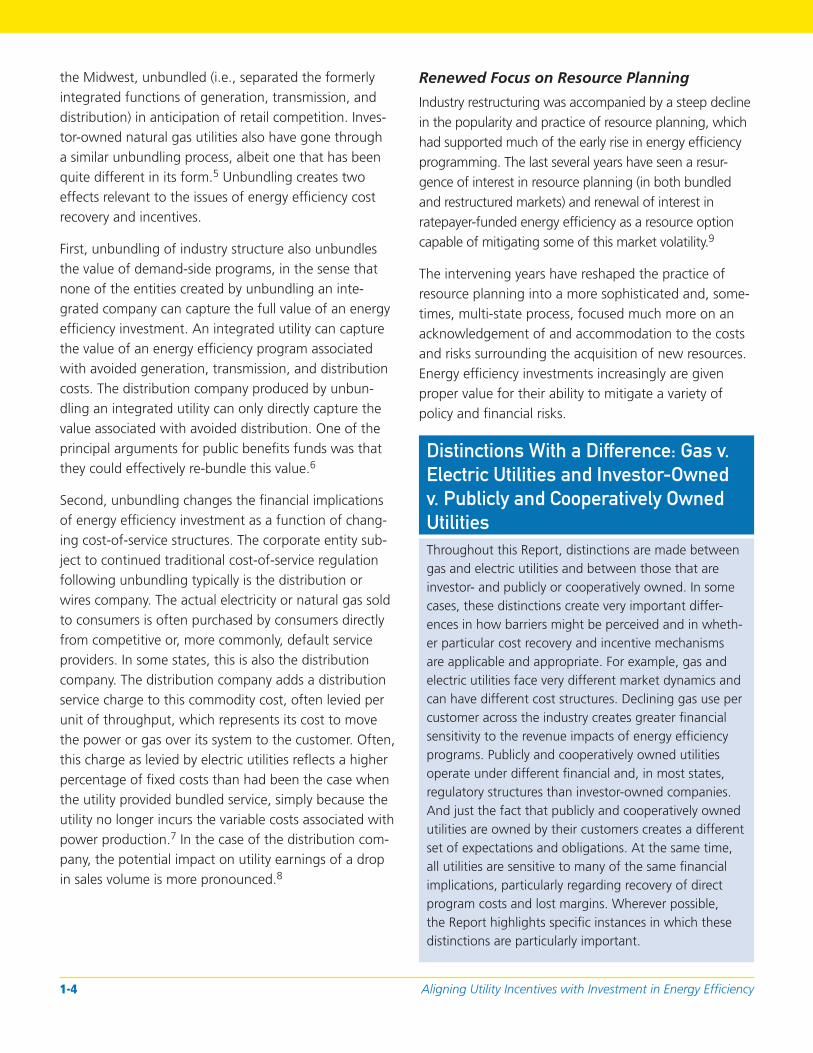
the Midwest, unbundled (i.e., separated the formerly integrated functions of generation, transmission, and distribution) in anticipation of retail competition. Investor-owned natural gas utilities also have gone through a similar unbundling process, albeit one that has been quite different in its form.5 Unbundling creates two effects relevant to the issues of energy efficiency cost recovery and incentives.
First, unbundling of industry structure also unbundles the value of demand-side programs, in the sense that none of the entities created by unbundling an integrated company can capture the full value of an energy efficiency investment. An integrated utility can capture the value of an energy efficiency program associated with avoided generation, transmission, and distribution costs. The distribution company produced by unbundling an integrated utility can only directly capture the value associated with avoided distribution. One of the principal arguments for public benefits funds was that they could effectively re-bundle this value.6
Second, unbundling changes the financial implications of energy efficiency investment as a function of changing cost-of-service structures. The corporate entity subject to continued traditional cost-of-service regulation following unbundling typically is the distribution or wires company. The actual electricity or natural gas sold to consumers is often purchased by consumers directly from competitive or, more commonly, default service providers. In some states, this is also the distribution company. The distribution company adds a distribution service charge to this commodity cost, often levied per unit of throughput, which represents its cost to move the power or gas over its system to the customer. Often, this charge as levied by electric utilities reflects a higher percentage of fixed costs than had been the case when the utility provided bundled service, simply because the utility no longer incurs the variable costs associated with power production.7 In the case of the distribution company, the potential impact on utility earnings of a drop in sales volume is more pronounced.8
Renewed Focus on Resource Planning
Industry restructuring was accompanied by a steep decline in the popularity and practice of resource planning, which had supported much of the early rise in energy efficiency programming. The last several years have seen a resurgence of interest in resource planning (in both bundled and restructured markets) and renewal of interest in ratepayer-funded energy efficiency as a resource option capable of mitigating some of this market volatility.9
The intervening years have reshaped the practice of resource planning into a more sophisticated and, sometimes, multi-state process, focused much more on an acknowledgement of and accommodation to the costs and risks surrounding the acquisition of new resources. Energy efficiency investments increasingly are given proper value for their ability to mitigate a variety of policy and financial risks.
Distinctions With a Difference: Gas v. Electric Utilities and Investor-Owned v. Publicly and Cooperatively Owned Utilities Throughout this Report, distinctions are made between gas and electric utilities and between those that are investor- and publicly or cooperatively owned. In some cases, these distinctions create very important differences in how barriers might be perceived and in whether particular cost recovery and incentive mechanisms are applicable and appropriate. For example, gas and electric utilities face very different market dynamics and can have different cost structures. Declining gas use per customer across the industry creates greater financial sensitivity to the revenue impacts of energy efficiency programs. Publicly and cooperatively owned utilities operate under different financial and, in most states, regulatory structures than investor-owned companies. And just the fact that publicly and cooperatively owned utilities are owned by their customers creates a different set of expectations and obligations. At the same time, all utilities are sensitive to many of the same financial implications, particularly regarding recovery of direct program costs and lost margins. Wherever possible, the Report highlights specific instances in which these distinctions are particularly important.
Aligning Utility Incentives with Investment in Energy Efficiency 1-4

Rising Commodity Costs and Flattening Sales
The run-up in natural gas prices over the past several years has made the case for gas utility implementation of energy effi ciency programs more compelling as a strategy for helping manage customer energy costs. However, where once these programs were implemented in at least a modestly growing gas market, effi ciency programs are now combined with fl at or declining use per customer, making recovery of program costs and lost margins a more urgent matter.
Acknowledgement of Climate Risk
There is a growing recognition among state policy-makers and electric utilities that action is required to mitigate the impacts of climate change and/or hedge against the likelihood of costly climate policies. Energy effi ciency investments are valued for their ability to reduce carbon emissions at low cost by reducing the use of existing high-carbon emitting sources and the deferral of the need for new fossil capacity. Some of the largest electric utilities in the country are forming their business strategies around the likelihood of action on climate policy, and making energy effi ciency pivotal in these strategies. Although the environmental attributes of energy effi ciency have long been emphasized in arguing the business case for energy effi ciency investment, particularly in the electric industry, today that argument appears largely to be over, and attention is shifting to the practical elements of policies that can support scaled-up investment in effi ciency.10
As utilities increasingly turn to energy efficiency as a key resource, they will look more closely at the links between efficiency, sales, and financial margins, sharpening the question of whether ratemaking policies that reward increases in sales are sustainable. Perhaps less obvious, as policies are implemented to reduce carbon emissions, they likely will create new pathways for capturing the fi nancial value of efficiency that, in turn, will require policy-makers to consider whether current approaches to cost recovery and incentives are aligned with these broader policies.
Advancing Technology
The technology and therefore, the practice of energy effi ciency, appear on the edge of signifi cant
transformation, particularly in the electric utility industry. The formerly bright line between energy effi ciency and demand response11 is blurring with the growing adoption of advanced metering technologies, innovative pricing regimes, and smart appliances.12 Emerging technologies enable utilities to more precisely target valuable load reductions, and offer consumers prices that more closely represent the time-varying costs to provide energy. Ultimately, when consumers can receive and act on time- and location-specifi c energy prices, this will affect the types of energy effi ciency measures possible and needed, and effi ciency program design and funding will change accordingly. With respect to the immediate issues of cost recovery and incentives, the incorporation of increasing amounts of demand response in utility resource portfolios can change the fi nancial implications of these portfolios, as programs targeted at peak demand reduction as opposed to energy consumption reduction can have a substantially different impact on the recovery of fi xed costs.13
1.1.2 Current Status
The answer to “what has changed?” then, is that the rationale for investment in effi ciency has been rethought, refocused, and strengthened, with ratepayer funding rising to levels eclipsing those of the late 1980s/ early 1990s. And as funding rises, the need to address and resolve the issues surrounding energy effi ciency program cost recovery and performance incentives take on greater importance and urgency. At the same time, many of the utilities being asked to make this investment are structured differently today than two decades ago during the last effi ciency investment boom, so today’s effi ciency initiatives will have different fi nancial impacts on the utility. Table 1-2 presents a best estimate of the current status of energy effi ciency cost recovery and utility performance incentive activity across the country. Where a cell reads “Yes” without reference to gas or electric, the policy applies to both gas and electric utilities.
Table 1-2 reveals that many states have implemented policies that support cost recovery and/or performance incentives to some extent. Even those states that are not shown as having a specifi c program cost recovery policy
National Action Plan for Energy Effi ciency 1-5
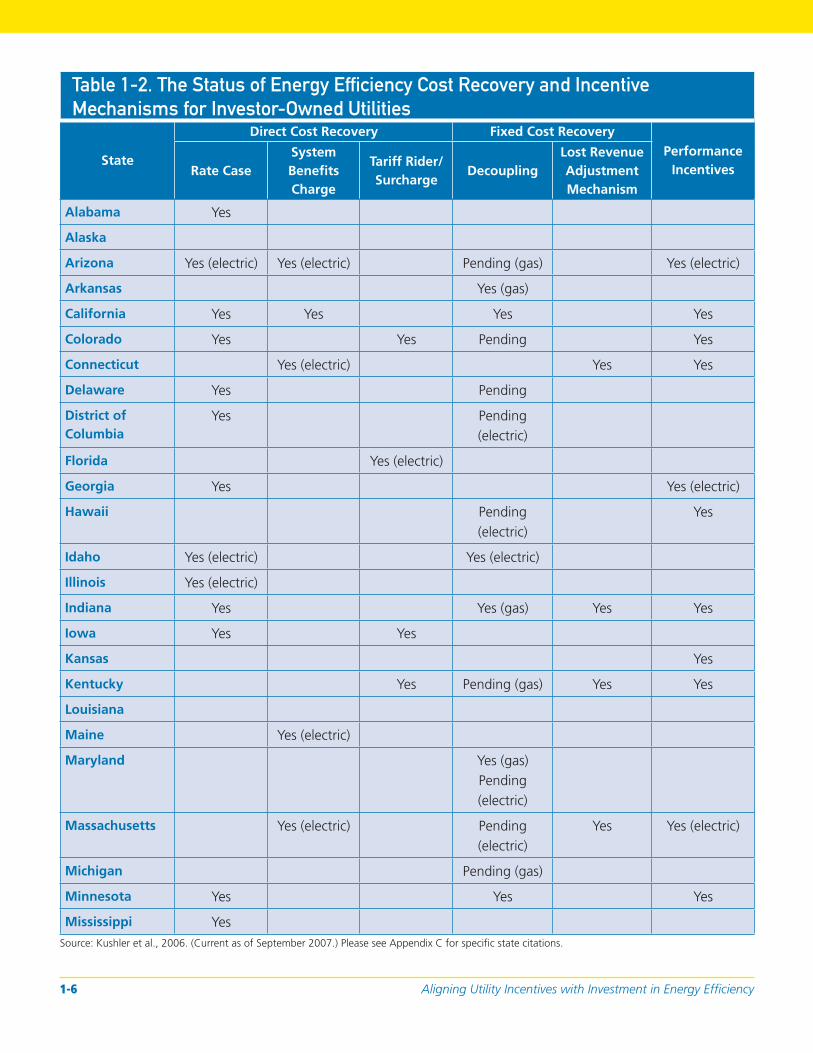
Table 1-2. The Status of Energy Efficiency Cost Recovery and Incentive
Mechanisms for Investor-Owned Utilities
State
Direct Cost Recovery Fixed Cost Recovery Performance
IncentivesRate Case System Benefi ts Charge
Tariff Rider/ Surcharge
Decoupling Lost Revenue Adjustment Mechanism
Alabama Yes
Alaska
Arizona Yes (electric) Yes (electric) Pending (gas) Yes (electric)
Arkansas Yes (gas)
California Yes Yes Yes Yes
Colorado Yes Yes Pending Yes
Connecticut Yes (electric) Yes Yes
Delaware Yes Pending
District of Columbia
Yes Pending (electric)
Florida Yes (electric)
Georgia Yes Yes (electric)
Hawaii Pending (electric)
Yes
Idaho Yes (electric) Yes (electric)
Illinois Yes (electric)
Indiana Yes Yes (gas) Yes Yes
Iowa Yes Yes
Kansas Yes
Kentucky Yes Pending (gas) Yes Yes
Louisiana
Maine Yes (electric)
Maryland Yes (gas) Pending (electric)
Massachusetts Yes (electric) Pending (electric)
Yes Yes (electric)
Michigan Pending (gas)
Minnesota Yes Yes Yes
Mississippi Yes Source: Kushler et al., 2006. (Current as of September 2007.) Please see Appendix C for specifi c state citations.
Aligning Utility Incentives with Investment in Energy Effi ciency 1-6
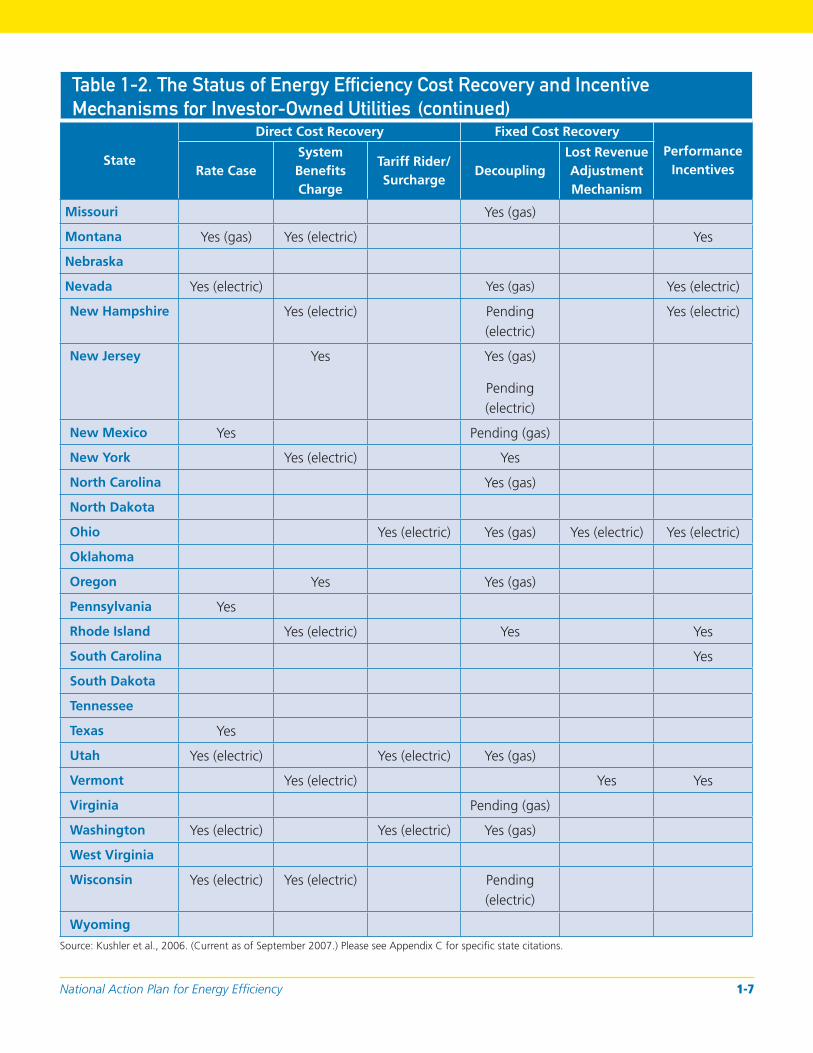
Table 1-2. The Status of Energy Efficiency Cost Recovery and Incentive
Mechanisms for Investor-Owned Utilities
State
Direct Cost Recovery Fixed Cost Recovery Performance
IncentivesRate Case System Benefi ts Charge
Tariff Rider/ Surcharge
Decoupling Lost Revenue Adjustment Mechanism
Missouri Yes (gas)
Montana Yes (gas) Yes (electric) Yes
Nebraska
Nevada Yes (electric) Yes (gas) Yes (electric)
New Hampshire Yes (electric) Pending (electric)
Yes (electric)
New Jersey Yes Yes (gas)
Pending (electric)
New Mexico Yes Pending (gas)
New York Yes (electric) Yes
North Carolina Yes (gas)
North Dakota
Ohio Yes (electric) Yes (gas) Yes (electric) Yes (electric)
Oklahoma
Oregon Yes Yes (gas)
Pennsylvania Yes
Rhode Island Yes (electric) Yes Yes
South Carolina Yes
South Dakota
Tennessee
Texas Yes
Utah Yes (electric) Yes (electric) Yes (gas)
Vermont Yes (electric) Yes Yes
Virginia Pending (gas)
Washington Yes (electric) Yes (electric) Yes (gas)
West Virginia
Wisconsin Yes (electric) Yes (electric) Pending (electric)
Wyoming
(continued)
Source: Kushler et al., 2006. (Current as of September 2007.) Please see Appendix C for specifi c state citations.
National Action Plan for Energy Effi ciency 1-7

do allow recovery of approved program costs through rate cases. The table also shows that there is a substantial amount of activity surrounding gas revenue decoupling. However, despite the signifi cant level of activity around the country, relatively few states have implemented comprehensive policies that address program cost recovery, recovery of lost margins, and performance incentives. The challenge to policy-makers is whether the level of investment envisioned can be achieved without broader action to implement such comprehensive policies.
1.2 Aligning Utility Incentives
with Investment in Energy
Effi ciency Report
This report on Aligning Utility Incentives with Investment in Energy Effi ciency describes the fi nancial effects on a utility of its spending on energy effi ciency programs; how those effects could constitute barriers to more aggressive and sustained utility investment in energy effi ciency; and how adoption of various policy mechanisms can reduce or eliminate these barriers. This Report also provides a number of examples of such mechanisms drawn from the experience of a number of utilities and states.
The Report was prepared in response to a need identifi ed by the Action Plan Leadership Group (see Appendix A for a list of group members) for additional practical information on mechanisms for reducing these barriers to support the Action Plan recommendations to “provide suffi cient, timely, and stable program funding to deliver energy effi ciency where cost-effective” and “modify policies to align utility incentives with the delivery of cost-effective energy effi ciency and modify ratemaking practices to promote energy effi ciency investments.” Key options to consider under this recommendation include committing to a consistent way to recover costs in a timely manner, addressing the typical utility throughput incentive, and providing utility incentives for the successful management of energy effi ciency programs.
There are a number of possible regulatory mechanisms for addressing both options, as well as for ensuring recovery of prudently incurred energy effi ciency program costs. Determining which mechanism will work best for any given jurisdiction is a process that takes into account the type and fi nancial structure of the utilities in that jurisdiction, existing statutory and regulatory authority, and the size of the energy effi ciency investment. The net impact of an energy effi ciency cost recovery and performance incentives policy will be affected by a wide variety of other factors, including rate design and resource procurement strategies, as well as broader considerations such as the rate of demand growth and environmental and resource policies.
Specifi cally, the Report provides a description of three fi nancial effects that energy effi ciency spending can have on a utility:
• Failure to recover program costs in a timely way has a direct impact on utility earnings.
• Reductions in sales due to energy effi ciency can reduce utility fi nancial margins.
• As a substitute for new supply-side resources, energy effi ciency reduces the earnings that a utility would otherwise earn on the supply resource.
This Report examines how these effects create disincentives to utility investment in energy effi ciency and the policy mechanisms that have been developed to address these disincentives. In addition, this Report examines the often complex policy environment in which these effects are addressed, emphasizing the need for clear policy objectives and for an approach that explicitly links together the impacts of policies to address utility fi nancial disincentives. Two emerging models for addressing fi nancial disincentives are described, and the Report concludes with a discussion of key lessons for states interested in developing policies to align fi nancial incentives with utility energy effi ciency investment.
The subject of financial disincentives and possible remedies has been debated for over two decades, and there remain several unresolved and contentious issues. This Report does
Aligning Utility Incentives with Investment in Energy Effi ciency 1-8
not attempt to resolve these issues. Rather, by providing discussion of the financial effects of utility effi ciency investment, and of the possible policy options for addressing these effects, this Report is intended to deepen the understanding of these issues. In addition, this Report is intended to provide specific examples of regulatory mechanisms for addressing financial effects for those readers exploring options for reducing financial disincentives to sustained utility investment in energy effi ciency.
This Report was prepared using an extensive review of the existing literature on energy effi ciency program cost recovery, lost margin recovery, and utility performance incentives—a literature that reaches back over 20 years. In addition, this Report uses a broad review of state statutes and administrative rules related to utility energy effi ciency program cost recovery. Key documents for the reader interested in additional information include:
• Aligning Utility Interests with Energy Effi ciency Objectives: A Review of Recent Efforts at Decoupling and Performance Incentives, Martin Kushler, Dan York, and Patti Witte, American Council for an Energy Effi cient Economy, Report Number U061, October 2006.
• Decoupling for Electric and Gas Utilities: Frequently Asked Questions (FAQ), September 2007, available at <http://www.naruc.org>.
• A variety of documents and presentations developed by RAP, available online at <http://www.raponline. org>.
• Ken Costello, Revenue Decoupling for Natural Gas Utilities—Briefi ng Paper, National Regulatory Research Institute, April 2006.
• American Gas Association, Natural Gas Rate Round-Up, Update on Decoupling Mechanisms—April 2007.
• DOE, State and Regional Policies That Promote Energy Effi ciency Programs Carried Out by Electric and Gas Utilities: A Report to the United States Congress Pursuant to Section 139 of the Energy Policy Act of 2005, March 2007.
• Revenue Decoupling: A Policy Brief of the Electricity Consumers Resource Council, January 2007.
1.2.1 How to Use This Report
This Report focuses on the issues associated with fi nancial implications of utility-administered programs. For the most part, these issues are the same whether the funding fl ows from a system benefi ts charge or is authorized by regulatory action, with the exception that a system benefi ts charge effectively resolves issues associated with program cost recovery. In addition, the issues related to the effect of energy effi ciency on utility fi nancial margins apply whether the effi ciency is produced by a utility-administered program or through building codes, appliance standards, or other initiatives aimed at reducing energy use. This Report is intended to help the reader answer the following questions:
• How are utilities affected fi nancially by their investments in energy effi ciency?
• What types of policy mechanisms can be used to address the various fi nancial effects of energy effi ciency investment?
• What are the pros and cons of these mechanisms?
• What states have employed which types of mechanisms and how have they been structured?
• What are the key differences related to fi nancial impacts between publicly and investor-owned utilities and between electric and gas utilities?
• What new models for addressing these fi nancial effects are emerging?
• What are the important steps to take in attempting to address fi nancial barriers to utility investment in energy effi ciency?
This Report is intended for utilities, regulators and regulatory staff, consumer representatives, and energy effi ciency advocates with an interest in addressing these fi nancial barriers.
1.2.2 Structure of the Report
Chapter 2 of the Report outlines the basic fi nancial effects associated with utility energy effi ciency investment, reviews the key related policy issues, and provides
National Action Plan for Energy Effi ciency 1-9

a case study of how a comprehensive approach to addressing fi nancial disincentives to utility energy effi ciency investment can have an impact on utility corporate culture. Chapter 3 outlines a range of possible objectives that policy-makers should consider in designing policies to address fi nancial incentives.
Chapters 4, 5, and 6 provide examples of specifi c program cost recovery, lost margin recovery, and utility performance incentive mechanisms, as well as a review of possible pros and cons. Chapter 7 provides an overview of two emerging cost recovery and performance incentive models, and the Report concludes with a discussion of important lessons for developing a policy to eliminate fi nancial disincentives to utility investment in energy effi ciency.
1.2.3 Development of the Report
The Report on Aligning Utility Incentives with Investment in Energy Effi ciency is a product of the Year Two Work Plan for the National Action Plan for Energy Effi ciency. In addition to direction and comment by the Action Plan Leadership Group, this Guide was prepared with highly valuable input of an Advisory Group. Val Jensen of ICF International served as project manager and primary author of the Report with assistance from Basak Uluca, under contract to the U.S. Environmental Protection Agency.
The Advisory Group members are:
• Lynn Anderson, Idaho Public Service Commission
• Jeff Burks, PNM Resources
• Sheryl Carter, Natural Resources Defense Council
• Dan Cleverdon, DC Public Service Commission
• Roger Duncan, Austin Energy
• Jim Gallagher, New York State Public Service Commission
• Marty Haught, United Cooperative Service
• Leonard Haynes, Southern Company
• Mary Healey, Connecticut Offi ce of Consumer Counsel
• Denise Jordan, Tampa Electric Company
• Don Low, Kansas Corporation Commission
• Mark McGahey, Tristate Generation and Transmission Association, Inc.
• Barrie McKay, Questar Gas Company
• Roland Risser, Pacifi c Gas & Electric
• Gene Rodrigues, Southern California Edison
• Michael Shore, Environmental Defense
• Raiford Smith, Duke Energy
• Henry Yoshimura, ISO New England Inc.
1.3 Notes
1. See the National Action Plan for Energy Effi ciency (2006), available at <www.epa.gov/cleanenergy/actionplan/report.htm>.
2. See <www.epa.gov/actionplan>.
3. “Procurement funds” are monies that are approved by the California Public Utilities Commission for procurement of new resources as part of what is essentially an integrated resource planning process in California.
4. Publicly and cooperatively owned utilities operate under different fi nancial structures than investor-owned utilities and do not face the same issue of earnings comparability, as they do not pay returns to equity holders.
5. Unbundling in the gas industry took a much different form than it did in the electric industry. Gas utilities were never integrated, in the sense that they were responsible for production, transmission, and distribution. Gas utilities always have principally served the distribution function. However, prior to the early 1980s, most gas utilities were responsible for contracting for gas to meet residential, commercial, and industrial demand. Gas industry restructuring led to larger customers being given the ability to purchase gas and transportation service directly, as well as to an end to the typical long-term bundled supply/transportation contracting that gas utilities formerly had engaged in.
6. Some wholesale markets are developing mechanisms to account for the value of demand-side programs. For example, ISO-New England’s Forward Capacity Auction allows providers of demand resources to bid demand reductions into the auction.
Aligning Utility Incentives with Investment in Energy Effi ciency 1-10
7. Although natural gas utilities have never had the capital-intensive fi nancial structure common to integrated electric utilities, they historically have tended to be more vulnerable fi nancially to declines in sales because a much greater fraction of the cost of gas service has been associated with the cost of the gas commodity. Prior to gas industry restructuring this problem was even more acute for those utilities procuring gas under contracts with take-or-pay or fi xed-charge clauses.
8. According to the Regulatory Assistance Project, the loss of sales due to successful implementation of energy effi ciency will lower utility profi tability, and the effect may be quite powerful under traditional rate design. “For example, a 5% decrease in sales can lead to a 25% decrease in net profi t for an integrated utility. For a stand-alone distribution utility, the loss to net profi t is even greater—about double the impact.” See Harrington, C., C. Murray, and L. Baldwin (2007). Energy Effi ciency Policy Toolkit. Regulatory Assistance Project. p. 21. <www.raponline.org>
9. A number of studies have examined the ability of energy effi ciency and particularly, demand response programs, to reduce power prices by cutting demand during high-price periods. Because the marginal costs of power typically exceed average costs during these periods, effi ciency programs targeted at high demand periods often will yield benefi ts for all ratepayers, even non-participants. See, for example, Direct Testimony of Bernard
Neenan on Behalf of the Citizens Utility Board and the City Of Chicago, Cub-City Exhibit 3.0 October 30, 2006, ICC Docket No. 06-0617, State Of Illinois, Illinois Commerce Commission.
10. See, for example: “Greenhouse Gauntlet,” 2007 CEO Forum, Public Utilities Fortnightly, June 2007. Pacifi c Gas and Electric (2007). Global Climate Change, Risks, Challenges, Opportunities and a Call to Action. </www.pge.com/includes/docs/pdfs/about_ us/environment/features/global_climate_06.pdf>
11. Energy effi ciency traditionally has been defi ned as an overall reduction in energy use due to use of more effi ciency equipment and practices, while load management, as a subset of demand response has been defi ned as reductions or shifts in demand with minor declines and sometimes increases in energy use.
12. There remain important distinctions between dispatchable demand response and energy effi ciency, including the ability to participate in wholesale markets.
13. For example, a demand-response program that reduces coincident peak demand but has little impact on sales could lead to a fi nancial benefi t for a utility, as its costs might decrease by more than its revenues if the cost of delivering power at the peak period exceeds the price for that power.
National Action Plan for Energy Effi ciency 1-11

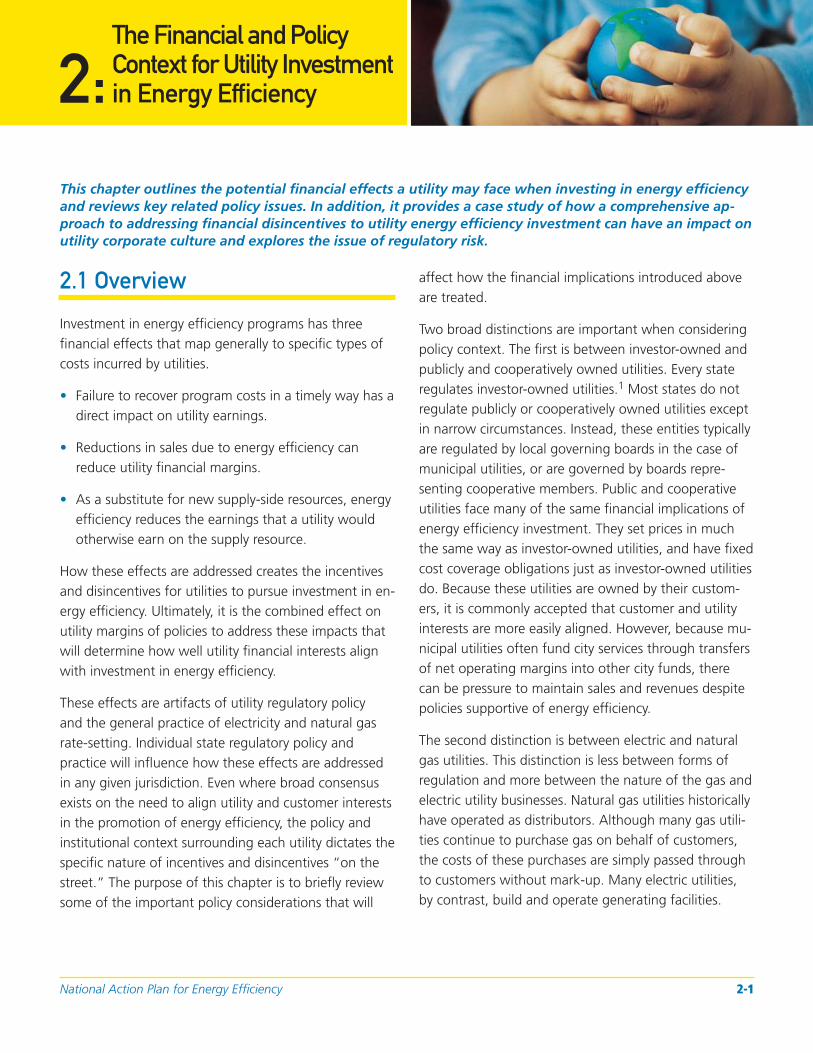
The Financial and Policy Context for Utility Investment 2: in Energy Effi ciency
This chapter outlines the potential financial effects a utility may face when investing in energy effi ciency and reviews key related policy issues. In addition, it provides a case study of how a comprehensive approach to addressing financial disincentives to utility energy efficiency investment can have an impact on utility corporate culture and explores the issue of regulatory risk.
2.1 Overview
Investment in energy effi ciency programs has three fi nancial effects that map generally to specifi c types of costs incurred by utilities.
• Failure to recover program costs in a timely way has a direct impact on utility earnings.
• Reductions in sales due to energy effi ciency can reduce utility fi nancial margins.
• As a substitute for new supply-side resources, energy effi ciency reduces the earnings that a utility would otherwise earn on the supply resource.
How these effects are addressed creates the incentives and disincentives for utilities to pursue investment in energy effi ciency. Ultimately, it is the combined effect on utility margins of policies to address these impacts that will determine how well utility fi nancial interests align with investment in energy effi ciency.
These effects are artifacts of utility regulatory policy and the general practice of electricity and natural gas rate-setting. Individual state regulatory policy and practice will infl uence how these effects are addressed in any given jurisdiction. Even where broad consensus exists on the need to align utility and customer interests in the promotion of energy effi ciency, the policy and institutional context surrounding each utility dictates the specifi c nature of incentives and disincentives “on the street.” The purpose of this chapter is to briefl y review some of the important policy considerations that will
affect how the fi nancial implications introduced above are treated.
Two broad distinctions are important when considering policy context. The fi rst is between investor-owned and publicly and cooperatively owned utilities. Every state regulates investor-owned utilities.1 Most states do not regulate publicly or cooperatively owned utilities except in narrow circumstances. Instead, these entities typically are regulated by local governing boards in the case of municipal utilities, or are governed by boards representing cooperative members. Public and cooperative utilities face many of the same fi nancial implications of energy effi ciency investment. They set prices in much the same way as investor-owned utilities, and have fi xed cost coverage obligations just as investor-owned utilities do. Because these utilities are owned by their customers, it is commonly accepted that customer and utility interests are more easily aligned. However, because municipal utilities often fund city services through transfers of net operating margins into other city funds, there can be pressure to maintain sales and revenues despite policies supportive of energy effi ciency.
The second distinction is between electric and natural gas utilities. This distinction is less between forms of regulation and more between the nature of the gas and electric utility businesses. Natural gas utilities historically have operated as distributors. Although many gas utilities continue to purchase gas on behalf of customers, the costs of these purchases are simply passed through to customers without mark-up. Many electric utilities, by contrast, build and operate generating facilities.
National Action Plan for Energy Effi ciency 2-1

Thus, the capital structures of the two types of utilities have differed signifi cantly.2 Electric utilities, while more capital intensive in the aggregate, historically have had higher variable costs of operation relative to the total cost of service than gas utilities. In other words, while electric utilities required more capital, fi xed capital costs represented a larger fraction of the jurisdictional revenue requirement for gas utilities. This has made gas utilities more sensitive to unexpected sales fl uctuations and fostered greater interest in various forms of lost margin recovery.
Much of the discussion of mechanisms for aligning utility and customer interests related to energy effi ciency investment assumes the utility is an investor-owned electric utility. However, some issues and their appropriate resolution will differ for publicly and cooperatively owned utilities and for natural gas utilities. These differences will be highlighted where most signifi cant.
This chapter reviews each of the three fi nancial effects of utility energy effi ciency spending and then briefl y examines some of the policy issues that each raises. More detailed examples of policy mechanisms for addressing each effect are provided in following chapters.
2.2 Program Cost Recovery
The fi rst effect is associated with energy effi ciency program cost recovery—recovery of the direct costs associated with program administration (including evaluation), implementation, and incentives to program participants. Reasonable opportunity for program cost recovery is a necessary condition for utility program spending. Failure to recover these costs produces a direct dollar-for-dollar reduction in utility earnings, and discourages further investment. If, for whatever reason, a utility is unable to recover $500,000 in costs associated with an energy effi ciency program, it will see a $500,000 drop in its net margin.
Policies directing utilities to undertake energy effi ciency programs in most cases authorize utilities to seek recovery of program costs, even though actual recovery of all costs is never guaranteed.3 Clarity with respect to
the cost recovery process is critical, as broad uncertainty regarding the timing and threshold burden of proof can itself constitute almost as much a disincentive to utility investment as actual refusal to allow recovery of program costs.4 A reasonable and reliable system of program cost recovery, therefore, is a necessary fi rst element of a policy to eliminate fi nancial disincentives to utility investment in energy effi ciency.
Policy-makers have a wide variety of tools available to them to address cost recovery. These tools can have very different fi nancial implications depending on the specifi c context. More important, history has shown that recovery is not, in fact, a given. Chapter 5 provides a more complete treatment of program cost recovery mechanisms. However, with respect to the broader policy context, several points are important to note here. All are related to risk.
2.2.1 Prudence
State regulatory commissions, as well as the governing boards of publicly and cooperatively owned utilities, have fundamental obligations to ensure that the costs passed along to ratepayers are just and reasonable and were prudently incurred. Sometimes commissions have found these costs to be appropriately born by shareholders (such as “image advertising”) rather than ratepayers. Other times, costs are disallowed because they are considered “unreasonable” for the good or service procured or delivered. Finally, regulators and boards might determine that a certain activity would not have been undertaken by prudent managers and thus costs associated with the activity should not be recoverable from ratepayers.
While within the scope of regulatory authority,5 such disallowances can create some uncertainty and risk for utilities if the rules governing prudence and reasonableness are not clear.6 Regulated industries traditionally have been viewed as risk averse, in part because with their returns regulated, risk and reward are not symmetrical. Utilities that have been faced with signifi cant disallowances tend to be particularly averse to incurring any cost that is not pre-approved or for which there is a risk that a particular expense will be disallowed.
Aligning Utility Incentives with Investment in Energy Effi ciency 2-2
Program cost recovery requires a negotiation between regulators and utilities to create more certainty regarding prudence and reasonableness and therefore, to assure utilities that energy effi ciency costs will be recoverable. Many states provide this balance by requiring utilities to submit energy effi ciency portfolio plans and budgets for review and sometimes approval.7 The utility receives assurance that its proposed expenditures are decisionally prudent, and regulators are assured that proposed expenditures satisfy policy objectives. Such pre-approval processes do not preclude regulatory review of actual expenditures or fi ndings that actual program implementation was imprudently managed.
2.2.2 The Timing of Cost Recovery
Cost recovery timing is important for two reasons:
1. If there is a signifi cant lag between a utility’s expenditure on energy effi ciency programs and recovery of those costs, the utility incurs a carrying cost—it must fi nance the cash fl ow used to support the program expenditure. Even if a utility has suffi cient cash fl ow to support program funding, these funds could have been applied to other projects were it not for the requirement to implement the program.
2. The length of the time lag directly affects a utility’s perception of cost recovery risk. The composition of regulatory commissions and boards changes frequently and while commissions may respect the decisions of their predecessors, they are not bound to them. Therefore, a change in commissions can lead to changes in or reversals of policy. More important, the longer the time lag, the greater the likelihood that unexpected events could occur that affect a utility’s cash fl ow.
The timing issues can be addressed in several ways. The two most prevalent approaches are to allow a utility to book program costs in a deferral account with an appropriate carrying charge applied, or to establish a tariff rider or surcharge that the utility can adjust periodically to refl ect changes in program costs. Neither approach precludes regulators from reviewing actual costs to determine reasonableness and making
appropriate adjustments. However, the deferral approach can create what is known as a regulatory asset, which can rapidly grow and, when it is added to the utility’s cost of service, cause a jump in rates depending on how the asset is treated.8
2.3 Lost Margin Recovery
The objective of an energy effi ciency program is to cost-effectively reduce consumption of electricity or natural gas. However, reducing consumption also reduces utility revenues and, under traditional rate designs that recover fi xed costs through volumetric charges, lower revenues often lead to under-recovery of a utility’s fi xed costs. This, in turn, can lead to lower net operating margins and profi ts and what is termed the “lost margin” effect. This same effect can create an incentive in certain cases for utilities to try to increase sales and thus, revenues, between rate cases—this is known as the throughput incentive. Because fi xed costs (including fi nancial margins) are recovered through volumetric charges, an increase in sales can yield increased earnings, as long as the costs associated with the increased sales are not climbing as fast.
Treatment of lost margin recovery, either in a limited fashion or through some form of what is known as “decoupling,” raises basic issues of not only what the regulatory obligation is with regard to utility earnings, but also of the regulators’ role in determining the utility’s business model. Few energy effi ciency policy issues have produced as much debate as the issue of the impact of energy effi ciency programs on utility margins (Costello, 2006; Eto et al., 1994; National Action Plan for Energy Effi ciency, 2006b; Sedano, 2006).
2.3.1 Defining Lost Margins
The lost margin effect is a direct result of the way that electricity and natural gas prices are set under traditional regulation. And while the issue might be more immediate for investor-owned utilities where profi ts are at stake, the root fi nancial issues are the same whether the utility is investor-, publicly, or cooperatively owned.
National Action Plan for Energy Effi ciency 2-3

Defi ning Terms
A variety of terms are used to describe the fi nancial effect of a reduction in utility sales caused by energy effi ciency. All of these relate to the practice of traditional ratemaking, wherein some portion of a utility’s fi xed costs are recovered through a volumetric charge. Because these costs are fi xed, higher-than-expected sales will lead to higher-than-expected revenue and possible over-recovery of fi xed costs. Lower-than-expected sales will lead to under-recovery of these costs. The terminology used to describe the phenomenon and its impacts can be confusing, as a variety of different terms are used to describe the same effect. Key terms include:
Throughput • —utility sales.
Throughput incentive • —the incentive to maximize sales under volumetric rate design.
Throughput disincentive • —the disincentive to encourage anything that reduces sales under traditional volumetric rate design.
Fixed-cost recovery • —the recovery of suffi cient revenues to cover a utility’s fi xed costs.
Lost revenue • —the reduction in revenue that occurs when energy effi ciency programs cause a drop in sales below the level used to set the electricity or gas price. There generally also is a reduction in cost as sales decline, although this reduction often is less than revenue loss.
Lost margin• —the reduction in revenue to cover fi xed costs, including earnings or profi ts in the case of investor-owned utilities. Similar to lost revenue, but concerned only with fi xed-cost recovery, or with the opportunity costs of lost margins that would have been added to net income or created a cash buffer in excess of that refl ected in the last rate case. The amount of margin that might be lost is a function of both the change in revenue and the any change in costs resulting from the change in sales.
The National Action Plan for Energy Effi ciency used throughput incentive to describe this effect. Where possible, this Report will also use that phrase. It will also describe the effect using the phrases under-recovery of margin revenue or lost margins, for the most part to describe issues related to the effect of energy effi ciency on recovery of fi xed costs.
Traditional cost-of-service ratemaking is based on the same simple arithmetic used in Table 2-1.9
average price = revenue requirement/ estimated sales10
revenue requirement = variable costs + depreciation + other fi xed costs + (capital costs × rate of return)
revenue = actual sales × average price
Capital costs are equal to the original cost of plant and equipment used in the generation, transmission, and distribution of energy, minus accumulated depreciation.
The rate of return, in the case of an investor-owned utility, is a weighted blend of the interest cost on the debt used to fi nance the plant and equipment and an ROE that represents the return to shareholders. The dollar value of this ROE generally represents allowed profi t or “margin.” Publicly and cooperatively owned utilities do not earn profi t per se, and so the rate of return for these enterprises is the cost of debt.11 The sum of depreciation, other fi xed costs (e.g., fi xed O&M, property taxes, labor), and the dollar return on invested capital represents a utility’s total fi xed costs.
If actual sales fall below the level estimated when rates are set, the utility will not collect revenue suffi cient to match its authorized revenue requirement. The portion
Aligning Utility Incentives with Investment in Energy Effi ciency 2-4
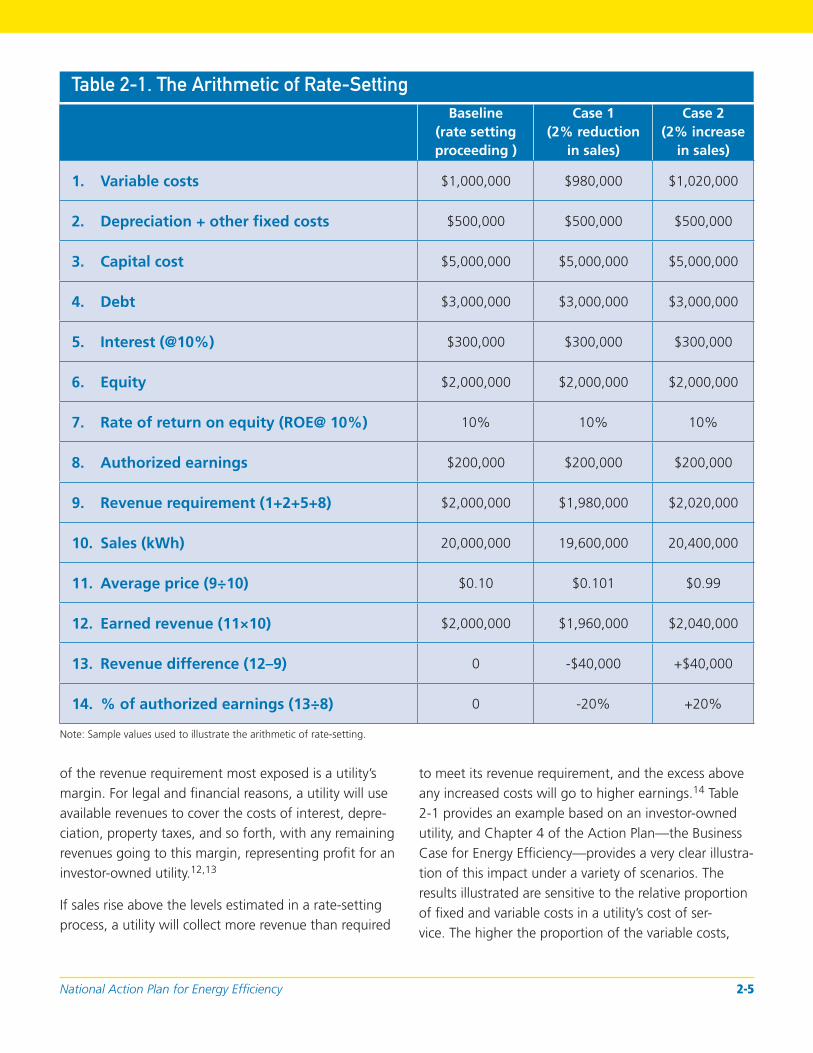
Table 2-1. The Arithmetic of Rate-Setting
Baseline (rate setting proceeding )
Case 1 (2% reduction
in sales)
Case 2 (2% increase
in sales)
Variable costs 1. $1,000,000 $980,000 $1,020,000
Depreciation + other fi xed costs 2. $500,000 $500,000 $500,000
Capital cost3. $5,000,000 $5,000,000 $5,000,000
Debt4. $3,000,000 $3,000,000 $3,000,000
Interest (@10%) 5. $300,000 $300,000 $300,000
Equity6. $2,000,000 $2,000,000 $2,000,000
Rate of return on equity (ROE@ 10%) 7. 10% 10% 10%
Authorized earnings 8. $200,000 $200,000 $200,000
Revenue requirement (1+2+5+8) 9. $2,000,000 $1,980,000 $2,020,000
10. Sales (kWh) 20,000,000 19,600,000 20,400,000
11. Average price (9÷10) $0.10 $0.101 $0.99
12. Earned revenue (11×10) $2,000,000 $1,960,000 $2,040,000
13. Revenue difference (12–9) 0 -$40,000 +$40,000
14. % of authorized earnings (13÷8) 0 -20% +20%
Note: Sample values used to illustrate the arithmetic of rate-setting.
of the revenue requirement most exposed is a utility’s margin. For legal and fi nancial reasons, a utility will use available revenues to cover the costs of interest, depreciation, property taxes, and so forth, with any remaining revenues going to this margin, representing profi t for an investor-owned utility.12,13
If sales rise above the levels estimated in a rate-setting process, a utility will collect more revenue than required
to meet its revenue requirement, and the excess above any increased costs will go to higher earnings.14 Table 2-1 provides an example based on an investor-owned utility, and Chapter 4 of the Action Plan—the Business Case for Energy Effi ciency—provides a very clear illustration of this impact under a variety of scenarios. The results illustrated are sensitive to the relative proportion of fi xed and variable costs in a utility’s cost of service. The higher the proportion of the variable costs,
National Action Plan for Energy Effi ciency 2-5
the lower the impact of a drop in sales. A gas utility’s cost-of-service typically will have a higher proportion of fi xed costs than an electric utility’s and, therefore, the gas utility can be more fi nancially sensitive to changes in sales relative to a test year level.15
This example only examines the impact on earnings due to a sales-produced change in revenue. Margins obviously also are affected by costs, and while many costs are considered fixed in the sense that they do not vary as a function of sales, they are under the control of utilities. Therefore, increases in sales and revenue above a test year level do not necessarily translate into higher margins, and the impact of a reduction in sales on margins depends on how a utility manages its costs.
Although the revenue difference appears small, it can be signifi cant due to the effects on fi nancial margins. The Case 1 revenue defi cit of $40,000 represents 20 percent of the allowed ROE. In other words, a 2 percent drop in sales below the level assumed in the rate case translates into a 20 percent drop in earnings or margin, all else being equal. Similarly, sales that are 2 percent higher than assumed yield a 20 percent increase in earnings above authorized levels.
The magnitude of the impact is, in this example, directly related to the effi cacy of the effi ciency program. Many other factors can have a similar impact on utility revenues—for instance, sales can vary greatly from the rate case forecast assumptions due to weather or economic conditions in the utility’s service territory. But unlike the weather or the economy, energy effi ciency is the most important factor affecting sales that lies within the utility’s control or infl uence, and successful energy effi ciency programs can reduce sales enough to create a disincentive to engage in such programs.
In Case 2, actual sales exceed estimated levels. Once rates are set, a utility may have a fi nancial incentive to encourage sales in excess of the level anticipated during the rate-setting process, since additional units of energy sold compensate for any unanticipated increased costs, and may improve earnings.16
Chapter 5 explores mechanisms that can be used to address both cases. Generally, two approaches have been used. First, several states have implemented what are termed lost revenue adjustment mechanisms (LRAMs) that attempt to estimate the amount of fi xed-cost or margin revenue that is “lost” as a result of reduced sales. The estimated lost revenue is then recovered through an adjustment to rates. The second approach is known generically as “decoupling.” A decoupling mechanism weakens or eliminates the relationship between sales and revenue (or more narrowly, the revenue collected to cover fi xed costs) by allowing a utility to adjust rates to recover authorized revenues independent of the level of sales. Decoupling actually can take many forms and include a variety of adjustments.
LRAM and decoupling not only represent alternative approaches to addressing the lost margins effect, but they also refl ect two different policy questions related to the relationship between utility sales and profi ts.
Provide compensation for lost margins?
Should a utility be compensated for the under-recovery of allowed margins when energy effi ciency programs— or events outside of the control of the utility, such as weather or a drop in economic activity—reduce sales below the level on which current rates are based? The fi nancial implication—with all else being held equal— is easy to illustrate as shown in Table 4-1. In practice, however, determining what is lost as a direct result of the implementation of energy effi ciency programs is not so simple. The determination of whether this loss should stand alone or be treated in context of all other potential impacts on margins also can be challenging. For example, during periods between rate cases, revenues and costs are affected by a wide variety of factors, some within management control and some not. The impacts of a loss of revenue due to an energy effi ciency program could be offset by revenue growth from customer growth or by reductions in costs. On the other hand, the addition of new customers imposes costs which, depending on rate structure, can exceed incremental revenues.
Aligning Utility Incentives with Investment in Energy Effi ciency 2-6
Change the basic relationship between sales and profi t?
Should lost margins be addressed as a stand-alone matter of cost recovery, or should they be considered within a policy framework that changes the relationship between sales, revenues, and margins—in other words by decoupling revenues from sales? Decoupling not only addresses lost margins due to effi ciency program implementation. It also removes the incentive a utility might otherwise have to increase throughput, and can reduce resistance to policies like effi cient building codes, appliance standards, and aggressive energy effi ciency awareness campaigns that would reduce throughput.
Decoupling also can have a signifi cant impact on both utility and customer risk. For example, by smoothing earnings over time, decoupling reduces utility fi nancial risk, which some have argued can lead to reductions in the utility’s cost-of-capital. (For a discussion of this issue, see Hansen, 2007, and Delaware PSC, 2007.) Depending on precisely how the decoupling mechanism is structured, it can shift some risks associated with sales unpredictability (e.g., weather, economic growth) to consumers.17 This is a design decision within the control of policy-makers, and not an inherent characteristic of decoupling. The issue of the effect of decoupling on risk and therefore, on the cost-of-capital, likely will receive greater attention as decoupling increasingly is pursued. The existing literature and current experience is inconclusive, and the policy discussion would benefi t from a more complete examination of the issue than is possible in this Report.
Ultimately, the policy choice must be made based on practical considerations and a reasonable balancing of interests and risks. Most observers would agree that signifi cant and sustained investment in energy effi ciency by utilities, beyond that required by statute or order, will not occur absent implementation of some type of lost margin recovery mechanism. More important, a policy that hopes to encourage aggressive utility investment in energy effi ciency most likely will not fundamentally change utility behavior as long as utility margins are directly tied to the level of sales. The increasing number of utility commissions investigating decoupling is clear
evidence that this question has moved front and center in development of energy effi ciency investment policies across the country.
2.4 Performance Incentives
The fi rst two fi nancial impacts described above pertain to obvious disincentives for utilities to engage in energy effi ciency program investment. The third effect concerns incentives for utilities to undertake such investment. Full recovery of program costs and collection of allowed revenue eliminates potential fi nancial penalties associated with funding energy effi ciency programs. However, simply eliminating fi nancial penalties will not fundamentally change the utility business model, because that model is premised on the earnings produced by supply-side investment. In fact, the earnings inequality between demand- and supply-side investment even where program costs and lost margins are addressed can create a signifi cant barrier to aggressive investment in energy effi ciency. An enterprise organized to focus on and profi t by investment in supply is not easily converted to one that is driven to reduce demand. This is particularly true in the absence of clear fi nancial incentives or fundamental changes in the business environment.18
This issue is fundamental to a core regulatory function—balancing a utility’s obligation to provide service at the lowest reasonable cost and providing utilities the opportunity to earn reasonable returns. For example, assume that an energy effi ciency program can satisfy an incremental resource requirement at half the cost of a supply-side resource, and that in all other fi nancial terms the effi ciency program is treated like the supply resource. Cost recovery is assured and lost margins are addressed. In this case, the utility will earn 50 percent of the return it would earn by building the power plant. Consumers as a whole clearly would be better off by paying half as much for the same level of energy service. However, the utility’s earnings expectations are now changed, with a potential impact on its stock price, and total returns to shareholders could decline. There could be additional benefi ts, to the extent that investors perceive the utility less vulnerable to fuel price or
National Action Plan for Energy Effi ciency 2-7
climate risk, but under the conventional approach to valuing businesses, the utility would be less attractive. This is an extreme example, and it is more likely that this trade-off plays out more modestly over a longer period of time. Nevertheless, the prospective loss of earnings from a shift towards greater reliance on demand-side resources is a concern among investor-owned utilities, and it will likely infl uence some utilities’ perspective on aggressive investment in energy effi ciency.19
The importance of performance incentives is not universally accepted. Some parties will argue that utilities are obligated to pursue energy effi ciency if that is the policy of the State. Those taking this view will see performance incentives as requiring customers to pay utilities to do something that should be done anyway. Others have argued that the basic business of a utility is to deliver energy, and that providing fi nancial incentives over-and-above what could be earned by effi cient management of the supply business simply raises the cost of service to all customers and distorts management behavior.
Those holding this latter view often prefer that energy effi ciency investment be managed by an independent third-party (see, for example, ELCON, 2007). Existing third-party models, such as those in Oregon, Vermont, and Wisconsin, have received generally high marks, but these models carry a variety of implications beyond those related to lost margins and performance incentives. Policy-makers interested in a third party model must balance the potentially benefi cial effects for ratepayers with what is typically a lower level of control over the third party, and increased complexity in integrating supply- and demand-side resource policy.
Apart from this threshold issue, regulators face a variety of options for providing incentives to utilities (see Chapter 7), ranging from mechanisms that tie a fi nancial reward to specifi c performance metrics, including savings, to options that enable a sharing of program benefi ts, to rewards based on levels of program spending.20 The latter type of mechanism, while sometimes derided as an incentive to spend, not save, has been
applied in some cases simply because it is easier to develop and implement, and it can be combined with pre- and post-implementation reviews to ensure that ratepayer funds are being used effectively.
Providing fi nancial incentives to a utility if it performs well in delivering energy effi ciency potentially can change the existing utility business model by making effi ciency profi table rather than merely a break-even activity. Today such incentives are the exception rather than the norm. For example, California policy-makers have acknowledged that successfully reorienting utility resource acquisition policy to place energy effi ciency fi rst in the resource “loading order” requires that performance incentives be re-instituted (see CPUC, 2006).
2.5 Linking the Mechanisms
Each of the financial effects suggests a different potential policy response, and policy-makers can and have approached the challenge in a variety of ways. It is the net financial effect of a package of cost recovery and incentive policies that matters in devising a policy framework to stimulate greater investment in energy efficiency. A variety of policy combinations can yield roughly the same effect. However, to the extent that mechanisms are developed to address all financial effects, care must be taken to ensure that the interactions among these are understood.
The essential foundation of the policy framework is program cost recovery. While confi dence in its ability to recover these direct costs is central to a utility’s willingness to invest in energy effi ciency, a number of options are available for recovery, some of which also address lost margins and performance incentives. Some states directly provide for lost margin recovery for losses due to effi ciency programs through a decoupling or LRAM while others create performance incentive policies that indirectly compensate for some or all lost margins. Minnesota, for example, abandoned its lost margin recovery mechanism in favor of a performance incentive after fi nding that levels of margin recovery had become so large that their recovery could not be supported by the
Aligning Utility Incentives with Investment in Energy Effi ciency 2-8
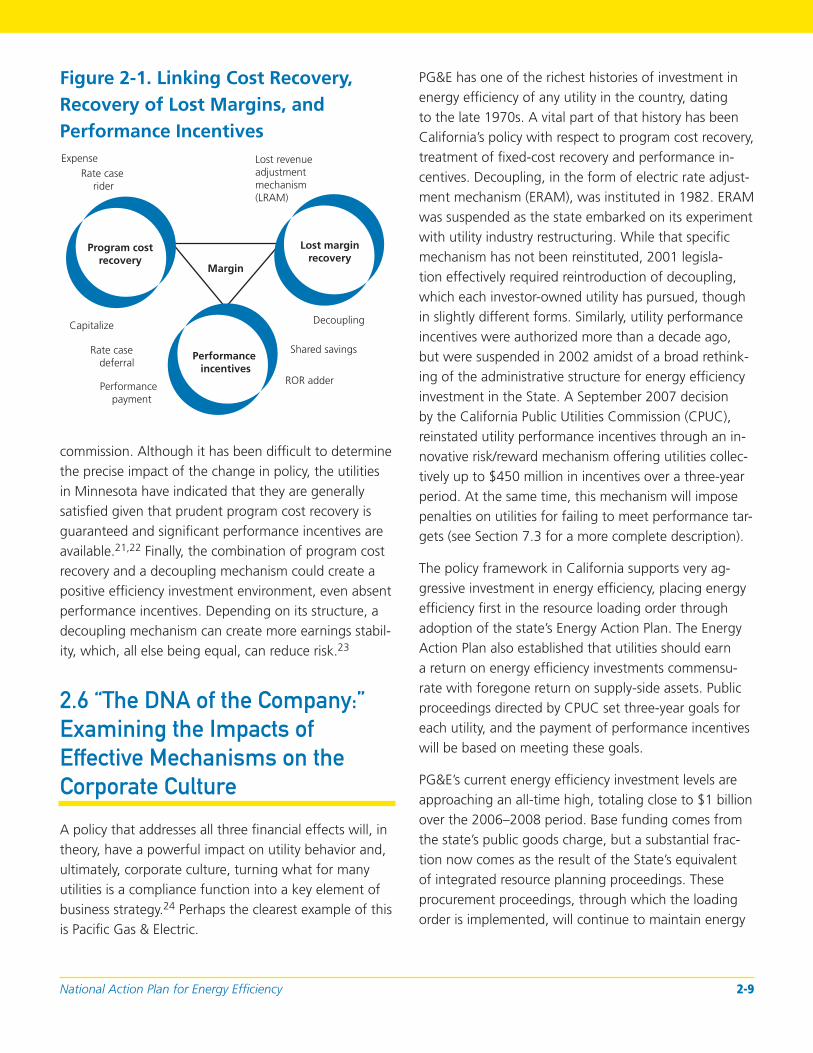
Figure 2-1. Linking Cost Recovery, Recovery of Lost Margins, and Performance Incentives Expense Lost revenue
Rate case adjustment rider mechanism
(LRAM)
Performance incentives
Margin
Lost margin recovery
Program cost recovery
Shared savings deferral
ROR adder
Rate case
Performance payment
commission. Although it has been diffi cult to determine the precise impact of the change in policy, the utilities in Minnesota have indicated that they are generally satisfi ed given that prudent program cost recovery is guaranteed and signifi cant performance incentives are available.21,22 Finally, the combination of program cost recovery and a decoupling mechanism could create a positive effi ciency investment environment, even absent performance incentives. Depending on its structure, a decoupling mechanism can create more earnings stability, which, all else being equal, can reduce risk.23
2.6 “The DNA of the Company:”
Examining the Impacts of
Effective Mechanisms on the
Corporate Culture
Capitalize Decoupling
A policy that addresses all three fi nancial effects will, in theory, have a powerful impact on utility behavior and, ultimately, corporate culture, turning what for many utilities is a compliance function into a key element of business strategy.24 Perhaps the clearest example of this is Pacifi c Gas & Electric.
PG&E has one of the richest histories of investment in energy effi ciency of any utility in the country, dating to the late 1970s. A vital part of that history has been California’s policy with respect to program cost recovery, treatment of fi xed-cost recovery and performance incentives. Decoupling, in the form of electric rate adjustment mechanism (ERAM), was instituted in 1982. ERAM was suspended as the state embarked on its experiment with utility industry restructuring. While that specifi c mechanism has not been reinstituted, 2001 legislation effectively required reintroduction of decoupling, which each investor-owned utility has pursued, though in slightly different forms. Similarly, utility performance incentives were authorized more than a decade ago, but were suspended in 2002 amidst of a broad rethinking of the administrative structure for energy effi ciency investment in the State. A September 2007 decision by the California Public Utilities Commission (CPUC), reinstated utility performance incentives through an innovative risk/reward mechanism offering utilities collectively up to $450 million in incentives over a three-year period. At the same time, this mechanism will impose penalties on utilities for failing to meet performance targets (see Section 7.3 for a more complete description).
The policy framework in California supports very aggressive investment in energy effi ciency, placing energy effi ciency fi rst in the resource loading order through adoption of the state’s Energy Action Plan. The Energy Action Plan also established that utilities should earn a return on energy effi ciency investments commensurate with foregone return on supply-side assets. Public proceedings directed by CPUC set three-year goals for each utility, and the payment of performance incentives will be based on meeting these goals.
PG&E’s current energy effi ciency investment levels are approaching an all-time high, totaling close to $1 billion over the 2006–2008 period. Base funding comes from the state’s public goods charge, but a substantial fraction now comes as the result of the State’s equivalent of integrated resource planning proceedings. These procurement proceedings, through which the loading order is implemented, will continue to maintain energy
National Action Plan for Energy Effi ciency 2-9
effi ciency funding at levels in excess of the public goods charge, as the state pursues aggressive savings goals.
A view only to savings targets and spending levels might suggest that a discussion of disincentive to investment and utility corporate culture is irrelevant in PG&E’s case. However, support for these aggressive investments appears to be run deep within the California investor-owned utilities, and clearly this policy would struggle were it not for utility support. Even so, has this policy actually shaped utility corporate culture?
Discussions with PG&E management suggest the answer is “yes” (personal communication with Roland Risser, Director of Customer Energy Effi ciency, Pacifi c Gas & Electric Company, May 2, 2007). Although investment levels always have been high in absolute terms, the company’s view in the 1980s initially had been that, as long as energy effi ciency investment did not hurt fi nancially, the company would not resist that investment. However, the combined effect of ERAM and utility performance incentives turned what had been a compliance function into a vital piece of the company’s business, and a defi ning aspect of corporate culture that has produced the largest internal energy effi ciency organization in the country.25
The policy and fi nancial turbulence created by the state’s attempt at industry restructuring challenged this culture, fi rst as ERAM and performance incentives were halted, and then as the regulatory environment turned sour with the energy crisis. However, a combination of a new policy recommitment to demand-side management (DSM), and the arrival of a new PG&E CEO have combined to reset the context for utility investment in effi ciency and strengthen corporate commitment. De-coupling is again in place and CPUC has adopted a new performance incentive structure.
The signifi cant escalation in effi ciency funding driven by California’s Energy Action Plan, in addition to resource procurement proceedings, required the company to address the role of energy effi ciency investment in more fundamental terms internally. The choices made in the procurement proceedings allocated funding to energy
effi ciency resources—funding that otherwise would have gone to support acquisition of conventional supply. While in most organizations such allocation processes can create fi erce competition, the environment within PG&E has signifi cantly reduced potential confl ict and even more fi rmly embedded energy effi ciency in the company’s clean energy strategy.
The culture shift certainly is the product of a combination of forces, including the arrival of a new CEO with a strong commitment to climate protection; a state policy environment that is intensely focused on clean energy development; an investment community interested in how utilities hedge their climate risks; and the re-emergence of favorable treatment of fi xed-cost coverage and performance incentives. It is not clear that progressive cost recovery and incentive policies are solely responsible for this change, but without these policies it is unlikely that effi ciency investment would have become a central element of corporate strategy, embedded “in the DNA of the Company” (personal communication with Roland Risser, PG&E).
Would the same cost recovery and incentive structure have the same effect elsewhere? That answer is unclear, though it is unlikely that simply adopting mechanisms similar to what are in place in California would effect overnight change. Corporate culture is formed over extended periods of time and is influenced by the whole of an operating environment and the leadership of the company. Nevertheless, according to senior PG&E staff, the effect of the cost recovery and incentive policies is undeniable—in this case it was the catalyst for the change.
2.7 The Cost of Regulatory Risk
A comprehensive cost recovery and incentive policy can help institutionalize energy effi ciency investment within a utility. At the same time, the absence of a comprehensive approach, or the inconsistent and unpredictable application of an approach, can create confusion with respect to regulatory policy and institutionalize resistance to energy effi ciency investment. A signifi cant risk that policy-makers could disallow recovery of program
Aligning Utility Incentives with Investment in Energy Effi ciency 2-10

costs and/or collection of incentives, even if such investments have been encouraged, imposes a real, though hard-to-quantify cost on utilities. While a signifi cant disallowance can have direct fi nancial implications, a less tangible cost is associated with the institutional friction a disallowance will create. Organizational elements within a utility responsible for energy effi ciency initiatives will fi nd it increasingly diffi cult to secure resources. Programs that are offered will tend to be those that minimize costs rather than maximize savings or cost-effectiveness. Easing this friction will not be as simple as a regulatory message that it will not happen again, and in fact the disallowance could very well have been justifi ed, should have happened, and would happen again.
Regulators clearly cannot give up their authority and responsibility to ensure just and reasonable rates based on prudently incurred costs. And changes in the course of policy are inevitable, making fl exibility and adaptability essential. All parties must realize, however, that the consistent application of policy with respect to cost recovery and incentives matters as much if not more than the details of the policies themselves. The wide variety of cost recovery and incentive mechanisms provides opportunities to fashion a similar variety of workable policy approaches. Signifi cant and sustained investment in energy effi ciency by utilities very clearly requires a broad and fi rm consensus on investment goals, strategy, investment levels, measurement, and cost recovery. It is this consensus that provides the necessary support for consistent application of cost recovery and incentives mechanisms.26
2.8 Notes
1. However, as they explored industry restructuring, a number of states stripped utility commissions of regulatory authority over generation and, in some cases, transmission to varying degrees.
2. In fact, many gas utilities do make investment in plant and equipment beyond gas distribution pipes—gas peaking and storage facilities, for example.
3. Recovery of costs always is based on demonstration that the costs were prudently incurred.
4. The forward period for which energy effi ciency program costs
is approved can be quite important to the success of programs. Year-by-year approval requirements complicate program planning, and longer term commitments to the market actors cannot be made. The trend among states is to move toward longer program implementation periods, e.g., three years. Thus, to the extent that program costs are reviewed as part of proposed implementation plans, initial approval for spending is conferred for the three-year period, providing program stability and fl exibility.
5. Courts can rule on appeal that regulatory disallowances were not supported by the facts of a case or by governing statute.
6. In fact, some such disallowances have had the effect of clarifying these rules.
7. Another approach to achieving this balance is using stakeholder collaboratives to review, help fashion, and, where appropriate based on this review, endorse certain utility decisions. Where these collaboratives produce stipulations that can be offered to regulators, they provide some additional assurance to regulators that parties who might otherwise challenge the prudence or reasonableness of an action, have reviewed the proposed action and found it acceptable. Though sometimes time-and resource-intensive, such collaboratives have been helpful tools for reducing utility prudence risk related to energy effi ciency expenditures.
8. In addition, because such regulatory asset accounts are backed not by hard assets but by a regulatory promise to allow recovery, their use can raise concern in the fi nancial community particularly for utilities with marginal credit ratings.
9. The lost margin issue actually arises as a function of rate designs that intend to recover fi xed costs through volumetric (per kilo-watt-hour or therm) charges. A rate design that placed all fi xed costs of service in a fi xed charge per customer (SFV rate) would largely alleviate this problem. However such rates signifi cantly reduce a consumer’s incentive to undertake effi ciency investments, since energy use reductions would produce much lower customer bill savings relative to a the situation under a rate design that included fi xed costs in volumetric charges. In addition, fi xed-variable rates are criticized as being regressive (the lower the use, the higher the average cost per unit consumed) and unfair to low-income customers. See Chapter 5, “Rate Design,” of the Action Plan for an excellent discussion of this process.
10. This equation is a simplifi cation of the rate-setting process. The actual rates paid per kilowatt-hour or therm often will be higher or lower than the average revenue per unit.
11. Note, however, that publicly owned utilities typically must transfer some fraction of net operating margins to other municipal funds, and cooperatively owned utilities typically pay dividends to the member of the co-op. These payments are the practical equivalent of investor-owned utility earnings. In addition, these utilities typically must meet bond covenants requiring that they earn suffi cient revenue to cover a multiple of their interest obligations. Therefore, there can be competing pressures for publicly and cooperatively owned utilities to maintain or increase sales at the same time that they promote energy effi ciency programs.
National Action Plan for Energy Effi ciency 2-11

12. Although a utility is not obligated to pay returns to shareholders in the same sense that it is obligated to pay for fuel or to pay the interest associated with debt fi nancing, failure to provide the opportunity to earn adequate returns will lead equity investors to view the utility as a riskier or less desirable investment and will require a higher rate of return if they are to invest in the utility. This will increase the utility’s overall cost of service and its rates.
13. Publicly and cooperatively owned utilities do not earn profi ts per se and thus, have no return on equity. However, they do earn fi nancial margins calculated as the difference between revenues earned and the sum of variable and fi xed costs. These margins are important as they fund cooperative member dividends and payments to the general funds of the entities owning the public utilities.
14. The actual impact on margins of a change in sales depends critically on the extent to which fi xed costs are allocated to volumetric charges. Actual electricity and natural gas prices usually include both a fi xed customer charge and a price per unit of energy consumed. The larger the share of fi xed costs included in this price per unit, the more a utility’s margin will fl uctuate with changes in sales.
15. A gas utility’s cost of service does not include the actual commodity cost of gas which is fl owed through directly to customers without mark-up.
16. Some states require utilities to participate in a rate case every two or three years. Others hold rate cases only when a utility believes it needs to change its prices in light of changing costs or the regulatory agency believes that a utility is over-earning.
17. Unless properly structured, a decoupling mechanism also can lead to a utility over-earning—collecting more margin revenue than it is authorized to collect.
18. An alternative has been for state utility commissions to require adherence to least-cost planning principles that require the less expensive energy effi ciency to be “built,” rather than the new supply-side resource. However, this approach does not alter the basic fi nancial landscape described above.
19. The California Public Utilities Commission’s recent ruling regarding utility performance rewards explicitly recognized this issue.
20. The actual implementation of an incentive mechanism may address more than fi nancial incentives. For example, The Minnesota Commission considers its fi nancial incentive mechanism as effectively addressing the fi nancial impact of the reduction in revenue due to an energy effi ciency program.
21. State EE/RE Technical Forum Call #8, Decoupling and Other Mechanisms to Address Utility Disincentives for Implementing Energy Effi ciency, May 19, 2005. <http://www.epa.gov/cleanenergy/ stateandlocal/effi ciency.htm#decoup>
22. The Minnesota Legislature recently adopted legislation directing the Minnesota Public Service Commission to adopt criteria and standards for decoupling, and to allow one or more utilities to establish pilot decoupling programs. S.F. No. 145, 2nd Engrossment 85th Legislative Session (2007–2008).
23. As noted, some argue that this risk reduction should translate into a corresponding reduction in the cost of capital, although views are mixed regarding the extent to which this reduction can be quantifi ed.
24. For a broader discussion of how cost recovery and incentive mechanisms can affect the business model for utility investment in energy effi ciency, see NERA Economic Consulting (2007). Making a Business of Energy Effi ciency: Sustainable Business Models for Utilities. Prepared for Edison Electric Institute.
25. This infrastructure was signifi cantly scaled back during California’s restructuring era.
26. One way to manage the regulatory risk issue is to make the regulatory goals very clear and long-term in nature. Setting energy savings targets—for example, by using an Energy Effi ciency Resource Standard—can remove some part of the utility’s risk. If the utility meets the targets, and can show that the targets were achieved cost-effectively, prudence and reasonableness are easier to establish, and cost recovery and incentive payments become less of an issue. Otherwise, more issues are under scrutiny: did the utility seek “enough” savings? Did it pursue the “right” technologies and markets? With a high-level, simple, and long-term target, such issues become less germane.
Aligning Utility Incentives with Investment in Energy Effi ciency 2-12

Understanding Objectives— Developing Policy 3: Approaches That Fit
This chapter explores a range of possible objectives for policy-makers’ consideration when exploring policies to address financial disincentives. It also addresses the broader context in which these objectives are pursued.
3.1 Potential Design Objectives
Each jurisdiction could value the objectives of the energy effi ciency investment process and the objectives of cost recovery and incentive policy design differently. Jurisdictional approaches are formed by a variety of statutory constraints, as well as by the ownership and fi nancial structures of the utilities; resource needs; and related local, state, and federal resource and environmental policies. The overarching objective in every jurisdiction that considers an energy effi ciency investment policy should be to generate and capture substantial net economic benefi ts. This broad objective sometimes is expressed as a spending target, but more often as an energy or demand reduction target, either absolute (e.g., 500 MW by 2017) or relative (e.g., meet 10, 50, or 100 percent of incremental load growth or total sales). Increasingly, states are linking this objective to others that promote the use of cost-effective energy effi ciency as an environmentally preferred option. The objectives outlined below guide how a cost recovery and incentive policy is crafted to support this overarching objective.
A review of the cost recovery and incentive literature, as well as the actual policies established across the country, reveals a fairly wide set of potential policy objectives. Each one of these is not given equal weight by policy-makers, but most of these are given at least some consideration in virtually every discussion of cost recovery and performance incentives. Many of these objectives apply to broader regulatory issues as well. Here the focus is solely on the objectives as they might apply to design of cost recovery and incentive mechanisms intended
to serve the overarching objective stated above; that is whether the treatment of these objectives leads to a policy that effectively incents substantial cost-effective savings. A cost recovery and incentives policy that satisfi es each of the design objectives described below, but which does not stimulate utility investment in energy effi ciency, would not serve the overarching objective.
3.1.1 Strike an Appropriate Balance of Risk/ Reward Between Utilities/Customers
The principal trade-off is between lowering utility risk/ enhancing utility returns on the one hand and the magnitude of consumer benefi ts on the other. Mechanisms that reduce utility risk by, for example, providing timely recovery of lost margins and providing performance incentives, reduce consumer benefi t, since consumers will pay for recovery and incentives through rates.1 However, if the mechanisms are well-designed and implemented, customer benefi ts will be large enough that sharing some of this benefi t as a way to reduce utility risk and strengthen institutional commitment will leave all parties better off than had no investment been made.
3.1.2 Promote Stabilization of Customer Rates and Bills
This objective is common to many regulatory policies and is relevant to energy effi ciency cost recovery and incentives policy primarily with respect to recovery of lost margins. The ultimate objective served by a cost recovery and incentives policy implies an overall reduction in the long run costs to serve load, which equate to the total amount paid by customers over time. Therefore, while it is prudent to explore policy designs that, among available options, minimize potential rate
National Action Plan for Energy Effi ciency 3-1
volatility, the pursuit of rate stability should be balanced against the broader interest of total customer bill reductions. In fact, there are cases (Questar Gas in Utah, for example) where energy effi ciency programs produce benefi ts for all customers (programs pass the so-called No-Losers test of cost-effectiveness) through reductions in commodity costs (Personal communication with Barry McKay, Questar Gas, July 9, 2007).
Program costs and performance incentives are relatively stable and predictable, or at least subject to caps. Lost margins can grow rapidly, and recovery can have a noticeable impact on customer rates. Decoupling mechanisms can be designed to mitigate this problem through the adoption of annual caps, but there have been isolated cases in which the true-ups have become so large due to factors independent of energy effi ciency investment that regulators have balked at allowing full recovery.2 Therefore, consideration of this objective is important for customers and utilities, as erratic and substantial energy effi ciency cost swings can imperil full recovery and increase the risk of effi ciency investments for utilities.
3.1.3 Stabilize Utility Revenues
This objective is a companion to stabilization of rates. Aggressive energy efficiency programs will impact utility revenues and full recovery of fixed costs. However, even if cost recovery policy covers program costs, lost margins, and performance incentives, how this recovery takes place can affect the pattern of earnings. Large episodic jumps in earnings (for example, produced by a decision to allow recovery of accrued lost margins in a lump sum), while better than non-recovery, cloud the financial community’s ability to discern the true financial performance of the company, and creates the perception of risk that such adjustments might or might not happen again. PG&E views the ability of its decoupling mechanism to smooth earnings as a very important risk mitigation tool (personal communication with Roland Risser, PG&E).
3.1.4 Administrative Simplicity and Managing Regulatory Costs
Simplicity requires that any/all mechanisms be transparent with respect to both calculation of recoverable amounts and overall impact on utility earnings. This, in turn, supports minimizing regulatory costs. Given the workload facing regulatory commissions, adoption of cost recovery and incentive mechanisms that require frequent and complex regulatory review will create a latent barrier to effective implementation of the mechanisms. Every mechanism will impose some incremental cost on all parties, since some regulatory responsibilities are inevitable. The objective, therefore, is to structure mechanisms with several attributes that can establish at least a consistent and more formulaic process.
The mechanism should be supported by prior regulatory review of the proposed effi ciency investment plan, and at least general approval of the contours of the plan and budget. In the alternative, policy-makers can establish clear rules prescribing what is considered acceptable/necessary as part of an investment plan, including cost caps. This will reduce the amount of time required for post-implementation review, as the prudence of the investment decision and the reasonableness of costs will have been established.
Use of tariff riders with periodic true-up allows for more clear segregation of investment costs and adjustment for over/under-recovery than simply including costs in a general rate case. However, in some states, the periodic treatment of energy efficiency program costs, fi xed cost recovery, and incentives outside of a general rate case could be prohibited as single-issue ratemaking.3
Because certain mechanisms require evaluation and verifi cation of program savings as a condition for recovery, very clear specifi cation of the evaluation standards at the front end of the process is important. Millions of dollars are at stake in such evaluations, and failure to prescribe these standards early in the process almost guarantees that evaluation methods will be contested in cost recovery proceedings.
Aligning Utility Incentives with Investment in Energy Effi ciency 3-2
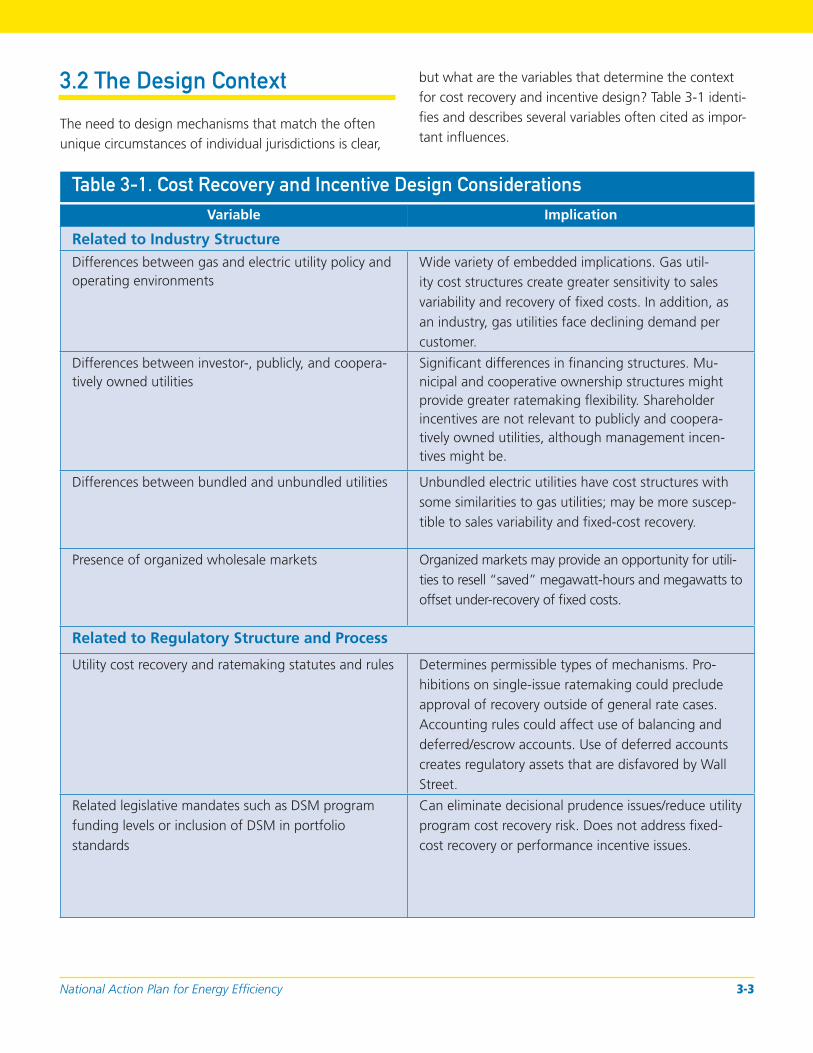
but what are the variables that determine the context 3.2 The Design Context for cost recovery and incentive design? Table 3-1 identifi es and describes several variables often cited as impor-The need to design mechanisms that match the often tant infl uences. unique circumstances of individual jurisdictions is clear,
Table 3-1. Cost Recovery and Incentive Design Considerations
Variable
Related to Industry Structure
Implication
Differences between gas and electric utility policy and operating environments
Wide variety of embedded implications. Gas utility cost structures create greater sensitivity to sales variability and recovery of fi xed costs. In addition, as an industry, gas utilities face declining demand per customer.
Differences between investor-, publicly, and cooperatively owned utilities
Signifi cant differences in fi nancing structures. Municipal and cooperative ownership structures might provide greater ratemaking fl exibility. Shareholder incentives are not relevant to publicly and cooperatively owned utilities, although management incentives might be.
Differences between bundled and unbundled utilities Unbundled electric utilities have cost structures with some similarities to gas utilities; may be more susceptible to sales variability and fi xed-cost recovery.
Presence of organized wholesale markets Organized markets may provide an opportunity for utilities to resell “saved” megawatt-hours and megawatts to offset under-recovery of fi xed costs.
Related to Regulatory Structure and Process
Utility cost recovery and ratemaking statutes and rules Determines permissible types of mechanisms. Prohibitions on single-issue ratemaking could preclude approval of recovery outside of general rate cases. Accounting rules could affect use of balancing and deferred/escrow accounts. Use of deferred accounts creates regulatory assets that are disfavored by Wall Street.
Related legislative mandates such as DSM program funding levels or inclusion of DSM in portfolio standards
Can eliminate decisional prudence issues/reduce utility program cost recovery risk. Does not address fi xed-cost recovery or performance incentive issues.
National Action Plan for Energy Effi ciency 3-3
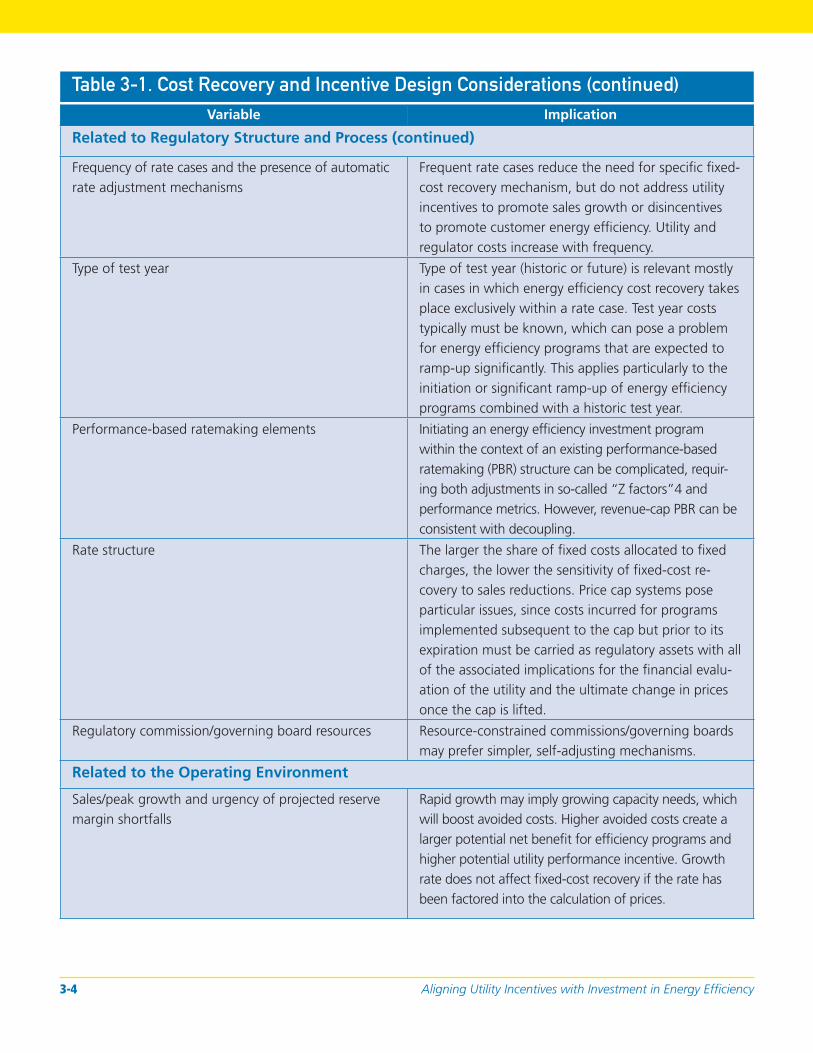
Table 3-1. Cost Recovery and Incentive Design Considerations (continued)
Variable Implication
Related to Regulatory Structure and Process (continued)
Frequency of rate cases and the presence of automatic rate adjustment mechanisms
Frequent rate cases reduce the need for specifi c fi xed-cost recovery mechanism, but do not address utility incentives to promote sales growth or disincentives to promote customer energy effi ciency. Utility and regulator costs increase with frequency.
Type of test year Type of test year (historic or future) is relevant mostly in cases in which energy effi ciency cost recovery takes place exclusively within a rate case. Test year costs typically must be known, which can pose a problem for energy effi ciency programs that are expected to ramp-up signifi cantly. This applies particularly to the initiation or signifi cant ramp-up of energy effi ciency programs combined with a historic test year.
Performance-based ratemaking elements Initiating an energy efficiency investment program within the context of an existing performance-based ratemaking (PBR) structure can be complicated, requiring both adjustments in so-called “Z factors”4 and performance metrics. However, revenue-cap PBR can be consistent with decoupling.
Rate structure The larger the share of fi xed costs allocated to fi xed charges, the lower the sensitivity of fi xed-cost recovery to sales reductions. Price cap systems pose particular issues, since costs incurred for programs implemented subsequent to the cap but prior to its expiration must be carried as regulatory assets with all of the associated implications for the fi nancial evaluation of the utility and the ultimate change in prices once the cap is lifted.
Regulatory commission/governing board resources Resource-constrained commissions/governing boards may prefer simpler, self-adjusting mechanisms.
Related to the Operating Environment
Sales/peak growth and urgency of projected reserve margin shortfalls
Rapid growth may imply growing capacity needs, which will boost avoided costs. Higher avoided costs create a larger potential net benefit for efficiency programs and higher potential utility performance incentive. Growth rate does not affect fixed-cost recovery if the rate has been factored into the calculation of prices.
Aligning Utility Incentives with Investment in Energy Effi ciency 3-4
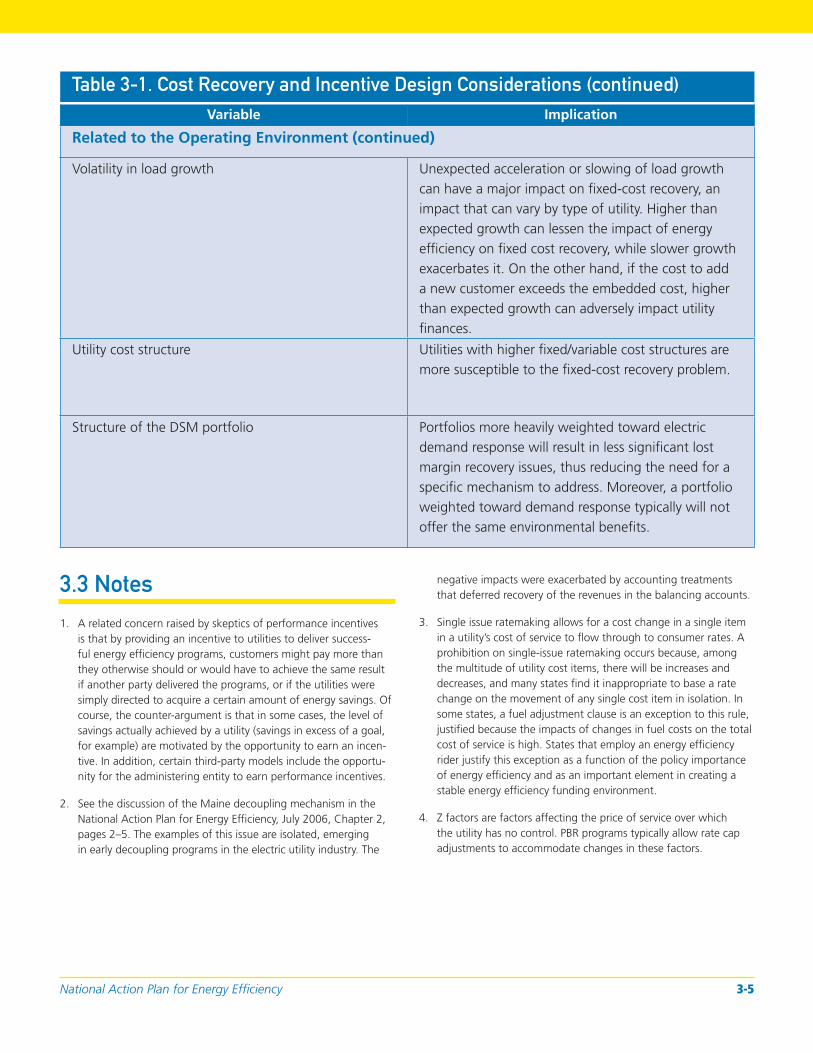
Table 3-1. Cost Recovery and Incentive Design Considerations (continued)
Variable Implication
Related to the Operating Environment (continued)
Volatility in load growth Unexpected acceleration or slowing of load growth can have a major impact on fi xed-cost recovery, an impact that can vary by type of utility. Higher than expected growth can lessen the impact of energy effi ciency on fi xed cost recovery, while slower growth exacerbates it. On the other hand, if the cost to add a new customer exceeds the embedded cost, higher than expected growth can adversely impact utility fi nances.
Utility cost structure Utilities with higher fi xed/variable cost structures are more susceptible to the fi xed-cost recovery problem.
Structure of the DSM portfolio Portfolios more heavily weighted toward electric demand response will result in less signifi cant lost margin recovery issues, thus reducing the need for a specifi c mechanism to address. Moreover, a portfolio weighted toward demand response typically will not offer the same environmental benefi ts.
3.3 Notes
1. A related concern raised by skeptics of performance incentives is that by providing an incentive to utilities to deliver successful energy effi ciency programs, customers might pay more than they otherwise should or would have to achieve the same result if another party delivered the programs, or if the utilities were simply directed to acquire a certain amount of energy savings. Of course, the counter-argument is that in some cases, the level of savings actually achieved by a utility (savings in excess of a goal, for example) are motivated by the opportunity to earn an incentive. In addition, certain third-party models include the opportunity for the administering entity to earn performance incentives.
2. See the discussion of the Maine decoupling mechanism in the National Action Plan for Energy Effi ciency, July 2006, Chapter 2, pages 2–5. The examples of this issue are isolated, emerging in early decoupling programs in the electric utility industry. The
negative impacts were exacerbated by accounting treatments that deferred recovery of the revenues in the balancing accounts.
3. Single issue ratemaking allows for a cost change in a single item in a utility’s cost of service to fl ow through to consumer rates. A prohibition on single-issue ratemaking occurs because, among the multitude of utility cost items, there will be increases and decreases, and many states fi nd it inappropriate to base a rate change on the movement of any single cost item in isolation. In some states, a fuel adjustment clause is an exception to this rule, justifi ed because the impacts of changes in fuel costs on the total cost of service is high. States that employ an energy effi ciency rider justify this exception as a function of the policy importance of energy effi ciency and as an important element in creating a stable energy effi ciency funding environment.
4. Z factors are factors affecting the price of service over which the utility has no control. PBR programs typically allow rate cap adjustments to accommodate changes in these factors.
National Action Plan for Energy Effi ciency 3-5

4: Program Cost Recovery
This chapter provides a practical overview of alternative cost recovery mechanisms and presents their pros and cons. Detailed case studies are provided for each mechanism.
4.1 Overview
Administration and implementation of energy effi ciency programs by utilities or third-party administrators involves the annual expenditure of several million dollars to several hundred million dollars, depending on the jurisdiction. The most basic requirement for elimination of disincentives to customer-funded energy effi ciency is establishing a fair, expeditious process for recovery of these costs, which include participant incentives and implementation, administration, and evaluation costs. Failure to recover such costs directly and negatively affects a utility’s cash fl ow, net operating income, and earnings.
Utilities incur two types of costs in the provision of service. Capital costs are associated with the plant and equipment associated with the production and delivery of energy. Expenses typically are the costs of service that are not directly associated with physical plant or other hard assets.1 The amount of revenue that a utility must earn over a given period to be fi nancially viable must cover the sum of expenses over that period plus the fi nancial cost associated with the utility’s physical assets. In simple terms, a utility revenue requirement is equivalent to the cost of owning and operating a home, including the mortgage payment and ongoing expenses. The costs associated with utility energy effi ciency programs must be recovered either as expenses or as capital items.
The predominant approach to recovery of program costs is through some type of periodic rate adjustment established and monitored by state utility regulatory commissions or the governing entities for publicly or cooperatively owned utilities. These regulatory mechanisms can take a variety of forms including recovery as expenses in traditional rate
cases, recovery as expenses through surcharges or riders that can be adjusted periodically outside of a formal rate case, or recovery via capitalization and amortization. Variations exist within these broad forms of cost recovery as well, through the use of balancing accounts, escrow accounts, test years, and so forth.
The approach applied in any given jurisdiction will often be the product of a variety of local factors such as the frequency of rate cases, the specifi c forms of cost accounting allowed in a state, the amount and timing of expenditures, and the types of programs being implemented. States will also differ in how costs are distributed across and recovered from different customer classes. Some states, for example, allow large customers to opt-out of effi ciency programs administered by utilities,2 and some states require that costs be recovered only from the classes of customers directly benefi ting from specifi c programs. These variations preclude a single best approach. However, for those utilities and states considering implementation of energy effi ciency programs, the variety of approaches offers a variety of options to consider.
4.2 Expensing of Energy
Efficiency Program Costs
Most energy effi ciency program costs are recovered through “expensing.” In the simplest case, if a utility spends $1.00 to fund an energy effi ciency program, that $1.00 is passed directly to customers as part of the utility’s cost of service. While in principle, the expensing of energy effi ciency program costs is straightforward, utilities and state regulatory commissions have employed a wide variety of specifi c accounting treatments and actual recovery mechanisms to enable recovery of
National Action Plan for Energy Effi ciency 4-1
program expenses. This section provides an overview of several of the more common approaches.
4.2.1 Rate Case Recovery
The most straightforward approach to recovery of program costs as expenses involves recovery in base rates as an element of the utility revenue requirement. Energy effi ciency program costs are estimated for the relevant period, added to the utility’s revenue requirement, and recovered through customer rates that were set based on this revenue requirement and estimated sales. Rate cases typically involve an estimate of known future costs, given that the rates that emerge from the case are applied going forward. For example, a utility and its commission might conduct a rate case in 2007 to establish the rates that will apply beginning in 2008. Therefore, the utility will estimate (and be seeking approval to incur) the costs associated with the energy effi ciency program in 2008 and annually thereafter. The approved level of energy effi ciency spending will be included in the allowed revenue requirement, and the rates taking effect in 2008 should include an amount that will recover the utility’s budgeted program costs over the course of the year based on the level of annual sales estimated in the rate case. Although actual program expenses rarely match the amount of revenue collected for those programs in real-time, in principle, program expenses incurred will match revenue received by the end of the year. This approach works best when annual energy effi ciency expenditures are constant on average.
4.2.2 Balancing Accounts with Periodic True-Up
Practice rarely matches principle, however, particularly with respect to energy effi ciency program costs. The estimates of program costs used as the basis for setting rates are based in large part on assumed customer participation in the effi ciency programs. However, participation is diffi cult to predict at a level of precision that ensures that annual expenditures will match annual revenue, especially in the early years of programs. Under-recovery of expenses occurs if participation in programs exceeds estimates and actual program costs rise. Regulatory commissions and utilities frequently have implemented various types of balancing mechanisms to ensure that customers do not pay for costs never incurred, and that utilities are
not penalized because participation and program costs exceeded estimates. Such approaches also enable utilities to more fl exibly ramp program activity (and associated spending) up or down. These mechanisms also often include some type of periodic prudence review to ensure that costs incurred in excess of those estimated in the rate case were prudently incurred.
The mechanics of a balancing account can work in a number of ways. Balances can simply be carried (typically with an associated carrying charge) until the next rate case, at which point they are “trued-up.”3 A positive balance could be used to reduce the level of expenses authorized for recovery in the future period, and a negative balance could be added in full to the authorized revenues for the future period or could be amortized. Alternatively, the balances can be self-adjusting by using a surcharge or tariff rider (discussed below), and some states allow annual true-up outside of general rate case proceedings.4
4.2.3 Pros and Cons
Table 4-1 describes general pros and cons associated with the expensing of program costs.
4.2.4 Case Study: Arizona Public Service Company (APS)
In June 2003, APS fi led an application for a rate increase and a settlement agreement was signed between APS and the involved parties in August 2004. The settlement addresses DSM and cost recovery, allowing $10 million each year in base rates for eligible expenses, as well as an adjustment mechanism for program expenses beyond $10 million.
• The settlement agreement embodied in Order No. 67744 issued in April of 2005, under Docket No. E01345A-03-04375 includes the following provisions:
• Included in APS’ total test year settlement base rate revenue requirement is an annual $10 million base rate DSM allowance for the costs of approved “eligible DSM-related items,” defi ned as the planning, implementation, and evaluation of programs that reduce the use of electricity by means of energy effi ciency products, services, or practices. Performance incentives are included as an allowable expense.
Aligning Utility Incentives with Investment in Energy Effi ciency 4-2

Table 4-1. Pros and Cons of Expensing Program Costs
Pros
• Expensing treatment is generally consistent with standard utility cost accounting and recovery rules.
• Avoids the creation of potentially large regulatory assets and associated carrying costs.
• Provides more-or-less immediate recovery of costs and reduces recovery risk.
• The use of balancing mechanisms outside of a general rate case ensures more timely recovery when effi ciency program costs are variable and prevents signifi cant over- or under-recovery from being carried forward to the next rate case.
Cons
• A combination of infrequent rate cases and escalating expenditures can lead to under-recovery absent a balancing mechanism.
• Can be viewed as single-issue ratemaking.
• If annual energy effi ciency expenditures are large, lump sum recovery can have a measurable short-term impact on rates.
• Some have argued that expensing creates unequal treatment between the supply-side investments (which are rate-based) and the effi ciency investments that are intended to substitute for new supply.
• In addition to expending the annual $10 million base rate allowance, APS is obligated to spend, on average, at least another $6 million annually on approved eligible DSM-related items. These additional amounts are to be recovered by means of a DSM adjustment mechanism.
• All DSM programs must be pre-approved before APS may include their costs in any determination of total DSM costs incurred.
• The adjustment mechanism uses an adjustor rate, initially set at zero, which is to be reset on March 1, 2006, and thereafter on March 1 of each subsequent year. The adjustor is used only to recover costs in arrears. APS is required to file its proposal for spending in excess of $10 million prior to the March 1 adjustment. The perkilowatt-hour charge for the year will be calculated by dividing the account balance by the number of kilowatt-hours used by customers in the previous calendar year.
• General Service customers that are demand-billed will pay a per-kilowatt charge instead of a per-kilowatthour charge. The account balance allocated to the General Service class is divided by the kilowatt billing
determinant for the demand-billed customers in that class to determine the per-kilowatt DSM adjustor charge. The DSM adjustor applies to all customers taking delivery from the company, including direct access customers.
4.2.5 Case Study: Iowa Energy Effi ciency Cost Recovery Surcharge
Until 1997, electric energy effi ciency program costs were tracked in deferred accounts with recovery in a rate case via capitalization and amortization. Since then investor-owned utilities in Iowa, pursuant to Iowa Code 2001, Section 476.6,6 recover energy effi ciency program-related costs through an automatic rate pass-through reconciled annually to prevent over- or under-recovery (i.e., costs are expensed and recovered concurrently). Program costs are allocated within the rate classes to which the programs are directed, although certain program costs, such as those associated with low income and research and development programs, are allocated to all customers. The cost recovery surcharge is recalculated annually based on historical collections and expenses and planned budgets. The energy effi ciency costs recovered from customers during
National Action Plan for Energy Effi ciency 4-3
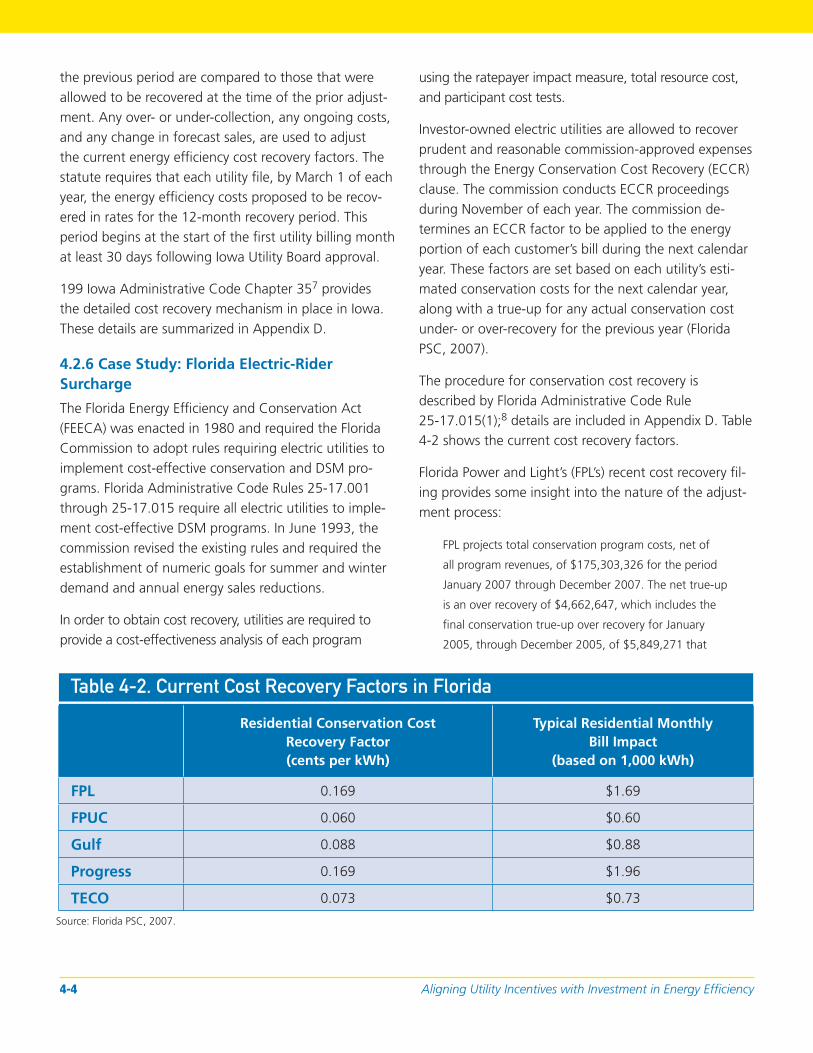
the previous period are compared to those that were allowed to be recovered at the time of the prior adjustment. Any over- or under-collection, any ongoing costs, and any change in forecast sales, are used to adjust the current energy effi ciency cost recovery factors. The statute requires that each utility fi le, by March 1 of each year, the energy effi ciency costs proposed to be recovered in rates for the 12-month recovery period. This period begins at the start of the fi rst utility billing month at least 30 days following Iowa Utility Board approval.
199 Iowa Administrative Code Chapter 357 provides the detailed cost recovery mechanism in place in Iowa. These details are summarized in Appendix D.
4.2.6 Case Study: Florida Electric-Rider Surcharge
The Florida Energy Effi ciency and Conservation Act (FEECA) was enacted in 1980 and required the Florida Commission to adopt rules requiring electric utilities to implement cost-effective conservation and DSM programs. Florida Administrative Code Rules 25-17.001 through 25-17.015 require all electric utilities to implement cost-effective DSM programs. In June 1993, the commission revised the existing rules and required the establishment of numeric goals for summer and winter demand and annual energy sales reductions.
In order to obtain cost recovery, utilities are required to provide a cost-effectiveness analysis of each program
using the ratepayer impact measure, total resource cost, and participant cost tests.
Investor-owned electric utilities are allowed to recover prudent and reasonable commission-approved expenses through the Energy Conservation Cost Recovery (ECCR) clause. The commission conducts ECCR proceedings during November of each year. The commission determines an ECCR factor to be applied to the energy portion of each customer’s bill during the next calendar year. These factors are set based on each utility’s estimated conservation costs for the next calendar year, along with a true-up for any actual conservation cost under- or over-recovery for the previous year (Florida PSC, 2007).
The procedure for conservation cost recovery is described by Florida Administrative Code Rule 25-17.015(1);8 details are included in Appendix D. Table 4-2 shows the current cost recovery factors.
Florida Power and Light’s (FPL’s) recent cost recovery fi ling provides some insight into the nature of the adjustment process:
FPL projects total conservation program costs, net of
all program revenues, of $175,303,326 for the period
January 2007 through December 2007. The net true-up
is an over recovery of $4,662,647, which includes the
fi nal conservation true-up over recovery for January
2005, through December 2005, of $5,849,271 that
Table 4-2. Current Cost Recovery Factors in Florida
Residential Conservation Cost Recovery Factor (cents per kWh)
Typical Residential Monthly Bill Impact
(based on 1,000 kWh)
FPL 0.169 $1.69
FPUC 0.060 $0.60
Gulf 0.088 $0.88
Progress 0.169 $1.96
TECO 0.073 $0.73
Source: Florida PSC, 2007.
Aligning Utility Incentives with Investment in Energy Effi ciency 4-4
was reported in FPL’s Schedule CT-1, fi led May 1, 2006.
Decreasing the projected costs of $175,303,326 by
the net true-up over-recovery of $4,662,647 results
in a total of $170,640,679 of conservation costs (plus
applicable taxes) to be recovered during the January
2007, through December 2007, period. Total recover
able conservation costs and applicable taxes, net of
program revenues and refl ecting any applicable over- or
under-recoveries are $170,705,441, and the conserva
tion cost recovery factors for which FPL seeks approval
are designed to recover this level of costs and taxes.
4.3 Capitalization and Amortization
of Energy Efficiency Program Costs
Capitalization as a cost recovery method is typically reserved for the costs of physical assets such as generating plant and transmission lines. However, some states allow the costs of energy effi ciency and demand-response programs to be treated as capital items, even though the utility is not acquiring any physical asset. In the case of an investor-owned utility, such capital items are included in the utility’s rate base. The utility is allowed to earn a return on this capital, and the investment is depreciated over time, with the depreciation charged as an expense. Depending on precisely how a capitalization mechanism is structured, it can serve as a strict cost-recovery tool or as a utility performance incentive mechanism as well. A principle argument made in favor of capitalizing energy effi ciency program costs is that this treatment places demand-and supply-side expenditures on an equal fi nancial footing.9,10
Capitalization11 currently is not a common approach to energy effi ciency program cost recovery, although during the peak of the last major cycle of utility energy effi ciency investment during the late 1980s and early 1990s many states allowed or required capitalization.12
Capitalization of energy effi ciency costs as a cost recovery mechanism fi rst appeared in the Pacifi c Northwest (Reid, 1988). Oregon and Idaho were the fi rst two
states to allow capitalization of certain selected costs in the early 1980s. Washington soon followed with statutory authority for ratebasing that included authorization for a higher return on energy effi ciency investments. Puget Power13 in Washington was allowed to ratebase all of its energy effi ciency–related costs using a 10-year recovery period with no carrying charges applied to the costs incurred between rate cases. Montana followed Washington in 1983 and adopted a similar mechanism. In 1986, Wisconsin switched from expensing the conservation expenditures to capitalization and allowed a large amount of direct investment to be capitalized with a 10-year amortization period.
With a very few exceptions, capitalization is no longer the method of choice for energy effi ciency cost recovery in these states. The decline in the popularity of this approach can be attributed to a variety of factors, including the general decline in utility energy effi ciency investment. However, in several states capitalization was abandoned, in part because the total costs associated with recovery (given the cost of the return on investment) were rising rapidly.
4.3.1 The Mechanics of Capitalization
As a simplifi ed example, suppose that a utility spends $1 million in each of fi ve years for its energy effi ciency programs, and it is allowed to capitalize and amortize these investments over a 10-year recovery period uniformly. Table 4-3 illustrates the yearly change in revenue requirements, assuming a 10 percent rate of return on the unrecovered balance.
By the end of the 15-year amortization period, the total amount collected by the utility through rates is $7,250,000. Just as the total cost of purchasing a home will be lower with a shorter mortgage, shorter amortization periods yield a lower total cost for recovery of the energy effi ciency program expenditures. Similarly, although the total amount recovered is almost 50 percent higher in this case than the direct cost of the energy effi ciency program, the $2,250,000 represents a legitimate cost to the utility which comes from the need
National Action Plan for Energy Effi ciency 4-5
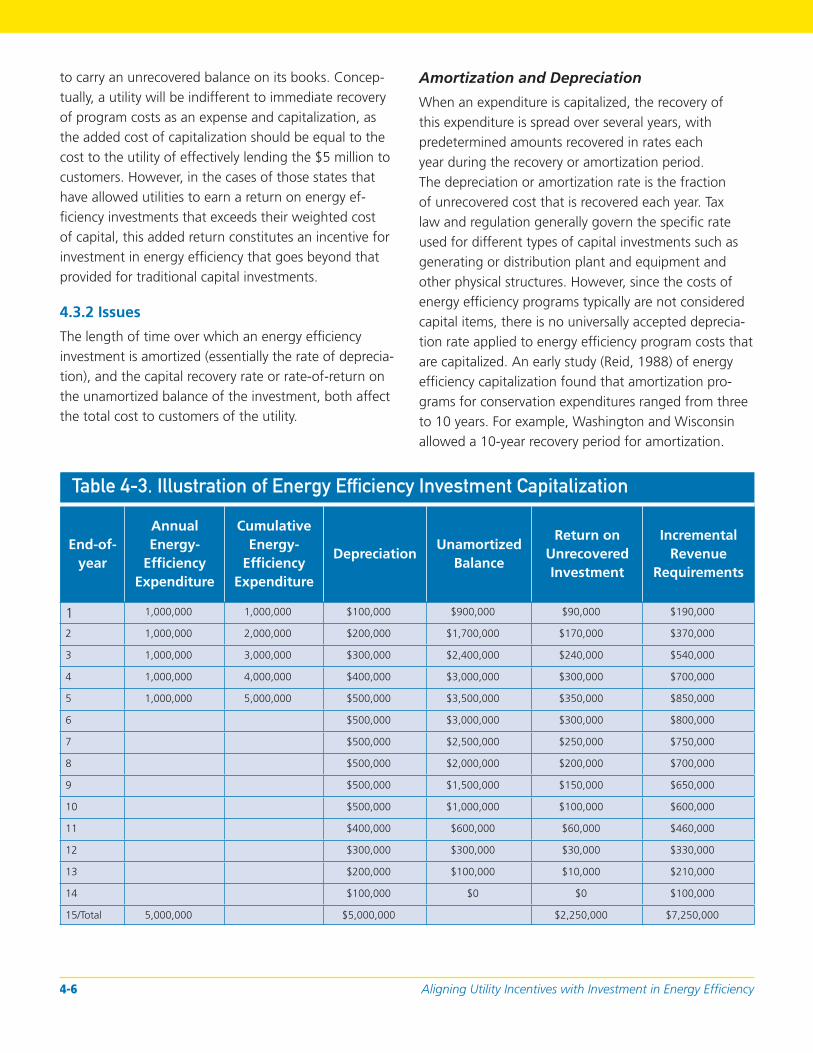
to carry an unrecovered balance on its books. Conceptually, a utility will be indifferent to immediate recovery of program costs as an expense and capitalization, as the added cost of capitalization should be equal to the cost to the utility of effectively lending the $5 million to customers. However, in the cases of those states that have allowed utilities to earn a return on energy effi ciency investments that exceeds their weighted cost of capital, this added return constitutes an incentive for investment in energy effi ciency that goes beyond that provided for traditional capital investments.
4.3.2 Issues
The length of time over which an energy effi ciency investment is amortized (essentially the rate of depreciation), and the capital recovery rate or rate-of-return on the unamortized balance of the investment, both affect the total cost to customers of the utility.
Amortization and Depreciation
When an expenditure is capitalized, the recovery of this expenditure is spread over several years, with predetermined amounts recovered in rates each year during the recovery or amortization period. The depreciation or amortization rate is the fraction of unrecovered cost that is recovered each year. Tax law and regulation generally govern the specifi c rate used for different types of capital investments such as generating or distribution plant and equipment and other physical structures. However, since the costs of energy effi ciency programs typically are not considered capital items, there is no universally accepted depreciation rate applied to energy effi ciency program costs that are capitalized. An early study (Reid, 1988) of energy effi ciency capitalization found that amortization programs for conservation expenditures ranged from three to 10 years. For example, Washington and Wisconsin allowed a 10-year recovery period for amortization.
Table 4-3. Illustration of Energy Efficiency Investment Capitalization
End-ofyear
Annual Energy-
Effi ciency Expenditure
Cumulative Energy-
Effi ciency Expenditure
Depreciation Unamortized
Balance
Return on Unrecovered Investment
Incremental Revenue
Requirements
1 1,000,000 1,000,000 $100,000 $900,000 $90,000 $190,000
2 1,000,000 2,000,000 $200,000 $1,700,000 $170,000 $370,000
3 1,000,000 3,000,000 $300,000 $2,400,000 $240,000 $540,000
4 1,000,000 4,000,000 $400,000 $3,000,000 $300,000 $700,000
5 1,000,000 5,000,000 $500,000 $3,500,000 $350,000 $850,000
6 $500,000 $3,000,000 $300,000 $800,000
7 $500,000 $2,500,000 $250,000 $750,000
8 $500,000 $2,000,000 $200,000 $700,000
9 $500,000 $1,500,000 $150,000 $650,000
10 $500,000 $1,000,000 $100,000 $600,000
11 $400,000 $600,000 $60,000 $460,000
12 $300,000 $300,000 $30,000 $330,000
13 $200,000 $100,000 $10,000 $210,000
14 $100,000 $0 $0 $100,000
15/Total 5,000,000 $5,000,000 $2,250,000 $7,250,000
Aligning Utility Incentives with Investment in Energy Effi ciency 4-6
Massachusetts used the lifetime of the energy effi ciency equipment for the recovery period.
Rate of Return14
Just as the interest rate on a home mortgage can greatly affect both the monthly payment and the total cost of the home, the rate of return allowed on the unamortized cost of an energy effi ciency program can signifi cantly affect the cost of that program to ratepayers. Rates-of-return for investor-owned utilities are set by state regulators based on the relative costs of debt and equity. In the case of publicly and cooperatively owned utilities, the return much more closely mirrors the cost of debt. The ROE, in turn, is based on an assessment of the fi nancial returns that investors in that utility would expect to receive—an expectation that is infl uenced by the perceived riskiness of the investment. This riskiness is related directly to the perceived likelihood that a utility will, for some reason, not be able to earn enough money to pay off the investment.
Unless the level of energy effi ciency program investment is signifi cant relative to a utility’s total unamortized capital investment, the relative riskiness of energy effi ciency versus supply-side investments is not a major issue. However, if this investment is signifi cant, the relative risk of an energy effi ciency investment can become an issue for a variety of reasons, including:
• These resources are not backed by physical assets. While a utility actually owns gas distribution mains or generating plants, it does not own an effi cient air conditioner that a customer installs through a utility program. If energy effi ciency spending is accrued for future recovery, either by expensing or amortization, this accrual is considered as a “regulatory asset”—an asset created by regulatory policy that is not backed by an actual plant or equipment. Carrying substantial regulatory assets on the balance sheet can hurt a utility’s fi nancial rating.
• The investment becomes more susceptible to disallowance. Recovery of a capital investment typically is allowed only for investments deemed prudent and used-and-useful. Because energy effi ciency programs are based on customer behavior, and because that
behavior is diffi cult to predict, it is possible that the investment being recovered does not actually produce its intended benefi t. This result could lead regulators to conclude that the investment was not prudent or used-and-useful. This risk owes more to the fact that energy effi ciency program effectiveness is subject to ex post evaluation. As program design and implementation experience grows, program realization rates (the ratio of actual to expected savings) increases, and this risk diminishes. It is not clear that this risk is any different with respect to its ultimate effect than the risks associated with the construction and operation of a utility plant.
• Potential uncertainty arising from policy changes that govern energy effi ciency incentive mechanisms heightens the risk. Although both supply- and demand-side resources are subject to policy risk, the modularity and short lead-times associated with de-mand-side resources (which is a distinct benefi t from a resource planning perspective) also create more opportunities to revisit the policies governing energy effi ciency expenditure and cost recovery. The fact that energy effi ciency program costs are regulatory assets in theory, means that the regulatory policy underlying those assets can change with changes in the regulatory environment. The pressure to modify policies governing recovery of program costs has increased historically as the size of these assets has grown with increases in program funding.
4.3.3 Pros and Cons
Based on experience to date, capitalization and amortization carries pros and cons as illustrated in Table 4-4.
4.3.4 Case Study: Nevada Electric Capitalization with ROE Bonus
Nevada is the only state currently that allows recovery of energy efficiency program costs using capitalization as well as a bonus return on those costs. Development and administration of energy efficiency programs by Nevada’s regulated electric utilities takes place within the context of an integrated resource planning process combined with a resource portfolio standard that allows energy efficiency programs to fulfill up to 25 percent of the utilities’
National Action Plan for Energy Effi ciency 4-7
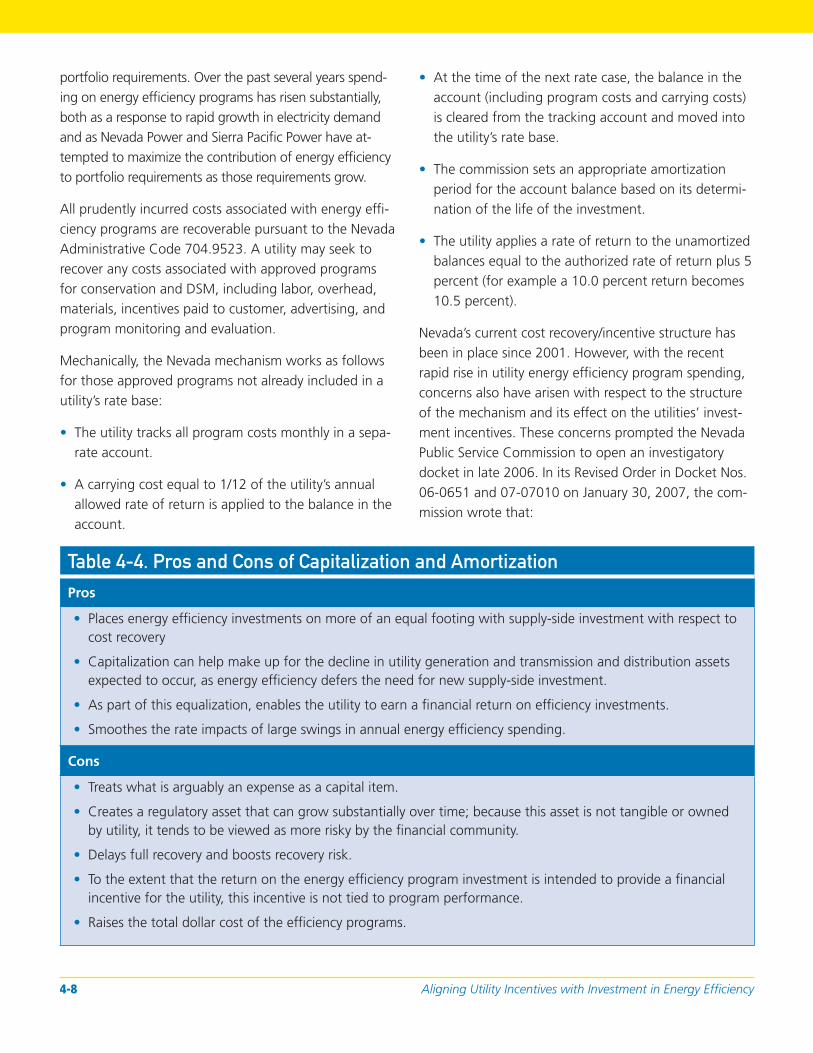
portfolio requirements. Over the past several years spending on energy efficiency programs has risen substantially, both as a response to rapid growth in electricity demand and as Nevada Power and Sierra Pacific Power have attempted to maximize the contribution of energy effi ciency to portfolio requirements as those requirements grow.
All prudently incurred costs associated with energy effi ciency programs are recoverable pursuant to the Nevada Administrative Code 704.9523. A utility may seek to recover any costs associated with approved programs for conservation and DSM, including labor, overhead, materials, incentives paid to customer, advertising, and program monitoring and evaluation.
Mechanically, the Nevada mechanism works as follows for those approved programs not already included in a utility’s rate base:
• The utility tracks all program costs monthly in a separate account.
• A carrying cost equal to 1/12 of the utility’s annual allowed rate of return is applied to the balance in the account.
• At the time of the next rate case, the balance in the account (including program costs and carrying costs) is cleared from the tracking account and moved into the utility’s rate base.
• The commission sets an appropriate amortization period for the account balance based on its determination of the life of the investment.
• The utility applies a rate of return to the unamortized balances equal to the authorized rate of return plus 5 percent (for example a 10.0 percent return becomes 10.5 percent).
Nevada’s current cost recovery/incentive structure has been in place since 2001. However, with the recent rapid rise in utility energy effi ciency program spending, concerns also have arisen with respect to the structure of the mechanism and its effect on the utilities’ investment incentives. These concerns prompted the Nevada Public Service Commission to open an investigatory docket in late 2006. In its Revised Order in Docket Nos. 06-0651 and 07-07010 on January 30, 2007, the commission wrote that:
Table 4-4. Pros and Cons of Capitalization and Amortization
Pros
• Places energy effi ciency investments on more of an equal footing with supply-side investment with respect to cost recovery
• Capitalization can help make up for the decline in utility generation and transmission and distribution assets expected to occur, as energy effi ciency defers the need for new supply-side investment.
• As part of this equalization, enables the utility to earn a fi nancial return on effi ciency investments.
• Smoothes the rate impacts of large swings in annual energy effi ciency spending.
Cons
• Treats what is arguably an expense as a capital item.
• Creates a regulatory asset that can grow substantially over time; because this asset is not tangible or owned by utility, it tends to be viewed as more risky by the fi nancial community.
• Delays full recovery and boosts recovery risk.
• To the extent that the return on the energy effi ciency program investment is intended to provide a fi nancial incentive for the utility, this incentive is not tied to program performance.
• Raises the total dollar cost of the effi ciency programs.
Aligning Utility Incentives with Investment in Energy Effi ciency 4-8
[We] believe that appropriate incentives for utility DSM
programs are necessary. The exact nature and form of
incentives that should be offered for such programs in
volve a number of factors, including the regulatory and
statutory environment. The current incentives for DSM
were implemented in 2001 when the companies had
few, if any, incentives to implement DSM programs. The
enactment of A.B. 3 changed both the regulatory and
statutory context. Utilities now have incentives to imple
ment DSM to meet portions of their respective renew
able portfolio standard requirements. Nevada Power
Company’s expenditures will increase almost four times
compared to pre A.B. 3 during this action plan. Given
these changes, it is now time to reexamine the manda
tory package of incentives provided to DSM programs.
This includes the types and categories of costs eligible
for expense treatment, as well as prescribed incentives.
The commission therefore directs its secretary to open
an investigation and rulemaking into the appropriate
ness of DSM cost recovery mechanisms and incentives.
In early 2007, the commission asked all interested parties to comment on four specifi c issues, as identifi ed below:
• What are the public policy objectives of an incentive structure? i.e., Should only the most cost-effective programs be incented? Should only the most strategic programs be incented?
• Does the current incentive structure provide the appropriate incentives to fulfi ll each public policy objective?
• Are there alternative incentive structures that the commission should consider? If so, what are these incentives and how would each further the goals identifi ed above?
• How should the current incentive structure be redesigned? i.e., what expenses should be included in the incentive mechanism? What should be the basis for determining incentives?
Commission staff have argued that the underlying rationale for utility energy effi ciency investments is
found in the integrated resource planning process. Staff noted that utilities should be inclined to pursue those programs that contribute to the least-cost resource mix. The addition of the resource portfolio requirement and the ability to meet up to 25 percent of that requirement provides further incentive to pursue energy effi ciency investment. At the same time, staff argued that the current cost recovery mechanism, with the addition of the fi ve percentage point rate of return bonus, provided no incentive for effective program performance and in fact, simply encouraged additional spending with no consideration for the implementation outcome—an argument echoed by the Attorney General’s Bureau of Consumer Protection. Staff recommended that the ideal solution is to tie incentives to program performance and to share program net benefi ts with ratepayers.
Nevada Power Company and Sierra Pacifi c Power Company have endorsed the existing mechanism as providing appropriate incentives to fulfi ll the public policy objective of achieving a net benefi t for customers while providing a stable and motivating incentive for the utility. According to the companies, the current incentive scheme with the bonus rate of return recognizes the increased risks associated with DSM investments compared to the supply-side investments, and they argue that changing the existing incentive structure will create uncertainty and therefore, increase the perceived risk associated with energy effi ciency investments. They further argue that the integrated resource plan review process ensures that program budgets are given detailed review.
4.4 Notes
1. Depreciation of capital equipment is, however, treated as an expense.
2. An “opt-out” allows a customer, typically a large customer, to elect to not participate in a utility program and to avoid paying associated program costs. Some states do not allow opt-outs, but will allow large customers to spend the monies that otherwise would be collected from them by utilities for effi ciency projects in their own facilities. This often is called “self-direction.”
3. Wisconsin investor-owned utilities use “escrow accounting” as a form of a balancing account. Should the Public Service
National Action Plan for Energy Effi ciency 4-9
Commission authorize a utility to incur specifi c program costs during a period between rate cases, these costs are recorded in an escrow account. Carrying charges are applied to the balance. The balance of the escrow account is cleared into the revenue requirement at the time of the next rate case (typically every two years).
4. As discussed elsewhere in this paper, addressing recovery of program costs as a separate matter apart from all other utility cost changes could be considered single-issue ratemaking which can be prohibited.
5. Order No. 67744, In the Matter of the Application of the Arizona Public Service Company for a Hearing to Determine the Fair Value of the Utility Property of the Company for Ratemaking Purposes, to Fix a Just and Reasonable Rate of Return Thereon, to Approve Rate Schedules Designed to Develop such Return, and for Approval of Purchased Power Contract, Docket No. E01345-A-03-0437, accessed at <www.azcc.gov/divisions/utilities/ electric/APS-FinalOrder.pdf>.
6. Iowa Code 2001: Section 476.6, accessed at <www.legis.state. ia.us/IACODE/2001/476/6.html>.
7. 199 Iowa Administrative Code Chapter 35, accessed at <www. legis.state.ia.us/Rules/Current/iac/199iac/19935/19935.pdf>.
8. Florida Administrative Code Rule 25-17.015(1), accessed at <www.fl rules.org/gateway/RuleNo.asp?ID=25-17.015>.
9. Some have argued that capitalization and amortization of energy effi ciency program costs provides an incentive to utilities to invest in energy effi ciency without regard to the performance of the programs. See the Nevada case study below for a broader treatment of this issue.
10. From a narrow theoretical perspective, there should be no signifi cant fi nancial difference between expensing and capitalization. The return on capital is intended to compensate a utility for the cost of money used to fund an activity. For investor-owned utilities, this compensation includes payment to equity investors. However, if program expenses are immediately expensed—that is, if the utility can immediately recover each dollar it expends on a program—the utility does not need to “advance” capital to fund the programs, and therefore, there is no cost incurred by the utility.
11. This Report uses the generic term “capitalization” as opposed to “ratebasing,” since, in some states, energy effi ciency program costs technically are not included in a utility’s rate base but are treated in a similar fashion via capitalization.
12. The following states either have used in the past or continue to use some form of capitalization of energy effi ciency costs: Oregon, Idaho, Washington, Montana, Texas, Wisconsin, Nevada, Oklahoma, Connecticut, Maine, Massachusetts, Vermont, and Iowa. With the exception of Nevada, most of these states are no longer using capitalization, though it remains an option. See Reid, M. (1988). Ratebasing of Utility Conservation and Load Management Programs. The Alliance to Save Energy.
13. Puget Power is now known as Puget Sound Energy.
14. “Rate of return” is used in this context to refer to the rate applied to an unamortized balance that is used to represent the cost of money to the utility. In the case of investor-owned utilities, this rate is usually a weighted average of the interest rate on debt and the allowed return on equity.
Aligning Utility Incentives with Investment in Energy Effi ciency 4-10
5: Lost Margin Recovery
This chapter provides a practical overview of alternative mechanisms to address the recovery of lost margins and presents their pros and cons. Detailed case studies are provided for each mechanism.
5.1 Overview
Chapter 2 of the Action Plan provides a concise explanation of the throughput incentive and a summary of options to mitigate the incentive. This incentive has been identifi ed by many as the primary barrier to aggressive utility investment in energy effi ciency. Policy expectations that utilities aggressively pursue the implementation of energy effi ciency programs create a confl ict of interest for utilities in that they cannot fulfi ll their obligations to their shareholders while simultaneously encouraging energy effi ciency efforts of their customers, which will reduce their sales and margins in the presence of the throughput incentive.
Any approach aiming to eliminate, or at least neutralize, the impact of the throughput incentive on effective implementation of energy effi ciency programs must address the issue of lost margins due to successful energy effi ciency programs. Two major cost recovery approaches have been tried since the 1980s with this objective in mind; decoupling and lost revenue recovery.1 A third approach, known generically as straight fi xed-variable (SFV) ratemaking, conceptually provides a solution to the problem by allocating most or all fi xed costs to a fi xed (non-volumetric) charge. Under such a rate design, reductions in the volume of sales do not affect recovery of fi xed costs. While conceptually appealing, this approach carries with it complex implementation issues associated with the transition from a structure that recovers fi xed costs via volumetric charges to a SFV structure. It also can reduce the fi nancial incentive for end-users to pursue energy effi ciency investments by reducing the value that consumers realize by reducing the volume of consumption—an issue more likely to impact electricity consumers than gas customers, since commodity cost
represents a larger share of a consumer’s total gas bill. While it has seen application in the natural gas industry, SFV ratemaking is uncommon in the electric industry (see American Gas Association, 2007).
5.2 Decoupling
The term “decoupling” is used generically to represent a variety of methods for severing the link between revenue recovery and sales. These methods vary widely in scope, and it is rare that a mechanism fully decouples sales and revenues. Some approaches provide for limited true-ups in attempts to ensure that utilities continue to bear the risks for sales changes unrelated to energy effi ciency programs. Some focus on preserving recovery of lost margins. This focus recognizes that a sales reduction will be accompanied by some cost reduction, and therefore, the total revenue requirement will be lower. Truing up total revenue would, in such cases, boost utility earnings.
In recent years, decoupling has re-emerged as an approach to address the margin recovery issue facing utilities implementing substantial energy effi ciency program investments. Decoupling can be defi ned generally as a separation of revenues and profi ts from the volume of energy sold and, in theory, makes a utility indifferent to sales fl uctuations. Mechanically, decoupling trues-up revenues via a price adjustment when actual sales are different than the projected or test year levels.
Decoupling mechanisms appear under various names including the following listed by the National Regulatory Research Institute (Costello, 2006): Conservation Margin Tracker; Conservation-Enabling Tariff; Conservation Tariff; Conservation Rider; Conservation and Usage Adjustment
National Action Plan for Energy Effi ciency 5-1
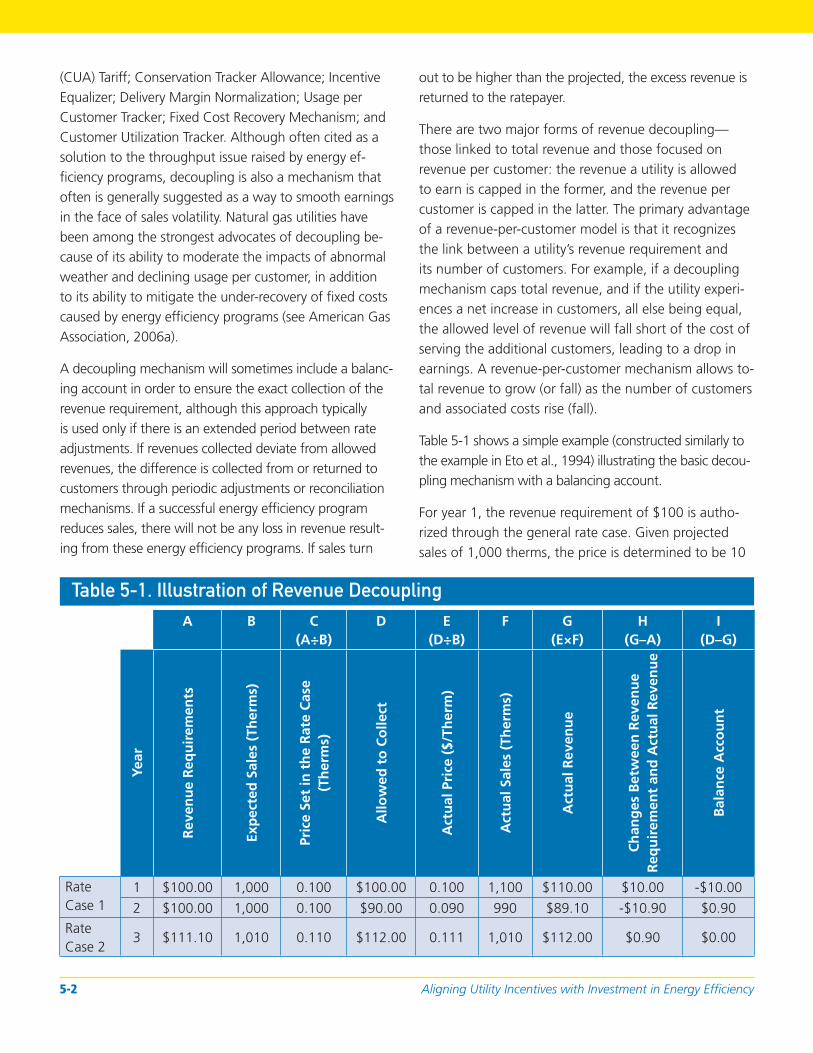
(CUA) Tariff; Conservation Tracker Allowance; Incentive Equalizer; Delivery Margin Normalization; Usage per Customer Tracker; Fixed Cost Recovery Mechanism; and Customer Utilization Tracker. Although often cited as a solution to the throughput issue raised by energy effi ciency programs, decoupling is also a mechanism that often is generally suggested as a way to smooth earnings in the face of sales volatility. Natural gas utilities have been among the strongest advocates of decoupling because of its ability to moderate the impacts of abnormal weather and declining usage per customer, in addition to its ability to mitigate the under-recovery of fi xed costs caused by energy effi ciency programs (see American Gas Association, 2006a).
A decoupling mechanism will sometimes include a balancing account in order to ensure the exact collection of the revenue requirement, although this approach typically is used only if there is an extended period between rate adjustments. If revenues collected deviate from allowed revenues, the difference is collected from or returned to customers through periodic adjustments or reconciliation mechanisms. If a successful energy effi ciency program reduces sales, there will not be any loss in revenue resulting from these energy efficiency programs. If sales turn
out to be higher than the projected, the excess revenue is returned to the ratepayer.
There are two major forms of revenue decoupling— those linked to total revenue and those focused on revenue per customer: the revenue a utility is allowed to earn is capped in the former, and the revenue per customer is capped in the latter. The primary advantage of a revenue-per-customer model is that it recognizes the link between a utility’s revenue requirement and its number of customers. For example, if a decoupling mechanism caps total revenue, and if the utility experiences a net increase in customers, all else being equal, the allowed level of revenue will fall short of the cost of serving the additional customers, leading to a drop in earnings. A revenue-per-customer mechanism allows total revenue to grow (or fall) as the number of customers and associated costs rise (fall).
Table 5-1 shows a simple example (constructed similarly to the example in Eto et al., 1994) illustrating the basic decoupling mechanism with a balancing account.
For year 1, the revenue requirement of $100 is authorized through the general rate case. Given projected sales of 1,000 therms, the price is determined to be 10
Table 5-1. Illustration of Revenue Decoupling
A B C (A÷B)
D E (D÷B)
F G (E×F)
H (G–A)
I (D–G)
Year
Rev
enu
e R
equ
irem
ents
Exp
ecte
d S
ales
(Th
erm
s)
Pric
e Se
t in
th
e R
ate
Cas
e(T
her
ms)
Allo
wed
to
Co
llect
Act
ual
Pri
ce (
$/Th
erm
)
Act
ual
Sal
es (
Ther
ms)
Act
ual
Rev
enu
e
Ch
ang
es B
etw
een
Rev
enu
eR
equ
irem
ent
and
Act
ual
Rev
enu
e
Bal
ance
Acc
ou
nt
Rate Case 1
1 $100.00 1,000 0.100 $100.00 0.100 1,100 $110.00 $10.00 -$10.00
2 $100.00 1,000 0.100 $90.00 0.090 990 $89.10 -$10.90 $0.90 Rate Case 2
3 $111.10 1,010 0.110 $112.00 0.111 1,010 $112.00 $0.90 $0.00
Aligning Utility Incentives with Investment in Energy Effi ciency 5-2
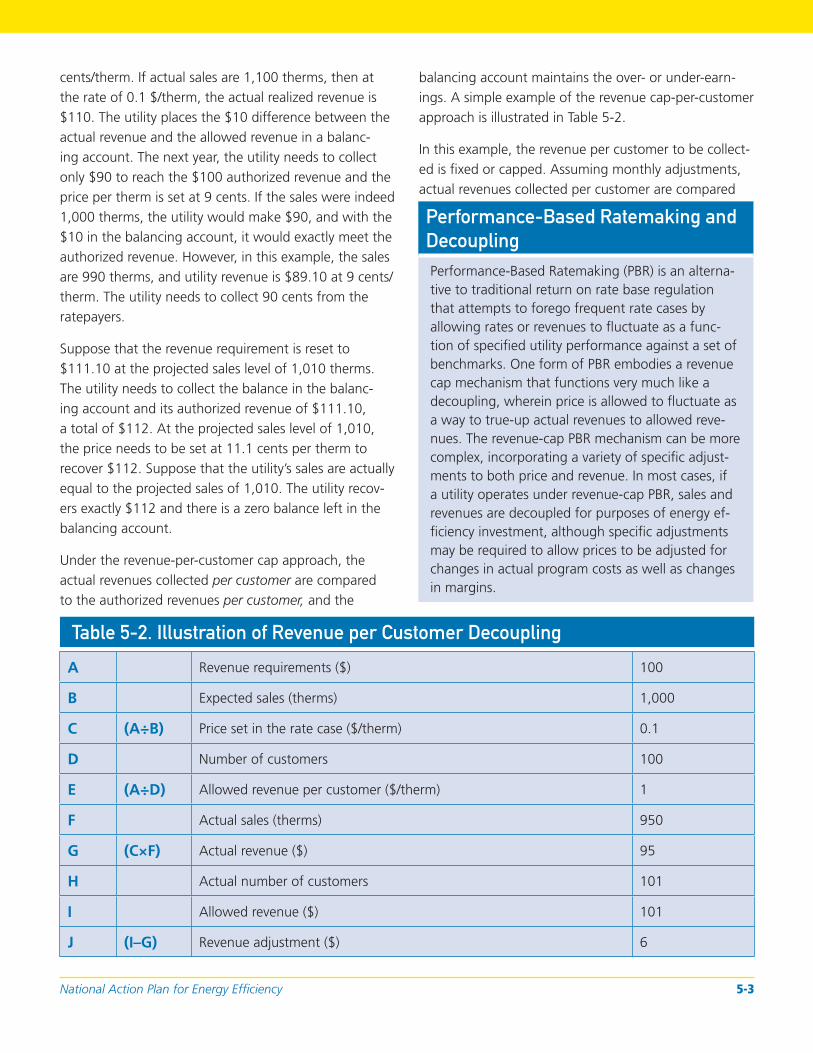
cents/therm. If actual sales are 1,100 therms, then at the rate of 0.1 $/therm, the actual realized revenue is $110. The utility places the $10 difference between the actual revenue and the allowed revenue in a balancing account. The next year, the utility needs to collect only $90 to reach the $100 authorized revenue and the price per therm is set at 9 cents. If the sales were indeed 1,000 therms, the utility would make $90, and with the $10 in the balancing account, it would exactly meet the authorized revenue. However, in this example, the sales are 990 therms, and utility revenue is $89.10 at 9 cents/ therm. The utility needs to collect 90 cents from the ratepayers.
Suppose that the revenue requirement is reset to $111.10 at the projected sales level of 1,010 therms. The utility needs to collect the balance in the balancing account and its authorized revenue of $111.10, a total of $112. At the projected sales level of 1,010, the price needs to be set at 11.1 cents per therm to recover $112. Suppose that the utility’s sales are actually equal to the projected sales of 1,010. The utility recovers exactly $112 and there is a zero balance left in the balancing account.
Under the revenue-per-customer cap approach, the actual revenues collected per customer are compared to the authorized revenues per customer, and the
balancing account maintains the over- or under-earnings. A simple example of the revenue cap-per-customer approach is illustrated in Table 5-2.
In this example, the revenue per customer to be collected is fi xed or capped. Assuming monthly adjustments, actual revenues collected per customer are compared
Performance-Based Ratemaking and
Decoupling
Performance-Based Ratemaking (PBR) is an alternative to traditional return on rate base regulation that attempts to forego frequent rate cases by allowing rates or revenues to fl uctuate as a function of specifi ed utility performance against a set of benchmarks. One form of PBR embodies a revenue cap mechanism that functions very much like a decoupling, wherein price is allowed to fl uctuate as a way to true-up actual revenues to allowed revenues. The revenue-cap PBR mechanism can be more complex, incorporating a variety of specifi c adjustments to both price and revenue. In most cases, if a utility operates under revenue-cap PBR, sales and revenues are decoupled for purposes of energy effi ciency investment, although specifi c adjustments may be required to allow prices to be adjusted for changes in actual program costs as well as changes in margins.
Table 5-2. Illustration of Revenue per Customer Decoupling
A
B
Revenue requirements ($)
Expected sales (therms)
100
1,000
C (A÷B) Price set in the rate case ($/therm) 0.1
D Number of customers 100
E (A÷D) Allowed revenue per customer ($/therm) 1
F Actual sales (therms) 950
G (C×F) Actual revenue ($) 95
H Actual number of customers 101
I Allowed revenue ($) 101
J (I–G) Revenue adjustment ($) 6
National Action Plan for Energy Effi ciency 5-3
to the allowed revenue per customer for that month. The difference is recorded in a balancing account and reconciled periodically. In this case, because of customer growth, the utility is allowed to collect $6 more than the initial revenue requirement.
Revenue decoupling has been a part of gas ratemaking for over two decades, with revenue cap-per-customer the more commonly encountered approach.2 Interest has increased over the past several years due to increased customer conservation in response to high gas prices and utility-funded energy effi ciency initiatives. In addition, natural gas usage per household has declined more than 20 percent since the 1980s and is projected to continue to decline in the future in many jurisdictions (Costello, 2006). In such cases, decoupling provides an automatic adjustment mechanism that allows the utility to be revenue neutral and can help defer otherwise needed rate cases.
Early experience with decoupling, as recounted in Chapter 2 of the Action Plan, provides important lessons.3
In 1991, the Maine PUC adopted a revenue decoupling mechanism in the form of revenue-per-customer cap for Central Maine Power (CMP) on a three-year trial basis. The utility’s allowed revenue was determined through a rate case and adjusted annually in accordance with changes in the number of customers. CMP was allowed to fi le a rate case at any time to adjust its authorized revenues. With the economic downturn Maine experienced around the time the mechanism was in place, sales dipped signifi cantly leading to a large unrecovered balance ($52 million by the end of 1992) that needed to be charged to the ratepayers. In fact, the portion of the energy effi ciency-related drop in the sales was very small. Nevertheless, the program in its entirety was terminated in 1993.
Currently, a number of jurisdictions are investigating the advantages and disadvantages of decoupling, including Arizona, Colorado, Delaware, the District of Columbia, Delaware, Hawaii, Kentucky, Maryland, Michigan, New Hampshire, New Mexico, Pennsylvania, Tennessee, and Virginia. Sixteen states have adopted either gas or electric decoupling programs for at least one utility.
Arkansas, New York, Utah, Oregon, Washington, Idaho, and Minnesota are among the states recently adopting decoupling programs.4
Table 5-3 suggests the possible pros and cons of decoupling. The specifi c nature of the decoupling mechanism and, in particular, the nature of adjustments for factors such as weather and economic growth, will determine the extent to which the link between sales and profi ts is affected.
5.2.1 Case Study: Idaho’s Fixed Cost Recovery Pilot Program
The mechanism adopted in Idaho to address the impacts of effi ciency program-induced changes in sales should not be viewed as decoupling in the broadest sense of that term. While it contains a number of the elements found in decoupling plans, it is focused specifi cally on recovery of lost fi xed-cost revenues. The Idaho Public Utilities Commission initiated Case No. IPC-04-15 in August 2004, to investigate fi nancial disincentives to investment in energy effi ciency by Idaho Power Company. A series of workshops was conducted, and a written report was fi led with the commission in early 2005. The report pointed to two action items:
1. The development of a true-up simulation to track what might have occurred if a decoupling or true-up mechanism had been implemented for Idaho Power at the time of the last general rate case.
2. The fi ling of a pilot energy effi ciency program that would incorporate both performance incentives and fi xed-cost recovery.
During the investigation, the parties agreed that there were disincentives preventing higher energy effi ciency investment by Idaho Power, but no agreement was reached on whether or not the return of lost fi xed-cost revenues would result in removing the disincentives. The parties agreed to conduct a simulation of the proposed mechanism, the results of which indicated that lost fi xed-cost revenues, in fact, produced barriers to energy effi ciency investments and, therefore, a three-year pilot mechanism to allow recovery of fi xed-cost revenue losses should be approved.
Aligning Utility Incentives with Investment in Energy Effi ciency 5-4
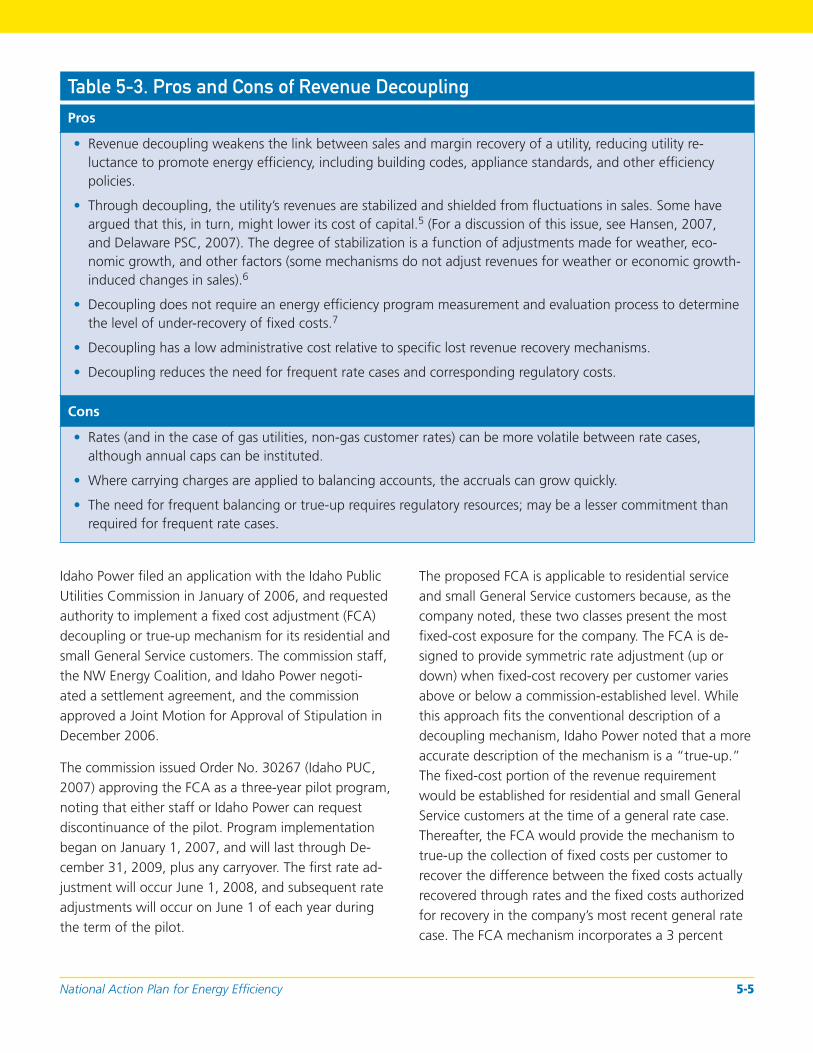
Table 5-3. Pros and Cons of Revenue Decoupling
Pros
• Revenue decoupling weakens the link between sales and margin recovery of a utility, reducing utility reluctance to promote energy effi ciency, including building codes, appliance standards, and other effi ciency policies.
• Through decoupling, the utility’s revenues are stabilized and shielded from fl uctuations in sales. Some have argued that this, in turn, might lower its cost of capital.5 (For a discussion of this issue, see Hansen, 2007, and Delaware PSC, 2007). The degree of stabilization is a function of adjustments made for weather, economic growth, and other factors (some mechanisms do not adjust revenues for weather or economic growth-induced changes in sales).6
• Decoupling does not require an energy effi ciency program measurement and evaluation process to determine the level of under-recovery of fi xed costs.7
• Decoupling has a low administrative cost relative to specifi c lost revenue recovery mechanisms.
• Decoupling reduces the need for frequent rate cases and corresponding regulatory costs.
Cons
• Rates (and in the case of gas utilities, non-gas customer rates) can be more volatile between rate cases, although annual caps can be instituted.
• Where carrying charges are applied to balancing accounts, the accruals can grow quickly.
• The need for frequent balancing or true-up requires regulatory resources; may be a lesser commitment than required for frequent rate cases.
Idaho Power fi led an application with the Idaho Public Utilities Commission in January of 2006, and requested authority to implement a fi xed cost adjustment (FCA) decoupling or true-up mechanism for its residential and small General Service customers. The commission staff, the NW Energy Coalition, and Idaho Power negotiated a settlement agreement, and the commission approved a Joint Motion for Approval of Stipulation in December 2006.
The commission issued Order No. 30267 (Idaho PUC, 2007) approving the FCA as a three-year pilot program, noting that either staff or Idaho Power can request discontinuance of the pilot. Program implementation began on January 1, 2007, and will last through December 31, 2009, plus any carryover. The fi rst rate adjustment will occur June 1, 2008, and subsequent rate adjustments will occur on June 1 of each year during the term of the pilot.
The proposed FCA is applicable to residential service and small General Service customers because, as the company noted, these two classes present the most fi xed-cost exposure for the company. The FCA is designed to provide symmetric rate adjustment (up or down) when fi xed-cost recovery per customer varies above or below a commission-established level. While this approach fi ts the conventional description of a decoupling mechanism, Idaho Power noted that a more accurate description of the mechanism is a “true-up.” The fi xed-cost portion of the revenue requirement would be established for residential and small General Service customers at the time of a general rate case. Thereafter, the FCA would provide the mechanism to true-up the collection of fi xed costs per customer to recover the difference between the fi xed costs actually recovered through rates and the fi xed costs authorized for recovery in the company’s most recent general rate case. The FCA mechanism incorporates a 3 percent
National Action Plan for Energy Effi ciency 5-5

cap on annual increases, with carryover of unrecovered deferred costs to subsequent years.
The actual number of customers in the adjustment year for each customer class to which the mechanism applies is multiplied by the assumed fi xed cost per customer, which is determined by dividing the total fi xed costs by the total number of customers from the last general rate case. This allowed fi xed-cost recovery amount is compared with the amount of fi xed costs actually recovered by the Idaho Power. The actual fi xed-cost recovery is determined by multiplying the weather-normalized sales for each class by the fi xed-cost per kilowatt-hour rate also determined in the general rate case. The difference between the allowed and the actual fi xed-cost recovered amounts is the fi xed-cost adjustment for each class.
For customer billing purposes only, the commission-approved FCA adjustment is combined with the conservation program funding charge.
While recognizing the potential value of the true-up mechanism, parties have taken a cautious approach that allows the company and the commission to gain experience in implementing, monitoring, and evaluating the program. And, since the program is a pilot, program corrections or cessation will take place if it is found unsuccessful or if unintended consequences develop. From the commission’s perspective, the company must demonstrate an “enhanced commitment” to energy effi ciency investment resulting from implementation of the FCA, including making effi ciency and load management programs widely available, supporting building code improvement activity, pursuing appliance standards, and expanding of DSM programs.
Despite the approval of the pilot, the commission staff raised a number of the technical issues related to the relationship between energy effi ciency program implementation and the application of the true-up mechanism. Given that the success of the mechanism is being determined in part by how it affects the company’s investment in energy effi ciency, several issues were raised regarding how that commitment was to be measured and, specifi cally, how evidence of that commitment could be distinguished from factors affecting sales per customer
unrelated to the company’s energy effi ciency efforts. The commission noted that FCA will require close monitoring, and the development of proper metrics to evaluate the company’s performance remains an issue.
5.2.2 Case Study: New Jersey Gas Decoupling
A relatively novel decoupling mechanism has recently been approved in New Jersey. In late 2005, New Jersey Natural Gas (NJNG) and South Jersey Gas (SJG) jointly fi led proposals with the New Jersey Board of Public Utilities to implement a CUA clause in a fi ve-year pilot program. The CUA was proposed as a way to “[s]eparate the companies’ margin recoveries from throughput and to adjust margin recoveries for variances in customer usage, enabling the companies to aggressively promote conservation and energy effi ciency by their customers” (New Jersey BPU, 2006).
The companies, the New Jersey Utility Board Staff, and the Department of the Public Advocate reached a settlement agreement that was approved by the New Jersey Commission in October 2006. Through the settlement, the proposed CUA was modifi ed and implemented on a three-year pilot basis and renamed as the Conservation Incentive Program (CIP). The CIP replaced the Weather Normalization Clause, which helped cover weather-related fl uctuations. The CIP is an incentive-based program that:
• Requires the companies to implement shareholder-funded conservation programs designed to aid customers in reducing their costs of natural gas and to reduce each utility’s peak winter and design day system demand.
• Requires the companies to reduce gas supply related costs.
• Allows the companies to recover from customers certain non-weather margin revenue losses limited to the level of gas supply cost savings achieved.
The companies are required to make annual CIP fi lings, based on seven months of actual data and fi ve months of projected data, with a June 1 fi ling date. The fi lings are to document actual results, perform the required
Aligning Utility Incentives with Investment in Energy Effi ciency 5-6
CIP collection test, and propose the new CIP rate. Any variances from the annual fi lings will be trued up in the subsequent year. The board has reserved the right to review any aspect of the companies’ programs, including, but not limited to, the suffi ciency of program funding.
The CIP tariffs include ROE limitations on recoveries from customers for both the weather and non-weatherrelated components. In the case of South Jersey Gas, the ROE was set at the level of the company’s most recent general rate case. The ROE for New Jersey Natural Gas was set at 10.5 percent (compared to its most recently authorized rate of 11.5 percent).
The most signifi cant element of the CIP tariff is its requirement that, as a condition for decoupling, the utilities must reduce gas supply costs—the so-called Basic Gas Supply Service (BGSS) savings—such that consumers see no net change in costs.
The methodology employed to calculate the non-weather-related CIP surcharge, if any, is delineated in paragraph 33(a) of the stipulation. If the non-weatherrelated CIP recovery is less than or equal to the level of available gas cost savings, the amount will be eligible for recovery through the CIP tariffs. Any portion of the non-weather CIP value that exceeds the available gas cost savings will not be recovered in the current period, will be deferred up to three years, and will be subject to an eligibility test in the subsequent period. Deferred CIP surcharges may be recovered in a future period to the extent that available gas cost savings are available to offset the deferred amount. If the pilot is terminated after the initial period, any remaining deferred CIP surcharges will not be recovered. The value of any BGSS savings during one year in excess of the non-weather CIP value cannot be carried forward for use in future year calculations.
NJNG will provide $2 million for program costs and SJG will provide $400,000 for each year of the pilot program, all of which will come from shareholders. The companies are required to provide the full cost of the programs, even if the program costs exceed the budgeted levels.
In approving the stipulation, the commission concluded with the following:
With the CIP and the possible recovery of non-weather
related margin losses, the utilities have represented
that they will actively promote conservation and energy
effi ciency by their customers through programs funded
by their shareholders. The programs are not to replicate
existing CEP programs and are to include, among other
things, customized customer communications and
outreach built upon the utilities’ relationships with their
customers. While not replicating existing CEP programs,
the CIP programs include initiatives that promote
customers’ use of CEP programs through consistent
messaging with the CEP programs. At the same time,
by limiting non-weather-related CIP recovery by gas
supply cost reductions, in addition to an earnings cap,
the CIP gives recognition to the nexus between reduc
tions in long-term usage and reductions in gas supply
capacity requirements. By limiting any non-weather CIP
recovery to offsetting gas supply cost reductions, the
CIP does not just provide the utilities with a mechanism
for rate recovery but ensures that the CIP results in an
appropriate, concomitant reduction in gas supply costs
borne by customers. In this way, customers taking BGSS
will not incur any overall net rate increases arising from
non-weather related load losses.
(New Jersey BPU, 2006)
New Jersey Resources (NJR) recently reported its experience with the CIP. NJNG, NJR’s largest subsidiary, realized 6.6 percent increase in its fi rst-quarter earnings over last year due primarily to the impact of the recently approved CIP. The company states in a recent press release that:
[Our] conservation Incentive Program has performed
as intended, and has resulted in lower gas costs for
customers and improved fi nancial results for our shar
eowners. This innovative program is another example
of working in partnership with our regulators to help all
our stakeholders.
For the three months ended December 31, 2006,
NJR earned $28.1 million, or $1.01 per basic share,
National Action Plan for Energy Effi ciency 5-7
compared with $34.3 million, or $1.24 per basic share,
last year. The decrease in earnings was due primarily to
lower earnings at NJR’s unregulated wholesale energy
services subsidiary, NJR Energy Services (NJRES), partially
offset by improved results at NJNG. NJNG earned $19.9
million in the quarter, compared with $18.7 million last
year. The increase in earnings was due to the impact of
the CIP and continued customer growth. Gross margin
at NJNG included $11.3 million accrued for future col
lection from customers under the CIP.
Weather in the fi rst fi scal quarter was 18.3 percent
warmer than normal and 18.2 percent warmer than last
year. “Normal” weather is based on 20-year average
temperatures. As with the weather normalization clause
which preceded it, the impact of weather is signifi cantly
offset by the recently approved CIP, which is designed to
smooth out year-to-year fl uctuations on both gross mar
gin and customers’ bills that may result from changing
weather and usage patterns. Included in the CIP accrual
was $8 million associated with the warmer-than-normal
weather and $3.3 million associated with non-weather
factors. However, customers will realize annual savings
of $10.6 million in fi xed cost reductions and commodity
cost savings of approximately $15 million through the
fi rst fi scal quarter.
(NJR, 2007)
5.2.3 Case Study: Baltimore Gas and Electric
Baltimore Gas and Electric (BGE) has had a form of a revenue-per-customer decoupling mechanism in place since 1998 for its natural gas business. The Maryland PSC allowed BGE to implement a monthly adjustment mechanism that accounts for the effect of abnormal weather patterns on sales.
Commission Order 80460 describes Rider 88 as follows:
Rider 8 is a tariff provision that serves as a “weather/
number of customers adjustment clause.” That is,
when the weather is warmer, Rider 8 will increase BGE’s
revenues because gas demand is lower than normal.
However, when the weather is colder than normal and
gas demand is high, Rider 8 decreases BGE’s revenues.
(Maryland PSC, 2005)
The mechanism is implemented through the Tariff Rider 8 or Monthly Rate Adjustment. The following explains the mechanism.
• The delivery price for residential service and for general service is adjusted to refl ect test year base rate revenues established in the latest base rate proceeding, after adjustment to recognize the change in the number of customers from the test year level.
• The change in revenues associated with the customer charge is the change in number of customers multiplied by the customer charge for the rate schedule.
• The change in revenues associated with throughput is the test year average use per customer multiplied by the net number of customers added since the like-month during the test year, and multiplying that product by the delivery price for the rate schedule.
• The change in revenues associated with customer charge and throughput is added to test year revenue to restate test year revenues for the month to include the revised values.
• Actual revenues collected for the month are compared to the restated test year revenues and any difference is divided by estimated sales for the second succeeding month to obtain the adjustment to the applicable delivery price.
• Any difference between actual and estimated sales is reconciled in the determination of the adjustment for a future month.
5.2.4 Case Study: Questar Gas Conservation Enabling Tariff
On December 16, 2005, Questar Gas, the Division of Public Utilities, and Utah Clean Energy (UCE) fi led an application seeking approval of a three-year (pilot) Conservation Enabling Tariff (CET) and DSM Pilot Program. On September 13, 2006, Questar Gas, the Division, UCE, and the committee fi led the Settlement Stipulation. The settlement was approved by the commission in October 2006 (Utah PSC, 2006). The approval of the settlement put in place the CET (Questar Gas, n.d., Section 2.11, pages 2–17), which represents the authorized
Aligning Utility Incentives with Investment in Energy Effi ciency 5-8
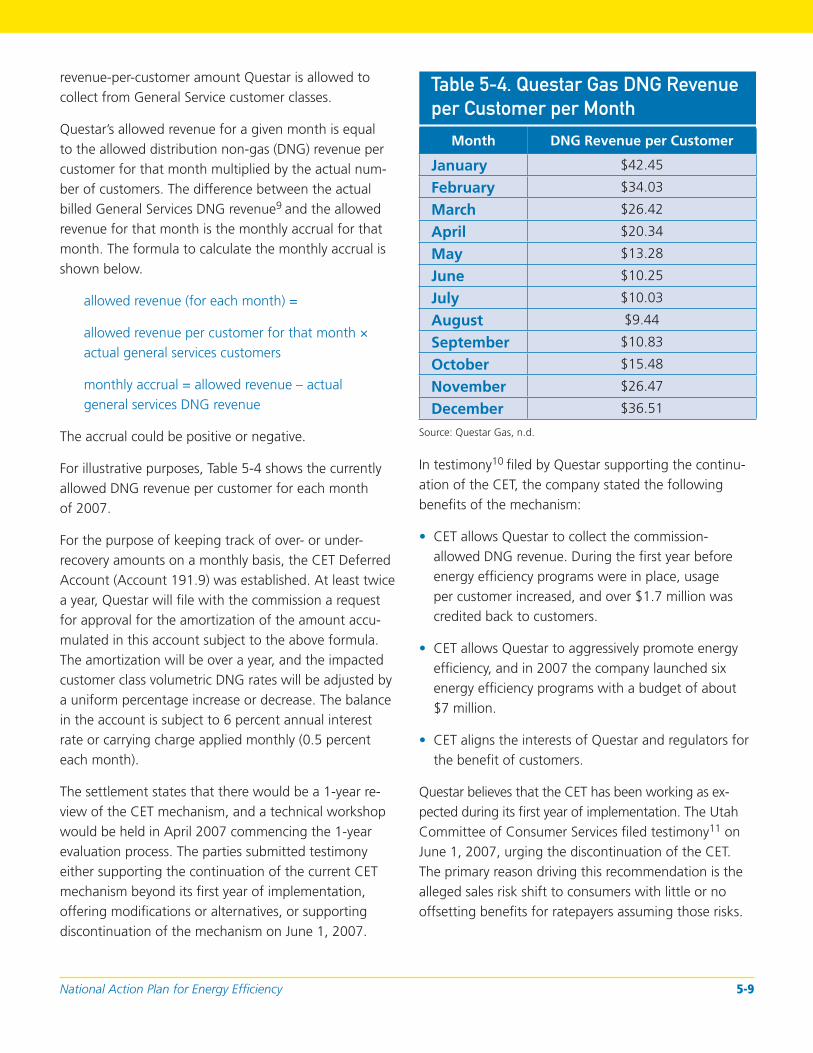
revenue-per-customer amount Questar is allowed to collect from General Service customer classes.
Questar’s allowed revenue for a given month is equal to the allowed distribution non-gas (DNG) revenue per customer for that month multiplied by the actual number of customers. The difference between the actual billed General Services DNG revenue9 and the allowed revenue for that month is the monthly accrual for that month. The formula to calculate the monthly accrual is shown below.
allowed revenue (for each month) =
allowed revenue per customer for that month × actual general services customers
monthly accrual = allowed revenue – actual general services DNG revenue
The accrual could be positive or negative.
For illustrative purposes, Table 5-4 shows the currently allowed DNG revenue per customer for each month of 2007.
For the purpose of keeping track of over- or under-recovery amounts on a monthly basis, the CET Deferred Account (Account 191.9) was established. At least twice a year, Questar will fi le with the commission a request for approval for the amortization of the amount accumulated in this account subject to the above formula. The amortization will be over a year, and the impacted customer class volumetric DNG rates will be adjusted by a uniform percentage increase or decrease. The balance in the account is subject to 6 percent annual interest rate or carrying charge applied monthly (0.5 percent each month).
The settlement states that there would be a 1-year review of the CET mechanism, and a technical workshop would be held in April 2007 commencing the 1-year evaluation process. The parties submitted testimony either supporting the continuation of the current CET mechanism beyond its fi rst year of implementation, offering modifi cations or alternatives, or supporting discontinuation of the mechanism on June 1, 2007.
Table 5-4. Questar Gas DNG Revenue
per Customer per Month
Month DNG Revenue per Customer
January $42.45
February $34.03
March $26.42
April $20.34
May $13.28
June $10.25
July $10.03
August $9.44
September $10.83
October $15.48
November $26.47
December $36.51
Source: Questar Gas, n.d.
In testimony10 fi led by Questar supporting the continuation of the CET, the company stated the following benefi ts of the mechanism:
• CET allows Questar to collect the commission-allowed DNG revenue. During the fi rst year before energy effi ciency programs were in place, usage per customer increased, and over $1.7 million was credited back to customers.
• CET allows Questar to aggressively promote energy effi ciency, and in 2007 the company launched six energy effi ciency programs with a budget of about $7 million.
• CET aligns the interests of Questar and regulators for the benefi t of customers.
Questar believes that the CET has been working as expected during its first year of implementation. The Utah Committee of Consumer Services fi led testimony11 on June 1, 2007, urging the discontinuation of the CET. The primary reason driving this recommendation is the alleged sales risk shift to consumers with little or no offsetting benefi ts for ratepayers assuming those risks.
National Action Plan for Energy Effi ciency 5-9
As of the writing of this white paper, the proceeding is still in process and the commission is expected to reach a decision by October of 2007.
5.3 Lost Revenue Recovery
Mechanisms
Lost revenue recovery mechanisms12 are designed to recover lost margins that result as sales fall below test year levels due to the success of energy effi ciency programs. They differ from decoupling mechanisms in that they do not attempt to decouple revenues from sales, but rather try to isolate the amount of under-recovery of margin revenues due to the programs. Simply put, the margin loss resulting from reductions in sales through the implementation of a successful energy effi ciency program is calculated as the product of program-induced sales reductions and the amount of margin allocated per therm or kilowatt-hour in a utility’s most recent rate case. In this sense, the shortfall in revenue recovery is treated as a cost to be recovered.
Although the disincentive to invest in successful effi ciency programs might be removed, lost revenue recovery mechanisms do not remove a utility’s disincentive to promote/support other energy saving policies, such as building codes and appliance standards, or their incentive to see sales increase generally, since the utility still earns more profi t with additional sales.
One of the most important characteristics of a lost revenue recovery mechanism is that actual savings achieved from a successful energy effi ciency program must be estimated correctly. Overestimates of savings will enable a utility to over-collect, and underestimates lead to under-collection of revenue. Unfortunately, reliance on evaluation creates two complications:
• While at its most rigorous, program evaluation produces a statistically valid estimate of actual savings. Rigorous evaluation can be expensive and, in any case, will not always be recognized as such by all parties.
• Because evaluation can only occur after an action has occurred, a process built on evaluation is one
with potentially signifi cant lags built in. It is possible to conduct rolling or real-time evaluations, albeit at considerable cost. In its least defensible applications, such mechanisms are applied with little or no independent evaluation and verifi cation.
Despite these issues, several states have implemented lost revenue recovery mechanisms in lieu of decoupling as a way to address this barrier. For example, in January 2007, the Indiana Utility Regulatory Commission granted Vectren South’s application for approval of a DSM lost margin adjustment factor for electric service.13
Order Nos. 39201 and 40322 accepted the utility’s request for a lost margin tracking mechanism. Recovery is done on a customer class and cost causation basis. Vectren South’s total demand-side-related lost margin to be recovered through rates during the period February to April 2007 was $577,591.14
Perceived advantages and disadvantages of the lost revenue recovery mechanism are summarized in Table 5-5.
5.3.1 Case Study: Kentucky Comprehensive Cost Recovery Mechanism15
Kentucky currently allows lost revenue recovery for both electric and gas DSM programs as part of a comprehensive hybrid cost recovery mechanism. Under Kentucky Revised Statute 278.190, Kentucky’s Public Service Commission determines the reasonableness of DSM plans that include components for program cost recovery, lost revenue recovery, and utility incentives for cost-effectiveness. The cost recovery mechanism can be reviewed as part of a rate proceeding, or as part of a separate, limited proceeding.
The DSM Cost Recovery Mechanism currently in effect for Louisville Gas and Electric Company (LG&E) is composed of factors for DSM program cost recovery (DCR), DSM revenue from lost sales (DRLS), DSM incentive (DSMI), and DSM balance adjustment (DBA). The monthly amount computed under each of the rate schedules to which this DSM Cost Recovery Mechanism applies is adjusted by the DSM Cost Recovery Component (DSMRC) at a rate per kilowatt-hour of monthly consumption in accordance with the following formula:
Aligning Utility Incentives with Investment in Energy Effi ciency 5-10
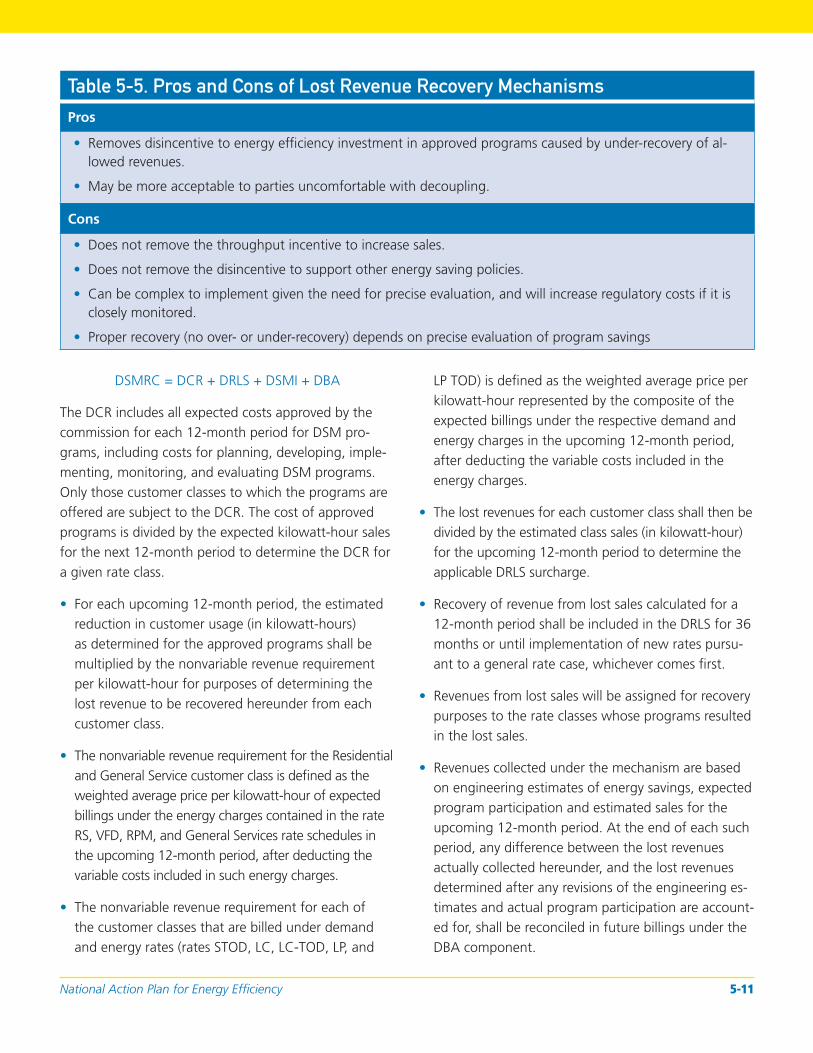
Table 5-5. Pros and Cons of Lost Revenue Recovery Mechanisms
Pros
• Removes disincentive to energy effi ciency investment in approved programs caused by under-recovery of allowed revenues.
• May be more acceptable to parties uncomfortable with decoupling.
Cons
• Does not remove the throughput incentive to increase sales.
• Does not remove the disincentive to support other energy saving policies.
• Can be complex to implement given the need for precise evaluation, and will increase regulatory costs if it is closely monitored.
• Proper recovery (no over- or under-recovery) depends on precise evaluation of program savings
DSMRC = DCR + DRLS + DSMI + DBA
The DCR includes all expected costs approved by the commission for each 12-month period for DSM programs, including costs for planning, developing, implementing, monitoring, and evaluating DSM programs. Only those customer classes to which the programs are offered are subject to the DCR. The cost of approved programs is divided by the expected kilowatt-hour sales for the next 12-month period to determine the DCR for a given rate class.
• For each upcoming 12-month period, the estimated reduction in customer usage (in kilowatt-hours) as determined for the approved programs shall be multiplied by the nonvariable revenue requirement per kilowatt-hour for purposes of determining the lost revenue to be recovered hereunder from each customer class.
• The nonvariable revenue requirement for the Residential and General Service customer class is defined as the weighted average price per kilowatt-hour of expected billings under the energy charges contained in the rate RS, VFD, RPM, and General Services rate schedules in the upcoming 12-month period, after deducting the variable costs included in such energy charges.
• The nonvariable revenue requirement for each of the customer classes that are billed under demand and energy rates (rates STOD, LC, LC-TOD, LP, and
LP TOD) is defi ned as the weighted average price per kilowatt-hour represented by the composite of the expected billings under the respective demand and energy charges in the upcoming 12-month period, after deducting the variable costs included in the energy charges.
• The lost revenues for each customer class shall then be divided by the estimated class sales (in kilowatt-hour) for the upcoming 12-month period to determine the applicable DRLS surcharge.
• Recovery of revenue from lost sales calculated for a 12-month period shall be included in the DRLS for 36 months or until implementation of new rates pursuant to a general rate case, whichever comes fi rst.
• Revenues from lost sales will be assigned for recovery purposes to the rate classes whose programs resulted in the lost sales.
• Revenues collected under the mechanism are based on engineering estimates of energy savings, expected program participation and estimated sales for the upcoming 12-month period. At the end of each such period, any difference between the lost revenues actually collected hereunder, and the lost revenues determined after any revisions of the engineering estimates and actual program participation are accounted for, shall be reconciled in future billings under the DBA component.
National Action Plan for Energy Effi ciency 5-11
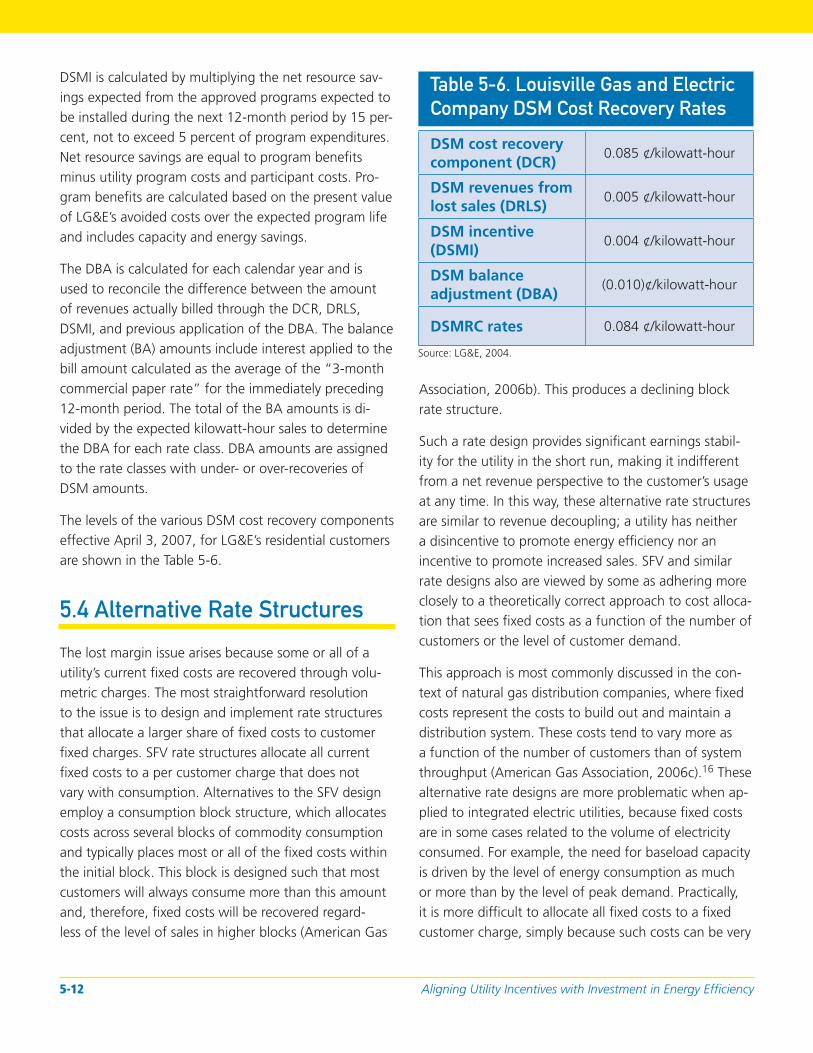
DSMI is calculated by multiplying the net resource savings expected from the approved programs expected to be installed during the next 12-month period by 15 percent, not to exceed 5 percent of program expenditures. Net resource savings are equal to program benefi ts minus utility program costs and participant costs. Program benefi ts are calculated based on the present value of LG&E’s avoided costs over the expected program life and includes capacity and energy savings.
The DBA is calculated for each calendar year and is used to reconcile the difference between the amount of revenues actually billed through the DCR, DRLS, DSMI, and previous application of the DBA. The balance adjustment (BA) amounts include interest applied to the bill amount calculated as the average of the “3-month commercial paper rate” for the immediately preceding 12-month period. The total of the BA amounts is divided by the expected kilowatt-hour sales to determine the DBA for each rate class. DBA amounts are assigned to the rate classes with under- or over-recoveries of DSM amounts.
The levels of the various DSM cost recovery components effective April 3, 2007, for LG&E’s residential customers are shown in the Table 5-6.
5.4 Alternative Rate Structures
The lost margin issue arises because some or all of a utility’s current fi xed costs are recovered through volumetric charges. The most straightforward resolution to the issue is to design and implement rate structures that allocate a larger share of fi xed costs to customer fi xed charges. SFV rate structures allocate all current fi xed costs to a per customer charge that does not vary with consumption. Alternatives to the SFV design employ a consumption block structure, which allocates costs across several blocks of commodity consumption and typically places most or all of the fi xed costs within the initial block. This block is designed such that most customers will always consume more than this amount and, therefore, fi xed costs will be recovered regardless of the level of sales in higher blocks (American Gas
Table 5-6. Louisville Gas and Electric
Company DSM Cost Recovery Rates
DSM cost recovery component (DCR)
DSM revenues from lost sales (DRLS)
0.085 ¢/kilowatt-hour
0.005 ¢/kilowatt-hour
DSM incentive (DSMI)
0.004 ¢/kilowatt-hour
DSM balance adjustment (DBA)
(0.010)¢/kilowatt-hour
DSMRC rates 0.084 ¢/kilowatt-hour
Source: LG&E, 2004.
Association, 2006b). This produces a declining block rate structure.
Such a rate design provides signifi cant earnings stability for the utility in the short run, making it indifferent from a net revenue perspective to the customer’s usage at any time. In this way, these alternative rate structures are similar to revenue decoupling; a utility has neither a disincentive to promote energy effi ciency nor an incentive to promote increased sales. SFV and similar rate designs also are viewed by some as adhering more closely to a theoretically correct approach to cost allocation that sees fi xed costs as a function of the number of customers or the level of customer demand.
This approach is most commonly discussed in the context of natural gas distribution companies, where fi xed costs represent the costs to build out and maintain a distribution system. These costs tend to vary more as a function of the number of customers than of system throughput (American Gas Association, 2006c).16 These alternative rate designs are more problematic when applied to integrated electric utilities, because fi xed costs are in some cases related to the volume of electricity consumed. For example, the need for baseload capacity is driven by the level of energy consumption as much or more than by the level of peak demand. Practically, it is more diffi cult to allocate all fi xed costs to a fi xed customer charge, simply because such costs can be very
Aligning Utility Incentives with Investment in Energy Effi ciency 5-12
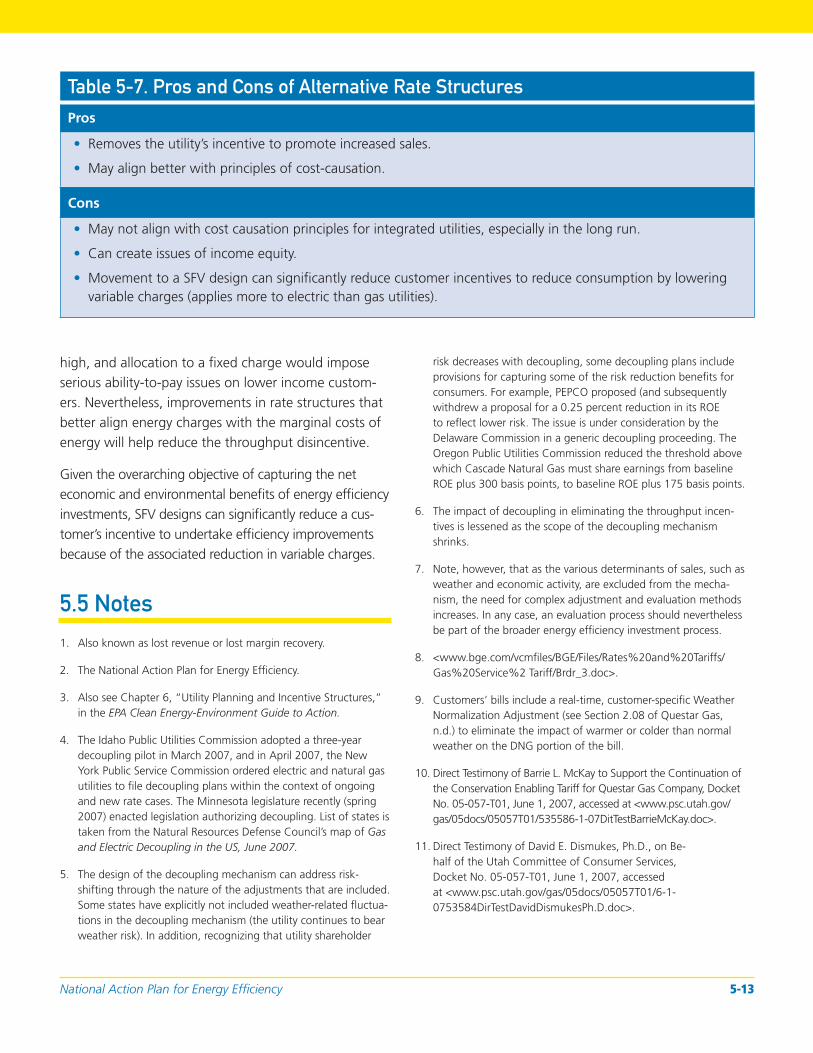
Table 5-7. Pros and Cons of Alternative Rate Structures
Pros
• Removes the utility’s incentive to promote increased sales.
• May align better with principles of cost-causation.
Cons
• May not align with cost causation principles for integrated utilities, especially in the long run.
• Can create issues of income equity.
• Movement to a SFV design can signifi cantly reduce customer incentives to reduce consumption by lowering variable charges (applies more to electric than gas utilities).
high, and allocation to a fi xed charge would impose serious ability-to-pay issues on lower income customers. Nevertheless, improvements in rate structures that better align energy charges with the marginal costs of energy will help reduce the throughput disincentive.
Given the overarching objective of capturing the net economic and environmental benefits of energy effi ciency investments, SFV designs can significantly reduce a customer’s incentive to undertake effi ciency improvements because of the associated reduction in variable charges.
5.5 Notes
1. Also known as lost revenue or lost margin recovery.
2. The National Action Plan for Energy Effi ciency.
3. Also see Chapter 6, “Utility Planning and Incentive Structures,” in the EPA Clean Energy-Environment Guide to Action.
4. The Idaho Public Utilities Commission adopted a three-year decoupling pilot in March 2007, and in April 2007, the New York Public Service Commission ordered electric and natural gas utilities to fi le decoupling plans within the context of ongoing and new rate cases. The Minnesota legislature recently (spring 2007) enacted legislation authorizing decoupling. List of states is taken from the Natural Resources Defense Council’s map of Gas and Electric Decoupling in the US, June 2007.
5. The design of the decoupling mechanism can address risk-shifting through the nature of the adjustments that are included. Some states have explicitly not included weather-related fl uctuations in the decoupling mechanism (the utility continues to bear weather risk). In addition, recognizing that utility shareholder
risk decreases with decoupling, some decoupling plans include provisions for capturing some of the risk reduction benefi ts for consumers. For example, PEPCO proposed (and subsequently withdrew a proposal for a 0.25 percent reduction in its ROE to refl ect lower risk. The issue is under consideration by the Delaware Commission in a generic decoupling proceeding. The Oregon Public Utilities Commission reduced the threshold above which Cascade Natural Gas must share earnings from baseline ROE plus 300 basis points, to baseline ROE plus 175 basis points.
6. The impact of decoupling in eliminating the throughput incentives is lessened as the scope of the decoupling mechanism shrinks.
7. Note, however, that as the various determinants of sales, such as weather and economic activity, are excluded from the mechanism, the need for complex adjustment and evaluation methods increases. In any case, an evaluation process should nevertheless be part of the broader energy effi ciency investment process.
8. <www.bge.com/vcmfi les/BGE/Files/Rates%20and%20Tariffs/ Gas%20Service%2 Tariff/Brdr_3.doc>.
9. Customers’ bills include a real-time, customer-specifi c Weather Normalization Adjustment (see Section 2.08 of Questar Gas, n.d.) to eliminate the impact of warmer or colder than normal weather on the DNG portion of the bill.
10. Direct Testimony of Barrie L. McKay to Support the Continuation of the Conservation Enabling Tariff for Questar Gas Company, Docket No. 05-057-T01, June 1, 2007, accessed at <www.psc.utah.gov/ gas/05docs/05057T01/535586-1-07DitTestBarrieMcKay.doc>.
11. Direct Testimony of David E. Dismukes, Ph.D., on Behalf of the Utah Committee of Consumer Services, Docket No. 05-057-T01, June 1, 2007, accessed at <www.psc.utah.gov/gas/05docs/05057T01/6-10753584DirTestDavidDismukesPh.D.doc>.
National Action Plan for Energy Effi ciency 5-13
12. Also known as lost revenue or lost margin recovery mechanisms.
13. Order issued in Cause No. 39453 DSM 59 on January 31, 2007, accessed at <www.in.gov/iurc/portal/Modules/Ecms/Cases/ Docketed_Cases/ViewDocumentaspx?DocID=0900b631800 c5033>.
14. Energy effi ciency traditionally has been defi ned as an overall reduction in energy use due to use of more effi ciency equipment and practices, while load management, as a subset of demand response has been defi ned as reductions or shifts in demand with minor declines and sometimes increases in energy use.
15. This description quotes extensively from LG&E, 2004.
16. Even in a gas distribution system, fi xed costs do vary partly as a function of individual customer demand. The SFV rate used by Atlanta Gas Light, for example, estimates the fi xed charge as a function of the maximum daily demand for gas imposed by each premise.
Aligning Utility Incentives with Investment in Energy Effi ciency 5-14
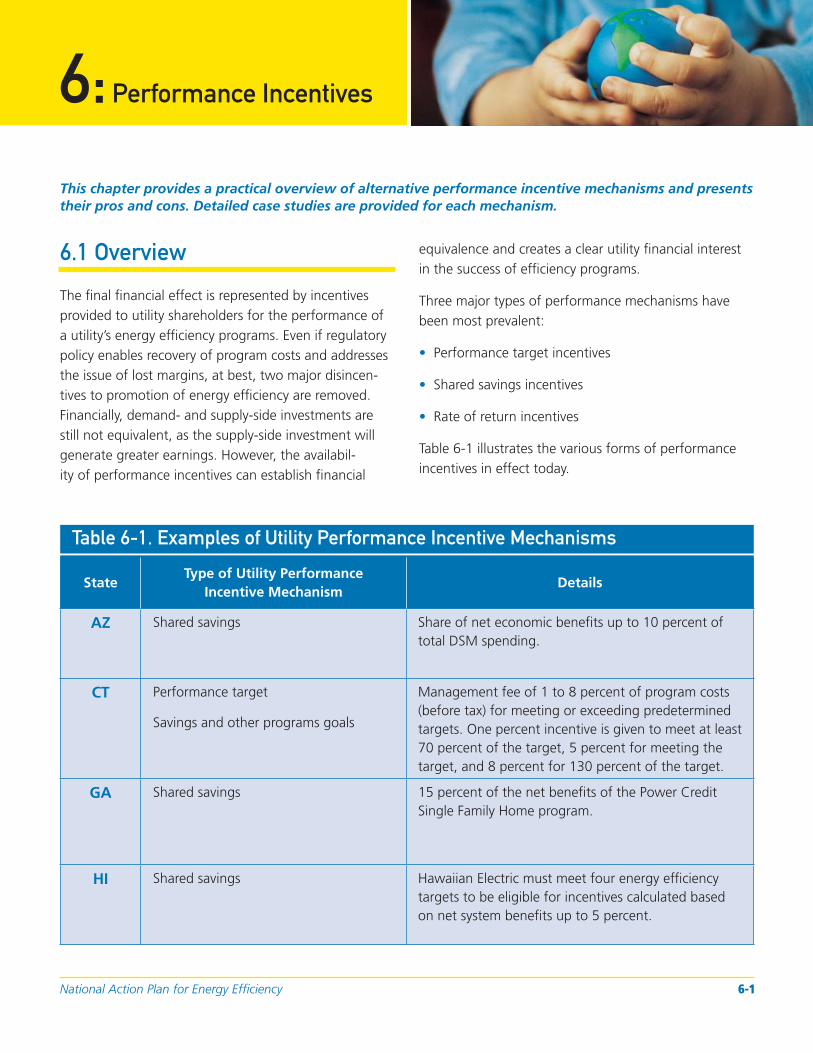
National Action Plan for Energy Effi ciency 6-1
6.1 Overview
The fi nal fi nancial effect is represented by incentives provided to utility shareholders for the performance of a utility’s energy effi ciency programs. Even if regulatory policy enables recovery of program costs and addresses the issue of lost margins, at best, two major disincen-tives to promotion of energy effi ciency are removed. Financially, demand- and supply-side investments are still not equivalent, as the supply-side investment will generate greater earnings. However, the availabil-ity of performance incentives can establish fi nancial
equivalence and creates a clear utility fi nancial interest in the success of effi ciency programs.
Three major types of performance mechanisms have been most prevalent:
• Performance target incentives
• Shared savings incentives
• Rate of return incentives
Table 6-1 illustrates the various forms of performance incentives in effect today.
6:Performance Incentives
This chapter provides a practical overview of alternative performance incentive mechanisms and presents their pros and cons. Detailed case studies are provided for each mechanism.
Table 6-1. Examples of Utility Performance Incentive Mechanisms
State Type of Utility Performance
Incentive Mechanism Details
AZ Shared savings Share of net economic benefi ts up to 10 percent of total DSM spending.
CT Performance target
Savings and other programs goals
Management fee of 1 to 8 percent of program costs (before tax) for meeting or exceeding predetermined targets. One percent incentive is given to meet at least 70 percent of the target, 5 percent for meeting the target, and 8 percent for 130 percent of the target.
GA Shared savings 15 percent of the net benefi ts of the Power Credit Single Family Home program.
HI Shared savings Hawaiian Electric must meet four energy effi ciency targets to be eligible for incentives calculated based on net system benefi ts up to 5 percent.
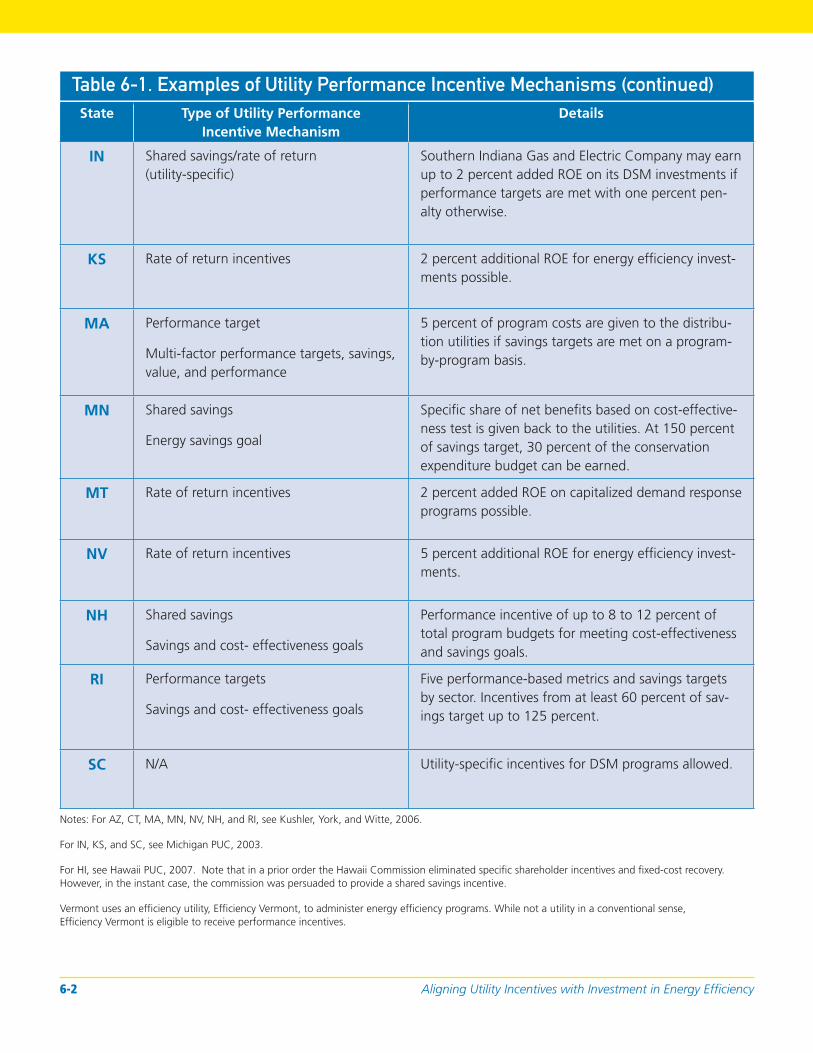
Table 6-1. Examples of Utility Performance Incentive Mechanisms (continued)
State Type of Utility Performance Incentive Mechanism
Details
IN Shared savings/rate of return (utility-specifi c)
Southern Indiana Gas and Electric Company may earn up to 2 percent added ROE on its DSM investments if performance targets are met with one percent penalty otherwise.
KS Rate of return incentives 2 percent additional ROE for energy effi ciency investments possible.
MA Performance target
Multi-factor performance targets, savings, value, and performance
5 percent of program costs are given to the distribution utilities if savings targets are met on a program-by-program basis.
MN Shared savings
Energy savings goal
Specifi c share of net benefi ts based on cost-effectiveness test is given back to the utilities. At 150 percent of savings target, 30 percent of the conservation expenditure budget can be earned.
MT Rate of return incentives 2 percent added ROE on capitalized demand response programs possible.
NV Rate of return incentives 5 percent additional ROE for energy effi ciency investments.
NH Shared savings
Savings and cost- effectiveness goals
Performance incentive of up to 8 to 12 percent of total program budgets for meeting cost-effectiveness and savings goals.
RI Performance targets
Savings and cost- effectiveness goals
Five performance-based metrics and savings targets by sector. Incentives from at least 60 percent of savings target up to 125 percent.
SC N/A Utility-specifi c incentives for DSM programs allowed.
Notes: For AZ, CT, MA, MN, NV, NH, and RI, see Kushler, York, and Witte, 2006.
For IN, KS, and SC, see Michigan PUC, 2003.
For HI, see Hawaii PUC, 2007. Note that in a prior order the Hawaii Commission eliminated specifi c shareholder incentives and fi xed-cost recovery. However, in the instant case, the commission was persuaded to provide a shared savings incentive.
Vermont uses an effi ciency utility, Effi ciency Vermont, to administer energy effi ciency programs. While not a utility in a conventional sense, Effi ciency Vermont is eligible to receive performance incentives.
Aligning Utility Incentives with Investment in Energy Effi ciency 6-2
6.2 Performance Targets
Mechanisms that allow utilities to capture some portion of net benefi ts typically include savings performance targets. Incentives are not paid unless a utility achieves some minimum fraction of proposed savings, and incentives are capped at some level above projected savings.1 Several states have designed multi-objective performance mechanisms. Utilities in Connecticut, for example, are eligible for “performance management fees” tied to performance goals such as lifetime energy savings, demand savings, and other measures. Incentives are available for a range of outcomes from 70 to 130 percent of pre-determined goals. A utility is not entitled to the management fee unless it achieves at least 70 percent of the targets. After 130 percent of the goals have been reached, no added incentive is provided. Over the incentive-eligible range of 70 to 130 percent, the utilities can earn 2 to 8 percent of total energy effi ciency program expenditures.
6.2.1 Case Study: Massachusetts
The Massachusetts Department of Telecommunications and Energy Order in Docket 98-100 (February 2000)2
allows for performance-based performance incentives where a distribution company achieves its “design” performance level (i.e., the energy effi ciency program performance level that the distribution company expects to achieve). The performance tiers are defi ned as follows:
1. The design performance level represents the level of performance that the distribution utility expects to achieve from the implementation of the energy effi ciency programs included in its proposed plan. The design performance level is expressed in terms of levels of savings in energy, commodity, and capacity, and in other measures of performance as appropriate.
2. The threshold performance level (the minimum level that must be achieved for a utility to be eligible for an incentive) represents 75 percent of the utility’s design performance level.
3. The exemplary performance level represents 125 percent of the utility’s design performance level.
For the distribution utilities that achieve their design performance levels, the after-tax performance incentive is calculated as the product of:3
1. The average yield of the 3-month United States Treasury bill calculated as the arithmetic average of the yields of the 3-month United States Treasury bills issued during the most recent 12-month period, or as the arithmetic average of the 3-month United States Treasury bill’s 12-month high and 12-month low, and
2. The direct program implementation costs.
A distribution utility calculates its after-tax performance incentive as the product of:
1. The percentage of the design performance level achieved, and
2. The design performance incentive level, provided that the utility will earn no incentive if its actual performance is below its threshold performance level, and will earn no more than its exemplary performance level incentive even if its actual performance is beyond its exemplary performance level.
In May 2007, the Massachusetts Department of Public Utilities issued an order approving NSTAR Electric’s Energy Effi ciency Plan for calendar year 2006, fi led with the department in April 2006.4 NSTAR Electric’s utility performance incentive proposal contains performance categories based on savings, value, and performance determinants and allocates specifi c weights to each category. For its residential programs, NSTAR Electric allocates the weights for its savings, value, and performance determinants as follows: 45 percent, 35 percent, and 20 percent, respectively. For its low-income programs, the weights are 30 percent, 10 percent, and 60 percent, respectively. And for its commercial and industrial programs, NSTAR sets the weights at 45 percent, 35 percent, and 20 percent, respectively.5
NSTAR proposed an incentive rate equal to 5 percent (after tax) of net benefi ts, as opposed to the pre-approved
National Action Plan for Energy Effi ciency 6-3

3-Month Treasury rate, and also requested that the exemplary performance level be set at 110 percent of design level for 2006 rather than the 125 percent threshold set by the department. The department accepted both changes. With regard to the latter, the department noted that the precision of performance measurements had improved to the point that performance could be forecast more accurately. Based on these parameters, the company estimated its annual incentive would be $2.4 million.6
6.3 Shared Savings
With a shared savings mechanism, utilities share the net benefi ts resulting from successful implementation of energy effi ciency programs with ratepayers. Implicitly, net benefi ts are tied to the utility’s avoided costs, as these costs determine the level of economic benefi t achieved. Therefore, the potential upside to a utility from use of a shared savings mechanism will be greater in jurisdictions with higher avoided costs.7 Key elements in fashioning a shared savings mechanism include:
• The degree of sharing (the percentage of net benefi ts retained by a utility).
• The amount to be shared (maximum dollar amount of the incentive irrespective of the sharing percentage).
• The extent to which there are penalties for failing to reach performance targets.
• The manner in which avoided costs are determined for purposes of calculating net benefi ts.
• The threshold values above which the sharing will begin.
6.3.1 Case Study: Minnesota
Minnesota Statute § 216B.2418 requires Minnesota’s energy utilities to invest in energy conservation improvement programs (CIP) authorized by the Minnesota Department of Commerce. Utilities are allowed to recover their costs annually. Part of the CIP cost recovery is achieved through a conservation cost recovery charge (CCRC). If a utility’s CIP costs differ from the
amount recovered through the CCRC, the utility can adjust its rates annually through the conservation cost recovery adjustment (CCRA). Utilities record CIP costs in a “tracker” account. The Minnesota Public Utilities Commission reviews these accounts before the utilities are authorized to make adjustments to their rates. The statute also authorizes the commission to provide an incentive rate of return, a shared savings incentive, and lost margin/fi xed cost recovery.
The legislation describes the requirements of an incentive plan as follows:
Subd. 6c. Incentive plan for energy conservation
improvement.
(a) The commission may order public utilities to develop and
submit for commission approval incentive plans that de
scribe the method of recovery and accounting for utility
conservation expenditures and savings. In developing the
incentive plans the commission shall ensure the effective
involvement of interested parties.
(b) In approving incentive plans, the commission shall
consider:
(1) Whether the plan is likely to increase utility invest
ment in cost-effective energy conservation.
(2) Whether the plan is compatible with the interest of
utility ratepayers and other interested parties.
(3) Whether the plan links the incentive to the utility’s
performance in achieving cost-effective conservation.
(4) Whether the plan is in confl ict with other provisions
of this chapter.
As explained in the Order Approving DSM Financial Incentive Plans under Docket E, G-999/CI-98-1759,9
issued in April 2000, Minnesota Public Utilities Commission convened a round table in December 1998 to assess gas and electric DSM efforts “to identify other DSM programs and methodologies that effectively conserve energy, to revaluate the need for gas and electric DSM fi nancial incentives and make recommendations for elimination or redesign.”
Aligning Utility Incentives with Investment in Energy Effi ciency 6-4
In November 1999, a joint proposal for a shared savings DSM fi nancial incentive plan was fi led with the commission. In the same month, each of the utilities fi led their proposed DSMI plans for 1999 and beyond.
The jointly proposed DSM financial incentive plan, which formed the basis for individual utility plans, was intended to replace the then current incentive plans. A primary characteristic of the proposed plan was the method for determining a utility’s target energy savings used to calculate incentives. Each utility was subject to the same following formula in determining the energy savings goal:
(approved energy savings goal ÷ approved budget) × statutory minimum spending level
where the statutory spending requirement is 1 percent for electric IOUs (Xcel at 2 percent) and 0.5 percent for gas utilities.
The utilities were required to show that their expenditures resulted in net ratepayer benefi ts (utility program costs netted against avoided supply-side costs). The net benefi ts of achieving the specifi c percentage of energy savings goals were calculated by determining the utilities’ avoided costs resulting from their actual CIP achievement, then subtracting the CIP costs. A portion of these benefi ts was given to the shareholders as an incentive. The size of the incentive depended on the percentage of the net benefi ts achieved. This percentage increased as the percentage of the goal reached increased. At 90 percent of the goal, the utility received no incentive. At 91 percent of the goal, a small percentage of its net benefi ts were given to the utility. Net benefi ts, as mentioned, depended on the utility’s avoided costs, which varied from utility to utility. In order to treat all utilities equally, the percentage values were calculated such that at 150 percent of the goals, the utility’s incentive was capped at 30 percent of its statutory spending requirement.
In the April 7, 2000 order, the commission found that the plan was likely to increase investment in cost-effective energy conservation. The incentive grew for each incremental block of energy savings. No signifi cant incentive was provided unless a utility
met or exceeded its expected energy savings at minimum spending requirements.10 The mechanism was designed such that if a utility’s program was not cost-effective (i.e., there were no net benefi ts), no incentives were paid. As the cost-effectiveness increased, net benefi ts and incentives increased accordingly.
The utilities make compliance fi lings on February 1 of each year to demonstrate the application of the incentive mechanism to a utility’s budget and energy savings target.
The 2007 compliance fi ling11 of Northern States Power Company (NSP), a wholly owned subsidiary of Xcel Energy, offers useful insight into application of the electric and gas incentive mechanism, in this case incorporating goals and budgets approved in November 2006. Table 6-2 shows the basic calculation of net benefi ts, and Table 6-3 shows the incentive amount earned by NSP at different levels of program savings.
6.3.2 Case Study: Hawaiian Electric Company (HECO)
In Order No. 23258, the Hawaii Public Utilities Commission approved HECO’s proposed energy effi ciency incentive mechanism. The order sets four energy effi ciency goals that HECO must meet before being entitled to any incentive based on net system benefi ts (less program costs). Only positive incentives are allowed; in other words, once HECO meets and exceeds the energy effi ciency goals, it is entitled to the incentive, but if it cannot achieve the goal, no penalties will apply.
The order details the approach as follows:
The DSM Utility Incentive Mechanism will be calculated
based on net system benefi ts (less program costs),
limited to no more than the utility earnings opportuni
ties foregone by implementing DSM programs in lieu
of supply-side rate based investments, capped at $4
million, subject to the following performance require
ments and incentive schedule. As indicated in section
III.E.l.c., supra, the commission is not requiring nega
tive incentives. In order to encourage high achieve
ment, HECO must meet or exceed the megawatt-hour
and megawatt Energy Effi ciency goals for both the
National Action Plan for Energy Effi ciency 6-5
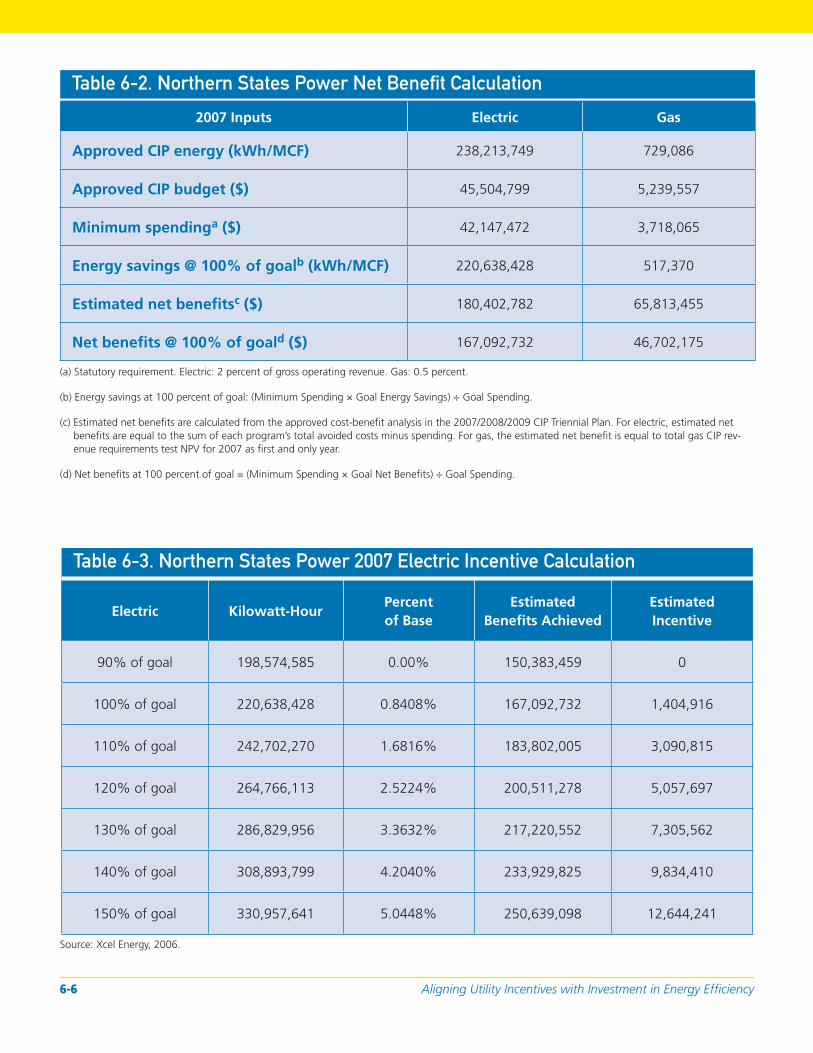
Table 6-2. Northern States Power Net Benefi t Calculation
2007 Inputs Electric Gas
Approved CIP energy (kWh/MCF) 238,213,749 729,086
Approved CIP budget ($) 45,504,799 5,239,557
Minimum spendinga ($) 42,147,472 3,718,065
Energy savings @ 100% of goalb (kWh/MCF) 220,638,428 517,370
Estimated net benefi tsc ($) 180,402,782 65,813,455
Net benefits @ 100% of goald ($) 167,092,732 46,702,175
(a) Statutory requirement. Electric: 2 percent of gross operating revenue. Gas: 0.5 percent.
(b) Energy savings at 100 percent of goal: (Minimum Spending × Goal Energy Savings) ÷ Goal Spending.
(c) Estimated net benefi ts are calculated from the approved cost-benefi t analysis in the 2007/2008/2009 CIP Triennial Plan. For electric, estimated net benefi ts are equal to the sum of each program’s total avoided costs minus spending. For gas, the estimated net benefi t is equal to total gas CIP revenue requirements test NPV for 2007 as fi rst and only year.
(d) Net benefi ts at 100 percent of goal = (Minimum Spending × Goal Net Benefi ts) ÷ Goal Spending.
Table 6-3. Northern States Power 2007 Electric Incentive Calculation
Electric Kilowatt-Hour Percent of Base
Estimated Benefi ts Achieved
Estimated Incentive
90% of goal 198,574,585 0.00% 150,383,459 0
100% of goal 220,638,428 0.8408% 167,092,732 1,404,916
110% of goal 242,702,270 1.6816% 183,802,005 3,090,815
120% of goal 264,766,113 2.5224% 200,511,278 5,057,697
130% of goal 286,829,956 3.3632% 217,220,552 7,305,562
140% of goal 308,893,799 4.2040% 233,929,825 9,834,410
150% of goal 330,957,641 5.0448% 250,639,098 12,644,241
Source: Xcel Energy, 2006.
Aligning Utility Incentives with Investment in Energy Effi ciency 6-6
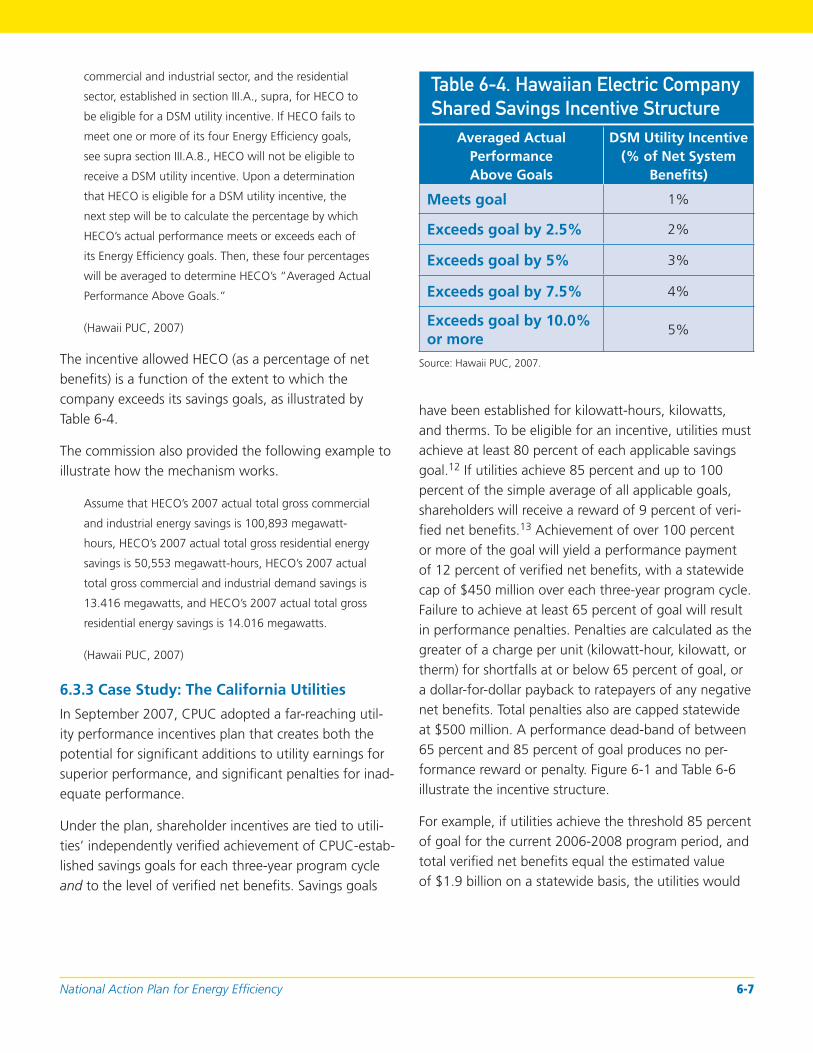
commercial and industrial sector, and the residential
sector, established in section III.A., supra, for HECO to
be eligible for a DSM utility incentive. If HECO fails to
meet one or more of its four Energy Effi ciency goals,
see supra section III.A.8., HECO will not be eligible to
receive a DSM utility incentive. Upon a determination
that HECO is eligible for a DSM utility incentive, the
next step will be to calculate the percentage by which
HECO’s actual performance meets or exceeds each of
its Energy Effi ciency goals. Then, these four percentages
will be averaged to determine HECO’s “Averaged Actual
Performance Above Goals.”
(Hawaii PUC, 2007)
The incentive allowed HECO (as a percentage of net benefi ts) is a function of the extent to which the company exceeds its savings goals, as illustrated by Table 6-4.
The commission also provided the following example to illustrate how the mechanism works.
Assume that HECO’s 2007 actual total gross commercial
and industrial energy savings is 100,893 megawatt-
hours, HECO’s 2007 actual total gross residential energy
savings is 50,553 megawatt-hours, HECO’s 2007 actual
total gross commercial and industrial demand savings is
13.416 megawatts, and HECO’s 2007 actual total gross
residential energy savings is 14.016 megawatts.
(Hawaii PUC, 2007)
6.3.3 Case Study: The California Utilities
In September 2007, CPUC adopted a far-reaching utility performance incentives plan that creates both the potential for signifi cant additions to utility earnings for superior performance, and signifi cant penalties for inadequate performance.
Under the plan, shareholder incentives are tied to utilities’ independently verifi ed achievement of CPUC-established savings goals for each three-year program cycle and to the level of verifi ed net benefi ts. Savings goals
Table 6-4. Hawaiian Electric Company
Shared Savings Incentive Structure
Averaged Actual Performance Above Goals
DSM Utility Incentive (% of Net System
Benefi ts)
Meets goal 1%
Exceeds goal by 2.5% 2%
Exceeds goal by 5% 3%
Exceeds goal by 7.5% 4%
Exceeds goal by 10.0% or more
5%
Source: Hawaii PUC, 2007.
have been established for kilowatt-hours, kilowatts, and therms. To be eligible for an incentive, utilities must achieve at least 80 percent of each applicable savings goal.12 If utilities achieve 85 percent and up to 100 percent of the simple average of all applicable goals, shareholders will receive a reward of 9 percent of verifi ed net benefi ts.13 Achievement of over 100 percent or more of the goal will yield a performance payment of 12 percent of verifi ed net benefi ts, with a statewide cap of $450 million over each three-year program cycle. Failure to achieve at least 65 percent of goal will result in performance penalties. Penalties are calculated as the greater of a charge per unit (kilowatt-hour, kilowatt, or therm) for shortfalls at or below 65 percent of goal, or a dollar-for-dollar payback to ratepayers of any negative net benefi ts. Total penalties also are capped statewide at $500 million. A performance dead-band of between 65 percent and 85 percent of goal produces no performance reward or penalty. Figure 6-1 and Table 6-6 illustrate the incentive structure.
For example, if utilities achieve the threshold 85 percent of goal for the current 2006-2008 program period, and total verifi ed net benefi ts equal the estimated value of $1.9 billion on a statewide basis, the utilities would
National Action Plan for Energy Effi ciency 6-7

Table 6-5. Illustration of HECO Shared Savings Calculation
Energy Effi ciency Energy Savings (MWh)
2007 Goal
(MWh)
2007 Actual Performance
(MWh)
Energy Effi ciency Goal Met?
Actual Performance Above 2007 Goal
(%)
Commercial and industrial
Total gross energy savings 91,549 100,893 10.21% Yes
Residential
Total gross energy savings 50,553 50,553 Yes 0%
Commercial and industrial
Total gross demand savings 13.041 13.416 Yes 2.88%
Residential
Total gross demand savings 13.336 14.016 Yes 5.10%
Averaged actual performance above goals
4.55%
DSM utility incentive (% of net system benefi ts)
2%
Source: Hawaii PUC, 2007.
receive 9 percent of that amount, or $175 million. If the utilities each met 100 percent of the savings goals, and the estimated verifi ed net benefi t of $2.7 billion is realized, the earnings bonus would equal $323 million.
Rewards or penalties may be collected in three installments for each three-year program cycle. Two interim reward claims or penalty assessments will be made
based on estimated performance and net benefi ts. The third payment—a “true-up claim”—will be made after the program cycle is complete and savings and net benefi ts have been independently verifi ed. Thirty percent of each interim reward payment is withheld to cover potential errors in estimated earnings calculations. Verifi ed savings will be based on independent measurement and evaluation studies managed by CPUC.
Aligning Utility Incentives with Investment in Energy Effi ciency 6-8
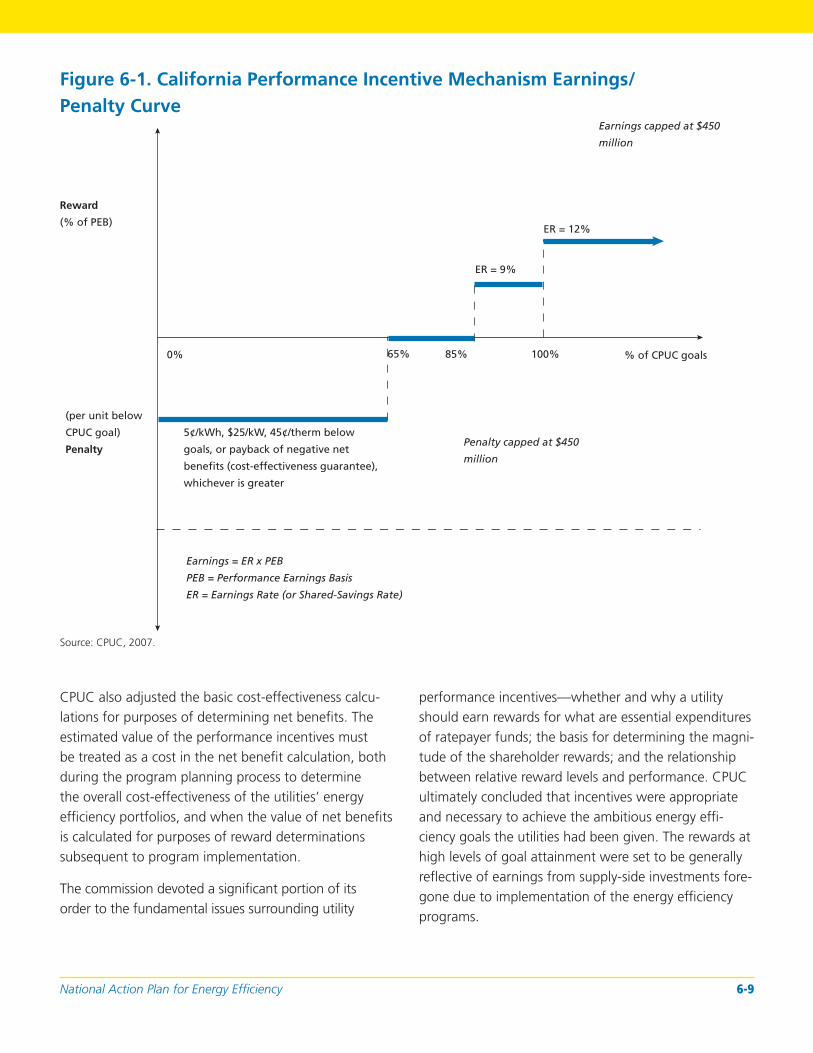
Figure 6-1. California Performance Incentive Mechanism Earnings/ Penalty Curve
Earnings capped at $450
million
Reward
(% of PEB) ER = 12%
ER = 9%
0% 65% 85% 100% % of CPUC goals
(per unit below
CPUC goal)
Penalty
5¢/kWh, $25/kW, 45¢/therm below
goals, or payback of negative net
benefits (cost-effectiveness guarantee),
whichever is greater
Earnings = ER x PEB
PEB = Performance Earnings Basis
ER = Earnings Rate (or Shared-Savings Rate)
Source: CPUC, 2007.
CPUC also adjusted the basic cost-effectiveness calculations for purposes of determining net benefi ts. The estimated value of the performance incentives must be treated as a cost in the net benefi t calculation, both during the program planning process to determine the overall cost-effectiveness of the utilities’ energy effi ciency portfolios, and when the value of net benefi ts is calculated for purposes of reward determinations subsequent to program implementation.
The commission devoted a signifi cant portion of its order to the fundamental issues surrounding utility
Penalty capped at $450
million
performance incentives—whether and why a utility should earn rewards for what are essential expenditures of ratepayer funds; the basis for determining the magnitude of the shareholder rewards; and the relationship between relative reward levels and performance. CPUC ultimately concluded that incentives were appropriate and necessary to achieve the ambitious energy effi ciency goals the utilities had been given. The rewards at high levels of goal attainment were set to be generally refl ective of earnings from supply-side investments foregone due to implementation of the energy effi ciency programs.
National Action Plan for Energy Effi ciency 6-9
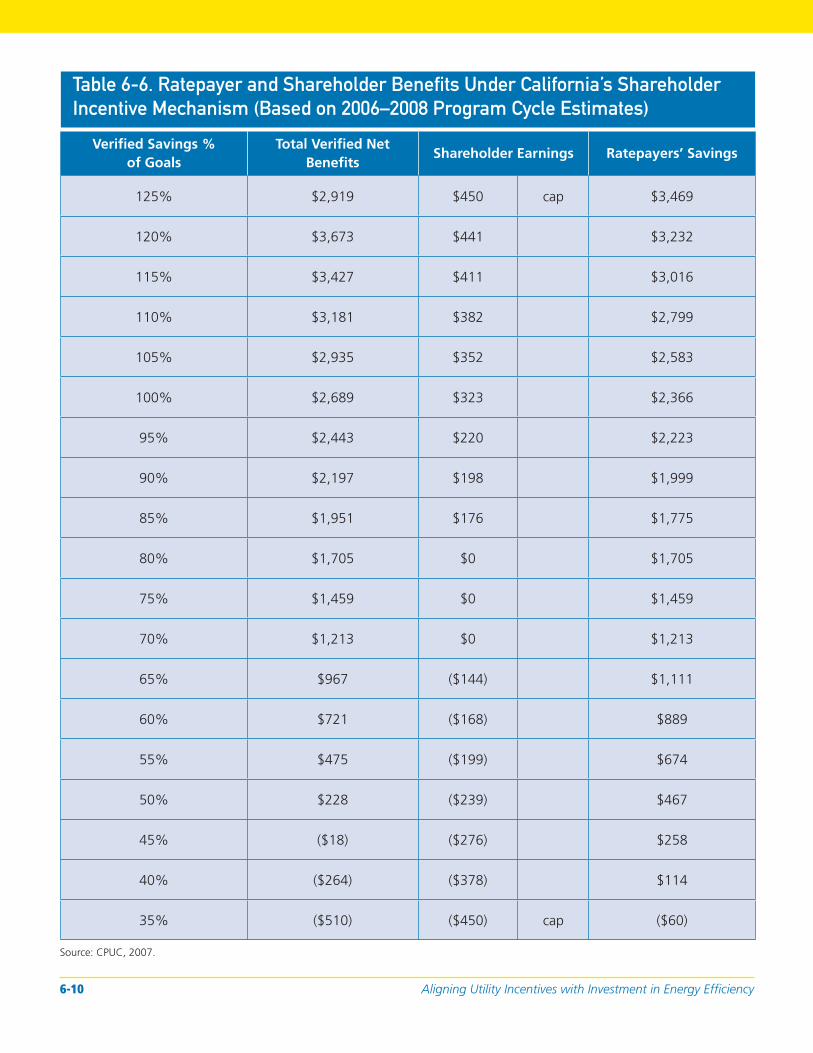
Table 6-6. Ratepayer and Shareholder Benefits Under California’s Shareholder
Incentive Mechanism (Based on 2006–2008 Program Cycle Estimates)
Verified Savings % of Goals
Total Verifi ed Net Benefi ts
Shareholder Earnings Ratepayers’ Savings
125% $2,919 $450 cap $3,469
120% $3,673 $441 $3,232
115% $3,427 $411 $3,016
110% $3,181 $382 $2,799
105% $2,935 $352 $2,583
100% $2,689 $323 $2,366
95% $2,443 $220 $2,223
90% $2,197 $198 $1,999
85% $1,951 $176 $1,775
80% $1,705 $0 $1,705
75% $1,459 $0 $1,459
70% $1,213 $0 $1,213
65% $967 ($144) $1,111
60% $721 ($168) $889
55% $475 ($199) $674
50% $228 ($239) $467
45% ($18) ($276) $258
40% ($264) ($378) $114
35% ($510) ($450) cap ($60)
Source: CPUC, 2007.
Aligning Utility Incentives with Investment in Energy Effi ciency 6-10
Finally, the structure of what the commission termed the “earnings curve,” showing the relationship between goal achievement and reward and penalty levels, was fashioned to achieve a reasonable balance between opportunity for reward and risk for penalty. And although potential penalties are signifi cant, even in cases in which programs deliver a net benefi t (but fail to meet goal), CPUC found that utilities have suffi cient ability to manage these risks, such that penalties can reasonably be associated with nonperformance as opposed to uncontrollable circumstances. This last point has been contested. Utilities are subject to substantial evaluation risk in the fi nal true-up claim. An evaluator’s fi nding that per-unit measure savings or net-to-gross ratios14
were signifi cantly lower than those estimated ex ante (thus signifi cantly lowering system net benefi ts) could result in utilities having to refund interim performance payments, which are based on estimates of net benefi ts. While utilities have some control over net-to-gross ratios through program design, there is considerable debate over the reliability of net-to-gross calculations, and even if utilities attempt to monitor the level of free ridership in a program, the fi nal fi ndings of an independent evaluator are unpredictable.
6.4 Enhanced Rate of Return
Under the bonus rate of return mechanism, utilities are allowed an increased return on investment for energy effi ciency investments or offered a bonus return on total equity investment for superior performance. A number of states allowed an increased rate of return on energy effi ciency–related investments starting in the 1980s. In fact, the majority of the states that allowed or required ratebasing or capitalization also allowed an increased rate of return for such investments. For example, Washington and Montana allowed an additional 2 percent return for energy effi ciency investments, while Wisconsin adopted a mechanism where each additional 125 MW of capacity saved with energy effi ciency yielded an additional 1 percent ROE. Connecticut authorized a 1 to 5 percent additional return (Reid, 1988).
Although a bonus rate of return remains an option “on the books” in a number of states, it is seldom used, largely because capitalization of effi ciency investments has fallen from favor. The most often-cited current example of a bonus return mechanism, and the only one applied to a utility with signifi cant effi ciency spending, is found in Nevada. The Nevada approach, described earlier, allows a bonus rate of return for DSM that is 5 percent higher than authorized rates of return for supply investments. The earlier discussion cited the concerns raised by some that this mechanism does not provide an incentive for superior performance.
6.5 Pros and Cons of Utility
Performance Incentive
Mechanisms
Shared savings and performance target incentive mechanisms are similar, in that both tie an incentive to achievement of some target level of performance. The two differ in the specifi c nature of the target and the base upon which the incentive is calculated. The application of each mechanism will differ based on regulators’ decisions regarding the specifi c performance target levels; the relative share of incentive base available as an incentive; the maximum amount of the incentive; and whether performance penalties can be imposed (as opposed to simply failing to earn a performance incentive). Whether an incentive mechanism is implemented will depend on how regulators balance the value of the mechanism in incenting exemplary performance against the cost to ratepayers and arguments that customers should not have to pay for a utility that simply complies with statutory or regulatory mandates. A bonus rate of return mechanism also can include performance measures (those applied in the late 1980s and early 1990s often did), but may not, as in the Nevada example. Table 6-7 summarizes the major pros and cons of performance incentive mechanisms as a whole.
National Action Plan for Energy Effi ciency 6-11
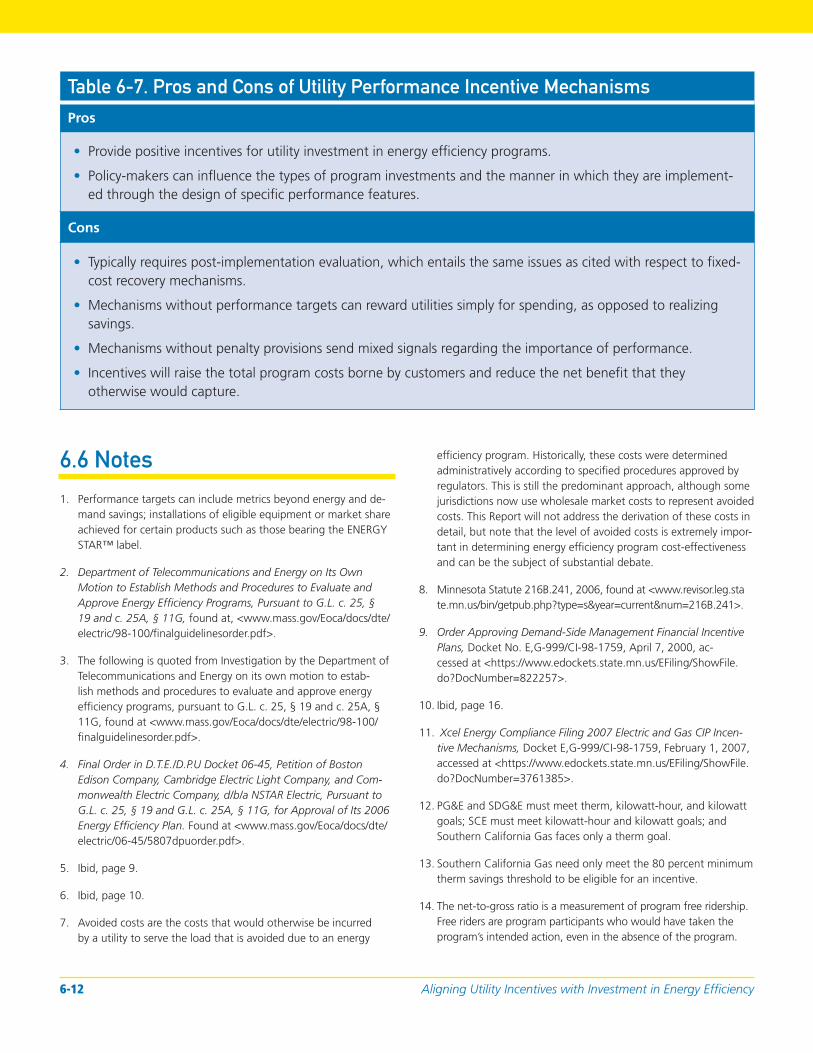
Table 6-7. Pros and Cons of Utility Performance Incentive Mechanisms
Pros
• Provide positive incentives for utility investment in energy effi ciency programs.
• Policy-makers can infl uence the types of program investments and the manner in which they are implemented through the design of specifi c performance features.
Cons
• Typically requires post-implementation evaluation, which entails the same issues as cited with respect to fi xed-cost recovery mechanisms.
• Mechanisms without performance targets can reward utilities simply for spending, as opposed to realizing savings.
• Mechanisms without penalty provisions send mixed signals regarding the importance of performance.
• Incentives will raise the total program costs borne by customers and reduce the net benefi t that they otherwise would capture.
6.6 Notes
1. Performance targets can include metrics beyond energy and demand savings; installations of eligible equipment or market share achieved for certain products such as those bearing the ENERGY STAR™ label.
2. Department of Telecommunications and Energy on Its Own Motion to Establish Methods and Procedures to Evaluate and Approve Energy Effi ciency Programs, Pursuant to G.L. c. 25, § 19 and c. 25A, § 11G, found at, <www.mass.gov/Eoca/docs/dte/ electric/98-100/fi nalguidelinesorder.pdf>.
3. The following is quoted from Investigation by the Department of Telecommunications and Energy on its own motion to establish methods and procedures to evaluate and approve energy effi ciency programs, pursuant to G.L. c. 25, § 19 and c. 25A, § 11G, found at <www.mass.gov/Eoca/docs/dte/electric/98-100/ fi nalguidelinesorder.pdf>.
4. Final Order in D.T.E./D.P.U Docket 06-45, Petition of Boston Edison Company, Cambridge Electric Light Company, and Commonwealth Electric Company, d/b/a NSTAR Electric, Pursuant to G.L. c. 25, § 19 and G.L. c. 25A, § 11G, for Approval of Its 2006 Energy Effi ciency Plan. Found at <www.mass.gov/Eoca/docs/dte/ electric/06-45/5807dpuorder.pdf>.
5. Ibid, page 9.
6. Ibid, page 10.
7. Avoided costs are the costs that would otherwise be incurred by a utility to serve the load that is avoided due to an energy
effi ciency program. Historically, these costs were determined administratively according to specifi ed procedures approved by regulators. This is still the predominant approach, although some jurisdictions now use wholesale market costs to represent avoided costs. This Report will not address the derivation of these costs in detail, but note that the level of avoided costs is extremely important in determining energy effi ciency program cost-effectiveness and can be the subject of substantial debate.
8. Minnesota Statute 216B.241, 2006, found at <www.revisor.leg.sta te.mn.us/bin/getpub.php?type=s&year=current&num=216B.241>.
9. Order Approving Demand-Side Management Financial Incentive Plans, Docket No. E,G-999/CI-98-1759, April 7, 2000, accessed at <https://www.edockets.state.mn.us/EFiling/ShowFile. do?DocNumber=822257>.
10. Ibid, page 16.
11. Xcel Energy Compliance Filing 2007 Electric and Gas CIP Incentive Mechanisms, Docket E,G-999/CI-98-1759, February 1, 2007, accessed at <https://www.edockets.state.mn.us/EFiling/ShowFile. do?DocNumber=3761385>.
12. PG&E and SDG&E must meet therm, kilowatt-hour, and kilowatt goals; SCE must meet kilowatt-hour and kilowatt goals; and Southern California Gas faces only a therm goal.
13. Southern California Gas need only meet the 80 percent minimum therm savings threshold to be eligible for an incentive.
14. The net-to-gross ratio is a measurement of program free ridership. Free riders are program participants who would have taken the program’s intended action, even in the absence of the program.
Aligning Utility Incentives with Investment in Energy Effi ciency 6-12

7:Emerging Models
This chapter examines two new models currently being explored to address the basic fi nancial effects associated with utility energy efficiency investment. The first model has been proposed as an alternative comprehensive cost recovery and performance incentive mechanism. The second represents a fundamentally different approach to funding energy efficiency within a utility resource planning and procurement framework.
7.1 Introduction
Although the details of the policies and mechanisms described above for addressing the three fi nancial effects continue to evolve in jurisdictions across the country, the basic classes of mechanisms have been understood, applied, and debated for more than two decades. Most jurisdictions currently considering policies to remove fi nancial disincentives to utility investment in energy effi ciency are considering one or more of the mechanisms described earlier. However, new models that do not fi t easily within the traditional classes of mechanisms are now being considered.
7.2 Duke Energy’s Proposed
Save-a-Watt Model
The persistent and sometimes acrimonious nature of the debate over the proper approach to removing disincentives, combined with a sense that the energy effi ciency investment environment is on the threshold of fundamental change, has led some to search for a new way to address the investment disincentive. Although no approach has yet been adopted, an intriguing proposal has emerged from Duke Energy in an energy effi ciency proceeding in North Carolina.1 Duke’s energy effi ciency investment plan includes an energy effi ciency rider that encapsulates program cost recovery, recovery of lost margins, and shareholder incentives into one conceptually simple mechanism keyed to the utility’s avoided
cost. The approach is an attempt to improve upon previous methods with a more streamlined and comprehensive mechanism.
The energy effi ciency rider supporting Duke’s proposal is based on the notion that if energy effi ciency is to be viewed from the utility’s perspective as equivalent to a supply resource, the utility should be compensated for its investment in energy effi ciency by an amount roughly equal to what it would otherwise spend to build the new capacity that is to be avoided. Thus, the Duke proposal would authorize the company “to recover the amortization of and a return on 90% of the costs avoided by producing save-a-watts” (Duke Energy, 2007, p. 2). There is no explicit program cost recovery mechanism, no lost margin recovery mechanism and no shareholder incentive mechanism—all such costs and incentives would be recovered under the 90 percent of avoided cost plan. According to Duke, this structure creates an explicit incentive to design and deliver programs effi ciently, as doing so will minimize the program costs and maximize the fi nancial incentive received by the company. This mechanism would apply to the full Duke demand-side portfolio, including demand-response programs.
The Duke proposal includes one element that is often not addressed explicitly in other cost recovery and incentive mechanisms, but has signifi cant implications. A number of states have, for a variety of reasons, excluded demand response from incentive mechanisms. This becomes an issue insofar as demand response programs
National Action Plan for Energy Effi ciency 7-1
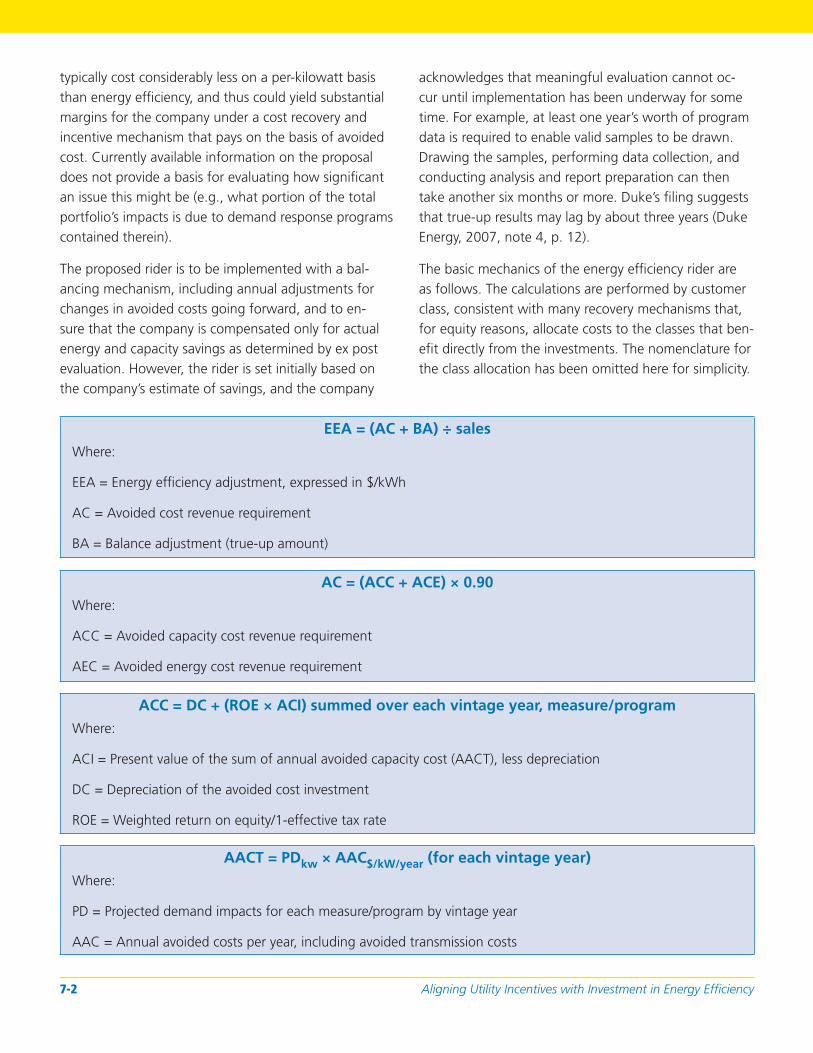
typically cost considerably less on a per-kilowatt basis than energy effi ciency, and thus could yield substantial margins for the company under a cost recovery and incentive mechanism that pays on the basis of avoided cost. Currently available information on the proposal does not provide a basis for evaluating how signifi cant an issue this might be (e.g., what portion of the total portfolio’s impacts is due to demand response programs contained therein).
The proposed rider is to be implemented with a balancing mechanism, including annual adjustments for changes in avoided costs going forward, and to ensure that the company is compensated only for actual energy and capacity savings as determined by ex post evaluation. However, the rider is set initially based on the company’s estimate of savings, and the company
acknowledges that meaningful evaluation cannot occur until implementation has been underway for some time. For example, at least one year’s worth of program data is required to enable valid samples to be drawn. Drawing the samples, performing data collection, and conducting analysis and report preparation can then take another six months or more. Duke’s fi ling suggests that true-up results may lag by about three years (Duke Energy, 2007, note 4, p. 12).
The basic mechanics of the energy effi ciency rider are as follows. The calculations are performed by customer class, consistent with many recovery mechanisms that, for equity reasons, allocate costs to the classes that benefi t directly from the investments. The nomenclature for the class allocation has been omitted here for simplicity.
EEA = (AC + BA) ÷ sales Where:
EEA = Energy effi ciency adjustment, expressed in $/kWh
AC = Avoided cost revenue requirement
BA = Balance adjustment (true-up amount)
AC = (ACC + ACE) × 0.90 Where:
ACC = Avoided capacity cost revenue requirement
AEC = Avoided energy cost revenue requirement
ACC = DC + (ROE × ACI) summed over each vintage year, measure/program Where:
ACI = Present value of the sum of annual avoided capacity cost (AACT), less depreciation
DC = Depreciation of the avoided cost investment
ROE = Weighted return on equity/1-effective tax rate
AACT = PDkw × AAC$/kW/year (for each vintage year) Where:
PD = Projected demand impacts for each measure/program by vintage year
AAC = Annual avoided costs per year, including avoided transmission costs
Aligning Utility Incentives with Investment in Energy Effi ciency 7-2
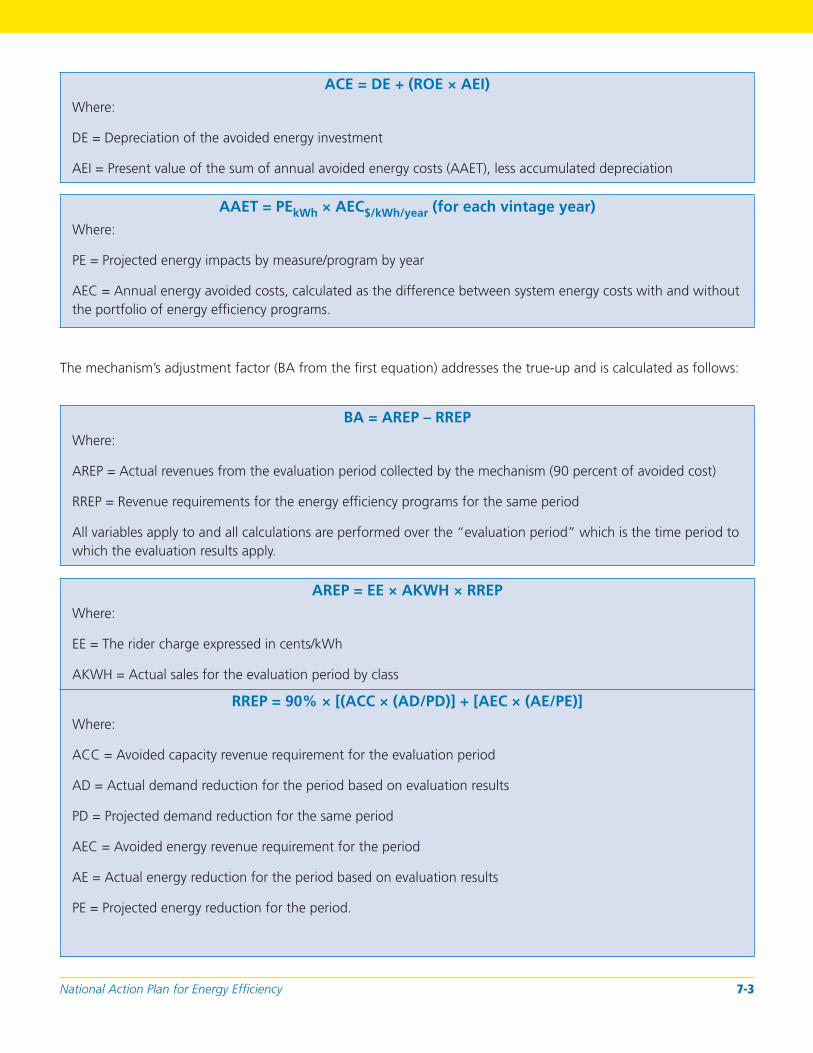
ACE = DE + (ROE × AEI) Where:
DE = Depreciation of the avoided energy investment
AEI = Present value of the sum of annual avoided energy costs (AAET), less accumulated depreciation
AAET = PEkWh × AEC$/kWh/year (for each vintage year) Where:
PE = Projected energy impacts by measure/program by year
AEC = Annual energy avoided costs, calculated as the difference between system energy costs with and without the portfolio of energy effi ciency programs.
The mechanism’s adjustment factor (BA from the fi rst equation) addresses the true-up and is calculated as follows:
BA = AREP – RREP Where:
AREP = Actual revenues from the evaluation period collected by the mechanism (90 percent of avoided cost)
RREP = Revenue requirements for the energy effi ciency programs for the same period
All variables apply to and all calculations are performed over the “evaluation period” which is the time period to which the evaluation results apply.
AREP = EE × AKWH × RREP Where:
EE = The rider charge expressed in cents/kWh
AKWH = Actual sales for the evaluation period by class
RREP = 90% × [(ACC × (AD/PD)] + [AEC × (AE/PE)] Where:
ACC = Avoided capacity revenue requirement for the evaluation period
AD = Actual demand reduction for the period based on evaluation results
PD = Projected demand reduction for the same period
AEC = Avoided energy revenue requirement for the period
AE = Actual energy reduction for the period based on evaluation results
PE = Projected energy reduction for the period.
National Action Plan for Energy Effi ciency 7-3
If evaluated savings (in kilowatt-hours and kilowatts) equal planned savings over the relevant period, then there is no adjustment.
Avoided costs are administratively determined in accordance with North Carolina rules, where avoided costs (both capacity and energy) are calculated based on the peaker methodology and are approved by the North Carolina Utilities Commission on a biannual basis (personal communication with Raiford Smith, Duke Energy, May 25, 2007).
It is important to emphasize that Duke’s energy effi ciency rider has only recently been fi led as of this writing, and the regulatory review has only just begun. The proposal clearly represents an innovation in thinking regarding elimination of fi nancial disincentives for utilities, and it has intuitive appeal for its conceptual simplicity. The Save-a-Watt rider does represent a distinct departure from cost recovery and shareholder incentives convention. In its attempt to address the range of fi nancial effects described above in a single mechanism, the rider requires a number of detailed calculations, and estimating the amount of money to be recovered is complicated.
7.3 ISO New England’s Market-
Based Approach to Energy Effi
ciency Procurement
The development of organized wholesale markets that allow participation from providers of load reduction creates both an alternative source of funding for energy effi ciency projects and a source of revenue that potentially could be used to provide fi nancial incentives for energy effi ciency performance.
ISO New England, New England’s electricity system operator and wholesale market administrator, is implementing a new capacity market, known as the forward capacity market (FCM). The FCM will, for the fi rst time, permit all demand resources to participate in the wholesale capacity market on a comparable basis with
traditional generation resources. Demand resources, as defi ned by ISO New England’s market rules, include energy effi ciency, load management, real-time demand response, and distributed generation. An annual forward capacity auction would be held to procure capacity three years in advance of delivery. This three-year window provides developers with suffi cient time to construct/complete auction-clearing projects and to reduce the risk of developing new capacity. All capacity providers receive payments during the annual commitment period based upon a single clearing price set in the forward capacity auction. In return, the providers commit to providing capacity for the duration of the commitment period by producing power (if a generator) or by reducing demand (if a demand resource) during specifi c performance hours (typically peak load hours and shortage hours—hours in which reserves needed for reliable system operation are being depleted) (Yoshimura, 2007, pp. 1–2).
This system creates two revenue pathways. First, non-utility providers of demand reduction, such as energy service companies, municipalities, and retail customers (perhaps through aggregators), could receive a stream of revenues that could help fi nance incremental energy effi ciency projects. Second, utilities in the region could bid the demand reduction associated with energy effi ciency programs that they are implementing. The revenues received by utilities from winning bids could be handled in a variety of ways depending on the policy of their state regulators. Traditionally, any revenues earned from these programs would be credited against the utilities’ jurisdictional revenue requirement. This approach assumes the programs were funded by ratepayers and therefore, that the benefi ts from these programs should accrue to ratepayers. However, several alternatives exist to this approach:2
• Allow revenues earned from winning bids to be retained by the utilities as fi nancial incentives. Rather than having ratepayers directly fund a performance incentive program, as is typically done, state regulators could allow utilities to retain some or all of the funds received from the capacity auction as a reward
Aligning Utility Incentives with Investment in Energy Effi ciency 7-4

for performance and inducement to implement effective programs that reduce system peak load.
• Require that some or all of the revenues earned be applied to the expansion of existing programs or development of new programs.
• Require that the jurisdictional costs of energy effi ciency programs be offset by revenues earned from the auction, resulting in a rate decrease for jurisdictional customers.
The ISO New England forward capacity auction is in its very early stages. The initial “show-of-interest” solicitation produced almost 2,500 MW of additional demand reduction potential, of which almost half was in the form of some type of energy effi ciency. About 80 percent of the capacity was proposed by non-utility entities (Yoshimura, 2007, p. 4).
While this model represents a new source of revenue to fund energy effi ciency investments, it also presents a novel way to capture value from energy effi ciency programs by virtue of their ability to reduce wholesale power costs. Increasing the supply of capacity that is bid into the auction, particularly from lower-cost energy effi ciency, would likely result in a lower market clearing price for capacity resources, which would lower overall regional capacity costs.
However, whether this model becomes a signifi cant source of revenue to support utility energy effi ciency programs is not yet known at this time. Successful
implementation of an FCM that allows energy effi ciency resources to participate requires that the control area responsible for resource adequacy develop rigorous and complex rules to ensure that the impacts of energy effi ciency programs on capability responsibility are real and are not double-counted. Additionally, using a regional capacity market to fund energy effi ciency results in all consumers of electricity within the region paying for energy effi ciency programs implemented in the region. Accordingly, policy-makers in the region must be prepared for the potential shifting of energy effi ciency program cost recovery from jurisdictional ratepayers to all ratepayers in the region. State regulatory policy with respect to the treatment of revenues earned in wholesale markets may or may not provide an incentive for utilities to increase the amount of energy effi ciency in response to these markets. Finally, the model works only where there are organized wholesale markets that include a capacity market. Currently, much of the country operates without a capacity market.
7.4 Notes
1. The information in this chapter is drawn largely from the Application of Duke Energy Carolinas, LLC for Approval of Save-a-Watt Approach, Energy Effi ciency Rider and Portfolio of Energy Effi ciency Programs.
2. Note that these alternatives are not mutually exclusive.
National Action Plan for Energy Effi ciency 7-5


Final Thoughts— 8:Getting Started
This final chapter provides seven lessons for policy makers to consider as they begin the process of better aligning utility incentives with investment in energy effi ciency.
8.1 Lessons for Policy-Makers
The previous four chapters described a variety of options for addressing the barriers to effi ciency investment through program cost recovery, lost margin recovery and performance incentive mechanisms. Chapter 2 underscored the principle that it is the combined effect of cost and incentive recovery that matters in the elimination of fi nancial disincentives. There is no single optimal solution for every utility and jurisdiction. Context matters very much, and it is less important that a jurisdiction address each fi nancial effect than that it crafts a solution that leaves utility earnings at least at pre–energy effi ciency program implementation levels and perhaps higher.
The history of utility energy effi ciency investment is rich with examples of how regulatory commissions and the governing bodies of publicly and cooperatively owned utilities have explored their cost recovery policy options. As these options are reconsidered and reconfi gured in light of the trend toward higher utility investment in energy effi ciency, this experience yields several lessons with respect to process.
1. Set cost recovery and incentive policy based on the direction of the market’s evolution. No policy-maker sets a course by looking over his or her shoulder. Nevertheless, there is a natural tendency to project onto the future what seems most comfortable today. The rapid development of technology, the likely integration of energy efficiency and demand response, the continuing evolution of utility industry structure, the likelihood of broader action on climate change, and a wide range of other uncertainties argue for cost recovery and incentive policies that can work with intended effect under a variety of possible futures.
2. Apply cost recovery mechanisms and utility performance incentives in a broad policy context. The policies that affect utility investment in energy effi ciency are many and varied, and each will control, to some extent, the nature of fi nancial incentives and disincentives that a utility faces. Policies that could impact the design of cost recovery and incentive mechanisms include those having to do with rate design (PBR, dynamic pricing, SFV designs, etc.); non-CO2
environmental controls such as NOX cap-and-trade initiatives; broader clean energy and distributed energy development; and the development of more liquid wholesale markets for load reduction programs.
3. Test prospective policies. Cost recovery and incentive discussions have tended toward the conceptual. What is appropriate to award and allow? Is it the utilities’ responsibility to invest in energy effi ciency, and do they need to be rewarded for doing so? Should revenues be decoupled from sales? All questions are appropriate and yet at the end of the day, the answers tell policy-makers very little about how a mechanism will impact rates and earnings. This answer can only come from running the numbers— test driving the policy—and not simply under the standard business-as-usual scenario. Business is never “as usual,” and a sustainable, durable policy requires that it generate acceptable outcomes under unusual circumstances. Complex mechanisms that have many moving parts cannot easily be understood absent simulation of the mechanisms under a wide range of conditions. This is particularly true of mechanisms that rely on projections of avoided costs, prices, or program impacts.
National Action Plan for Energy Effi ciency 8-1

4. Policy rules must be clear. Earlier chapters of this Report described the relationship between perceived fi nancial risk and utility disincentives to invest in energy effi ciency. This risk is mitigated in part by having cost recovery and incentive mechanisms in place, but the effectiveness of these mechanisms depends very much on the rules governing their application. For example, review and approval of energy effi ciency program budgets by regulators prior to implementation provides utilities with greater assurance of subsequent cost recovery. Alternatively, spelling out what is considered prudent in terms of planning and investment can help allay concerns over post-implementation disallowances. Similarly, the criteria/ methods to be applied when reviewing costs, recovery of lost margins, and claimed incentives should be as specifi c as possible, recognizing the need to preserve regulatory fl exibility. Where possible, the values of key cost recovery and incentive variables, such as avoided costs, should be determined in other appropriate proceedings, rather than argued in cost recovery dockets. Although this clear separation of issues will not always be possible, the principal focus of cost recovery proceedings should be on (1) whether a utility adhered to an approved plan and, if not, whether it was prudent in diverging, and (2) whether costs and incentives proposed for recovery are properly calculated.
5. Collaboration has value. Like every issue involving utility costs of service, recovering the costs associated with program implementation, recovering lost margins/fi xed costs, and providing performance incentives will involve determinations of who should pay how much. These decisions invariably will draw active participation from a variety of stakeholders. Key among these are utilities, consumer advocates, environmental groups, energy effi ciency proponents, and representatives of large energy consumers. Fashioning a cost recovery and incentives policy will be challenging. The most successful and sustainable cost recovery and incentive policies are those that (1) were based on a consultative process that includes broad agreement on the general aims of the energy
effi ciency investment policy, and (2) are based on legislative enactment of clear regulatory authority to implement the policy.
6. Flexibility is essential. Most of the states that have had signifi cant effi ciency investment and cost recovery policies in place for more than a few years have found compelling reasons to modify these policies at some point. Rather than indicating policy inconsistency, these changes most often refl ect an institutional capacity to acknowledge either weaknesses in existing approaches or broader contextual changes that render prior approaches ineffective. Minnesota developed and subsequently abandoned a lost margin recovery mechanism after fi nding that its costs were too high, but the state replaced the mechanism with a utility performance incentive policy that appears to be effective in addressing barriers to investment. California adopted, abandoned, and is now set to again adopt performance incentive mechanisms as it responds to broader changes in energy market structure and the role of utilities in promoting effi ciency. Nevada adopted a bonus rate of return for utility effi ciency investments and is now reconsidering that policy in the context of the state’s aggressive resource portfolio standard. Policy stability is desirable, and changes that suggest signifi cant impacts on earnings or prices can be particularly challenging, but it is the stability of impact rather than adherence to a particular model that is important in addressing fi nancial disincentives to invest.
7. Culture matters. One important test of a cost recovery and incentives policy is its impact on corporate culture. A policy providing cost recovery is an essential fi rst step in removing fi nancial disincentives associated with energy effi ciency investment, but it will not change a utility’s core business model. Earnings are still created by investing in supply-side assets and selling more energy. Cost recovery, plus a policy enabling recovery of lost margins might make a utility indifferent to selling or saving a kilowatt-hour or therm, but still will not make the business case for aggressive pursuit of energy effi ciency. A full comple-
Aligning Utility Incentives with Investment in Energy Effi ciency 8-2

ment of cost recovery, lost margin recovery, and performance incentive mechanisms can change this model, and likely will be needed to secure sustainable funding for energy effi ciency at levels necessary to fundamentally change resource mix.
As utility spending on energy effi ciency programs rises to historic levels, attention increasingly falls on the policies in place to recover program costs, recover potential lost margins, and provide performance incentives. These policies take on even greater importance if utilities are expected to go beyond current spending mandates and adopt investment in customer energy effi ciency as a fundamental element of their business strategy. The fi nancial implications of utility energy effi ciency spending can be signifi cant, and failure to address them ensures that at best, utilities will comply with policies requiring their involvement in energy effi ciency, and at worst, it could lead to ineffective programs and lost opportunities.
This paper has outlined the fi nancial implications surrounding utility funding for energy effi ciency and the mechanisms available for addressing them, with the
intent of supporting policies that align utility fi nancial incentives with investment in cost-effective energy effi ciency. The variety of policy options is testament to the creativity of state policy-makers and utilities, but as pressure for higher effi ciency spending levels increases, the volume of the debate surrounding these options also increases. To a great extent, the debates revolve around the basic tenets of utility regulation. Some effi ciency cost recovery, margin recovery, and performance incentive mechanisms imply changes in the approach to utility regulation and ratemaking.
Building the consensus necessary to support signifi cant increases in utility administration of energy effi ciency will require that these tenants be revisited. If state and federal policy-makers conclude that utilities should play an increasingly aggressive role in promoting energy effi ciency, adaptations to these tenants to accommodate this role will need to be explored. An important fi rst step may be building a common understanding around the fi nancial implications of utility spending for effi ciency, including development of a consistent cost accounting framework and terminology.
National Action Plan for Energy Effi ciency 8-3

National Action Plan Appendix for Energy Effi ciency
A: Leadership Group
Co-Chairs
Marsha Smith Commissioner, Idaho Public Utilities Commission President, National Association of Regulatory Utility Commissioners
James E. Rogers Chairman, President, and C.E.O. Duke Energy
Leadership Group
Barry Abramson Senior Vice President Servidyne Systems, LLC
Tracy Babbidge Director, Air Planning Connecticut Department of Environmental Protection
Angela S. Beehler Director of Energy Regulation Wal-Mart Stores, Inc.
Jeff Bladen General Manager, Market Strategy PJM Interconnection
Sheila Boeckman Manager of Business Operations and Development Waverly Light and Power
Bruce Braine Vice President, Strategic Policy Analysis American Electric Power
Cheryl Buley Commissioner New York State Public Service Commission
Jeff Burks Director of Environmental Sustainability PNM Resources
Kateri Callahan President Alliance to Save Energy
Jorge Carrasco Superintendent Seattle City Light
Lonnie Carter President and C.E.O. Santee Cooper
Gary Connett Manager of Resource Planning and Member Services Great River Energy
Larry Downes Chairman and C.E.O. New Jersey Natural Gas (New Jersey Resources Corporation)
Roger Duncan Deputy General Manager, Distributed Energy Services Austin Energy
Angelo Esposito Senior Vice President, Energy Services and Technology New York Power Authority
Jeanne Fox President New Jersey Board of Public Utilities
Anne George Commissioner Connecticut Department of Public Utility Control
Dian Grueneich Commissioner California Public Utilities Commission
Blair Hamilton Policy Director Vermont Energy Investment Corporation
Leonard Haynes Executive Vice President, Supply Technologies, Renewables, and Demand Side Planning Southern Company
Mary Healey Consumer Counsel for the State of Connecticut Connecticut Consumer Counsel
Joe Hoagland Vice President, Energy Effi ciency and Demand Response Tennessee Valley Authority
Sandy Hochstetter Vice President, Strategic Affairs Arkansas Electric Cooperative Corporation
Helen Howes Vice President, Environment, Health and Safety Exelon
Bruce Johnson Director, Energy Management Keyspan
Mary Kenkel Consultant, Alliance One Duke Energy
Ruth Kiselewich Director, Conservation Programs Baltimore Gas and Electric
Rick Leuthauser Manager of Energy Effi ciency MidAmerican Energy Company
Harris McDowell Senator Delaware General Assembly
Mark McGahey Manager Tristate Generation and Transmission Association, Inc.
Ed Melendreras Vice President, Sales and Marketing Entergy Corporation
Janine Migden-Ostrander Consumers’ Counsel Offi ce of the Ohio Consumers’ Counsel
Michael Moehn Vice President, Corporate Planning Ameren Services
National Action Plan for Energy Effi ciency Appendix A-1
Fred Moore Director Manufacturing & Technology, Energy The Dow Chemical Company
Richard Morgan Commissioner District of Columbia Public Service Commission
Brock Nicholson Deputy Director Division of Air Quality North Carolina Air Offi ce
Pat Oshie Commissioner Washington Utilities and Transportation Commission
Douglas Petitt Vice President, Government Affairs Vectren Corporation
Bill Prindle Deputy Director American Council for an Energy-Effi cient Economy
Phyllis Reha Commissioner Minnesota Public Utilities Commission
Roland Risser Director, Customer Energy Effi ciency Pacifi c Gas and Electric
Gene Rodrigues Director, Energy Effi ciency Southern California Edison
Art Rosenfeld Commissioner California Energy Commission
Gina Rye Energy Manager Food Lion
Jan Schori General Manager Sacramento Municipal Utility District
Ted Schultz Vice President, Energy Effi ciency Duke Energy
Larry Shirley Division Director North Carolina Energy Offi ce
Tim Stout Vice President, Energy Effi ciency National Grid
Deb Sundin Director, Business Product Marketing Xcel Energy
Paul Suskie Chairman Arkansas Public Service Commission
Dub Taylor Director Texas State Energy Conservation Offi ce
Paul von Paumgartten Director, Energy and Environmental Affairs Johnson Controls
Brenna Walraven Executive Director, National Property Management USAA Realty Company
Devra Wang Director, California Energy Program Natural Resources Defense Council
J. Mack Wathen Vice President, Regulatory Affairs Pepco Holdings, Inc.
Mike Weedall Vice President, Energy Effi ciency Bonneville Power Administration
Zac Yanez Program Manager Puget Sound
Henry Yoshimura Manager, Demand Response ISO New England Inc.
Dan Zaweski Assistant Vice President of Energy Effi ciency and Distributed Generation Long Island Power Authority
Observers
Keith Bissell Attorney Gas Technology Institute
Rex Boynton President North American Technician Excellence
James W. (Jay) Brew Counsel Steel Manufacturers Association
Roger Cooper Executive Vice President, Policy and Planning American Gas Association
Dan Delurey Executive Director Demand Response Coordinating Committee
Reid Detchon Executive Director Energy Future Coalition
Roger Fragua Deputy Director Council of Energy Resource Tribes
Jeff Genzer General Counsel National Association of State Energy Offi cials
Donald Gilligan President National Association of Energy Service Companies
Chuck Gray Executive Director National Association of Regulatory Utility Commissioners
Steve Hauser President GridWise Alliance
William Hederman Member, IEEE-USA Energy Policy Committee Institute of Electrical and Electronics Engineers
Marc Hoffman Executive Director Consortium for Energy Effi ciency
John Holt Senior Manager of Generation and Fuel National Rural Electric Cooperative Association
Eric Hsieh Manager of Government Relations National Electrical Manufacturers Association
Lisa Jacobson Executive Director Business Council for Sustainable Energy
Kate Marks Energy Program Manager National Conference of State Legislatures
Appendix A-2 Aligning Utility Incentives with Investment in Energy Effi ciency

Joseph Mattingly Vice President, Secretary and General Counsel Gas Appliance Manufacturers Association
Kenneth Mentzer President and C.E.O. North American Insulation Manufacturers Association
Diane Munns Executive Director, Retail Energy Edison Electric Institute
Michelle New Director, Grants and Research National Association of State Energy Offi cials
Ellen Petrill Director, Public/Private Partnerships Electric Power Research Institute
Alan Richardson President and C.E.O. American Public Power Association
Andrew Spahn Executive Director National Council on Electricity Policy
Rick Tempchin Director, Retail Distribution Policy Edison Electric Institute
Mark Wolfe Executive Director Energy Programs Consortium
Facilitators
U.S. Department of Energy
U.S. Environmental Protection Agency
National Action Plan for Energy Effi ciency Appendix A-3

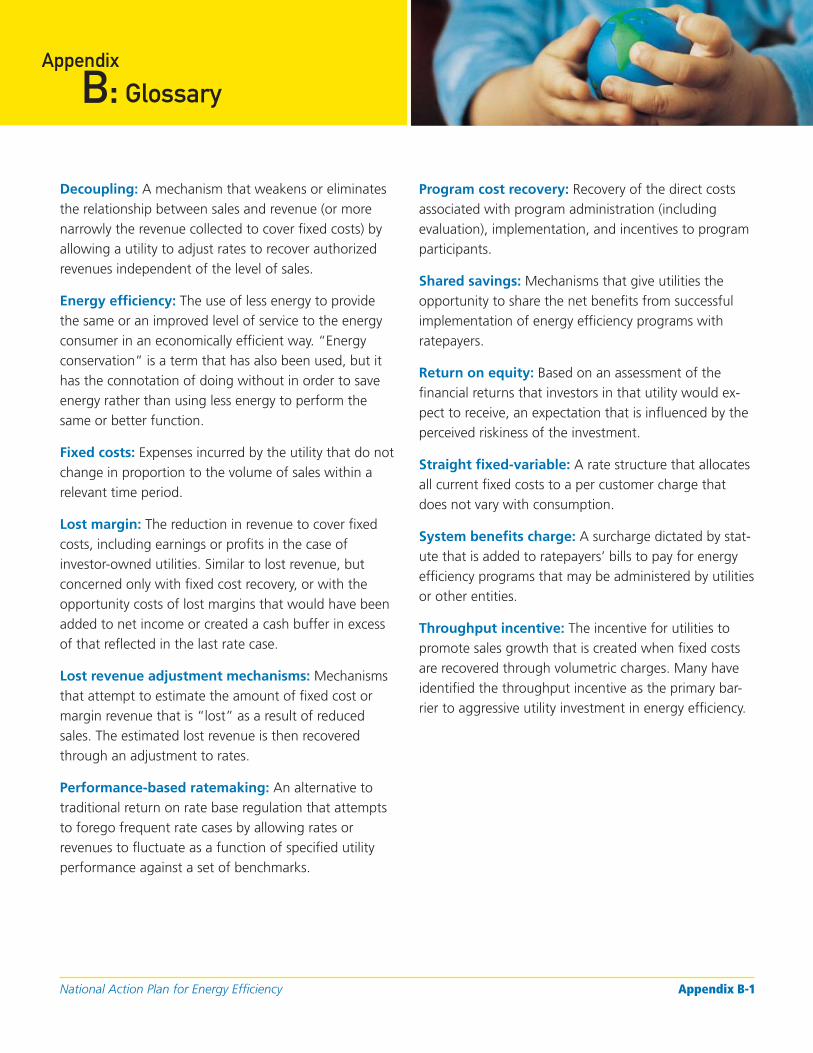
Appendix
B: Glossary
Decoupling: A mechanism that weakens or eliminates the relationship between sales and revenue (or more narrowly the revenue collected to cover fi xed costs) by allowing a utility to adjust rates to recover authorized revenues independent of the level of sales.
Energy effi ciency: The use of less energy to provide the same or an improved level of service to the energy consumer in an economically effi cient way. “Energy conservation” is a term that has also been used, but it has the connotation of doing without in order to save energy rather than using less energy to perform the same or better function.
Fixed costs: Expenses incurred by the utility that do not change in proportion to the volume of sales within a relevant time period.
Lost margin: The reduction in revenue to cover fi xed costs, including earnings or profi ts in the case of investor-owned utilities. Similar to lost revenue, but concerned only with fi xed cost recovery, or with the opportunity costs of lost margins that would have been added to net income or created a cash buffer in excess of that refl ected in the last rate case.
Lost revenue adjustment mechanisms: Mechanisms that attempt to estimate the amount of fi xed cost or margin revenue that is “lost” as a result of reduced sales. The estimated lost revenue is then recovered through an adjustment to rates.
Performance-based ratemaking: An alternative to traditional return on rate base regulation that attempts to forego frequent rate cases by allowing rates or revenues to fl uctuate as a function of specifi ed utility performance against a set of benchmarks.
Program cost recovery: Recovery of the direct costs associated with program administration (including evaluation), implementation, and incentives to program participants.
Shared savings: Mechanisms that give utilities the opportunity to share the net benefi ts from successful implementation of energy effi ciency programs with ratepayers.
Return on equity: Based on an assessment of the fi nancial returns that investors in that utility would expect to receive, an expectation that is infl uenced by the perceived riskiness of the investment.
Straight fi xed-variable: A rate structure that allocates all current fi xed costs to a per customer charge that does not vary with consumption.
System benefits charge: A surcharge dictated by statute that is added to ratepayers’ bills to pay for energy effi ciency programs that may be administered by utilities or other entities.
Throughput incentive: The incentive for utilities to promote sales growth that is created when fi xed costs are recovered through volumetric charges. Many have identifi ed the throughput incentive as the primary barrier to aggressive utility investment in energy effi ciency.
National Action Plan for Energy Effi ciency Appendix B-1


Appendix Sources for C: Policy Status Table
This appendix provides specific sources by state for the status of energy efficiency cost recovery and incentive mechanisms provided in Tables ES-1 and 1-2.
Table C-1. Policy Status Table
States Sources
Arizona Arizona Corporation Commission, Decision Nos. 67744 and 69662 in docket E-01345A-05-0816
California 2001 California Public Utilities Code 739.10. D.04-01-048, D.04-03-23, D.04-07-022, D.05-03-023, D.04-05-055, D.05-05-055
Colorado House Bill 1037 (2007) authorizes cost recovery and performance incentives for both gas and electric utilities
Connecticut 2005 Energy Independence Act, Section 21
District of Columbia Code 34-3514
Florida Florida Administrative Code Rule 25-17.015(1)
Hawaii Docket No. 05-0069, Decision and Order No. 23258
Idaho Idaho PUC Case numbers IPC-E-04-15 and IPC-E-06-32
Illinois Illinois Statutes 20-687.606
Indiana Case-by-case
Iowa Iowa Code 2001: Section 476.6; 199 Iowa Administrative Code Chapter 35
Kentucky Kentucky Revised Statute 278.190
Maine Maine Statue Title 35-A
National Action Plan for Energy Effi ciency Appendix C-1
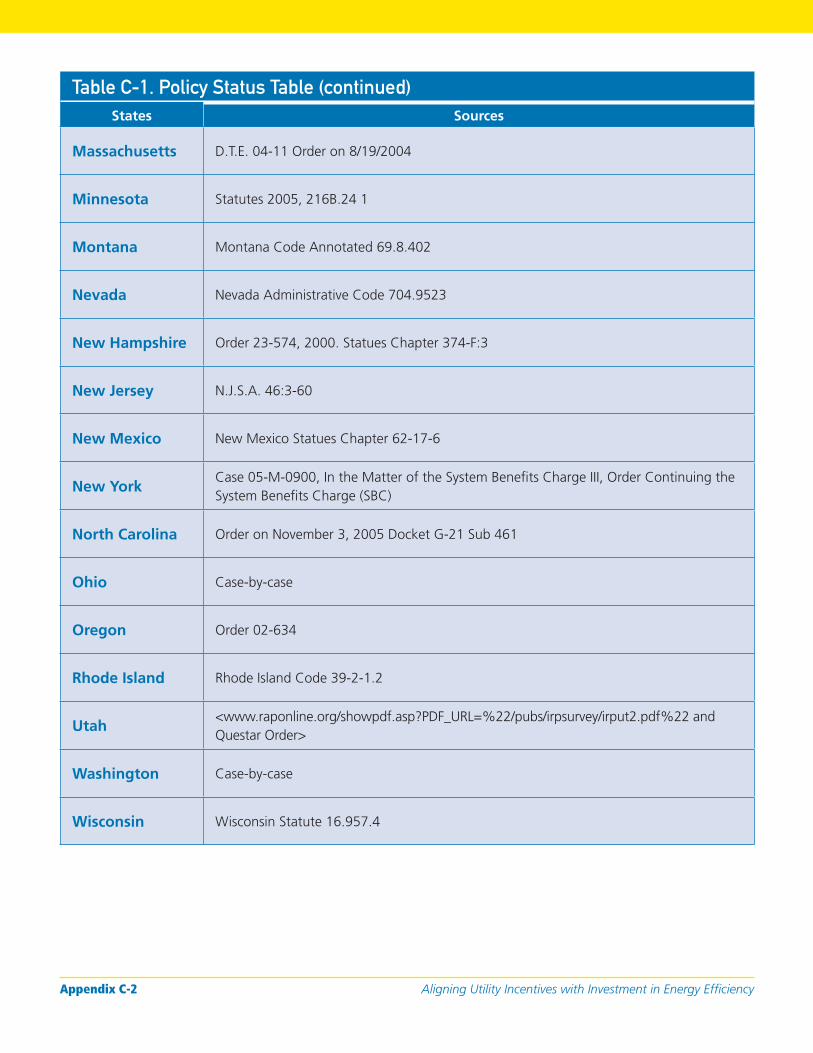
Table C-1. Policy Status Table (continued)
States Sources
Massachusetts D.T.E. 04-11 Order on 8/19/2004
Minnesota Statutes 2005, 216B.24 1
Montana Montana Code Annotated 69.8.402
Nevada Nevada Administrative Code 704.9523
New Hampshire Order 23-574, 2000. Statues Chapter 374-F:3
New Jersey N.J.S.A. 46:3-60
New Mexico New Mexico Statues Chapter 62-17-6
New York Case 05-M-0900, In the Matter of the System Benefi ts Charge III, Order Continuing the System Benefi ts Charge (SBC)
North Carolina Order on November 3, 2005 Docket G-21 Sub 461
Ohio Case-by-case
Oregon Order 02-634
Rhode Island Rhode Island Code 39-2-1.2
Utah <www.raponline.org/showpdf.asp?PDF_URL=%22/pubs/irpsurvey/irput2.pdf%22 and Questar Order>
Washington Case-by-case
Wisconsin Wisconsin Statute 16.957.4
Appendix C-2 Aligning Utility Incentives with Investment in Energy Effi ciency
Appendix
D: Case Study Detail
This appendix provides additional detail on the Iowa and Florida case studies discussed in this Report.
D.1 Iowa
199 Iowa Administrative Code Chapter 351 specifi es the application of the cost recovery rider.
Energy effi ciency cost recovery (ECR) factors, must be calculated separately for each customer or group classifi cation. ECR factors are calculated using the following formula:
ECR factor = ((PAC) + (ADPC × 12) + (ECE) + A)/ASU
where:
• The ECR factor is the recovery amount per unit of sales over the 12-month recovery period.
• PAC is the annual amount of previously approved costs from earlier ECR proceedings, until the previously approved costs are fully recovered.
• ECE is the estimated contemporaneous expenditures to be incurred during the 12-month recovery period.
• “A” is the adjustment factor equal to over-collections or under-collections determined in the annual reconciliation, and for adjustments ordered by the board in prudence reviews.
• ASU is the annual sales units estimated for the 12-month recovery period.
• ADPC is amortized deferred past cost. It is calculated as the levelized monthly payment needed to provide a return of and on the utility’s deferred past costs (DPC). ADPC is calculated as:
ADPC = DPC [r(1+r)n] ÷ [(1+r)n – 1]
where:
• DPC is deferred past costs, including carrying charges that have not previously been approved for recovery, until the deferred past costs are fully recovered.
• n is the length of the utility’s plan in months.
• r is the applicable monthly rate of return calculated as:
r = (1+R)1/12 -1 or
r = R /12 if previously approved
• R is the pretax overall rate of return the board held just and reasonable in the utility’s most recent general rate case involving the same type of utility service. If the board has not rendered a decision in an applicable rate case for a utility, the average of the weighted average cost rates for each of the capital structure components allowed in general rate cases within the preceding 24 months for Iowa utilities providing the same type of utility service will be used to determine the applicable pretax overall rate of return.
D.2 Florida
The procedure for conservation cost recovery described by Florida Administrative Code Rule 25-17.015(1)2
includes the following elements:
• Utilities submit an annual fi nal true-up fi ling showing the actual common costs, individual program costs and revenues, and actual total ECCR revenues for the most recent 12-month historical period from January 1 through December 31 that ends prior to the annual ECCR proceedings. As part of this fi ling a utility must include:
National Action Plan for Energy Effi ciency Appendix D-1
• A summary comparison of the actual total costs and revenues reported, to the estimated total costs and revenues previously reported for the same period covered by the fi ling. The fi ling shall also include the fi nal over- or under-recovery of total conservation costs for the fi nal true-up period.
– Eight months of actual and four months of projected common costs, individual program costs, and any revenues collected. Actual costs and revenues should begin January 1, immediately following the period described in paragraph (1) (a). The fi ling shall also include the estimated/actual over- or under-recovery of total conservation costs for the estimated/actual true-up period.
– An annual projection fi ling showing 12 months of projected common costs and program costs for the period beginning January 1, following the annual hearing.
– An annual petition setting forth proposed ECCR factors to be effective for the 12-month period beginning January 1, following the hearing.
• Within the 90 days that immediately follow the fi rst six months of the reporting period, each utility must report the actual results for that period.
• Each utility must establish separate accounts or sub-accounts for each conservation program for the purposes of recording the costs incurred for that program. Each utility must also establish separate sub-accounts for any revenues derived from specifi c customer charges associated with specifi c programs.
• New programs or program modifi cations must be approved prior to a utility seeking cost recovery. Specifi cally, any incentives or rebates associated with new or modifi ed programs may not be recovered if paid before approval. However, if a utility incurs prudent implementation costs before a new program or modifi cation has been approved by the commission, a utility may seek recovery of these expenditures.
Advertising expense recovered through ECCR must be directly related to an approved conservation program, shall not mention a competing energy source, and shall not be company image-enhancing.
D.3 Notes
1. 199 Iowa Administrative Code Chapter 35, accessed at <http:// www.legis.state.ia.us/Rules/Current/iac/199iac/19935/19935. pdf>.
2. Florida Administrative Code Rule 25-17.015(1), accessed at <http://www.fl rules.org/gateway/RuleNo.asp?ID=25-17.015>.
Appendix D-2 Aligning Utility Incentives with Investment in Energy Effi ciency
Appendix
E: References
E.1 Cited References
American Gas Association (2006a). Natural Gas Rate Round-Up: Decoupling Mechanisms—July 2006 Update.
American Gas Association (2006b). Natural Gas Rate Round-Up: A Periodic Update on Innovative Rate Design, July 2006.
American Gas Association (2006c). Natural Gas Rate Round-Up: Innovative Rate Designs for Fixed Cost Recovery, June 2006.
American Gas Association (2007). Natural Gas Rate Round-Up: Update on Revenue Decoupling Mechanisms, April 2007.
Consortium for Energy Effi ciency (2006). U.S. Energy-Effi ciency Programs: A $2.6 Billion Industry. <www. cee1.org/ee-pe/ee-pe-main.php3>
California Public Utilities Commission [CPUC] (2006). Order Instituting Rulemaking to Examine the Commission’s Post-2005 Energy Effi ciency Policies, Programs, Evaluation, Measurement and Verifi cation, and Related Issues. Before the Public Utilities Commission of the State of California, San Francisco, California. Rulemaking 06-04-010 (Filed April 13, 2006).
California Public Utilities Commission [CPUC] (2007). Proposed Decision of Commissioner Grueneich and Administrative Law Judge Gottstein (Mailed 8/9/2007), Before the Public Utilities Commission of the State of California, Order Instituting Rulemaking to Examine the Commission’s Post-2005 Energy Effi ciency Policies, Programs, Evaluation, Measurement and Verifi cation, and Related Issues. Rulemaking 06-04-010 (Filed April 13, 2006), Interim Opinion
on Phase 1 Issues: Shareholder Risk/Reward Incentive Mechanism for Energy Effi ciency Programs.
Costello, K. (2006). Revenue Decoupling for Natural Gas Utilities—Briefi ng Paper. National Regulatory Research Institute.
Delaware Public Service Commission [PSC] (2007). Before the Public Service Commission of the State of Delaware, in the Matter of the Investigation of the Public Service Commission into Revenue Decoupling Mechanisms for Potential Adoption and Implementation by Electric and Natural Gas Utilities Subject to the Jurisdiction of the Public Service Commission. PSC Regulation Docket No. 59 (Opened March 20, 2007).
Duke Energy (2007). Application of Duke Energy Carolinas, LLC for Approval of Save-a-Watt Approach, Energy Effi ciency Rider and Portfolio of Energy Effi ciency Programs. Docket No. E-7, Sub 831, fi led May 7, 2007. <http://ncuc.commerce.state.nc.us/ cgi-bin/webview/senddoc.pgm?dispfmt=&itype= Q&authorization=&parm2=TAAAAA72170B&par m3=000126792>
U.S. Energy Information Administration [EIA] (2006). Demand-Side Management Program Direct and Indirect Costs. In Electric Power Annual. <www.eia. doe.gov/cneaf/electricity/epa/epat9p7.html>
ELCON (2007). Revenue Decoupling: A Policy Brief of the Electricity Consumers Resource Council. p. 8.
Eto, J., S. Stoft, and T. Belden (1994). The Theory and Practice of Decoupling. Energy & Environment Division, Lawrence Berkeley Laboratory, University of California–Berkeley.
Florida Public Service Commission [PSC] (2007). Annual Report on Activities Pursuant to the Florida Energy Effi ciency Conservation Act.
National Action Plan for Energy Effi ciency Appendix E-1
Hansen, D.G. (2007). A Review of Natural Gas Decoupling Mechanisms and Alternative Methods for Addressing Utility Disincentives to Promote Conservation. Utah Department of Public Utilities, Docket No. 05-057-T01, DPU Exh No. 6.1 (DGH-A.1).
Hawaii Public Utilities Commission [PUC] (2007). Before the Public Utilities Commission of the State of Hawaii, In the Matter of Hawaiian Electric Company, Inc, for Approval and/or Modifi cation of Demand-Side and Load Management Programs and Recovery of Program Costs and DSM Utility Incentives. Docket No. 05-0069, Decision and Order No. 23258, February 13, 2007.
Idaho Public Utilities Commission [PUC] (2007). Order No. 30267 Issued in Case No. IPC-E-014-15 in the Matter of Investigation of Financial Disincentives to Investment in Energy Effi ciency by Idaho Power Company. <www.puc.state.id.us/orders/30299.ord/ 30267.pdf>
Kushler, M., D. York, and P. Witte (2006). Aligning Utility Interests with Energy Effi ciency Objectives: A Review of Recent Efforts at Decoupling and Performance Incentives. American Council for an Energy-Effi cient Economy, Report Number U061.
Louisville Gas & Electric [LG&E] (2004). Rates, Terms and Conditions for Furnishing Electric Service in the Nine Counties of the Louisville, Kentucky, Metropolitan Area as Depicted on Territorial Maps as Filed with the Public Service Commission of Kentucky. P.S.C. of Ky. Electric No. 6. <www.eon-us.com/rsc/lge/ lgereselectric.pdf>
Maryland Public Service Commission [PSC] (2005). Order No. 80460 Issued in Case No. 9036 in the Matter of the Application of the Baltimore Gas and Electric Company for Revision of Gas Rates. <http://webapp.psc.state.md.us/ Intranet/Casenum/ NewIndex3_VOpenFile. cfm?fi lepath=C%3A%5CCasenum%5C90009099%5C9036%5CItem_116%5C80460.pdf>
Michigan Public Service Commission [PUC] (2003). Direct Testimony of Karl. A. McDermott before the
Michigan Public Service Commission in Case No. U-13808. <http://efi le.mpsc.cis.state.mi.us/efi le/ docs/13808/0050.pdf>
National Action Plan for Energy Effi ciency (2006a). The National Action Plan for Energy Effi ciency. <http://www. epa.gov/cleanenergy/pdf/napee/napee_report.pdf>
National Action Plan for Energy Effi ciency (2006b). Utility Ratemaking and Revenue Requirements. In The National Action Plan for Energy Effi ciency. <http://www. epa.gov/cleanenergy/pdf/napee/napee_report.pdf>
New Jersey Board of Public Utilities [BPU] (2006). State of New Jersey Board of Public Utilities Decision and Order Approving Stipulation in the Matter of the Petitions of North Jersey Gas Company for the Implementation of a Conservation and Usage Adjustment. Docket No. GR05121019 and GR05121020.
New Jersey Resources [NJR] (2007). New Jersey Resources Announces Fiscal 2007 First-Quarter Earnings; Increases Earnings Guidance. <http://ww.njresources. com/news/releases/2007/njr/07-12earn307.asp>
Questar Gas (n.d.). Questar Gas Company Tariff for Gas Service in the State of Utah. PSCU 400. <http:// www.questargas.com/Tariffs/uttariff.pdf>
Reid, M. (1988). Ratebasing of Utility Conservation and Load Management Programs. The Alliance to Save Energy.
Sedano, R. (2006). Decoupling: Recent Developments on the Idea Everyone Is Still Talking About. Regulatory Assistance Project. <http://www.raponline.org>
Utah Public Service Commission [PSC] (2006).Order Approving Settlement Stipulation, In The Matter Of the Approval of the Conservation Enabling Tariff Adjustment Option and Accounting Orders. Docket No. 05-057-T01.
Xcel Energy (2006). 2006 Status Report and Associated Compliance Filings. Minnesota Natural Gas and Electric Conservation Improvement Program. Docket No. E,G002/CIP-04-880.16.
Appendix E-2 Aligning Utility Incentives with Investment in Energy Effi ciency
Yoshimura, H. (2007). Market-Based Approaches to Demand Resource Procurement and Pricing: ISO New England’s Forward Capacity Market.
E.2 Additional Resources
Allred, K.A. (2007). Increasing Energy Effi ciency. Utah Energy Summit, Panel Discussion.
Arkansas Public Service Commission, Docket No. 06-004-R, In The Matter of a Notice of Inquiry Developing and Implementing Energy Regarding a Rulemaking For Effi ciency Programs, Initial Comments, March 2006.
California Energy Markets, An Independent News Service from Energy Newsdata. May 2007.
Center for Energy Economic and Environmental Policy (2005). Decoupling White Paper #1. Presented for discussion at the Strategic Issues Forum Meeting.
Charles River Associates (2005). Primer on Demand-Side Management. Prepared for The World Bank.
Cooper, R. (2004). Creating a Win/Win Natural Gas Distribution Energy Effi ciency Program: Recognizing and Aligning Stakeholder Interests. American Gas Association before the MEEA 2004 Annual Conference.
D.T.E. 98-100 Investigation by the Department of Telecommunications and Energy on its own motion to establish methods and procedures to evaluate and approve energy effi ciency programs, pursuant to G.L. c. 25, § 19 and c. 25A, § 11G.
D.T.E. 03-48 Petition of Boston Edison Company, Cambridge Electric Light Company, and Commonwealth Electric Company, d/b/a NSTAR Electric Company, pursuant to G.L. c. 25, § 19 and G.L. c. 25A, § 11G, for approval by the Department of Telecommunications and Energy of an Energy Effi ciency Plan for 2003.
D.T.E. 03-2 Joint Petition of Massachusetts Electric Company and Nantucket Electric Company, pursuant to G.L. c. 25, § 19, G.L. c. 25A, § 11G, and G.L.
c. 164, § 17A, for approval by the Department of Telecommunications and Energy of its 2003 Energy Effi ciency Plan, including a proposal for fi nancial assistance to municipal energy effi ciency projects, September 2003.
D.T.E./D.P.U. 06-45 Petition of Boston Edison Company, Cambridge Electric Light Company, and Commonwealth Electric Company, d/b/a NSTAR Electric, pursuant to G.L. c. 25, § 19 and G.L. c. 25A, § 11G, for approval of its 2006 Energy Effi ciency Plan, May 8, 2007.
Dismukes, E.D. (2006). Regulatory Issues in Rate Design Incentives & Energy Effi ciency. 34th Annual PURC Conference, A Century of Utility Regulation: Looking Forward to the Next Hundred Years.
DPUC Investigation into Decoupling Energy Distribution Company Earnings from Sales, Docket No. 05-09-09, State of Connecticut Department of Public Utility Control, January 2006
Eto, J. (1996). The Past, Present, and Future of U.S. Utility Demand-Side Management Programs. Lawrence Berkeley National Laboratory, LBNL-39931.
Gas and Ripon Water Rates, Prefi led Direct Testimony of Ralph Cavanagh on Behalf of the Citizens Utility Board, April 2005.
Geller, H. (2002). Utility Energy Effi ciency Programs and System Benefi ts Charges in the Southwest. Southwest Energy Effi ciency Project.
Harrington, C., D. Moskovitz, T. Austin, C. Weinberg, and E. Holt (1994). Regulatory Reform: Removing the Incentives.
Hirst, E. (1993). Statistical Recoupling: A New Way to Break the Link Between Electric-Utility Sales and Revenues.
Hirst, E. (1994). Electric Utility Programs in a Competitive Market. Oak Ridge National Laboratory, ORNL/ CON-384.
National Action Plan for Energy Effi ciency Appendix E-3

International Energy Agency Demand-Side Management Implementing Agreement Task 9, Municipalities and Energy Effi ciency in a Liberalized System: Case Studies and Good Practice in Rising to the Challenge of Liberalization.
KEMA, Inc. (2004). New Jersey Energy Effi ciency and Distributed Generation Market Assessment: Final Report to Rutgers University Center for Energy, Economic and Environmental Policy.
Lazar, J., and C. Harrington (2006). Regulatory Barriers and Opportunities Eliminating Disincentives, Creating the Right Incentives. Regulatory Assistance Project.
Lazar, J. (2006). Examples of Good, Bad, and Ugly De-coupling Mechanisms. Presented at NARUC Symposium Aligning Regulatory Incentives with Demand-Side Resources.
Moskovits, D., C. Harrington, and T. Austin (1992). Decoupling vs. Lost Revenues Regulatory Considerations. Regulatory Assistance Project.
New Jersey Public Utilities, Offi ce of Clean Energy (2005). New Jersey’s Clean Energy Program, 2005 Annual Report.
Offi ce of Technology Assessment, U.S. Congress (1993). Energy Effi ciency: Challenges and Opportunities for Electric Utilities. OTA-E-561, NTIS Order #PB94-107547.
Order Requiring Proposals for Revenue Decoupling Mechanisms (Issued and Effective April 20, 2007, CASE 03-E-0640—Proceeding on Motion of the Commission to Investigate Potential Electric Delivery Rate Disincentives Against the Promotion of Energy Effi ciency, Renewable Technologies and Distributed Generation.
Oregon Decoupling Natural Gas Sales, State EE/RE Technical Forum, May 2005.
Regulatory Assistance Project (2000). Performance-Based Regulation for Distribution Utilities.
Regulatory Assistance Project (2005). Regulatory Reform: Removing the Disincentives to Utility Investment in Energy Effi ciency. Issuesletter, September 2005.
Sedano, R. (2006). Energy Effi ciency Practices in the U.S. Kansas Corporation Commission Workshop on Energy Effi ciency, Regulatory Assistance Project.
Shambo, F. (2007). The Utility Perspective. Indiana Submittal on Energy Effi ciency Panel Discussion on Cost Recovery Issues.
Shirley, W. (2006). Decoupling Throughput from Profi ts: The Revenue per Customer Method: Presentation to NARUC Workshop: Aligning Regulatory Incentives with Demand-Side Resources. Regulatory Assistance Project.
Shirley, W. (2006). Energy Effi ciency & Utility Profi ts: Do Your Incentives Need Alignment? The Third Annual Southwest Energy Effi ciency Workshop, Snowbird, Utah. Regulatory Assistance Project.
Shirley, W. (2006). Energy Efficiency & Utility Profi ts: Understanding & Living with Utility Incentives. EPA Workshop on Gas Efficiency. Regulatory Assistance Project.
Shirley, W. (2007). National Perspective on Cost Effectiveness, Cost Recovery and Financial Incentives. Colorado DSM Informational Workshop. Regulatory Assistance Project.
Southern California Edison (2006). Cal.PUC Sheet No. 41472-E.
State EE/RE Technical Forum (2005). Call #8: Decoupling and Other Mechanisms to Address Utility Disincentives for Implementing Energy Effi ciency.
Stoft, S., J. Eto., and S. Kito (1995). DSM Shareholder Incentives: Current Designs and Economic Theory. Lawrence Berkeley Laboratory, LBL-36580.
Violette, D., and R. Sedano (2006). Demand-Side Management: Determining Appropriate Spending Levels and Cost-Effectiveness Testing. Prepared for Canadian Association of Members of Public Utility Tribunals.
Appendix E-4 Aligning Utility Incentives with Investment in Energy Effi ciency
Washington Utilities & Transportation Commission, UTC V. Pacifi corp D/B/A Pacifi c Power & Light Company, Docket Nos. UE-050684 and UE-050412, Rebuttal Testimony of Jim Lazar on Behalf of Public Counsel, December 2005
Weston, R. (2007). Customer-Sited Resources & Utility Profi ts: Aligning Incentives with Public Policy. Regulatory Assistance Project.
National Action Plan for Energy Effi ciency Appendix E-5


Funding and printing for this report was provided by the U.S. Department of Energy and U.S. Environmental Protection Agency in their capacity as co-sponsors for the National Action Plan for Energy Effi ciency.
Recycled/Recyclable—Printed with Vegetable Oil Based Inks on 100% (Minimum 50% Postconsumer) Recycled Paper