Embed Size (px)
Citation preview

www.iisd.org/tkn © 2013 The International Institute for Sustainable Development
Assessing Investment Incentives in MalawiNelson Nsiku
December 2012

TKN POLICY BRIEF DECEMBER 2012Assessing Investment Incentives in Malawi ii
© 2013 The International Institute for Sustainable DevelopmentPublished by the International Institute for Sustainable Development.
About IISDThe International Institute for Sustainable Development (IISD) contributes to sustainable development by advancing policy recommendations on international trade and investment, economic policy, climate change and energy, and management of natural and social capital, as well as the enabling role of communication technologies in these areas. We report on international negotiations and disseminate knowledge gained through collaborative projects, resulting in more rigorous research, capacity building in developing countries, better networks spanning the North and the South, and better global connections among researchers, practitioners, citizens and policy-makers.
IISD’s vision is better living for all—sustainably; its mission is to champion innovation, enabling societies to live sustainably. IISD is registered as a charitable organization in Canada and has 501(c)(3) status in the United States. IISD receives core operating support from the Government of Canada, provided through the Canadian International Development Agency (CIDA), the International Development Research Centre (IDRC), and from the Province of Manitoba. The Institute receives project funding from numerous governments inside and outside Canada, United Nations agencies, foundations and the private sector.
Head Office161 Portage Avenue East, 6th Floor, Winnipeg, Manitoba, Canada R3B 0Y4 Tel: +1 (204) 958-7700 | Fax: +1 (204) 958-7710 | Web site: www.iisd.org
About TKNThe Trade Knowledge Network (TKN) is a global collaboration of research institutions across Africa, Asia, Europe and the Americas working on issues of trade, investment and sustainable development. Coordinated by the International Institute for Sustainable Development (IISD), the TKN links network members, strengthens capacity in areas of research, training and policy analysis, and also generates new research to assess and address the impact of trade and investment policies on sustainable development.
The TKN brings together institutions and individuals working on common concerns, strengthening each others’ research and communication capacity and knowledge bases, and developing solutions to share with others outside the network. It thereby provides a platform for partner-based research and specific policy engagement.
Assessing Investment Incentives in Malawi
December 2012
Nelson Nsiku

TKN POLICY BRIEF DECEMBER 2012Assessing Investment Incentives in Malawi iii
Table of Contents1.0 Introduction .................................................................................................................................................................................................1
2.0 An Overview of Malawi’s Economic and Investment Policy ....................................................................................................3
2.1 Malawi’s Growth Strategy ............................................................................................................................................................3
2.2 Foreign Direct Investment (FDI) Trends ..................................................................................................................................3
3.0 Investment Incentives ............................................................................................................................................................................5
3.1 Definition of Investment Incentive ............................................................................................................................................5
3.2 Investment Incentives in Malawi ...............................................................................................................................................5
3.2.1 General Tax Incentives .......................................................................................................................................................6
3.2.2 Raw Materials Under Industrial Rebate Scheme ....................................................................................................7
3.2.3 Tourism Sector .....................................................................................................................................................................7
3.2.4 Agriculture Sector and Fishing Industry Incentives ................................................................................................7
3.2.5 Mining Industry ..................................................................................................................................................................7
3.2.6 Water Supply, Electricity Generation, Transmission and Distribution, and Telecommunication Sectors ..................................................................................................................................................................................7
3.2.7 Export Incentives ...............................................................................................................................................................8
3.2.8 Other Incentives ..................................................................................................................................................................9
3.3 Government Management of Incentive Programs .............................................................................................................9
4.0 Concerns Related to Investment Incentives ................................................................................................................................. 10
4.1 Government Revenue Foregone ................................................................................................................................................ 10
4.2 Crowding Out Domestic Investment ..................................................................................................................................... 12
4.3 Misuse ............................................................................................................................................................................................. 12
4.4 Administrative Costs .................................................................................................................................................................. 12
5.0 Recommendations ................................................................................................................................................................................. 13
References ......................................................................................................................................................................................................... 14
Figure 1. Types of Taxes Expressed as Percentage of GDP (2010/11 Fiscal Year) ........................................................................ 1
Figure 2. Individual Tax Contribution to Total Revenue (Five-Year Trend) ....................................................................................2
Figure 3. Individual Tax Contributions to Total Revenue (Decade Trends) ...................................................................................2
Figure 4. FDI Inflows 2003–2008 (2009–2011 Includes Pledges) .................................................................................................4
Figure 5. Investment Patterns by Origin and Levels (1993–2012) ..................................................................................................4
Figure 6. Customs Revenue Foregone ...................................................................................................................................................... 11
Figure 7. Selected Incentives Revenue Loss (Customs, Excise & VAT—estimated) ................................................................. 11
List of Figures

TKN POLICY BRIEF DECEMBER 2012Assessing Investment Incentives in Malawi 1
1.0 IntroductionMalawi is struggling with public debt in part because tax revenue is not a sustainable source of government revenue (Inter Press Service, 2010). Public expenditure outpaces tax revenue, and the gap is widening. In the 2010/11 fiscal year, gross tax revenue was 21.6 per cent of GDP against total operating expenditures of 25.5 per cent of GDP. It was projected that in 2011/12 gross tax revenue will be 19.6 per cent of GDP, against total operating expenditures of 25.7 per cent of GDP (Malawi Government, 2012). Meanwhile, Malawi faces ballooning budget deficits, which have widened from MWK13 billion1 (US$86 million) in fiscal year 2010/11 and project to be MWK69 billion (US$458 million) in FY 2011/12.
FIGURE 1. TYPES OF TAXES EXPRESSED AS PERCENTAGE OF GDP (2010/11 FISCAL YEAR)Source: Government of Malawi, Economic Report 2012.
The government of Malawi has successfully generated more tax revenue in recent years, but this has largely been due to personal income and consumption taxes rather than corporate income taxes (see Fig.1). In the fiscal year 2010/11, the government expanded the tax base through increased fees and charges and the elimination of tax breaks for the private sector, as part of its controversial “zero deficit” national budget. However, these reforms were strongly resisted by the private sector, which argued that they would hurt investment and growth. Facing pressure from businesses, the government rolled back many of the tax reforms in the subsequent 2012/13 national budget (Malawi Government, 2012). The investment allowance was brought back to 100 per cent (from 40 per cent), the international transport allowance was brought back to 25 per cent (from 15 per cent), the export allowance was increased to 25 per cent (from 15 per cent), and import duty, import excise and import VAT on raw materials imported under the industrial rebate scheme has been removed. In short, the private sector has been provided with a range of tax exemptions on the pretext of promoting exports, private sector growth and jobs.
1 Malawian kwacha. US$1 = approximately MWK165.
Companies, 2.76% Non Resident Tax, 0.12%
PAYE, 4.36%
WHT, 1.35%
FBT, 0.33%
VAT, 6.99%
Excise Duties, 3.36%
Customs, 2.27%
TKN POLICY BRIEF DECEMBER 2012Assessing Investment Incentives in Malawi 2
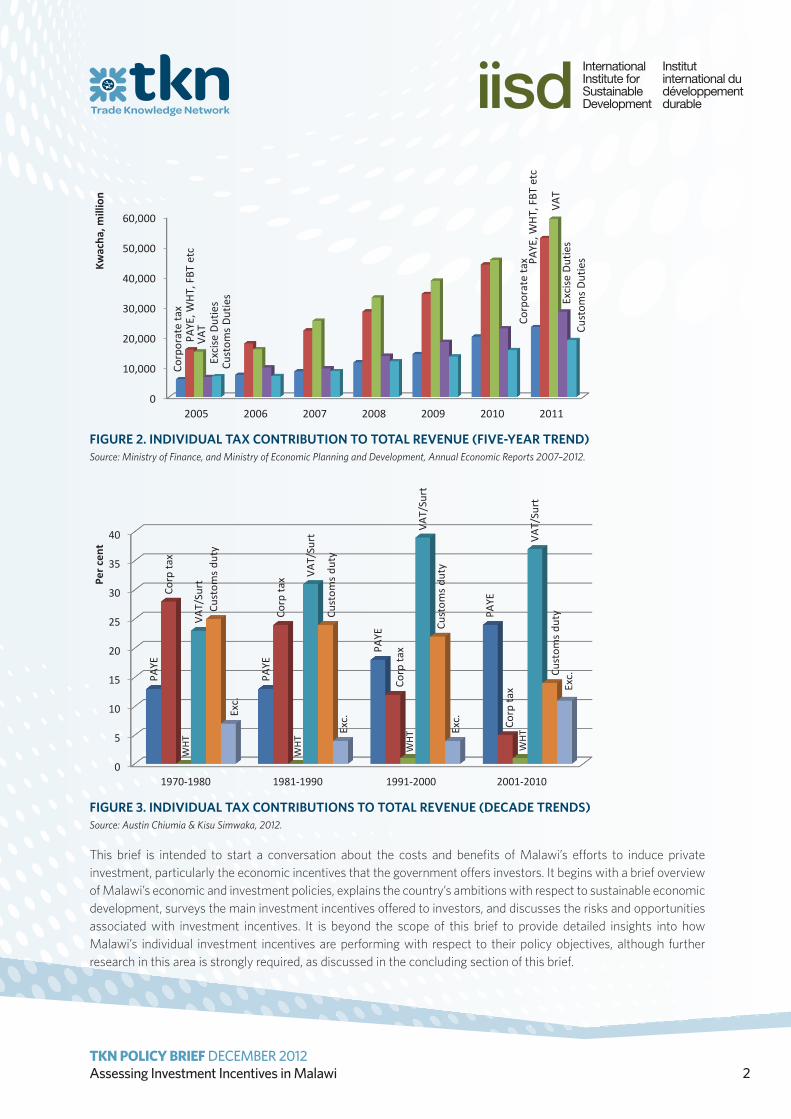
FIGURE 2. INDIVIDUAL TAX CONTRIBUTION TO TOTAL REVENUE (FIVE-YEAR TREND)Source: Ministry of Finance, and Ministry of Economic Planning and Development, Annual Economic Reports 2007–2012.
FIGURE 3. INDIVIDUAL TAX CONTRIBUTIONS TO TOTAL REVENUE (DECADE TRENDS)Source: Austin Chiumia & Kisu Simwaka, 2012.
This brief is intended to start a conversation about the costs and benefits of Malawi’s efforts to induce private investment, particularly the economic incentives that the government offers investors. It begins with a brief overview of Malawi’s economic and investment policies, explains the country’s ambitions with respect to sustainable economic development, surveys the main investment incentives offered to investors, and discusses the risks and opportunities associated with investment incentives. It is beyond the scope of this brief to provide detailed insights into how Malawi’s individual investment incentives are performing with respect to their policy objectives, although further research in this area is strongly required, as discussed in the concluding section of this brief.
0
10,000
20,000
30,000
40,000
50,000
60,000
2005 2006 2007 2008 2009 2010 2011
Corp
orat
e ta
x
Corp
orat
e ta
x
PAYE
, WHT
, FBT
etc PA
YE, W
HT, F
BT e
tc
VAT
VAT
Exci
se D
utie
s Exci
se D
utie
s
Cust
oms D
utie
s
Cust
oms D
utie
sKwac
ha, m
illio
n
0
5
10
15
20
25
30
35
40
1970-1980 1981-1990 1991-2000 2001-2010
PAYE
PAYE
PAYE
PAYE
Corp
tax
Corp
tax
Corp
tax
Corp
tax
WH
T
WH
T
WH
T
WH
T
VAT/
Surt
VAT/
Surt
VAT/
Surt
VAT/
Surt
Cust
oms
duty
Cust
oms
duty
Cust
oms
duty
Cust
oms
duty
Exc.
Exc.
Exc.
Exc.
Per c
ent
TKN POLICY BRIEF DECEMBER 2012Assessing Investment Incentives in Malawi 3
2.0 An Overview of Malawi’s Economic and Investment Policy Malawi’s economy is highly dependent on agriculture, which represented 28.33 per cent of GDP in 2011. However, manufacturing and services (wholesale and retail trade and distribution), which together accounted for 31 per cent of GDP in the same year, are playing an increasing role (Malawi Government, 2012). The agricultural sector’s contribution to GDP has been steady since 2006, while the manufacturing sector’s contribution has increased from 8.2 per cent of GDP in 2006 to 10.16 per cent in 2011. The manufacturing sector grew by 1.7 per cent in 2011 compared to 2.2 per cent in 2010 and 5.4 per cent in 2009 (Malawi Government, 2010). The slower recent growth is a reflection of a number of challenges, including a shortage of foreign exchange and energy supplies (Malawi Government, 2012).
2.1 Malawi’s Growth Strategy The Malawi Vision 2020, launched in 1998, is a policy framework that sets out a long-term development plan detailing the country’s economic and social aspirations for 2020 (Malawi Government, 1998). Vision 2020 sets the goal of Malawi becoming a self-reliant and technologically driven middle-income country by 2020. The main economic objective is sustainable growth and development, with an emphasis on manufacturing (in particular the science and technology sector) as the key driver of the economy. The primary economic strategies employed to reach these objectives are the Malawi Poverty Reduction Strategy (MPRS) and the Malawi Growth and Development Strategy (MGDS).
The MPRS, launched in 2002, was Malawi’s first attempt to translate long-term vision into medium-term action plans. The overarching goal of the MPRS was to achieve “sustainable poverty reduction through empowerment of the poor.” One of the key pillars of the MPRS was the promotion of rapid (and sustainable) pro-poor economic growth and structural transformation. A review of the MPRS in 2005 informed the strategic direction of the MGDS for the period 2006 to 2011.
The MGDS, now in its second phase (MGDS II), is a medium-term national development strategy for the period 2011–2016 (Malawi Government, 2011). The main thrust of the strategy is to create an enabling environment for domestic and foreign investment through pro-business legal and regulatory reforms. A range of reforms are in the process of being developed and some will soon be tabled in Parliament, including: the Export Processing Zones (Amendment) Bill, Business Licensing Bill, Insolvency Bill, Companies (Amendment) Bill, Business Registration Bill and Personal Property Security Bill. A key objective is to ease the transaction costs of doing business in Malawi. Another medium-term outcome sought under MGDS II is the growth of local micro, small and medium enterprises (MSMEs), and increased private sector investment in rural areas.
2.2 Foreign Direct Investment (FDI) TrendsFDI2 inflows have been on the decline apart from a large investment in a rail line in 2011 by a Brazilian company, Vale Logistics Limited. Compared to its neighbours—Zambia, Mozambique and Tanzania—Malawi has not been performing well in attracting FDI.
2 The data collected in Figure 4 refer to a combination of FDI pledges and actual investment made in the country. New investors are required to state their project requirements (staffing, land, incentives as well as their planned capital to be injected into the project) before issuance of the investment licence.

TKN POLICY BRIEF DECEMBER 2012Assessing Investment Incentives in Malawi 4
FIGURE 4. FDI INFLOWS 2003–2008 (2009–2011 INCLUDES PLEDGES)Source: OECD, 2012; Malawi Investment Promotion Agency (MIPA), 2012.
The FDI origins and levels of investment shown through the cumulative number of investments are presented in Fig.5 below. Brazil, with its single investor (Vale Logistics) was the largest source of investment, accounting for 26.7 per cent of the total, followed by India (22.2 per cent), Malawi or domestic (19.1 per cent), South Africa (7.5 per cent), China (5.6 per cent), Australia (5.6 per cent), the United Kingdom (2.7 per cent), Zimbabwe (0.5 per cent) and the United States (0.2 per cent).
Most investment is in urban centres. Put together, investors from Peoples Republic of China, India and Malawi (who are also predominantly Malawians of Asian origin) contributed 46.9 per cent of the total investment and run businesses mostly in urban areas (MIPA, 2012).
FIGURE 5. INVESTMENT PATTERNS BY ORIGIN AND LEVELS (1993–2012)Source: MIPA, 2012.
South African, Australian, British, American and Brazilian investors make up 42.7 per cent and are attracted mainly to natural resources and infrastructure development (National Statistical Office, 2011).
0
200
400
600
800
1000
1200
1400
2003 2004 2005 2006 2007 2008 2009 2010 2011
Moz
ambi
que
Moz
ambi
que
Moz
ambi
que
Moz
ambi
que
Moz
ambi
que
Moz
ambi
que
Tanz
ania
Tanz
ania
Tanz
ania
Tanz
ania
Tanz
ania
Tanz
ania
Zam
bia
Zam
bia
Zam
bia
Zam
bia
Zam
bia
Zam
bia
Mal
awi
Mal
awi
Mal
awi
Mal
awi
Mal
awi
Mal
awi
Mal
awi
Mal
awi
Mal
awi
FDI I
nflo
ws
US$
(mill
ion)
Source: African Economic Outlook 2010-OECD, updated 29 Apr.2010, MIPA, 2012
0.0%
5.0%
10.0%
15.0%
20.0%
25.0%
30.0%
0
20
40
60
80
100
120
140
AU BRZ INDIA MWI PRC SA UK USA ZW
No.
of I
nves
tmen
ts
(Cum
ulat
ive)
No.of Investors Proportion of Total Investment
Prop
ortio
nof
Tot
al In
vest
men
t

TKN POLICY BRIEF DECEMBER 2012Assessing Investment Incentives in Malawi 5
3.0 Investment IncentivesThe Malawian government, like governments in developed and developing countries around the world, uses a variety of economic incentives to attract and retain investment. While developed countries have used investment incentives for over 40 years, since the 1990s they have also been increasingly present in developing countries (Kenneth, 2010). Often lacking the other attributes that make a location attractive to investors—good infrastructure, educated workforce, robust institutions—developing countries frequently view investment incentives as one of the few policy tools at their disposal to draw investment in a highly competitive global market. These incentives include grants, tax credits, subsidized loans, free land and infrastructure. The following section defines “investment incentive,” before describing the main incentives currently offered to investors in Malawi.
3.1 Definition of Investment Incentive There is no one agreed definition of “investment incentives.” Kenneth (2007) defines them narrowly as “a subsidy given to affect the location of investment,” while the United Nations Conference on Trade and Development (UNCTAD) (2004) defines them more broadly as incentives intended to attract foreign or domestic investment using such instruments as: financial incentives (such as grants and loans at concessionary rates); fiscal incentives (such as tax holidays and reduced tax rates); subsidized infrastructure or services; and concessions or exemptions from regulations and standards.
Barbour (2005) also categorizes incentives as fiscal (direct or indirect) or non-fiscal. Direct fiscal incentives include cash payments and payments-in-kind, while indirect fiscal incentives include transfer of funds and liabilities to and from the beneficiary (i.e., reductions in taxes, tax holidays, accelerated depreciation allowances, investment tax allowances or deductions of qualifying expenses). As Barbour explains, non-fiscal incentives include fast-track approval processes or exemptions from certain regulations. Other, non-fiscal, incentives include special deals on input prices from state-owned enterprises and streamlined administrative procedures or exemptions from certain pieces of legislation.
3.2 Investment Incentives in MalawiA full accounting of the investment incentives in Malawi is very difficult due to a lack of publicly available information. Therefore, while this subsection outlines some of the main incentives on offer, it does not attempt to capture all incentives. Financial and regulatory incentives tend to be less visible than fiscal (tax-based) incentives.
Investment incentives in Malawi are predominantly fiscal: government revenue foregone through tax breaks and concessions (Malawi Development Corporation & Price Waterhouse., 1989), industrial rebates, special exemptions and deductions. Tax-based incentives are enshrined in the main tax legislation including the Taxation Act, the Customs and Excise Act, the Income Act and the Export Processing Zones (EPZ) Act. The Malawi Revenue Authority (MRA) is the key tax policy implementation agency (MRA, 2012).
Malawi offers only limited direct and indirect transfers of funds and liabilities. The one exception is the well-known agricultural input subsidy that targets smallholder farmers, known as the Farm Input Subsidy Programme (FISP). The government implemented the FISP3 for maize fertilizers, maize and legume seeds for the seventh season running
3 During the 2011/2012 FISP, 140,000 tonnes of fertilizers were subsidized. Farmers received two bags (one from Urea and the other NPK) at a price of MWK500 per 50 kilograms. Maize seed subsidy was 7,000 tonnes; and 2,800 tonnes of legume seeds (groundnuts, beans, soybeans and pigeon peas) as well as maize storage pesticides.

TKN POLICY BRIEF DECEMBER 2012Assessing Investment Incentives in Malawi 6
in the 2011/2012 crop season. The program makes seeds and fertilizers available to poor smallholder farmers at affordable prices in order to improve crop productivity and hence strengthen food security.
The most politically sensitive investment incentives involve the provision of public goods or services below market value, including water and electricity, or the use of government-provided infrastructure or access to publicly owned natural resources land at no charge or below fair market price. Very little information on these incentives is publicly available.
3.2.1 General Tax IncentivesGeneral tax incentives granted in Malawi are;
• 100 per cent investment allowance, which allows capital costs to be deducted from taxable income, on qualifying expenditures for new buildings and machinery.
• Investment allowance of up to 40 per cent for used buildings and machinery.
• 50 per cent investment allowance for qualifying training costs.
• 100 per cent investment allowance for manufacturing companies, allowing a deduction of all operating expenses, during the initial 25 months of operations.
• Loss carry forward of up to seven years, enabling companies to take advantage of allowances.
• Additional 15 per cent investment allowance for investments in designated areas of the country, such as industrial sites.
To place these incentives in context, tariff rates range from 5 to 25 per cent (WTO, 2012) and VAT is currently 16.5 per cent.
TEXT BOX 1. LESSONS FROM KAYELEKERA URANIUM MINEThe Kayelekera Uranium Mine in Karonga raised hopes that the mining industry would outpace agriculture in terms of contribution to GDP. However, the mine has come under increasing criticism, related to both the lack of social and economic benefits for local communities, and over the absence of publicly available details on the incentives offered to the mine’s investors. Recently, there have been calls for the government to review its mining agreement with the mine’s owner, Paladin Ltd. A former governor of the Reserve Bank of Malawi (RBM), Dr. Perks Ligoya, argued that the “Government went into agreement [with Paladin] ignorantly and made concessions which Paladin does not have in other countries where they are operating.”
A study by a Lilongwe University of Agriculture and Natural Resources (LUANAR) scientist noted that the ownership of the company is very complex: Paladin Africa (PAL) owns 85 per cent of Kayelekera Uranium mine and the government of Malawi owns 15 per cent (Kwapata, 2012). PAL, which is owned by Paladin Energy, also owns Langer Heinrich mine in Namibia and Mauritius. There is also Kayelekera Holdings in Switzerland, Kayelekera Finance BV in Netherlands, and Paladin Malawi Ltd., registered in Australia. The study also reported that the mine’s owner benefited from the following incentives: its corporate tax rate was reduced from 30 per cent to an effective rate of 27.5 per cent; resource rent reduced from 10 per cent to zero; reduced royalty rate from 5 per cent to 1.5 per cent (years one to three) and 3 per cent (years three and up); no value-added tax (VAT) or duty on imports during the stability period of 10 years; an immediate 100 per cent capital write off for tax purposes; no increases to taxes/royalties for 10 years. A total of MWK10 billion (US$66 Million) revenue to government is estimated to be lost over the initial period of three years – the number comprising tax exemptions MWK4 billion and other remains unexplained amounting MWK6 billion according to the study.

TKN POLICY BRIEF DECEMBER 2012Assessing Investment Incentives in Malawi 7
3.2.2 Raw Materials Under Industrial Rebate Scheme An industrial rebate scheme4 exempts import duty, VAT and excise tax on goods used for certain purposes, mainly manufacturing. Various types of industries are approved for rebate, and specified materials used by those industries may be imported, or delivered from an excise factory, at reduced (i.e., rebated) rates of duty. In the financial year 2012/13, this scheme has been expanded, and now grants zero import duty, no VAT and no excise tax on all approved raw materials.
The specified industries and the materials are in Appendices A (rebates of customs duties) and B (rebates of excise duties) of the Eighth Schedule to the Customs and Excise Regulations (MRA, 2012). Estimates of the revenue foregone under industrial rebates scheme are further discussed in the sections below.
3.2.3 Tourism SectorCar hire and safari companies, hotels, lodges and inns enjoy duty-, excise- and VAT-free direct importation of equipment as long as they are licensed under the Tourism and Hotels Act. Although this incentive is officially scrapped, there are still traces of tax revenues foregone in Fig.7 below.
3.2.4 Agriculture Sector and Fishing Industry IncentivesDairy farms enjoy a waiver from customs duty, excise and VAT on specialized machinery, equipment, and other related goods, as well as from excise duties on the purchase of raw materials and packaging materials made in Malawi. Those investing in specialized goods for use in the fishing industry enjoy customs duty-, excise- and VAT-free status.
3.2.5 Mining Industry Firms that invest in machinery, plant and equipment enjoy waivers on customs duty, excise and VAT. However, this incentive has lately not been applicable leaving room for discretionary incentives often out of negotiations between government and the investor.
3.2.6 Water Supply, Electricity Generation, Transmission and Distribution, and Telecommunication Sectors Customs duty, excise and VAT are not applied to the purchase of goods for direct use by the telecommunications industry, upon the approval of the Commissioner General of MRA. The same is true for goods imported by the boards responsible for investments in water supply and electricity generation and transmission.
4 For details see Malawi Revenue Authority, (MRA), Industrial Rebate Scheme, at http://www.mra.mw/industrial_rebates.php.

TKN POLICY BRIEF DECEMBER 2012Assessing Investment Incentives in Malawi 8
3.2.7 Export Incentives These include incentives for establishing operations in an export processing zone (EPZ) as stipulated in the Export Processing Zones Act (1995). A company applies to the Minister of Finance for a certificate upon fulfillment of conditions through Export Processing Zones Appraisal Committee.5 If issued, the certificate is valid for a period of five years and may thereafter be renewed for successive periods of two years.
In making recommendations to the Minister regarding an application, the Committee is instructed to consider the following; contribution to employment, use of advanced technology, utilization of local raw materials, export-oriented activities other than the production for export of tobacco, tea, coffee, and sugar among others.
The Minister may, by notice published in the Gazette, declare any area of land on which a factory has been, is being or is likely to be built, to be an export processing zone. Where an export enterprise imports or purchases any dutiable goods to be used in a bonded factory or export processing zone, no duty shall be paid on the goods if the goods are transported directly to a bonded factory or export processing zone and placed there under such conditions as the Commissioner General of MRA may impose.
However, since the announcement by the Minister of Finance in the 2010/11 budget session, investors in EPZs no longer enjoy a zero corporate tax rate and the number of factories that designated as EPZs have since declined from 30 to 10.
Further, the proposed EPZ Amendment Bill (2013) specifies the entitlements of exporting firms as those stated in the Taxation Act, Customs and Excise Act, Value Added Tax Act and the Exchange Control Act. It stipulates that the following goods shall not be imported free of import duty and value added tax by an export enterprise: (a) a vehicle not used solely within an export processing zone and, in any case, a passenger car or a mini bus; fuel for use in generators and boilers, in quantities and subject to such conditions as the Commissioner General may, from time to time, determine; and (c) spare parts for motor vehicles, including vehicle tires.
Those manufacturing under bond are given an export tax allowance of 12 per cent of export revenues for non-traditional exports (such as nuts, soya beans, rice etc.—tobacco, tea, coffee or sugar are considered traditional exports), a transport tax allowance equal to 25 per cent of international transport costs (excluding traditional exports), no duties on imports of capital equipment used in the manufacture of exports, no VAT and excise tax or duty on the purchase of raw materials and packaging materials, and a refund of all duties (duty drawback) on imports.
Exporters are also entitled to the following privileges: training allowance of an additional 50 per cent of the costs incurred by a tax compliant company during the year of assessment in the training of an employee who is a Malawian, intended to enable him/her to attain a qualification at the degree, diploma or certificate level.
5 An Export Processing Zones Appraisal Committee consists of the Secretary for Industry and Trade who is designated by the Minister as Chairman. The following are ex-officio members (or their designated representative); the Secretary to the Treasury, the Secretary for Economic Planning and Development, the Secretary for Agriculture and Food Security, the secretary for Labour, the Commissioner General of MRA, the Chief Immigration Officer, the Chief Executive Officer of the Malawi Investment and Trade Centre, one member representing the private sector in Malawi nominated by the Malawi Confederation of Chambers of Commerce and Industry; and one member representing the Reserve Bank of Malawi nominated by the Governor of the Reserve Bank of Malawi.
TKN POLICY BRIEF DECEMBER 2012Assessing Investment Incentives in Malawi 9
3.2.8 Other IncentivesSpecific goods are surtax exempt or zero rated. Exempt goods include animal products, petroleum products, certain insecticides and fungicides, agricultural and horticultural appliances, water pumps, and tractors. Zero-rated goods include fertilizers (including FISP fertilizer) and pharmaceutical products. A special taxation package for the bio-fuels industry is currently being developed.
3.3 Government Management of Incentive Programs As described above, the government of Malawi uses a mix of fiscal, financial and regulatory instruments to administer its investment policy, and thus management and responsibility is spread across multiple ministries and agencies. The Malawi Investment Promotion Agency (MIPA), now called the Malawi Investment and Trade Centre (MITC), is normally the first point of inquiry for new investors. MITC falls under the Ministry of Industry and Trade as an agency to implement investment promotion initiatives. Taxation policy is the jurisdiction of the Treasury Department in the Ministry of Finance. The Malawi Revenue Authority (MRA) is the main implementing agency for tax policy; it administers the Taxation Act and other relevant legislation. Some regulatory incentives are within the jurisdiction of their respective ministries, and therefore, their implementation as well. The Reserve Bank of Malawi (RBM) administers the market-based exchange rate of the Malawi kwacha, as well as liberal exchange controls to allow free flow of capital and earnings—repatriation of dividends, profits, and royalties. The Ministry of Internal Affairs’ immigration department administers the Employment of Expatriates Policy, Temporary Employment Permits (TEPs), and Business Residence Permits (BRPs). The Department of Lands and Physical Planning is responsible for land policy administration.

TKN POLICY BRIEF DECEMBER 2012Assessing Investment Incentives in Malawi 10
4.0 Concerns Related to Investment IncentivesA key question for policy-makers is the impact of an incentive on the decisions of investors. Would the investment have taken place without the incentive? Did incentives have an influence on the size and location of the investment? These are difficult questions for any government to answer, not to mention poorer countries like Malawi.
Naturally, many factors influence investment-making decisions, and often the most important relate to the overall investment climate, including factors such as political and economic stability as well as the regulatory and policy regimes in place. Studies by Malawi’s National Statistical Office (NSO) in 2011 and 2012 support the notion that the domestic environment is a key factor. According to 39 per cent of investors surveyed by the NSO 2012, the main considerations are the stability of the domestic political and economic environment, followed by the size of the domestic market. Only 7.2 per cent of investors stated that investment incentives are the main factor influencing their investment decision. Policy makers in Malawi may have to consider putting more effort on improving the domestic business environment rather than investment incentives.
The following section provides some preliminary details on the fiscal costs of incentives—by way of government revenue foregone—and also discusses some of the concerns that have been raised about incentives generally, and how those might relate to the Malawian context.
4.1 Government Revenue ForegoneGovernment foregoes important revenue for its operating and capital expenditure because of investment incentives. Figure 6 gives an indication of the lost revenue. GT stands for gross tax revenue, ToTE for government total expenditure, and CL for revenue lost from customs duty, VAT and excise duty. The proportion of revenue lost from customs duty, VAT and excise duty (CL) as a proportion of government total expenditure (CL+ToTe) has increased from 0.62 per cent in 2008/09 to an estimated 1.5 per cent in 2012/13. Revenue loss has been increasing, depriving government of resources (as CL/GT also increases from 1.3 per cent to 2.5 per cent) to pay for expenditures. Specifically, industrial rebates (IR) can be as high as 2.4 per cent of the gross tax revenues (GT), again showing an ever-increasing proportion of gross revenue lost.
Industrial rebates alone constitute at least 0.16 per cent of GDP. This is almost equal to the expenditures for the ministries of energy and mining, tourism and trade and industry combined, which amounted to 0.17 per cent of GDP in 2010/11.

TKN POLICY BRIEF DECEMBER 2012Assessing Investment Incentives in Malawi 11
FIGURE 6. CUSTOMS REVENUE FOREGONESource: Malawi Government, Customs Revenue Foregone Assessment Reports.
Manufacturing is almost entirely dependent on the industrial rebate lifeline (Figure 7). Meanwhile, VAT is the highest source of tax revenue (thus paying for revenue foregone through the industrial rebate scheme) and a significant burden on consumers (as indicated in Figures 1,2 and 3 above). Only PAYE and VAT have been on the increase over the past three to four decades (Figure 3). Indeed, the contribution of corporate tax to total government revenue has fallen steeply from 28 per cent in the 1970s to less than 5 per cent today (Chiumia & Simwaka, 2012).
FIGURE 7. SELECTED INCENTIVES REVENUE LOSS (CUSTOMS, EXCISE & VAT—ESTIMATED)Source: Malawi Government, Customs Revenue Foregone Assessment Reports.
CL/G
T, 1
.31%
CL/G
T, 3
.21%
CL/G
T, 0
.81% CL
/GT,
1.5
8%
CL/G
T, 2
.52%
IR /
GT, 0
.81%
IR /
GT, 2
.57%
IR /
GT, 0
.78%
IR /
GT, 1
.41%
IR /
GT, 2
.40%
CL +
ToT
e, 0
.62% CL
+ T
oTe,
1.7
9%
CL +
ToT
e, 0
.48%
CL +
ToT
e, 0
.91%
CL +
ToT
e, 1
.52%
0.0%
0.5%
1.0%
1.5%
2.0%
2.5%
3.0%
3.5%
2008/09 2009/10 2010/11 2011/12 2012/13e
0
5
10
15
20
25
30
2008/09 2009/10 2010/11 2011/12 2012/13e
US
$' M
n
TKN POLICY BRIEF DECEMBER 2012Assessing Investment Incentives in Malawi 12
4.2 Crowding Out Domestic InvestmentIn Malawi, a foreign national must invest at least US$50,000 in order to be eligible for a Business Residence Permit (BRP) MIPA, (2008). This minimum capital requirement is comparatively low by regional standards, and has raised concerns that it is attracting investment that competes in areas where locals are best able to invest, such as small shops and kiosks, rather than prioritizing higher-value investments in areas like mining and infrastructure. Although rural retailing business is restricted to local investors, foreign investors are authorized to operate businesses in urban centres. Business owners have complained that locally-owned retailers are struggling to compete with foreign competitors (The Nation, 2012).
4.3 Misuse Given that investment incentives, such as the industrial rebate in Malawi (Figures 6 and 7 above), are designed to attract investment, they incur a risk that businesses will “re-organize” themselves in order to pose as a newly established investment (Sebastian, 2009). Referring to the introduction of new tax holidays in India’s special economic zones intended to encourage new investments, Raghuram Rajan, former Chief Economist of the IMF, said that, “Of course the government says that only new investment will benefit, but who is to judge what new investment is? The poorly paid tax inspector?” This problem has not been examined in Malawi, but it would be worth investigating whether investors, both domestic and foreign, are falsely presenting their business as a “new” investment in order to continue to benefit from incentives.
4.4 Administrative Costs The costs of administering incentives can be significant, particularly when they are discretionary and investors qualify for them only through an approval process which has ultimate authority in the office of a minister. For instance, incentives for the tourism, water supply, electricity generation, transmission and distribution, and telecommunication sectors require the approval of the respective Minister responsible and the Commissioner General of the MRA. Due to government budget constraints, there is also inadequate monitoring and enforcement of what investors promised during their application for incentives and what is delivered at the end of the set period. There are no specific legal instruments to enforce non-fulfillment of promised outcomes.

TKN POLICY BRIEF DECEMBER 2012Assessing Investment Incentives in Malawi 13
5.0 RecommendationsThere is limited evidence in support of or against investment incentives for the Malawi economy. The fact remains that incentives have created a community of businesses that depend on and lobby for them. Some businesses may have been dependent on industrial rebates from their inception and hence the Malawian industry still remains infant industry.
Investment incentives need harmonization for purposes of revenue management as well as efficiency and effectiveness. An accurate methodology needs to be developed to help the country analyze revenue lost and benefits for the economy. Improving transparency about the cost of incentives is also a necessary step towards improving investment policies. Doing so would also increase public discussion on the costs and benefits of incentives.
Further research in the following areas would support these policy needs:
1. Malawi needs to take stock of the domestic taxes foregone. There is need for detailed study on whether incentives, both existing and proposed, are beneficial to the economy, or indeed whether there is abuse of the incentives. A methodology or clearly agreed criteria of awarding incentives has to be developed, tested and publicly debated.
2. The key trade (and thus economic) constraint is transportation due to poor infrastructure and administrative procedures. Currently, a transport tax allowance, equal to 25 per cent of international transport costs (excluding traditional exports), is given to investors in the sector. Research into the impacts of this incentive, as well as other strategies to improve the sector, is necessary to help Malawi capitalize on its strategic location both inland and en route to the sea ports of Dar es Salaam, Nacala, Beira and Durban.
3. Further, a global race for natural resources is taking place, and Malawi needs to identify its strategic position. It is important, then, to appreciate the elasticity of investment incentives in all sectors. A study of whether or not it is necessary to forego tax revenues for resource-seeking investment needs to be under taken. Indeed, whether it is necessary to apply general investment incentives regimes.

TKN POLICY BRIEF DECEMBER 2012Assessing Investment Incentives in Malawi 14
ReferencesBarbour, P. (2005). An assessment of South Africa’s investment incentive regime with a focus on the manufacturing sector. Overseas Development Institute. Retrieved from http://www.odi.org.uk/sites/odi.org.uk/files/odi-assets/publications-opinion-files/2515.pdf
Chiumia, A., & Simwaka,K. (2012, April). Tax policy developments, donor inflows and economic growth in Malawi. Journal of Economics and International Finance, 4(7), 159–172.
Government of Malawi. (2011). Malawi growth and development strategy II. Lilongwe.
Government of Malawi. (2012, July). 2012/13 budget statement. Lilongwe.
Government of Malawi (1998). Vision 2020. Lilongwe.
Inter Press Service. Tax could be the way out of aid dependence. Retrieved from http://ipsnews.net/news.asp?idnews=52960
Kwapata K. (2012). The revenue costs and benefits of foreign direct investment in the extractive industries in Malawi: A case of Kayelekera. Lilongwe.
Malawi Development Corporation & Price Waterhouse. (1989). Investing in Malawi. Blantyre, Malawi: Blantyre Print & Packaging Ltd.
Malawi Investment Promotion Agency (MIPA). (2008). Investing in Malawi: Procedures and requirements. Lilongwe.
MIPA. (2012, September). FDI in-flow pledges. Lilongwe.
Malawi Revenue Authority (MRA). (2012.). Investment incentives. Retrieved from http://www.malawi-invest.net/inves_incent.html seen 30th November 2012.
MRA. (2010). Changes to the Customs and Excise (tariffs) Order for 2010/11 Financial Year. Retrieved from http://www.mra.mw/customs_tariff_amendments.php
Ministry of Economic Planning and Development. (2010). Annual Economic Report 2010 (Budget Document No.2). Lilongwe.
Ministry of Economic Planning and Development. (2012). Annual Economic Report 2012 (Budget Document No.2), Lilongwe.
Ministry of Finance, & Ministry of Economic Planning and Development. (2007–2012). Annual Economic Reports 2007–2012, Lilongwe.
The Nation Online. The Chinese sinking Karonga businesses. Retrieved from http://mwnation.com/business-news-the-nation/business-review/835-chinese-sinking-karonga-businesses
National Statistical Office (NSO). (2011). 2009 foreign private capital and investor perceptions survey report. Zomba.
National Statistical Office (NSO). (2012). Malawi foreign private capital and investors’ perceptions survey 2011. Zomba.
Rajan, R. (2006, September). From paternalistic to enabling. Finance and Development 43(3). Retrieved from http://www.imf.org/external/pubs/ft/fandd/2006/09/straight.htm
TKN POLICY BRIEF DECEMBER 2012Assessing Investment Incentives in Malawi 15
Sebastian J. (2009). Incentives and investments: Evidence and policy implications. Washington D.C.: Investment Climate Advisory Services of the World Bank Group. Retrieved from https://www.wbginvestmentclimate.org/uploads/IncentivesandInvestments.pdf
Thomas, K. (2007). Investment incentives: Growing use, uncertain benefits, uneven controls. Winnipeg: International Institute for Sustainable Development. Retrieved from http://www.iisd.org/gsi/sites/default/files/gsi_investment_incentives.pdf
Thomas, K. (2010). Investment incentives and the global search for capital. Houndmills, U.K.: Palgrave Macmillan.
United Nations Conference on Trade and Development (UNCTAD). (2004). Incentives (UNCTAD Series on Issues in International Investment Agreements). United Nations. Retrieved from http://unctad.org/en/Docs/iteiit20035_en.pdf
World Trade Organization (WTO). (2010). Trade policy review for Malawi. Geneva: WTO.

www.iisd.org/tkn © 2013 The International Institute for Sustainable Development
Further details and contact informationFor further information contact Damon Vis-Dunbar at: [email protected] or +41 22 917 8630.
International Institute for Sustainable DevelopmentTrade Knowledge NetworkInternational Environment House 2, 9 chemin de Balexert, 1219 Châtelaine, Geneva, SwitzerlandTel: +41 22 917-8373 | Fax: +41 22 917-8054