Embed Size (px)
Citation preview
Ali Arya, 2003 Software Project Management, Planning Slide 1
Software Project Planning
Project Planning, Scheduling, and Monitoring
Jalote-2002, etc.

Ali Arya, 2003 Software Project Management, Planning Slide 2
Introduction Effectively schedule, allocate, use, and replace
resources to achieve goals Master schedule is the basic tool and main output
of planning Project control is based on comparing the
progress with schedule Planning and scheduling are dynamic

Ali Arya, 2003 Software Project Management, Planning Slide 3
Reluctance to Planning Takes too much time and cost
• Preventive action
• Long-term payoff is greater than short-term cost
Too tedious (mental activity)• “Thinker” and “doer”
Ego (shoot from the hip)• Not realistic
Ali Arya, 2003 Software Project Management, Planning Slide 4
Effective Schedule Understandable Sufficiently detailed Highlighting critical tasks Flexible Based on reliable estimates Conform to available resources Compatible with other related projects

Ali Arya, 2003 Software Project Management, Planning Slide 5
Scheduling Total schedule is a function of total effort and
(flexible) resource allocation issues. Simple estimate of schedule:
• S = a * Eb
“Square root” rule of thumb:• Proposed schedule and number of resources should be around
the square root of total effort in person-month.
Dependencies have to be considered too.

Ali Arya, 2003 Software Project Management, Planning Slide 6
Scheduling Next step: milestones, per-phase resource allocation, and
detailed scheduling• Rayleigh curve and peak time size (PTS)• Peak usually happens at “build” phases after “design” and before “test”• In detailed schedule, low level tasks should need a few days and one
person Slack time
• Due to fixed resource allocation• Used for training, documentation, …
Schedule and effort distributions are different• Design and test usually have larger percentage of schedule compared
to effort• Schedule: 40-40-20%, manpower ratio: 1,2,1

Ali Arya, 2003 Software Project Management, Planning Slide 7
Developing the Schedule Defining objectives
• Attainable, definitive, quantifiable, with specific duration
Breaking down the work Sequencing the activities Estimating the activity costs and durations Reconciling with time constraints Reconciling with resource constraints Reviewing

Ali Arya, 2003 Software Project Management, Planning Slide 8
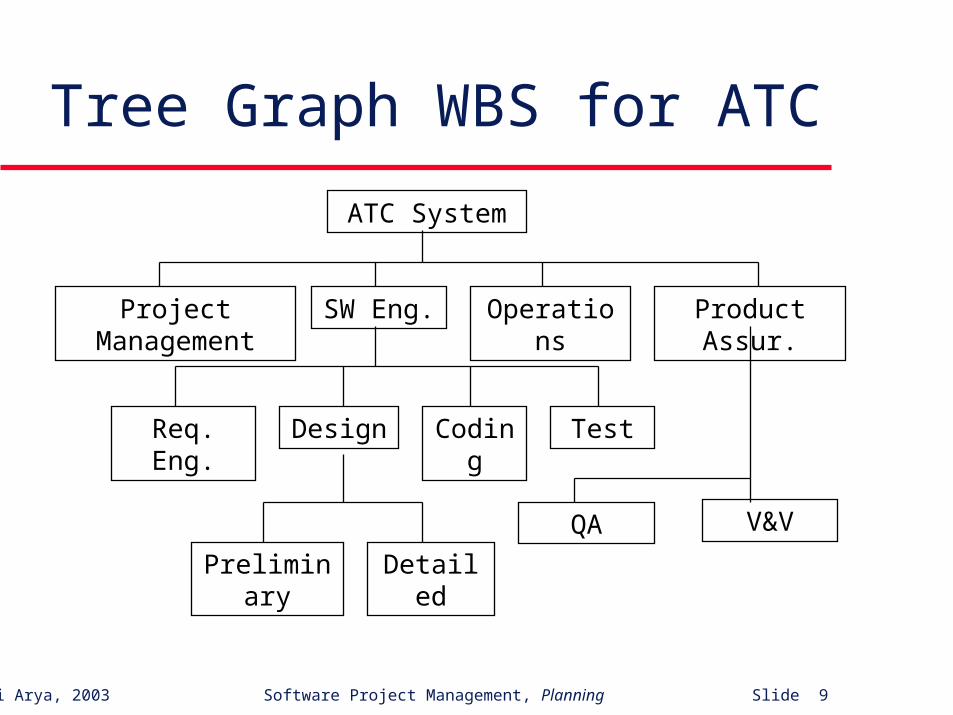
Work Breakdown Structure WBS is a hierarchical representation of a process
or product or both (hybrid). WBS can be shown in a tree graph or as an
indented list A decimal numbering to label the elements
• e.g. 4.1.2 is the 2nd element of the 1st element of the 4th
4th
1st
2nd
Ali Arya, 2003 Software Project Management, Planning Slide 9
Tree Graph WBS for ATC
Project Management
ATC System
SW Eng. Product Assur.Operations
Req. Eng. Design Coding Test
V&VQA
DetailedPreliminary

Ali Arya, 2003 Software Project Management, Planning Slide 10
Indented List WBS for ATC 0.0 Air Traffic Control (ATC) System 1.0 Project Management 2.0 Software Engineering
• 2.1 Requirement Engineering• 2.2 Design• 2.3 Coding• 2.4 Test
3.0 Operations 4.0 Product Assurance
• 4.1 Quality Assurance• 4.2 Verification and Validation

Ali Arya, 2003 Software Project Management, Planning Slide 11
Notes on WBS “Rolling wave” approach
• First top levels
• Gradual completion
Keep partitioning into 72 elements WBS dictionary Make sure about numbering scheme
• Top-level zero or one, …
Work package specification for lowest level entries (info, completion, …)

Ali Arya, 2003 Software Project Management, Planning Slide 12
Sequencing Scheduled Activities Interrelationship among activities Milestones and Gantt charts are most common
• Gantt chart also shows the relationship between work load and time
Full-wall method gives a global view Precedence networks are used for larger projects
• Critical Path Method (CPM)
• Program Evaluation and Review Technique

Ali Arya, 2003 Software Project Management, Planning Slide 13
Milestone Chart Simplest scheduling method Small projects or summary of larger ones Ease and minimal cost No interrelationships exhibited Only completion dates Not enough feedback
Ali Arya, 2003 Software Project Management, Planning Slide 14
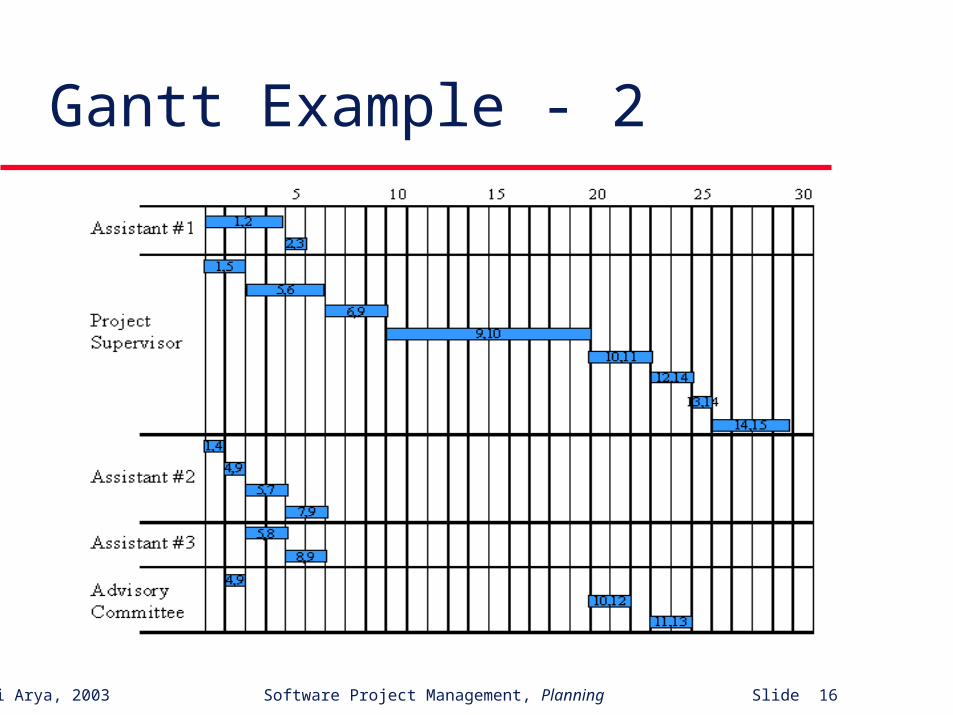
Gantt Chart Gantt or Bar chart used more frequently than
others Suitable for projects with less than 25 activities Graphical display of start/end times Shows overlapping activities easily
• CPM or PERT are translated to Gantt sometimes
For estimation of resource and budget vs. time

Ali Arya, 2003 Software Project Management, Planning Slide 15
Gantt Example - 1
Ali Arya, 2003 Software Project Management, Planning Slide 16
Gantt Example - 2

Ali Arya, 2003 Software Project Management, Planning Slide 17
Precedence Networks Network is a graphical representation of
sequential relationship between:• Activities
• Events
Critical Path Method (CPM)• Activity-based
Program Evaluation and Review Technique (PERT)• Event-based
Ali Arya, 2003 Software Project Management, Planning Slide 18
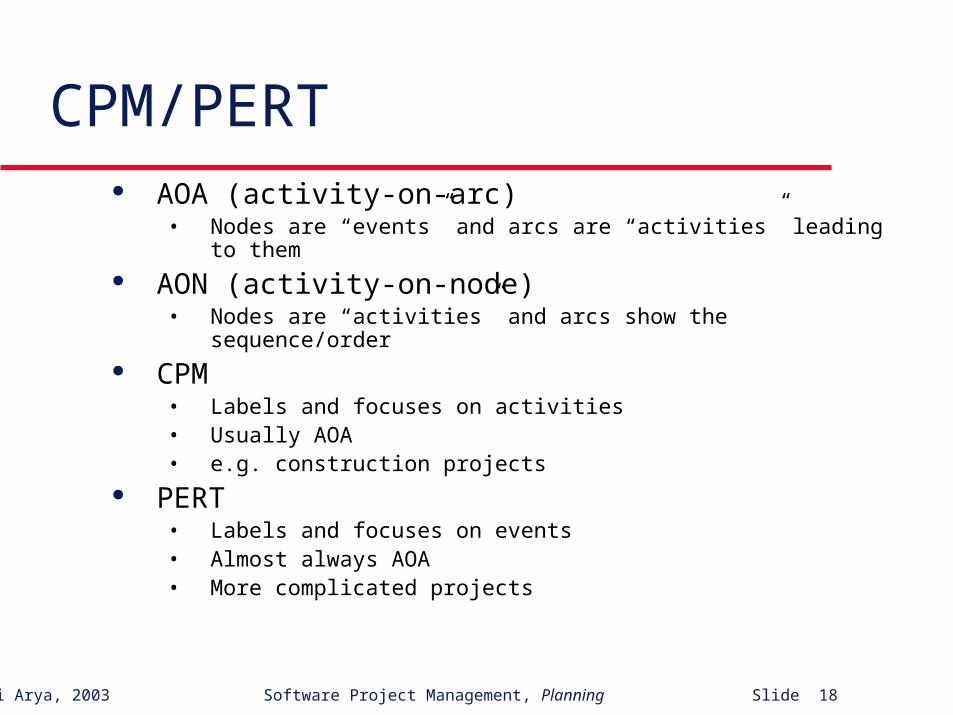
CPM/PERT AOA (activity-on-arc)
• Nodes are “events” and arcs are “activities” leading to them AON (activity-on-node)
• Nodes are “activities” and arcs show the sequence/order CPM
• Labels and focuses on activities• Usually AOA• e.g. construction projects
PERT• Labels and focuses on events• Almost always AOA• More complicated projects
Ali Arya, 2003 Software Project Management, Planning Slide 19
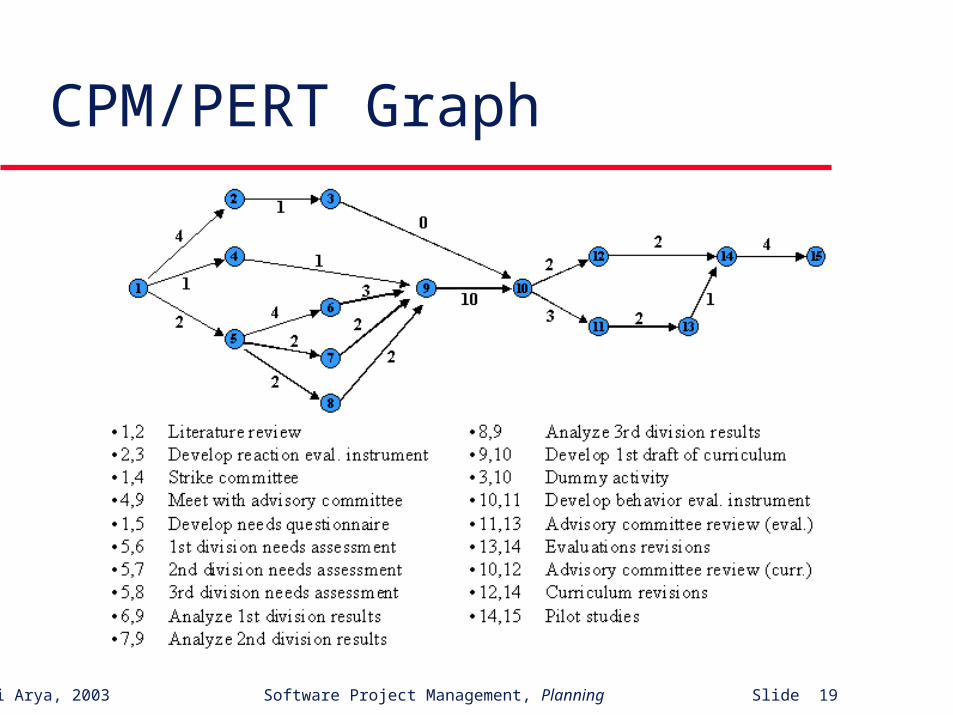
CPM/PERT Graph
Ali Arya, 2003 Software Project Management, Planning Slide 20
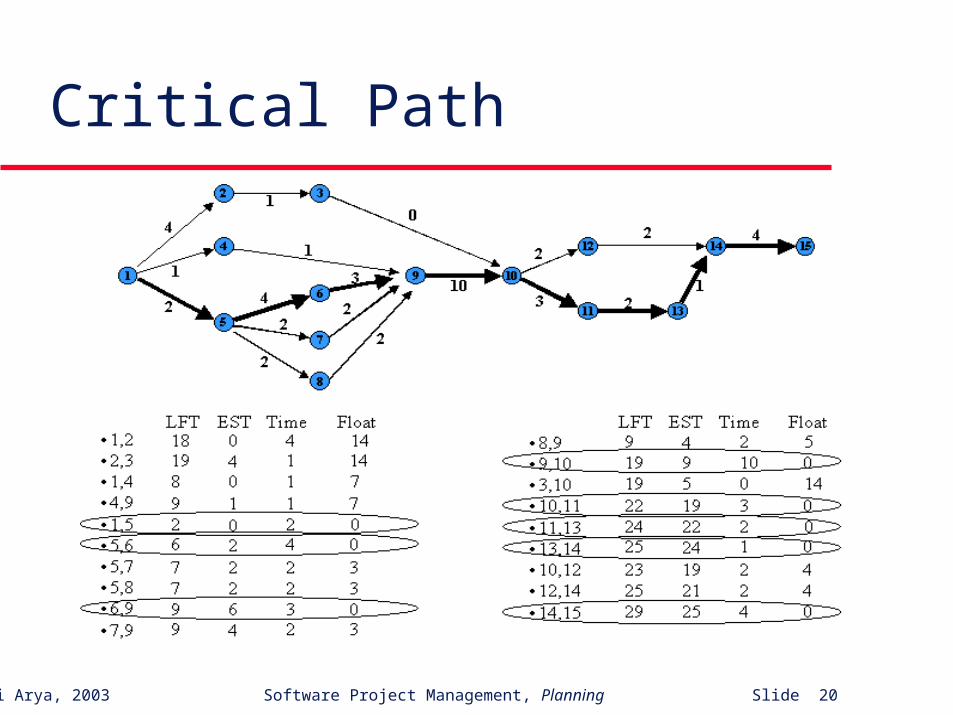
Critical Path
Ali Arya, 2003 Software Project Management, Planning Slide 21
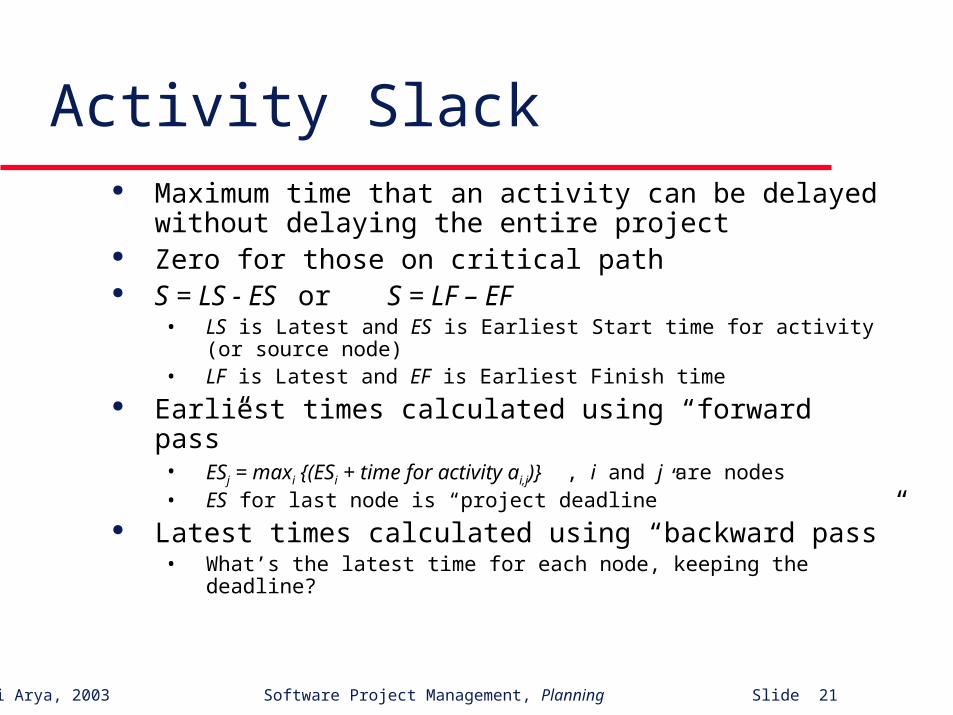
Activity Slack Maximum time that an activity can be delayed without
delaying the entire project Zero for those on critical path S = LS - ES or S = LF – EF
• LS is Latest and ES is Earliest Start time for activity (or source node)• LF is Latest and EF is Earliest Finish time
Earliest times calculated using “forward pass”• ESj = maxi {(ESi + time for activity ai,j)} , i and j are nodes • ES for last node is “project deadline”
Latest times calculated using “backward pass”• What’s the latest time for each node, keeping the deadline?

Ali Arya, 2003 Software Project Management, Planning Slide 22
Probabilistic PERT No unique estimate for time/effort
• Optimistic, a• Realistic, m• Pessimistic, b
mean=((2m+(a+b)/2)/3) sigma2=((b-a)/6)2 Central Limit Theorem
• Sum of the activity times on the critical path is a random variable with a normal distribution, its mean and variance the sum of the means and variances of the activities on the critical path

Ali Arya, 2003 Software Project Management, Planning Slide 23
When CPM/PERT? Sequential Interrelated Ordered Without interruption Well-defined
• CPM
Uncertain• PERT (allows probability for time estimates)
Ali Arya, 2003 Software Project Management, Planning Slide 24
Format for Project Plan - 1 Title page Signature page Change history Preface Table of contents List of figures List of tables
Ali Arya, 2003 Software Project Management, Planning Slide 25
Format for Project Plan - 2 1- Overview
• Summary» Purpose, scope, objectives
» Assumptions and constraints
» Deliverables
» Schedule and budget summary
• Evolution of plan
2- References 3- Definitions
Ali Arya, 2003 Software Project Management, Planning Slide 26
Format for Project Plan - 3 4- Project organization
• External interface
• Internal structure
• Roles and responsibilities
5- Managerial process plans• Estimation (cost, schedule)
• Work (activities, resource and budget allocation)
• Control (quality, metrics, …)
• Risk management
Ali Arya, 2003 Software Project Management, Planning Slide 27
Format for Project Plan - 4 6- Technical process plans
• Process model• Methods, tools• Acceptance plan
7- Supporting process plans• Configuration management• Verification/validation• Quality assurance (reviews, audits, …)• Subcontract• Process improvement plan
Annexes Index

Ali Arya, 2003 Software Project Management, Planning Slide 28
Effective Project Control Detailed planning Deliverables and measurable milestones Communication Tracking (money, time, resources, tasks) Reviews Signing-on Reasons for poor control?

Ali Arya, 2003 Software Project Management, Planning Slide 29
Project Tracking Activities tracking
• Use Microsoft Project or similar tools• Percent completed
Defect tracking• Submission, injection, detection, closure dates• Type, severity, people involved• Related changes
Issues tracking• Small jobs, …
Status reports
Ali Arya, 2003 Software Project Management, Planning Slide 30
Milestone Analysis Actual vs. estimated effort and schedule
• Re-schedule
• Scheduling training
• Review tasks
Quality monitoring• Review test procedure
• More tests
Risk-related monitoring


![RISK ASSESSMENT. Risk Assessment Definition: “Risk…merely identifies the undesirable events that might take place during the project” [Jalote, 1998] Three](https://img.dokumen.tips/doc/110x75/56649d235503460f949f95a6/risk-assessment-risk-assessment-definition-riskmerely-identifies-the.jpg)


![Business] - Project Management Planning-Planning Process & Project Plan](https://img.dokumen.tips/doc/110x75/577d34ea1a28ab3a6b8f298b/business-project-management-planning-planning-process-project-plan.jpg)


