Embed Size (px)
Citation preview

1
Broadband Wireless Options: Broadband Wireless Options: An AssessmentAn Assessment
��
Luigi Gasparollo
June 2006Qualcomm Inc.
PAGE 2
Broadband Wireless AccessJune 2006
2
Presentation OutlinePresentation Outline
•• BWA Technology Choices & AdvantagesBWA Technology Choices & Advantages
•• Technical Assessment of WiMAX Technical Assessment of WiMAX
•• Network EconomicsNetwork Economics
•• BWA Market OpportunityBWA Market Opportunity
•• ConclusionsConclusions
2
PAGE 3
Broadband Wireless AccessJune 2006
3
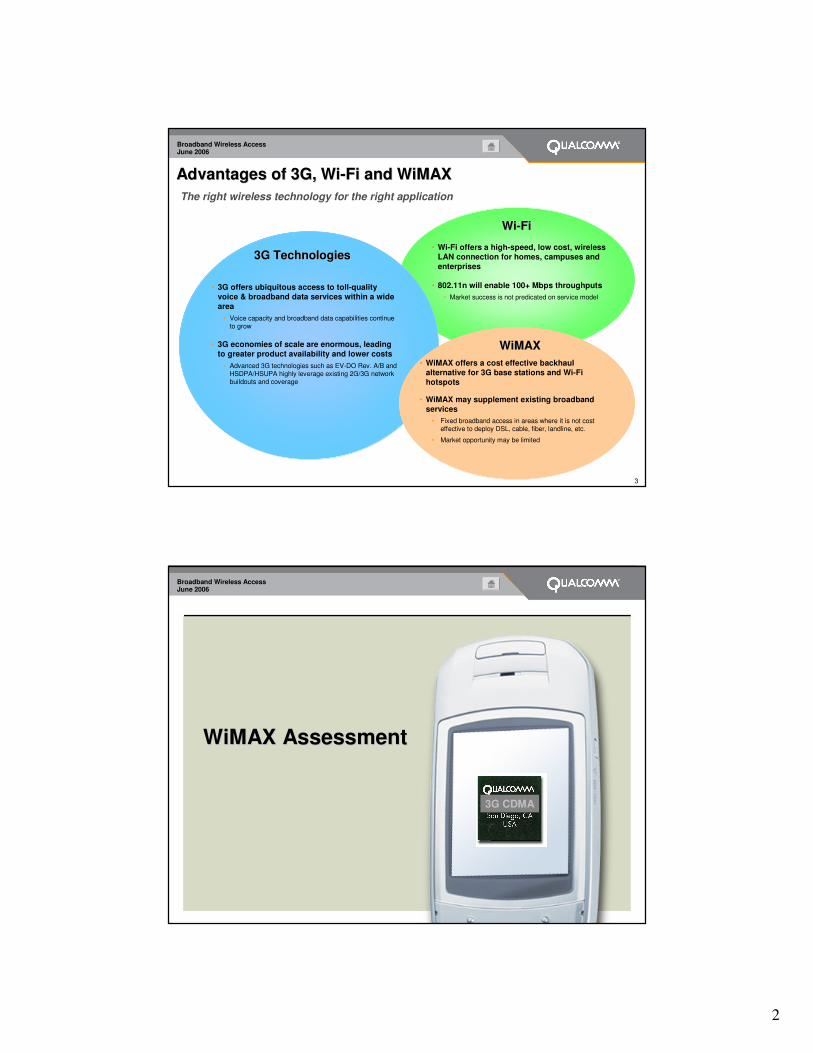
Advantages of 3G, WiAdvantages of 3G, Wi--Fi and WiMAXFi and WiMAX
3G Technologies3G Technologies
WiWi--FiFi
WiMAXWiMAX• WiMAX offers a cost effective backhaul
alternative for 3G base stations and Wi-Fi hotspots
• WiMAX may supplement existing broadband services
• Fixed broadband access in areas where it is not cost effective to deploy DSL, cable, fiber, landline, etc.
• Market opportunity may be limited
• Wi-Fi offers a high-speed, low cost, wireless LAN connection for homes, campuses and enterprises
• 802.11n will enable 100+ Mbps throughputs• Market success is not predicated on service model
• 3G offers ubiquitous access to toll-quality voice & broadband data services within a wide area
• Voice capacity and broadband data capabilities continue to grow
• 3G economies of scale are enormous, leading to greater product availability and lower costs
• Advanced 3G technologies such as EV-DO Rev. A/B and HSDPA/HSUPA highly leverage existing 2G/3G network buildouts and coverage
The right wireless technology for the right application
PAGE 4
Broadband Wireless AccessJune 2006
4
WiMAX AssessmentWiMAX Assessment
3G CDMA

3
PAGE 5
Broadband Wireless AccessJune 2006
5
WiMAX Technology & Targeted Market Segments WiMAX Technology & Targeted Market Segments
• The WiMAX Forum promotes IEEE 802.16 standards to target two distinct market opportunities:
� 802.16-2004: Fixed Broadband Wireless Access (FBWA)• Wireless backhaul, LOS & NLOS• Competitive broadband offering to DSL, cable, etc. • OFDM technology (256 OFDM)• Uses a variety of bandwidths (3.5 MHz, 5.0/5.5 MHz, 7.0 MHz, and 10 MHz)• Targeted bands
• Licensed: 2.5 GHz and 3.5 GHz
• Unlicensed: 5.8 GHz
� 802.16e: Portable & Mobile BWA• Portable notebooks and mobile handsets, NLOS• OFDMA technology (128, 512,1024 & 2048 FFT)• Uses a variety of bandwidths, initially 5 MHz, and claims 15 Mbps peak rates• Targeting bands extending to 6 GHz
PAGE 6
Broadband Wireless AccessJune 2006
6
Simulation assumptions:1 Full buffer; ITU channel models: pedA 3km/h 30%, pedB 10km/h 30%, vehA 30km/ 20%, pedA 120km/h 10%, Rician 10% for all technologies2 No Guard band assumed for WiMAX, frequency reuse of 1 is considered3 Perfect Linear MMSE equalizer assumed, back off 0.75dB4 Equalizer gain simulated; 1.25MHz carriers, 7 in 10MHz
SingleAntenna
SingleAntennaSingle
Antenna
RxDiversity
RxDiversity
RxDiversity
0
2000
4000
6000
8000
10000
12000
WiMAX HSDPA DOrA
kbps
3 4
kbps/sector4,5005MHz5,600 - 7,600 7280 - 10,400 7350 - 10,500
2
Average Physical Layer Throughput per Sector in 10MHz
Downlink Throughput Comparison:Downlink Throughput Comparison:DO and HSDPA Outperforms WiMAX in Mobile Environment

4
PAGE 7
Broadband Wireless AccessJune 2006
7
Mobile WiMAX Performance
• Extensive simulations based on proven ITU mixed channel model and 3G methodologies show:
• 3G Broadband offers greater spectral efficiency � higher data throughput• Mobile WiMAX spectral efficiency is in the order 0.5 to 0.8 bits/sec/Hz
• DOrA & HSDPA spectral efficiency performance is 15%-35% better than Mobile WiMAX in a FDD deployment scenario
• Studies indicate that the spectral efficiency of Mobile WiMAX in TDD scenarios will be no different
• Physical Layer Design and basic technical framework between FDD and TDD scenarios are retained
• Physical Layer Frame Structure is very similar
• Control Channel design is very identical between FDD and TDD modes
• Resource allocation, overhead management and interference reduction mechanisms are all similar between the two duplexing modes
• IEEE802.20 technology is a far superior technology option for TDD unpaired spectrum with channel BWs scalable from 5 MHz up to 20 MHz
PAGE 8
Broadband Wireless AccessJune 2006
8
IEEE 802.20 Mobile Broadband Technology
• MIMO optimized
• FDD and TDD modes
• Radio channels up to 20 MHz wide in licensed spectrum
• User peak rates of over 260 Mbps (DL) and 60 Mbps (UL)
• Superior performance for all deployment scenarios• Macro-cellular, micro-cellular and hotspots
• System designed from ground up for mobile broadband• Flexible airlink resource management with efficient, low-overhead signaling
• Advanced interference management• Distributed power control
• Fractional frequency re-use for cell edge performance and
• Frequency hopping modes
• Proven/mature mobility mechanisms provide seamless, low latency handoffs
• Fast sector selection using uplink CDMA control channels
5
PAGE 9
Broadband Wireless AccessJune 2006
9
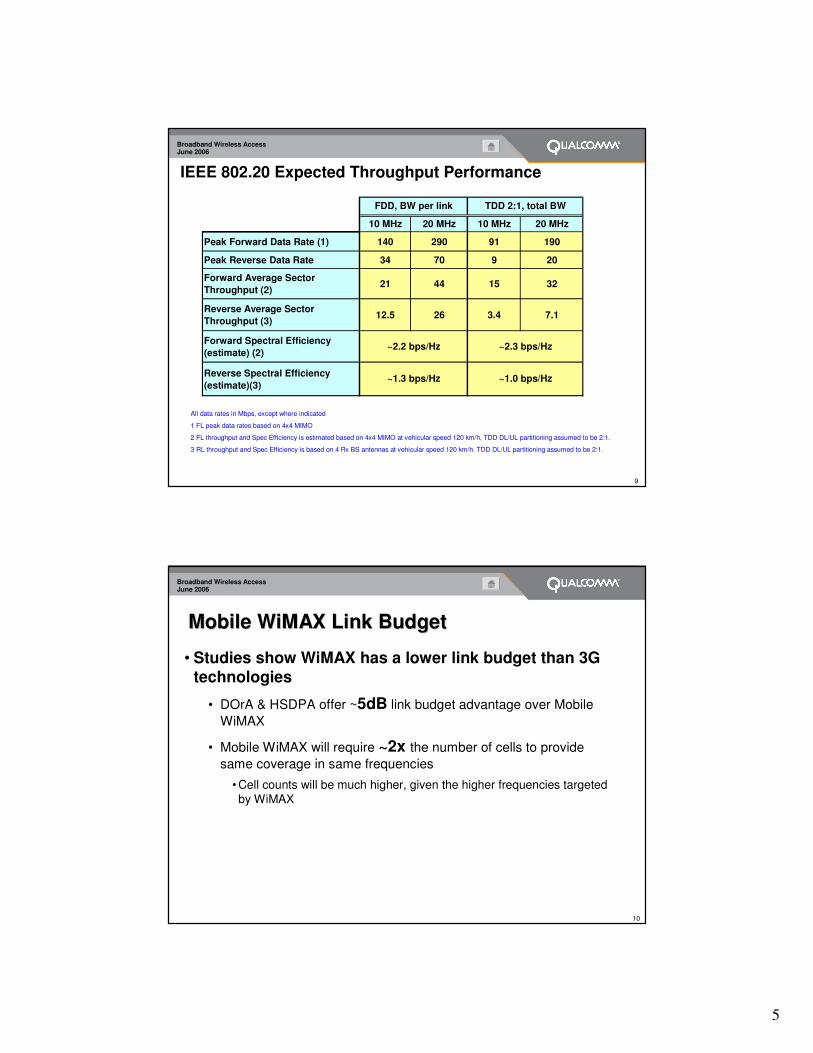
IEEE 802.20 Expected Throughput Performance
All data rates in Mbps, except where indicated
1 FL peak data rates based on 4x4 MIMO
2 FL throughput and Spec Efficiency is estimated based on 4x4 MIMO at vehicular speed 120 km/h, TDD DL/UL partitioning assumed to be 2:1.
3 RL throughput and Spec Efficiency is based on 4 Rx BS antennas at vehicular speed 120 km/h. TDD DL/UL partitioning assumed to be 2:1.
10 MHz 20 MHz 10 MHz 20 MHz
Peak Forward Data Rate (1) 140 290 91 190
Peak Reverse Data Rate 34 70 9 20
Forward Average Sector Throughput (2)
21 44 15 32
Reverse Average Sector Throughput (3)
12.5 26 3.4 7.1
Forward Spectral Efficiency (estimate) (2)
Reverse Spectral Efficiency (estimate)(3)
~1.3 bps/Hz ~1.0 bps/Hz
FDD, BW per link TDD 2:1, total BW
~2.2 bps/Hz ~2.3 bps/Hz
PAGE 10
Broadband Wireless AccessJune 2006
10
Mobile WiMAX Link Budget Mobile WiMAX Link Budget
• Studies show WiMAX has a lower link budget than 3G technologies
• DOrA & HSDPA offer ~5dB link budget advantage over Mobile WiMAX
• Mobile WiMAX will require ~2x the number of cells to provide same coverage in same frequencies
• Cell counts will be much higher, given the higher frequencies targeted by WiMAX

6
PAGE 11
Broadband Wireless AccessJune 2006
11
• Inefficient message based power control (as opposed to bit based)• Affects attainable link margins and data rates on the Uplink; Leads to
lower Uplink average spectral efficiency
• Inefficient message based sleep mode operation• Leads to higher battery consumption
• Inefficient handoff design• Seamless soft handoffs will be difficult to implement
• Network procedures are not properly defined
• Limited number of simultaneous users can be supported• High overhead
General ObservationsGeneral Observations
Mobile WiMAX is not optimally designed for mobilityMobile WiMAX is not optimally designed for mobility
PAGE 12
Broadband Wireless AccessJune 2006
12
Network Network EconomicsEconomics
3G CDMA

7
PAGE 13
Broadband Wireless AccessJune 2006
13
Cell Radius Comparison
Assumptions:Link budget: DorA and 802.16 RL minimum data rate at 9.6kbps, UMTS minimum data rate at 12.2kbpsPropagation model: Hata model in 800MHz, Cost-Hata model in 1900MHz, 2500MHz and 3500MHz* Comparison for 802.16e and CDMA2000 800 MHz frequency is not a typical implementation
• 3G technologies provide better coverage than WiMAX in the same frequency bands
0.00
0.50
1.00
1.50
2.00
2.50
3.00
3.50
Cel
l Rad
ii (k
m)
Urban Radius [km]
Suburban Radius [km]
Urban Radius [km] 1.12 0.81 0.77 0.69 0.38 0.28
Suburban Radius [km] 2.9 2.1 2.2 2.0 1.2 0.9
DOrA 800 802.16e* 800 UMTS 1900 DOrA 1900 802.16 2500 802.16 3500
PAGE 14
Broadband Wireless AccessJune 2006
14
Normalized Site Counts Comparison
Assumptions:Link budget: DorA and 802.16 RL minimum data rate at 9.6kbps, UMTS minimum data rate at 12.2kbpsPropagation model: Cost-Hata model used for all the frequencies
• 3G technologies need less sites than WiMAX to cover the same area
0%
100%
200%
300%
400%
500%
600%
700%
800%
900%
Urban [%] Suburban [%]
Urban [%] 100% 123% 401% 766%
Suburban [%] 100% 123% 357% 583%
UMTS 1900 DOrA 1900 802.16 2500 802.16 3500
8
PAGE 15
Broadband Wireless AccessJune 2006
15
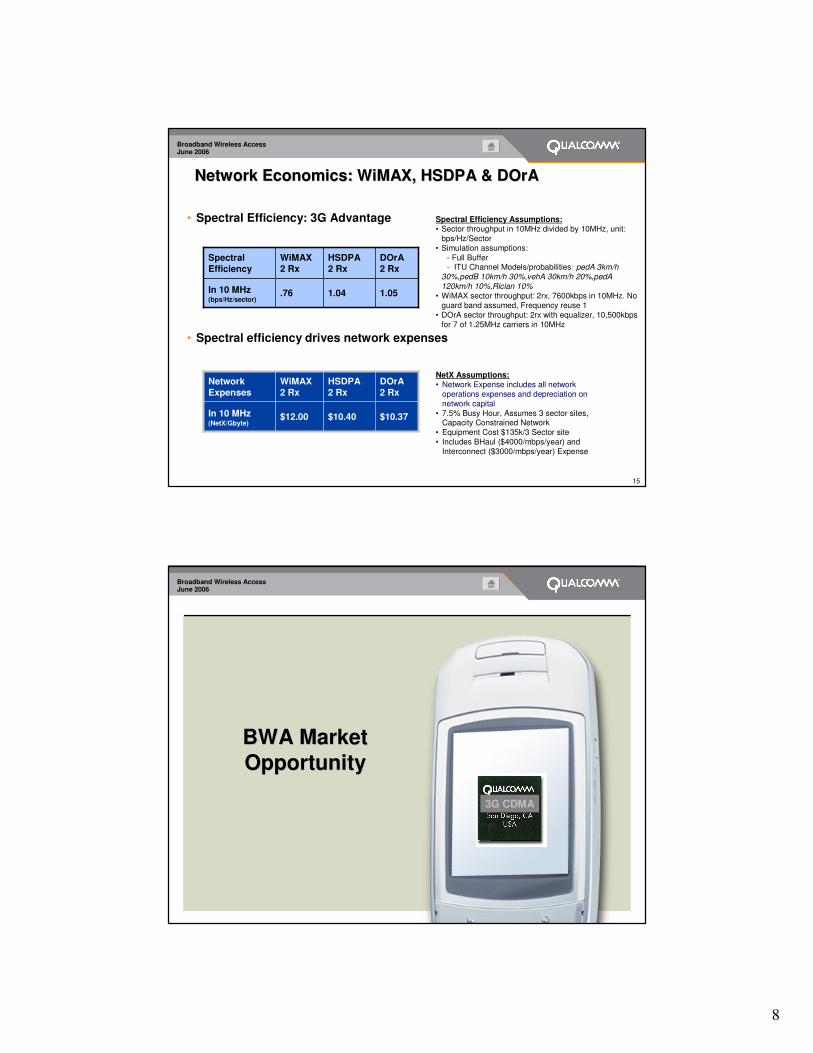
Network Economics: WiMAX, HSDPA & DOrANetwork Economics: WiMAX, HSDPA & DOrA
• Spectral Efficiency: 3G Advantage
• Spectral efficiency drives network expenses
NetX Assumptions:• Network Expense includes all network
operations expenses and depreciation on network capital
• 7.5% Busy Hour, Assumes 3 sector sites, Capacity Constrained Network
• Equipment Cost $135k/3 Sector site• Includes BHaul ($4000/mbps/year) and
Interconnect ($3000/mbps/year) Expense
Spectral Efficiency Assumptions:• Sector throughput in 10MHz divided by 10MHz, unit:
bps/Hz/Sector• Simulation assumptions:
- Full Buffer- ITU Channel Models/probabilities: pedA 3km/h
30%,pedB 10km/h 30%,vehA 30km/h 20%,pedA 120km/h 10%,Rician 10%
• WiMAX sector throughput: 2rx, 7600kbps in 10MHz. No guard band assumed, Frequency reuse 1
• DOrA sector throughput: 2rx with equalizer, 10,500kbps for 7 of 1.25MHz carriers in 10MHz
1.051.04.76 In 10 MHz(bps/Hz/sector)
DOrA 2 Rx
HSDPA 2 Rx
WiMAX 2 Rx
Spectral Efficiency
$10.37$10.40$12.00 In 10 MHz(NetX/Gbyte)
DOrA 2 Rx
HSDPA 2 Rx
WiMAX 2 Rx
Network Expenses
PAGE 16
Broadband Wireless AccessJune 2006
16
BWA Market BWA Market OpportunityOpportunity
3G CDMA

9
PAGE 17
Broadband Wireless AccessJune 2006
17
122.2187.8
251.9
228.9
366.9
536
24.617.267.950.4
118.9
0
100
200
300
400
500
600
700
800
2005 2006 2007 2008 2009
WCDMA
CDMA2000 1xEVFixed & Mobile WiMAX
Subscriber Forecasts by TechnologySubscriber Forecasts by Technology3G Broadband subscribers will approach 800 million within the Next 5 Years
Total Subscribers Worldwide (2005 Total Subscribers Worldwide (2005 -- 2009)2009)
Sources:1. WCDMA & CDMA2000 1xEV: Blended forecast from Strategy Analytics (Dec. 2004) and Yankee Group (March 2005); 1xEV includes 1xEV-DO & DV subs2. WiMAX: Blended forecast from Strategy Analytics (Mar. 2005) and Gartner (Dec. 2004)
(Sub
scri
bers
in M
illio
ns)
Cost & Scale
PAGE 18
Broadband Wireless AccessJune 2006
18
Global Wireless Device Shipments by Technology3G (CDMA2000 and WCDMA) will Make Up 60% of Total Shipments by 2009
428 415 457557 555 536
475413
345
268
3980
141201 358 441
522
0
100
200
300
400
500
600
700
800
900
1,000
2001 2002 2003 2004 2005 2006 2007 2008 2009
CDMA2000 / WCDMA
1G / 2G / 2.5G *
* Includes cdmaOne, GSM/GPRS/EDGE, TDMA, PDC, and AnalogSource: Average of Strategy Analytics (August 2005) and Yankee Group (June 2005) handset forecasts
(Millions)
432 454
537
697
804833 854 866
756

10
PAGE 19
Broadband Wireless AccessJune 2006
19
WiMAX* CPE / Subscriber Unit Forecasts
0
5
10
15
20
25
30
2005 2006 2007 2008 2009
*Includes both 802.16-2004 and 802.16e (fixed and portable/mobile) shipments
Shaded area represents ranges between lowest and highest forecasts for shipments of fixed and portable/mobile WiMAX CPEs/subscriber equipment. Forecasts include ABI Research (Q3, 2005), Forward Concepts (September 2005) and Strategy Analytics (March 2005).
28M
20M
7.5M
12M
5M
3M1M
PAGE 20
Broadband Wireless AccessJune 2006
20
3978
139194
256
340
423
505
0
100
200
300
400
500
600
2002 2003 2004 2005 2006 2007 2008 2009
Industry Analysts Forecast 3G CDMA Devices Grow to 60% of Worldwide Sales by 2009
Source: Average of Strategy Analytics (August 2005) and Yankee Group (October 2005) handset forecasts
(Millions)CDMA and WCDMA Worldwide Handset Shipments
60%
25%

11
PAGE 21
Broadband Wireless AccessJune 2006
21
Wireless Market Opportunity3G Broadband will create more industry value, with a focus on service revenue
2009 Market Size:
• 3G Evolution (incl. 3G mobile broadband)• $394 B in service revenues1
• $114 B in equipment revenues2
• 960M subscribers by 20093
• Wi-Fi Evolution (802.11 a,b,g,n)• $3.5 B in public Wi-Fi service revenues1
• $9.9 B in equipment revenues4
• 48M subscribers by 20091
• WiMAX (802.16-2004, 802.16e-2005)• $7.4 B in service revenues1
• $3 B in equipment revenues5
• 25 M subscribers by 20096
1 Source: Strategy Analytics (2006)2 Source: Average of Strategy Analytics and Yankee Group forecasts (2006)3 Source: Average of iGR, Informa WCIS, Strategy Analytics and Yankee Group forecasts (2006)4 Source: Forward Concepts (2005)5 Source: Average of Strategy Analytics (2006), Gartner (2006) and Forward Concepts (2005)6 Source: Average of Strategy Analytics (2006) and Gartner (2005) $0
$100
$200
$300
$400
$500
3G Wi-Fi WiMAX
Worldwide Service and Equipment Revenue, 2009
$US
, Bill
ions
Equipment Revenue
Service Revenue
$114
$394
$508
$13.4 $10.4
PAGE 22
Broadband Wireless AccessJune 2006
22
SummarySummaryTechnical Performance
Cost & Scale Business Case
Time to Market
• 3G data rates and capacities are comparable to or better than Mobile WiMAX*
• 3G leverages existing 2G/2.5G coverage; 3G coverage is better than Wi-Fi & Mobile WiMAX
• 802.20 complements EV-DO evolution with a compelling TDD solution for large spectrum allocations
• 3G broadband has at least a 4-year time-to-market advantage over Mobile WiMAX
• Since 2002, hundreds of 3G handsets, PDAs and PC card have been commercialized
• 3G technologies will be embedded into laptop PCs from leading manufacturers starting in 2005
• 802.11a/b/g is available today at low price points
• 802.11n will offer better performance within the home and enterprise than WiMAX
• Unlike Wi-Fi, the WiMAX market opportunity will require an operator business case;
• 3G technologies will continue to lower the cost per bit for core operator services
• 3G devices can be purchased for $50 in certain markets today*
• 3G forecasts indicate strong service revenues and equipment & device shipments**
• 3G expects to reach more than 800M subs, while WiMAX may reach 33M subs (2009)
• Multi-mode devices with 3G & MBWA 802.20 combine are poised to gain a major share of the Metro Area Deployments
* Commercial LG units shipping to Reliance in India** Source: ABI, Gartner, IDC, In-Stat/MDR, Strategy Analytics, 2004 & 2005
* Given equivalent channel bandwidths, coverage and allocated spectrum

12
��������������������������������