Embed Size (px)
Citation preview

UNIVERSITY OF PISA FACOLTÁ DI AGRARIA
Ph.D. thesis
SCIENZE AGRARIE E VETERINARIE PH.D. PROGRAM IN SCIENZA DELLE PRODUZIONI
VEGETALI (CROP SCIENCE) XXIII°Cycle
Aleatico grapevine characterization:
physiological and molecular responses to different
water regimes
SUPERVISORS
Prof. Giancarlo Scalabrelli
Prof. Pietro Tonutti CANDIDATE Lorenza Tuccio
Academic year 2010/2011


To my parents
‘With tango shoes or work boots that is always me’
Lorenza


TABLE OF CONTENTS LIST OF ABBREVIATIONS ……………...………………………………..……………...1 ABSTRACT ……………………………………………………………………………..…...4 1. INTRODUCTION………………………………………………………….……………..7 1.1 Aleatico grapevine…………………………………….……………………………….….71.2 Water stress………………………………………………………………………..……..101.2.1 Vine physiology…………………………………………………………………..…....111.2.2 Water relations and grape quality……………………………………………………...171.2.3 Molecular responses………………………………………………………...……….231.3 New optical sensors to evaluate grape quality……………………………………..…….261.4 Aim of the thesis………………………………………………….………….…………..28 2. MATERIALS AND METHODS………………………………………….……..……...30 2.1 Plant material and treatments……………………………………………….…………302.2 Physiological response analyses……………………………………...……….…………312.3 The fluorimetric sensor………………………………………...……...…….…………..352.4 Berry sampling and destructive measurements………………….………..….............372.5 HPLC/DAD analysis……………………………………………………….….....…....382.6 HPLC/MS analysis…………………….………………………………………..……..382.7 Quantitative analyses…………...……………….………………………………..…...382.8 Gene expression analyses……………………......…………………………...……….402.9 Statistical analysis…………………………………………………………………..…....44
3. RESULTS……………………...…………………………………………….....………..45 3.1 Phenolic compound characterization of Aleatico berries……………..……….…...……453.2 Multiplex index calibration………………………..……………….………….………....473.3 Comparison of 2008 and 2009 seasons………………………………………………......493.4 Water deficit effects………………………………..……………..………………….......563.4.1 2008 season………………………………………………..……..……………….........563.4.1.1 Physiological effects…………………………………..………..…………………....563.4.2 2009 season……………………………………..…………………..…………..……...623.4.2.1 Physiological effects………………………………………..……..……...…...….....623.4.2.2 Biomolecular results……………………………………………....…………...…….68 4. DISCUSSION……………………………………………..…………..…….……...……78 5. CONCLUSIONS…………………………………………..………………...…………...86
6. REFERENCES……………………………………………..………………....………….88


LIST OF ABBREVIATIONS ABA Abscissic acid
ANTH Anthocyanins
AOMT Anthocyanins O-methyltransferase
ATP Adenosine triphosphate
cDNA Complementary DNA
CH3CN Acetonitrile
CHL Chlorophyll
CHLF Clorophyll fluorescence
CHS Chalcone synthase
Ct Cycle threshold
CV Cultivar
DAD Diode Array Detector
DFR Dhydroflavonol 4-reductase
DHN1a Dehydrin 1a
DOY Day of year
DREB Dehydration responsive element-binding protein
DWF1 Dwarf1
ET0 Evapotranspiration
EtOH Ethanol
ETP Potential evapotranspiration
FAOMT Flavonol and Anthocyanin 3’,5’-O-methyltransferase
F3’H Flavonoid 3’-hydroxylase
F3’5’H Flavonoid 3’,5’-hydroxylase
FLAV Flavonols
FLS1 Flavonol synthase 1
FRF Far-red fluorescence
FW Fresh weight
G Green
gs Stomatal conductance
HCA Hydroxycinnamic acids
HCl Hydrochloric acid
1

HCOOH Formic acid
HPLC High performance liquid chromatography
H2SO4 Sulfuric acid
IR Irrigated
Kc Cultural coefficient
LDOX Leucocyanidin oxygenase
LED Light-emitting diode
MD Midday
MS Mass Spectrometry
MSA Abscisic acid-, stress-, and ripening-induced (ASR) gene
Mx Multiplex
MXK3 ABC transporter
NaOH Sodium hydroxide
NCED 9-cis-epoxycarotenoid dioxygenase
OMT O-methyltransferase
P5CR Pyrroline-5-carboxylate reductase
PIP2;1 Aquaporin
Pn Net photosynthesis
PRD Partial Root Drying
PrDh Proline dehydrogenase
qPCR-RT Quantitative real time polymerase chain reaction
R Red
RDI Regulated Deficit Irrigation
RF Red fluorescence
RNA Ribonucleic acid
ROX 6-carboxy-X-rhodamine
RQI RNA quality indicator
SD Standard deviation
SE Standard error
SF Sap Flow
STS Stilbene synthase
UFGT Flavonoid-3-O-glucosyltransferase
UV Ultraviolet
VIS Visible
2

VPD Vapour Pressure Deficit
VV Vitis vinifera
WR Water requirement
WS Water stress
WUE Water use efficiency
ZEP Zeaxanthin epoxidase
Ψs Stem water potential
3
4
ABSTRACT
Aleatico grapevine is a variety cultivated along Tuscany coasts and in Elba Island (Italy),
from which a typical dessert wine ‘Aleatico passito’ is produced after partial post-harvest
dehydration of berries.
The research project was focused on this variety because the knowledge of the
morphological traits and technological characteristics of Aleatico as well as the response of
this grape variety to different environmental conditions and climatic changes, including
reduced rainfall and water stress, is scarce. Therefore, to obtain a high quality wine that
recently received the Denomination of Controlled and Guaranteed Origin and to be more
competitive on the market, it is quite useful to conduct thorough studies on this variety and
on its responses to different water regimes, especially in terms of secondary metabolites
biosynthesis (phenolic compounds and flavours) during ripening.
Field trials were carried out, in 2008 and 2009, at ‘La Bulichella’ Winery (Suvereto,
Livorno, Italy) in order to study physiological responses (midday stem water potential, gas
exchanges and sap flow) and berry composition of non irrigated (WS) and irrigated (IR)
Aleatico plants. The climatic trends for the 2008 and 2009 seasons showed that in the 2009
season relative humidity was higher (30-80%) in comparison with 2008 (10-40%). Global
radiation in 2009 was also higher against to 2008. The air temperature frequently exceeded
26°C during 2008 season, while in 2009 this occurred and was concentrated during the
second part of the season. Relative humidity and air temperature measured at the grape
level did not markedly differ from those of the meteorological station. These climatic
conditions influenced the midday stem water potential and the gas exchanges that reached
lower values in 2009 than in 2008. In particular, in 2008 the photosynthetic activity and
conductance of IR plants leaves increased during véraison and maintained higher values
than in 2009, during which both parameters were decreasing, apart from the partial
recovery due to water supply on August 15th
.
In 2009 at harvest berry weight was reduced of about 20% in WS plants. An effect of
similar magnitude was detected for skin weight, while seed weight was not affected. The
sugar accumulation process resulted more pronounced in WS berries and this was
paralleled by higher titratable acidity values both at véraison and harvest.
5
In 2009 the total phenolic content of the berries was influenced by water stress only at the
end of the trial, with a reduction of the seeds phenolic compounds. The incidence of seeds
on total phenolic content was higher than that of skins, confirming that this behaviour is a
varietal characteristic.
Accumulation of anthocyanins (Anth) on whole wine grape bunches attached to the vine
was studied using a non-destructive fluorescence-based sensor, extremely useful for a rapid
and non-invasive determination of phenol compound-related parameters in the vineyard.
The very same 50-60 bunches were monitored during the seasons at a weekly frequency
from véraison to harvest. For each date of measurements, chlorophyll fluorescence signals
under different excitation wavelengths were collected to derive Anth, flavonols (Flav) and
chlorophyll (Chl) indices. The ANTHR, that is the Anth index based on a single
fluorescence signal excited with red (R) light, and the FLAV index increased and
decreased with time from véraison to harvest, respectively. The Chl index was
monotonically decreasing, while the ANTHRG, based on two fluorescence signals excited
with red (R) and green (G) light, followed a biphasic behavior increasing to a maximum at
about complete véraison and then decreasing to harvest. All the indices suggested an early
ripening process in 2009 compared to 2008, in agreement with other standard indicators
such as véraison occurrence, technological maturity and berry development. Calibration of
the fluorescence sensor was performed in 2008 by destructive HPLC analysis of phenolic
compounds in berry skin extracts. Starting from complete véraison, the ANTHRG index
was found to be fairly inversely correlated (r2 = 0.875) to the Anth surface-based
concentration (mg/cm2) through an exponential function. On the contrary, the Flav index
was uncorrelated to the Flav content, because of the interference of Anth on the
fluorescence signals. The ANTHRG non-destructive index was able to detect differences in
the Anth accumulation between seasons in accordance with the standard destructive
analysis of Anth berry skin content. Water stress imposed in 2009 increased Anth
accumulation in berries due to a reduction of berries in size but also to an increased Anth
biosynthesis. This effect was observed by both destructive and ANTHRG non-destructive
measurements.
In order to study at molecular level the expression of specific genes involved in the
anthocyanin biosynthetic pathway and water stress-related responses in Aleatico berries, a
research stage at the Wine Research Centre of the University of British Columbia
(Vancouver, Canada) was carried out. The transcript accumulation of several putative
6
water stress-sensitive genes was preliminary analyzed by qRT-PCR to identify possible
common biomarkers in leaves and in berries. Among these genes, Dehydrin1a showed
significant changes in transcription in WS samples. Considering genes involved in the
Anthocyanins pathway, the expression of UFGT (flavonoid 3-O-glucosyltransferase) and
FLS1 (flavonol synthase) appeared to be up-regulated by WS. A similar response was also
observed for two genes involved in the anthocyanin hydroxylation and methoxylation
processes.
Taken together results indicate that the variety Aleatico appears to be tolerant to water
stress condition and this information could be useful also for setting up targeted post-
harvest dehydration strategies to produce dessert wines and to allow its cultivation in
territories where irrigation is not available or saving water when the irrigation must be used
in severe dry conditions.

1. INTRODUCTION
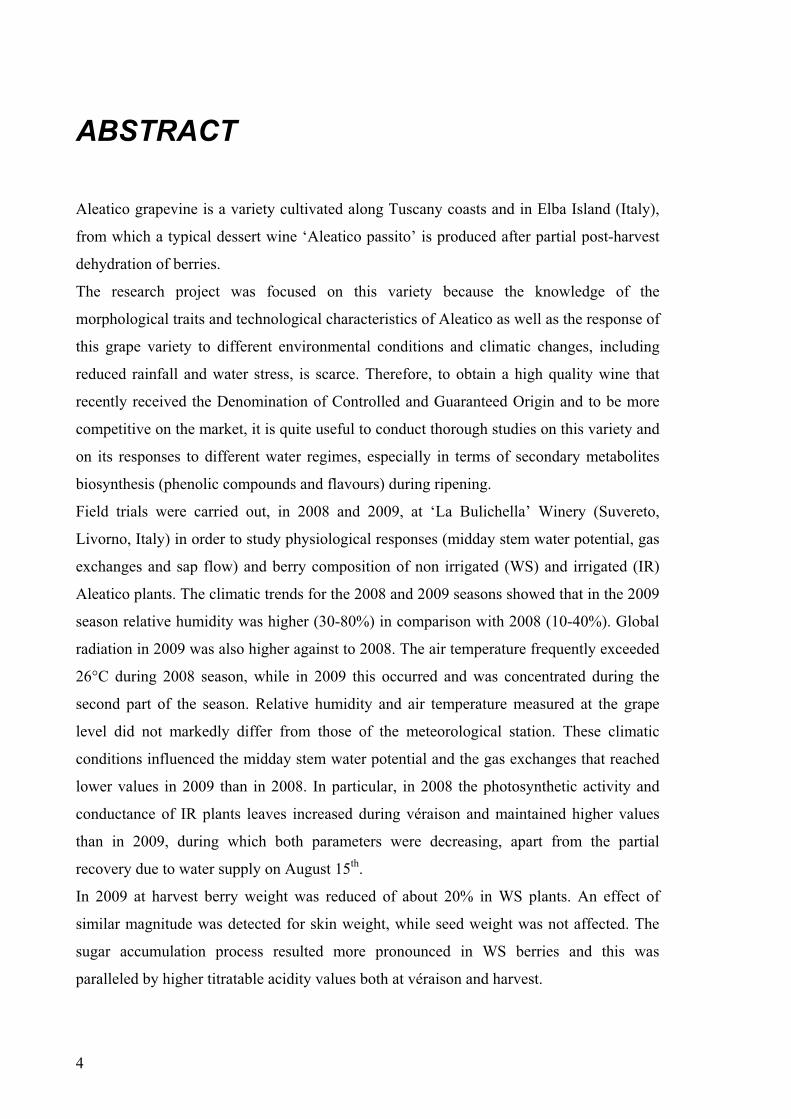
1.1 ALEATICO GRAPEVINE Aleatico is a red-skinned variety cultivated mainly along the coastline of Tuscany and in
the Elba Island (Italy) (Figures 1.1 and 1.2) for the production of a characteristic dessert
wine (‘Aleatico dell’Elba Passito’), after partial post-harvest berry dehydration, that
recently received the ‘Denomination of Controlled and Guaranteed Origin’ (DOCG).
This variety and the wine produced represent a strong link with the territory and, in the last
recent years, growers carried out a substantial vineyards renewal mainly due to the
productive cycle exhaustion (Scalabrelli et al., 2004).
In 1997 The Winegrowers Elba Association and ARSIA, supported a project of clonal
selection having the objective t obtain the homologation of clones of Aleatico necessaries
for the production of certified plant material required for the new plantations, considered
that at that time in Italy no homologated clones of Aleatico were availbale. According to
the official methods, the work of genetic and health selection started with the objective to
identify grapevine plants having grapes suitable for the dehydration process, characterized
by valuable qualitative features, and free from the main viruses. The difficulties to find
virus free plants in the Elba Island, suggested to extend the selection to others Tuscany
provinces. Presumed clones that resulted free from viruses at the end of DAS- and TAS-
ELISA health tests, were grafted in 1999 in the experimental vineyard planted on 1998 at
the Acquabona farm (Portoferraio, Livorno, Italy). In this vineyard eight clones of Aleatico
(clones ‘Entav’) homologated in France, supplied by the CIVAM of the Region Corsica
were also grafted and planted for comparison. Results of this research activity pointed out
that ‘Entav’ clones are genetically identical to the candidate clone of Aleatico of the Elba,
while the candidate clones ‘Alchi 1’, ‘Alesca 59’ and ‘Alesca 60’ coming from the
province of Grosseto, showed genetic diversity to the homologated clones of Aleatico
‘Entav 53’ (Scalabrelli et al., 2003). From this research, two candidate clones ‘Ale 102
and Ale 119 are now ready for the homologation (Scalabrelli et al., 2002), while, up to
now, only three clones of Aleatico are registered to the National Catalogue of the
Grapevine Varieties (I - AL-PA –1, I - VCR 438, I - ARSIAL-CRA 489).
Considering this limited amount of work carried out on Aleatico characterization, the
knowledge of morphological traits and technological features of this variety as well as the
7

its response to different environmental conditions and climatic changes, including reduced
rainfall and water stress, is scarce.
Aleatico cv. has large pentagonal and orbicular leaf, tri-lobed, smooth, of dark green face;
it shoots and ripens quite early and it has a low fertility of first buds. Berries are medium-
sized, discoid, very irregular in shape, blue vermilion, of a thick and with a heavy bloom
skin. The cluster is medium-small, medium-compact, elongated loose with a single
shoulder (Boselli et al., 2003). Both free and bound flavour compounds are abundant,
mainly as terpenic compounds. Differently from Moscato varieties, Aleatico has small
amounts of linalool, but higher quantity of geraniol following by nerol and citronellol.
Aleatico is rich of phenolic compounds (~ 10 g/L) and the non-flavonoids poliphenols are
highly represented (7.54 g/L). The cinnamic and benzoic acid, are usually present in small
concentration and during fermentation the amount decreases even further because they are
easily oxidized (Andrich et al., 2003).
During the post-harvest berries dehydration, phenolic compounds concentration decreases
progressively if referred to dry weight but not when referred to fresh weight (concentration
effect) and at same time the extractability increases. The candidate clones of Aleatico
showed high variability on quality berries components and, in particular, the high phenolic
profile variations suggest a clonal influence. A variable parameter is also represented by
the contribution of skins and seeds in terms of total phenolic compounds content, even
though the constantly higher incidence of seeds is a varietal characteristic (Scalabrelli et
al., 2002).
The climate of Tuscan Coastal areas and Isles where Aleatico grapevine is grown are
usually characterized by high temperature and low rainfall that can induce water stress
conditions in vines. A moderate water deficit can lead to qualitative superior production in
comparison to more favourable conditions with an optimal water supply (Düring et al.
1996, Wample and Smithyman 2002, Medrano et al. 2003, Fregoni 2005) but the response
to drought is a varietal characteristic that has not been studied yet in cv. Aleatico.
8

Figure 1.1. Map of Italy; red circle highlights the main diffusion of Aleatico cv. in the
Elba Island and along the coastline of Tuscany
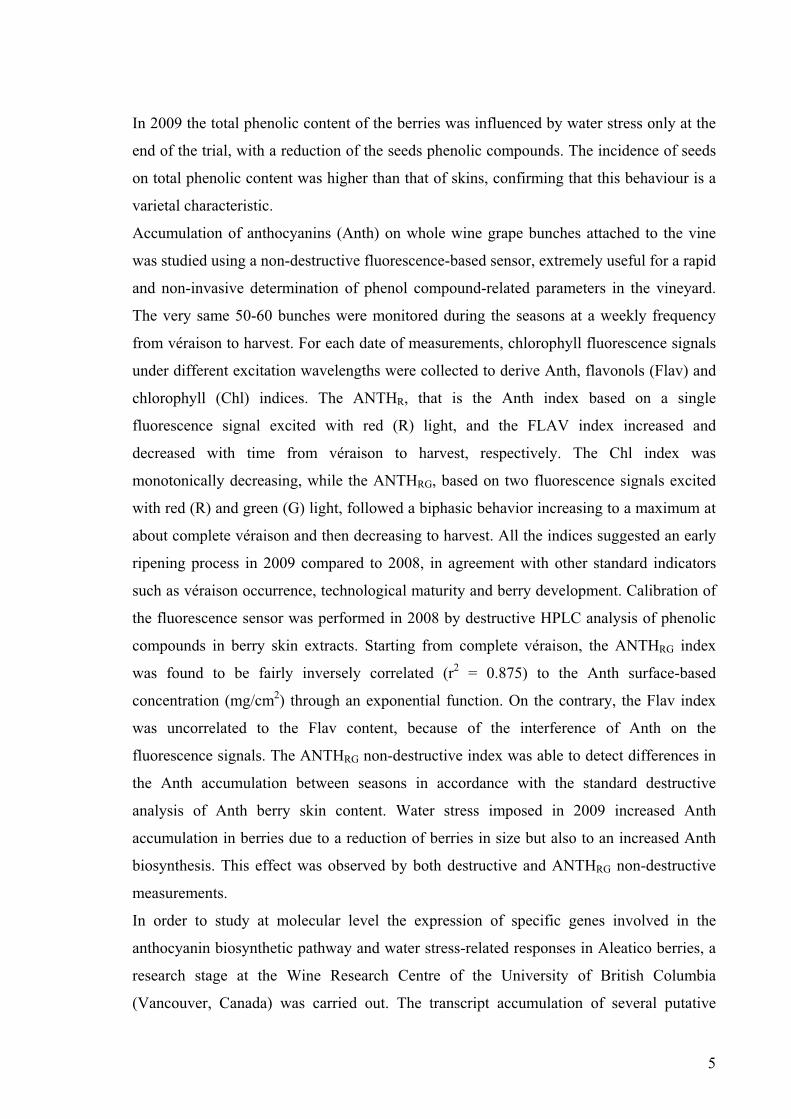
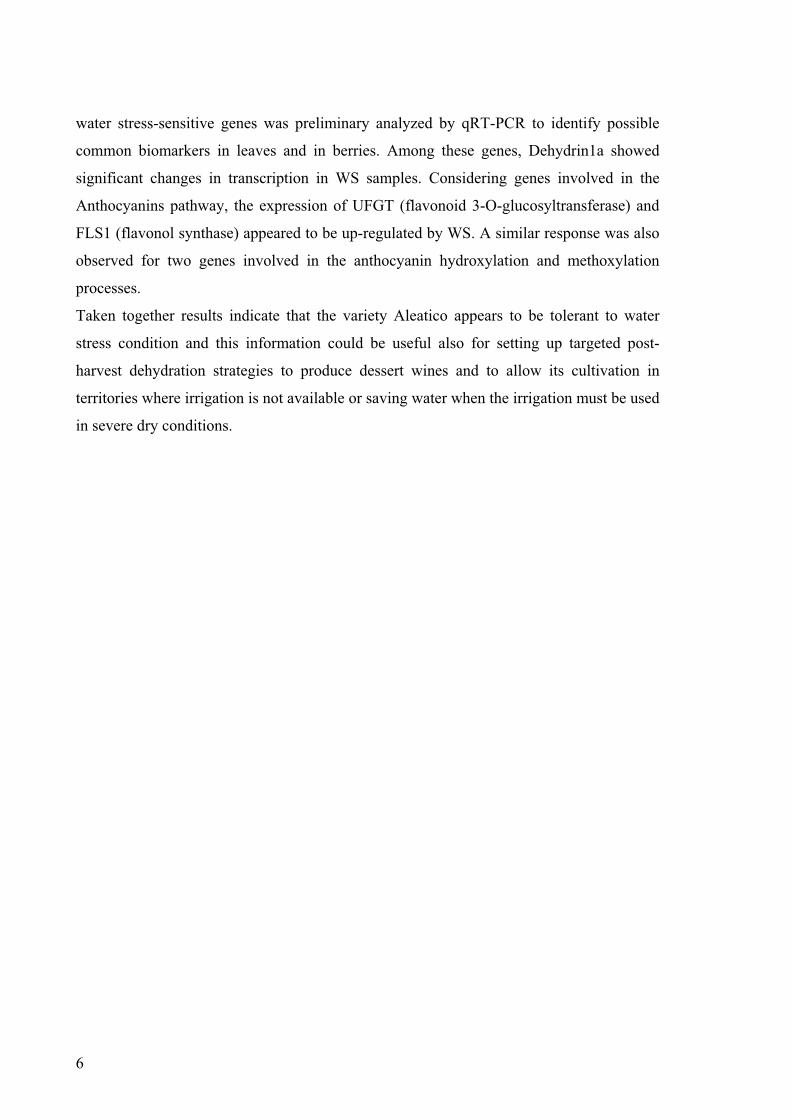
Figure 1.2. Aleatico vineyards at Elba Island
9

1.2 WATER STRESS Most of the world.’s wine-producing regions experience seasonal drought and water
deficits may become a limiting factor in wine production and quality (Chaves et al., 2007).
Global warming is also affecting grapevine development, as indicated by changes in
phenology and earlier harvests observed throughout the world (Jones and Davies, 2000;
Webb et al., 2007), with some European regions coming closer to the thresholds of
temperature and rainfall for optimum grapevine growth (Jones et al., 2005). In recent
years, water deficit is also occurring in cool climate wine regions that exhibit special
topography (van Leeuwen and Seguin, 2006; Zsòfi et al., 2009a). The frequency of
extreme events such as heat waves or heavy rains is also predicted to increase, with
negative effects on yield and quality of grapes. Sudden supra-optimal temperatures under
conditions of water scarcity may lead to massive leaf shedding, with a consequent source–
sink imbalance and incomplete berry maturation due to insufficient available carbohydrates
(Chaves et al., 2007). These effects are unlikely to be uniform across varieties (Schultz,
2000; Jones et al., 2005). The constraints posed by climate change require adaptive
management, namely irrigation to stabilize yield, maintaining or improving wine quality
(Dry and Loveys, 1998; Medrano et al., 2003; Chaves et al., 2007) and other associated
management techniques (e.g. soil cover) to minimize the effects of concentrated rainfall
(Monteiro and Lopes, 2007; Schultz, 2007). The search for varieties adapted to growing
seasons with altered length and displaying higher resilience to environmental stress is also
critical to optimum berry ripening. An improvement in the productivity of water use is
therefore required in vineyard management, with finely tuned deficit irrigation being able
to fulfil that role.
Grapes are grown in a range of natural environments, but vine development and fruit
composition are highly dependent on environmental conditions and particularly on vine
water status (Jackson and Lombard 1993). Water stress may influence various
physiological and developmental processes, including growth (cell division and
expansion), photosynthesis (stomatal opening and enzyme-linked functions such as
assimilation and respiration) as well as other metabolic and biochemical processes,
prompting physiological modifications that will eventually have an impact on production
and must quality (Lopez et al., 2007). Assessment and definition of the precise contribution
of water stress to production losses and impaired quality are a major concern when
evaluating crop water requirements (Tardàguila and Bertamini 1993).
10
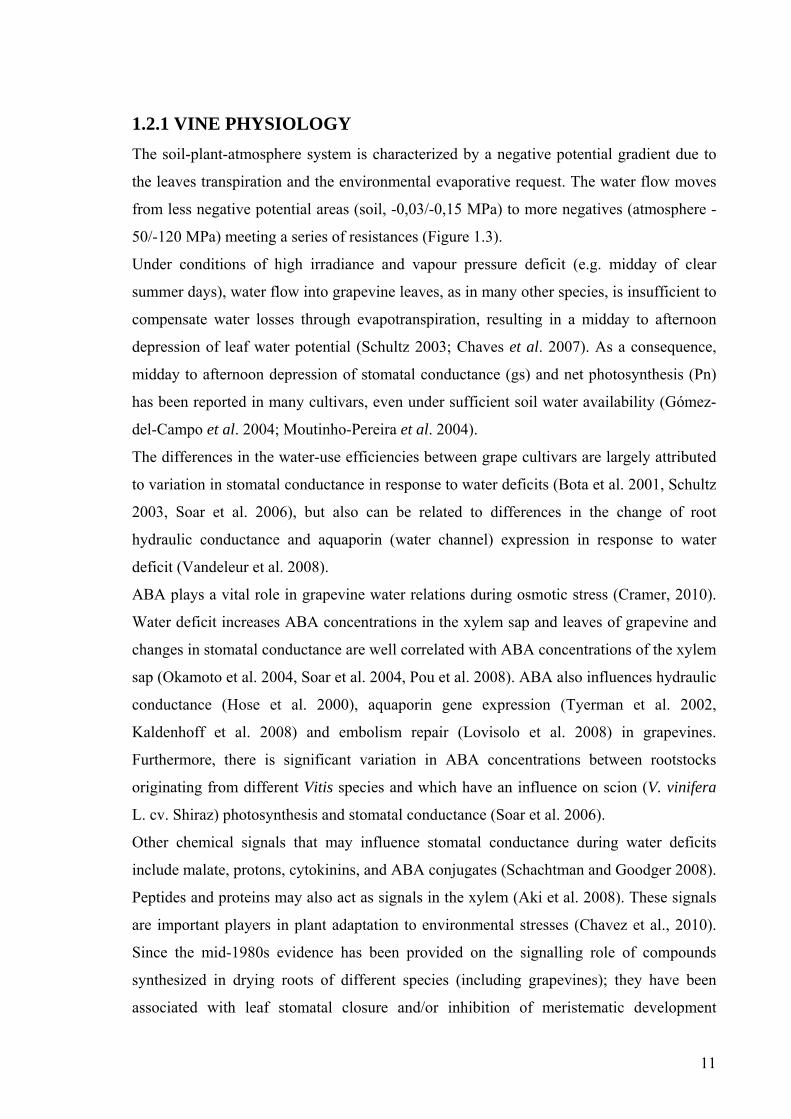
1.2.1 VINE PHYSIOLOGY The soil-plant-atmosphere system is characterized by a negative potential gradient due to
the leaves transpiration and the environmental evaporative request. The water flow moves
from less negative potential areas (soil, -0,03/-0,15 MPa) to more negatives (atmosphere -
50/-120 MPa) meeting a series of resistances (Figure 1.3).
Under conditions of high irradiance and vapour pressure deficit (e.g. midday of clear
summer days), water flow into grapevine leaves, as in many other species, is insufficient to
compensate water losses through evapotranspiration, resulting in a midday to afternoon
depression of leaf water potential (Schultz 2003; Chaves et al. 2007). As a consequence,
midday to afternoon depression of stomatal conductance (gs) and net photosynthesis (Pn)
has been reported in many cultivars, even under sufficient soil water availability (Gómez-
del-Campo et al. 2004; Moutinho-Pereira et al. 2004).
The differences in the water-use efficiencies between grape cultivars are largely attributed
to variation in stomatal conductance in response to water deficits (Bota et al. 2001, Schultz
2003, Soar et al. 2006), but also can be related to differences in the change of root
hydraulic conductance and aquaporin (water channel) expression in response to water
deficit (Vandeleur et al. 2008).
ABA plays a vital role in grapevine water relations during osmotic stress (Cramer, 2010).
Water deficit increases ABA concentrations in the xylem sap and leaves of grapevine and
changes in stomatal conductance are well correlated with ABA concentrations of the xylem
sap (Okamoto et al. 2004, Soar et al. 2004, Pou et al. 2008). ABA also influences hydraulic
conductance (Hose et al. 2000), aquaporin gene expression (Tyerman et al. 2002,
Kaldenhoff et al. 2008) and embolism repair (Lovisolo et al. 2008) in grapevines.
Furthermore, there is significant variation in ABA concentrations between rootstocks
originating from different Vitis species and which have an influence on scion (V. vinifera
L. cv. Shiraz) photosynthesis and stomatal conductance (Soar et al. 2006).
Other chemical signals that may influence stomatal conductance during water deficits
include malate, protons, cytokinins, and ABA conjugates (Schachtman and Goodger 2008).
Peptides and proteins may also act as signals in the xylem (Aki et al. 2008). These signals
are important players in plant adaptation to environmental stresses (Chavez et al., 2010).
Since the mid-1980s evidence has been provided on the signalling role of compounds
synthesized in drying roots of different species (including grapevines); they have been
associated with leaf stomatal closure and/or inhibition of meristematic development
11

(Loveys, 1984; Davies and Zhang, 1991). Although root-sourced chemical signalling is
widely accepted, the identity and regulation of these signals is still under debate (Holbrook
et al., 2002; Schachtmann and Goodger, 2008). Nevertheless, such knowledge has enabled
us to manipulate responses to soil water availability in some crops, so that changes in shoot
water status are minimized and performance under moderate stress is improved (Davies et
al., 2002; Chaves and Oliveira, 2004).
Under mild to moderate water deficits stomata closure is among the early plant responses,
restricting water loss and carbon assimilation (Chaves et al., 2003). Direct effects on
photosynthetic metabolism (Lawlor and Tezara, 2009) and on the expression of a multitude
of genes (Chaves et al., 2009) may also be present at early stages. Under long-standing
water deficits acclimatization responses do occur, including those related to growth
inhibition and to osmoregulation; these are key elements for the maintenance of plant
water status and therefore plant carbon assimilation under water scarcity (Chavez et al.,
2010). In grapevine, it has been reported for several varieties and different experimental
conditions (greenhouse and field; short- and long-term) that photosynthesis is quite
resistant to water stress (Flexas et al., 2002; Souza et al., 2003, 2005a; Chaves et al., 2007).
Under low to moderate water availabilities occurring under deficit irrigation, maintenance
of the activity of Calvin Cycle enzymes and of the maximum rates of carboxylation and
electron transport has generally been observed (Souza et al., 2005a). However, when stress
is intensified a decline in those parameters occurs, more markedly in electron transport
(Maroco et al., 2002; Souza et al., 2005a), possibly a result of decreased ATP production.
Lawlor and Tezara (2009) raised the hypothesis that reactive oxygen species produced
under conditions of low CO2 and excess light might induce oxidative damage to
chloroplastic ATPase. Under drought conditions, a close relationship was found between
stomatal function and plant hydraulics (Sperry, 1986; Cochard et al., 2002; Sperry et al.,
2002). Stomata keep water flow within safe limits preventing the plants from exceeding
those limits at any particular water potential, therefore avoiding xylem embolism (Sperry
et al., 2002). Higher stomata sensitivity to water deficits may compensate for higher
vulnerability to cavitation under drought (Schultz, 2003). Vitis vinifera shows high
hydraulic conductivity in the main stem axis (Lovisolo et al., 2007). However, leaf
hydraulic conductance can substantially constrain water transport, being a more important
hydraulic bottleneck than the stem (Sack et al., 1993). It is also known that hydraulic
conductance of roots and shoots influences stomatal regulation and plant transpiration
12

(Lovisolo and Schubert, 1998; Aasamaa et al., 2001; Rogiers et al., 2009). The distribution
of vessel sizes varies with variety and the larger sizes often result in higher sensitiveness to
embolism under drought conditions (Chouzouri and Schultz, 2005). Leaf morpho-anatomy
and related biochemistry (epicuticular wax composition, lipid composition, mesophyll
thickness, etc.) may also play a role in explaining plant adaptation to water stress
(Syvertsen et al., 1995; Boyer et al., 1997; Cameron et al., 2006). Differences among V.
vinifera have been reported in these characteristics (Schultz, 1996; Moutinho-Pereira et al.,
2007).
Grapevine is generally considered a ‘drought-avoiding’ species, with an efficient stomatal
control over transpiration (Chaves et al., 1987; Schultz, 2003). However, some genotypes
have shown a better control of stomata than others in response to water deficits and
accordingly have been classified as isohydric (drought avoiders or ‘pessimistic’); the
others, showing lower control over stomatal aperture under water stress, were considered
anisohydric, with an ‘optimistic’ response (Schultz, 2003; Soar et al., 2006). Schultz
(2003) considered ‘Grenache’ to be a nearly isohydric genotype showing a marked
regulation of stomatal conductance to decreasing soil water, whereas ‘Syrah’ exhibited a
response closer to an anisohydric type. However, contradictory reports appeared in the
literature showing that the same variety could behave differently depending on
experimental conditions (Lovisolo et al., 2010). Recent studies (Chaves et al., 2010)
revealed differences between varieties ‘Touriga Nacional’, ‘Trincadeira’, ‘Aragonez’ (syn.
‘Tempranillo’), ‘Cabernet Sauvignon’ and ‘Syrah’, in the response of leaf stomatal
conductance to deficit irrigation under field conditions. Stomatal conductance of ‘Touriga
Nacional’ remained highest during the day (morning and afternoon) for similar leaf water
potential, suggesting an anisohydric type of response. In contrast, ‘Syrah’ showed the
lowest conductance of the five varieties, particularly at noon, therefore exhibiting a near-
isohydric response, contrary to earlier reports (Schultz, 2003; Soar et al., 2006). A
classification of grapevine varieties as strictly iso- or anisohydric may prove inappropriate.
It seems plausible that stomatal responses to water deficits in a specific variety will vary
according to the particular combination of the rootstock, the climate (VPD and
temperature), and the intensity and duration of water deficits (Chaves et al., 2010). In fact,
under prolonged water deficits more rigid cell walls may develop, leading to a larger
decline in plant water potential at midday, characteristic of the anysohydric response.
Moreover, osmotic adjustment may contribute to the maintenance of open stomata at lower
13

water potentials, by enabling an improved turgor in response to a slowly imposed water
deficits. This combination of responses will interact with scion structural factors such as
water conducting capacity of stems and petioles to dictate response to water deficits
(Chaves et al., 2010).
According to Palliotti et al., (2009) the adaptive strategies include changes in root, shoot
and leaf morphostructural and biochemical characteristics, canopy morphology and plant
architecture. In grapevine the leaf age and position along the shoot and the genotype may
influence these strategies. Vines of Montepulciano and Sangiovese field-grown under
severe, multiple summer stresses showed morpho-biochemical and physiological behaviors
which tended to optimize the whole-vine carbon gain. The cv. Sangiovese showed to be
better adapted to drought conditions compared with Montepulciano (Palliotti et al., 2008)
and the genetic background appears to have a crucial role in the adaptation to summer
stresses and in the ability for CO2 uptake and for accumulation of nonstructural
carbohydrates into reserve organs (Palliotti and al., 2009).
Fig.1.3 Water potential gradient in the soil-plant-atmosphere system. The water flow meets
a series of resistance along the way .
The question of when and how much water should be applied in a given environment and
variety is still standing (Chaves et al., 2007) and it remains of considerable debate (Chaves
et al., 2010). On the one hand, small water supplements may increase yield and maintain or
14

even improve berry quality (Matthews and Anderson, 1989; Santos et al., 2003, 2005). On
the other hand, irrigation may promote excessive vegetative growth with a negative impact
on berry pigments (colour) and sugar content, and therefore decrease wine quality (Bravdo
et al., 1985; Dokoozlian and Kliewer, 1996).
With enhanced pressure on water resources, the increasing demand for vineyard irrigation
will only be met if there is an improvement in the efficiency of water use (Davies et al.,
2002; Chaves & Oliveira, 2004; Flexas et al., 2004; Cifre et al., 2005; Souza et al., 2005a).
New approaches for irrigation management will have to reduce both water consumption
and the detrimental environmental effects of current agricultural practices. This goal may
be achieved in several ways, deficit drip irrigation being a widely used practice with the
aim of saving water and simultaneously improving wine quality. Currently, the two most
important irrigation tools, based on physiological knowledge of grapevine and other crops
response to water stress, are regulated deficit irrigation (RDI) and partial root-zone drying
(PRD). In RDI water input is removed or reduced for specific periods during the crop
cycle, improving control of vegetative vigour, to optimise fruit size, fruitfulness and fruit
quality (Chalmers et al., 1986; Alegre et al., 1999; Dry et al., 2001). RDI has been used
successfully with several crops, reducing water use in crops, such as olive trees (Alegre et
al., 1999; Goldhamer, 1999; Wahbi et al., 2005), peaches (Mitchell & Chalmers, 1982; Li
et al., 1989; Boland et al., 1993), pears (Mitchell et al., 1989; Caspari et al., 1994; Marsal
et al., 2002) and grapevines (Goodwin & Macrae, 1990; Battilani, 2000).
However, this technique needs control of water application, which is difficult to achieve in
practice. Although deficit irrigation is already applied to vast regions worldwide in a more
or less uncontrolled/unsophisticated way, the scientific knowledge underlying its optimal
functioning is still needed.
PRD is a deficit irrigation strategy that has been shown to reduce vegetative growth in
grapevines as measured by pruning weight, shoot growth rate and leaf area, without
causing a significant change in fruit weight or sugar accumulation (Dry et al., 1996; Du
Toit et al., 2003; Bindon et al., 2008a). For the measurement of acidity, however, a
variable response has been obtained with PRD irrigation (Bindon et al., 2008b).
Photosynthetic rates generally decline at lower pre-dawn water potentials than stomatal
conductance, when grapevines are subjected to moderate water deficits. As a consequence,
intrinsic water use efficiency (Pn/gs or WUEi) is usually higher in vines under deficit
irrigation (mild to moderate water deficits) than under well-watered conditions (Chavez et
15

al., 2010). This is reflected in a lower water use and higher WUE by the crop, an important
aim of deficit irrigation strategies in vineyards (Gaudillère et al., 2002; Chaves et al., 2004;
Souza et al., 2005b). When analysing WUEi it is therefore important to study it throughout
the day (Chavez et al., 2010). Field studies using ‘Moscatel’, ‘Castelão’ and ‘Aragonez’
(syn. ‘Tempranillo’) showed that deficit irrigation strategies (e.g. PRD and conventional
DI, both at 50% ETc) promoted an increase in WUE, when compared with fully irrigated
grapevines (100% ETc), both in the short term and the long term (Souza et al., 2005b). An
increase in WUE and related water savings under deficit irrigation was also reported in
studies carried out in different grapevine varieties and in different locations (Dry et al.,
2000; Stoll et al., 2000; Loveys et al., 2004; Poni et al., 2007; Marsal et al., 2008).
In a number of early papers reporting on the use of irrigation as a tool to manipulate
vegetative growth, deficit irrigation was typically associated with reduced yield (Matthews
and Anderson 1989). However, more recent research has shown that the impact on yield
depends on the strategy used to apply soil water deficit irrigation (Goodwin and Macre
1990; Dry 1997; McCarthy 1997; Loveys et al. 1998; Koundouras et al. 1999). In hot
climates and in non-irrigated vineyards, shoot growth may be reduced, leading to more
open canopies. However, the vines might suffer from water stress, resulting in a yield
reduction. The main consideration when selecting a vineyard water-management regime
must be quality (i.e. the desired enological characteristics in musts and wines). Regime
choice is not easy, since quality is a subjective concept, and each grape variety has its own
distinctive characteristics. Moreover, irrigation of grape vines affects vine physiology,
which may affect yield and grape composition, both of which influence wine quality
(Lopez et al., 2007).
Hence, a rational application of irrigation necessarily requires a clear understanding of the
physiological responses of the vine to water stress (Cifre et al. 2005, Remorini et al. 2010)
and a rapid monitoring of berry parameters. This is also of paramount importance for the
characterisation of local varieties such as the cv. Aleatico studied in the present work.
Since irrigation criteria is based on vine water demand rather than relaying on weather
and/or soil moisture measurements, irrigation scheduling can be managed in a precise
manner using midday Ψs as a vine physiological indicator. The use of midday Ψs as a
physiological index, demonstrated to be a suitable way to perform irrigation scheduling on
grapevines under RDI, since it considers soil–plant–atmosphere factors. A mild water
stress of down to -1.2 MPa, for the cv. Cabernet Sauvignon under RDI, showed to be the
16

most effective threshold to optimize soil water availability, irrigation scheduling, yield and
grape quality (Acevedo et al., 2010).
Basing on midday Ψs physiological index, a sensitivity ranking to water stress between
different varieties was showed (Scalabrelli et al., 2011) identifying the Sangiovese, as a
variety which significantly responds under drought conditions (Table 1.1).
Phys iolog ic al index C ultivar C oeffic ient S ens itivity levelMDΨs S angiovese 0.74 high
C abernet S auvignon 0.23 lowAlicante 0.49 medium‐highP etit Verdot 0.68 medium‐highS yrah 0.67 medium‐high
Table 1.1 Varieties ranking in response to water stress, based on midday stem water
potential measurements. The arbitrary coefficient was calculated as ratio between the
number of measures in which there were noted statistical differences on Ψs (p < 0.05) in
vines subjected to water restriction and the total of measurements made.
1.2.2 WATER RELATIONS AND GRAPE QUALITY There are many abiotic stresses that significantly limit the distribution of grapes around the
world. These stresses reduce crop yields, but only water deficit has been used in a positive
way to enhance flavour and quality characteristics of the berries (Roby et al. 2004,
Chapman et al. 2005). Several authors report that a moderate water deficit can lead to
qualitative superior production in comparison to more favourable conditions with an
optimal water supply (Düring et al. 1996, Wample and Smithyman 2002, Medrano et al.
2003, Fregoni 2005). In part, this effect is because of reduced shoot vigour and
competition for carbon resources (a change in source to sink relationship) (Cramer, 2010).
Berry size can also be reduced, concentrating flavours and colour by increasing the skin
surface: berry mass ratio (the skin being a significant tissue for producing flavours, tannins
and colour) (Cramer, 2010). In addition, there are fundamental biochemical changes in
berries under water deficit that cause important metabolic changes that influence berry
flavour and quality (Castellarin et al. 2007a, Deluc et al. 2009). Water deficit was also
shown to enhance photoprotection mechanisms in berries (Deluc et al., 2009).
17
In vineyards under Mediterranean conditions it has been a common practice to manage the
water deficit during the final phases of grape development (Williams & Matthews, 1990).
However, in Australia, for example, the most common practice is to apply less water early
in the season (McCarthy et al., 2000). Both of these practices have shown to benefit wine,
in one case reducing the grape size by limiting available water and in the other one by
limiting the potential for grape growth (Chaves et al., 2007). A key to improve winegrape
quality in irrigated vineyards is to achieve an appropriate balance between vegetative and
reproductive development (Chaves et al., 2007).
Grape berry is a non-climacteric fruit with a double sigmoid growth curve (Coombe, 1976)
(Fig. 1.4). Stages I and III of growth are separated by a lag phase (stage II). During stage I,
imported carbohydrates are used for seed development, cell proliferation and expansion,
and synthesis of organic acids (Coombe, 1992). At this stage the berry is exclusively
connected to the vine through the xylem, and the impact of water deficit on berry growth is
thought to occur directly by changes in water import by the xylem, which possibly induces
a decrease in mesocarp cell turgor (Thomas et al., 2006). There is consequently a reduction
in the expansion of grape berries. However, it is also possible that the ABA synthesized
under water stress limits cell division and consequently small berries are produced. The
second hypothesis correlates well with the observed inhibition of grape development
following water deficit at pre-véraison (Chaves et al., 2010). This leads to a cascade of
events culminating in earlier grape ripening (e.g. accelerating sugar and anthocyanin
accumulation and malic acid breakdown) (Castellarin et al., 2007a, b). The beginning of
the second phase of berry growth (stage III), known as véraison, is characterized by
softening and colouring of the berry and a size increase (Chaves et al., 2010). After
véraison a reduction in berry size due to water deficit is probably the result of more than
one mechanism (Thomas et al., 2006). At this stage, the berry’s connectivity to the vine is
via the phloem (Thomas et al., 2006). Moreover, a reduction of berry size might be only
indirectly caused by water stress, through a decrease in photosynthesis (Wang et al., 2003).
Post-véraison water deficit increases the proportion of whole-berry fresh mass represented
by seeds and skin (Roby and Matthews, 2004) and berries present ‘thicker skins’ at harvest
probably due to a decrease in the activity of pectin methylesterase enzyme (Deytieux-
Belleau et al., 2008), as was shown in water-stressed tomato cherry fruit (Barbagallo et al.,
2008). This results in higher content of skin-based constituents (e.g. tannins and
18

anthocyanins) on a berry mass basis and as a consequence the must from those berries is
much richer in skin derived extractives (Chatelet et al., 2008).
Grape quality largely depends on sugar/acid balance at harvest (Chavez et al., 2010).
Moderate water deficit promotes sugar accumulation either as a result of inhibiting lateral
shoot growth, which induces a reallocation of carbohydrates to fruits, or as a direct effect
of ABA signalling on fruit ripening (Coombe, 1989). Indeed, experimental evidence
suggested activation of ABA-mediated uptake of hexose (Deluc et al., 2009). However, the
mechanisms underlying accumulation of hexoses under water deficit have not been
elucidated completely. The effects of water deficit on sugar content of grapevine berries
are variety-dependent (Gaudillère et al., 2002). For example, no significant changes were
observed in ‘Merlot’ sugar content under water deficits, while a significant increase in
sugar content was observed in ‘Cabernet Sauvignon’ berries (Castellarin et al., 2007a, b).
Similarly, Deluc et al. (2009) observed an increase in berry sugar content under water
deficits in ‘Cabernet Sauvignon’ but not in ‘Chardonnay’. This may be explained either by
differences in vigour, and therefore source/sink equilibrium, between varieties, or by
different mechanisms underlying the response of grape berry development to water
limitation according to the timing and intensity of water stress imposition (Chavez et al.,
2010). Indeed, it was shown that water deficit has more effect on berry sugar accumulation
when imposed before véraison (Keller, 2005; Keller et al., 2006). In most cases, no
titratable acidity changes have been observed in the must from moderately water-stressed
vines (Matthews and Anderson, 1989; Esteban et al., 1999). However, some studies report
a reduction of titratable acidity due to deficit irrigation as compared with full irrigation
(Sheltie, 2006; Santos et al., 2007). Malate/tartarate ratio is in general lower due to malate
breakdown in vines with low water status (Matthews and Anderson, 1989).
The phenolic compounds concentration in berry depends, besides genetic factors, on
specific metabolism (synthesis/degradation) and berry growth rate, both affected by
cultural practices and environmental conditions, including vine water status (Kennedy et
al. 2002, Ojeda et al. 2002, Downey et al. 2006, Castellarin et al. 2007a). Regulating
grapevine water deficit is a powerful tool to manage the amount of these compounds and
improve wine quality (Kennedy et al., 2002).
19

The effect of water deficit on the synthesis and concentration of phenolic compounds
(flavan-3-ols, anthocyanins (Anth) and flavonols (Flav)) depends on the stress level and
the berry phenological stage as observed in cv. Shiraz (Ojeda et al. 2002) and Cabernet
Sauvignon (Kennedy et al. 2002). It was higher from anthesis to véraison under moderate
water stress and from véraison to harvest under strong water stress. Flavan-3-ols
biosynthesis decreases under first water deficit, proanthocyanidins and Anth increase only
from véraison to harvest under strong water stress; each level of water stress increases the
tannins polymerization degree.
Flavonoids (anthocyanins, flavonols and proanthocyanidins) and stilbenes, the most
important phenolic compounds are mainly localized in exocarp and seed endocarp tissues
(Chaves et al., 2010).
The reported increase in skin tannin and anthocyanin that accompanies water deficits
seems to result from different sensitivity of berry tissues to water deficits, with the exocarp
being less affected than the inner mesocarp (Roby et al., 2004).
Anth are synthesized via the flavonoid pathway in the berry skin of red grapevines from
véraison (Chaves et al., 2010). The major anthocyanins synthesized are peonidin 3-O-b-
glucoside and malvidin 3-O-b-glucoside, because methoxylation of delphinidin to produce
its derivate petunidin rarely occurs (Castellarin et al., 2007b; Deluc et al., 2009) and water
stress seems to have a greater impact on anthocyanin composition than on its total
concentration (Chaves et al., 2010).
Flavonols act as co-pigments with anthocyanins and stabilize colour in young red wines
play a fundamental role in grape quality (Boulton, 2001). Flavonol biosynthesis is closely
related to that of anthocyanins (Jeong et al., 2006). However, in contrast to anthocyanins, a
small number of flavonols were identified and available data were limited to a few grape
varieties (Mattivi et al., 2006). The main flavonols reported in grape berries are quercetin-
3-glucoside and quercetin-3-O-glucuronide (Downey et al., 2003). Deficit irrigation was
reported to have a moderate effect on flavonol synthesis in red grapevines (Grimplet et al.,
2007). In turn, the timing of water deficit does not change flavonol content (Kennedy et al.,
2002). Mattivi et al. (2006) have suggested that anthocyanins and flavonols share the same
biosynthetic enzymes. This may indicate that, like anthocyanins, changes to flavonol under
water deficits may occur rather in composition than in accumulation (Chaves et al., 2010).
More recently, in a white grapevine (‘Chardonnay’), flavonol concentrations were reported
to increase under water deficits, which was not the case in a red grapevine (‘Cabernet
20

Sauvignon’) in the same study (Deluc et al., 2009). This suggests a greater need for berry
photoprotection in these varieties, as previously shown in apples with low levels of
anthocyanins (Merzlyak et al., 2008).
Proanthocyanidins or condensed tannins are flavan-3-ol oligomers. They are important
sensory components, providing wine with bitterness and astringency. However, little is
known about proanthocyanidins (Dixon et al., 2005; Xie and Dixon, 2005) and a
standardized measure of tannins has not yet been adopted (Downey et al., 2006). Besides,
changes occurring in proanthocyanidins during grape development are complex, involving
increases in the degree of polymerization, in the proportion of (–)epigallocatechin
extension units, and in polymer-associated anthocyanins (Kennedy et al., 2002).
Proanthocyanidins appear to be only slightly affected by water deficit (Downey et al.,
2006) and the increases in skin tannin that accompany water deficits appear to result more
from differential growth sensitivity of the inner mesocarp and the exocarp than from direct
effects on phenolic biosynthesis (Roby et al., 2004). The effect of concentration of seed
tannins on wine characteristics is not known (Matthews and Nuzzo, 2007). Moreover, few
works have reported whether water status influences seed proanthocyanidin content. Two
studies performed with the same variety (although in different environments) did not show
any significant effects of water deficit on seed proanthocyanidins (Kennedy et al., 2000;
Geny et al., 2003).
Stilbenes belong to the non-flavonoid class of phenolic compounds. Generally, stilbenes
are considered as phytoalexins, and their formation in grape leaves was correlated with
disease resistance (Chaves et al., 2010). Resveratrol is considered the most bioactive
stilbene in grapevines (Bavaresco et al., 2008). In grape berries, resveratrol synthesis is
catalysed by stilbene synthase (STS), which shares the same substrates used by chalcone
synthase for flavonoid production (Versari et al., 2001). It accumulates mainly in the grape
skin and seeds, and it has been found both in red and white grapes at a large range of
concentrations, depending on biotic and abiotic conditions (Jimenez et al., 2007).
Conflicting results have been found on the effects of water deficit on resveratrol synthesis
(Chaves et al., 2010).
The aroma that builds up in grapes results from several compounds (terpenoids and their
derivatives, esters, aldehydes and thiols) stored as non-volatile precursors mainly in
exocarp vacuoles (Chaves et al., 2010). The influence of the irrigation strategy on grape
21

berry aromas has not received much research. However, two major studies suggest that
deficit irrigation alters several sensory attributes of the wine as well as the concentration of
carotenoids and their derivatives in berries, as compared with standard irrigation
grapevines (Chapman et al., 2005; Bindon et al., 2007). Chapman et al. (2005) reported
that water deficits led to wine with more fruity and less vegetal aromas than those from
vines with high water status, in the variety ‘Cabernet Sauvignon’. Bindon et al. (2007)
observed that deficit irrigation led to an increase in the concentration of hydrolytically
released C13-norisoprenoids (b-damascenone, b-ionone and 1,1,6- trimethyl 1,2-
dihydronaphthalene) in ‘Cabernet Sauvignon’ grape berries at harvest.
Figure 1.4. Berry development and ripening at 10-day intervals after flowering.
(Illustration by Jordan Koutroumanidis, Winetitles, Kennedy et al., 2002)
22

1.2.3 MOLECULAR RESPONSES Whereas physiological and biochemical data are numerous regarding the effect of water
deficit, little is known about gene expression in grape berries exposed to water deficit and
the timing of its imposition. The changes in the individual transcript abundance of many
genes during long-term water stress study are similar to changes in short-term study
(Tattersall et al. 2007); however, there were indications that a larger and more complex
response in the acclimation process occurred with a gradual long-term stress.
A berry tissue analysis using global gene expression techniques indicated that water deficit
affected the mRNA abundance of 13% of genes at grape maturity within the three tissues
of the berry (skin, pulp and seeds), with the greatest changes located in the pulp and skin
(Grimplet et al. 2007b). While the function of many of the genes differentially expressed
within the seed and pulp remain to be elucidated, other genes over-represented in the skin
were clearly associated with phenylpropanoid metabolism, ethylene, pathogenesis-related
responses, energy metabolism and stress responses.
The responses to water stress include changes in hormone metabolism, particularly abscisic
acid (ABA), photosynthesis, growth, transcription, protein synthesis, signalling and
cellular defences.
Metabolic responses appear to be influenced by the cultivar and the colour of the grape
(Deluc et al. 2009). Water deficit particularly affects ABA metabolism in Cabernet
Sauvignon berries, but not in Chardonnay berries. ABA is known to enhance proline,
sugar and anthocyanin accumulation in plants and the increased ABA concentration in
Cabernet Sauvignon by water deficit was consistent with this hypothesis resulting in
increased accumulation of these components relative to well watered controls. In
Chardonnay, water deficit did not increase ABA concentration likewise sugar and proline
concentration were not significantly different from the well-watered controls.
The stomatal conductance that in grapevine is one of the most sensitive index of plant
water deficit is negatively correlated with ABA concentrations in the xylem sap and ABA
concentrations in the leaves are correlated with the transcript abundance of VvNCED1
gene (Soar et al. 2004). Cramer et al. (2010) showed that the expression of NCED, the rate
limiting enzyme for ABA biosynthesis, first increases in response to water deficit (Endo et
al. 2008). Under water stress conditions changes in water potentials increases the
expression of aquaporins that influence cell and root hydraulic conductivity (Vandeleur et
al. 2008). Another consequence of water stress conditions is that plants need to dissipate
23

the excess of absorbed light energy or chlorophyll fluorescence for the prevention of
photooxidative damage of the photosynthetic apparatus (Niyogi et al.1998). Synthesis of
xantophyll pigments are needed at this point, so is likely that high levels of Zeaxanthin
epoxidase and Violaxanthine de-epoxidase, is a response to this stress.
In water deficit plants the higher concentrations of glucose, malate and proline not only aid
plants in osmotic adjustment, but also may help plants cope with reactive oxygen species
detoxification and photoinhibition. As consequence, transporters for nitrate, nitrite, sulfate,
proline, ATP, amino acids (proline) and organic acids exhibit greater expression patterns in
response to water deficit (Cramer et al. 2007).
Transcripts of several transcription factors are also positively up-regulated by drought
conditions as members of DREB family (1608315_at) (Castellarin et al., 2007b), which
bind to a drought-responsive element in the promoter of drought-induced genes (Liu et al.
1998).
Specific proteins called Dehydrins are reactive to various dehydrating stress conditions
such as cold, salinity and also drought and they can accumulate in vegetative tissues and in
seeds at later stages of embryogenesis (Xiao et al., 2006). Zamboni et al. (2008) reported in
the molecular results of a post-harvest withering grape experiment that DHN1a, a gene
coding for dehydrin biosynthesis, had higher expression level in off-plant withered berries.
The response of anthocyanins to water deficit is irrelevant in white berry varieties as
Chardonnay cv. because they cannot produce Anthocyanins for a multi-allelic mutation
(Walker et al., 2007). In red varieties Anthocyanins are synthesized via the flavonoid
pathway that harbour the wild-type VvmybA1 transcription factor for the expression of
UFGT (Kobayashi et al., 2004). The encoded enzyme UFGT catalyses the glycosylation of
unstable anthocyanidin aglycones into pigmented anthocyanins (Figure 1.5). Two primary
anthocyanins (cyanidin and delphinidin) are synthesized in the cytosol of berry epidermal
cells. Cyanidin has a B-ring di-hydroxylated at the 3′ and 4′ positions, whereas delphinidin
has a tri-hydroxylated B-ring because of an additional hydroxyl group at the 5′ position.
Flavonoid precursors are initially recruited from the phenylpropanoid pathway by a small
family of chalcone synthases (CHS1, CHS2, CHS3) and enter the flavonoid pathway.
Parallel pathways downstream of F3′H and F3′5′H (Bogs et al. 2006; Castellarin et al.
2006) produce either cyaniding or delphinidin. The 3′ position of cyanidin and delphinidin
24

and sequentially the 5′ position of delphinidin can be methoxylated by OMT that generate
peonidin, petunidin and malvidin, respectively.
Water deficit has been considered to enhance accumulation of anthocyanins, through the
stimulation of anthocyanin hydroxylation, probably by up-regulating the gene encoding the
enzyme F3’5’H (Mattivi et al., 2006; Castellarin et al., 2007b).
Genes coding for O-methyltransferase (OMT) were also up-regulated in berries from
dehydrated plants in which anthocyanin composition enriched in more methoxylated
derivatives such as malvidin and peonidin, the grape anthocyanins to which human gastric
bilitranslocase displays the highest affinity (Castellarin et al., 2007b).
Gene regulation of the anthocyanin pathway was known to be affected also by the timing
of imposition of water deficit (Castellarin et al., 2007a). Early imposition of water stress
led to increased sugar accumulation, which accelerates anthocyanin synthesis (Castellarin
et al., 2007b), probably due to ‘sucrose boxes’ in the promoters of LDOX and DFR genes
(Gollop et al., 2001, 2002). Colour differences were the result of increased anthocyanin
synthesis caused by water deficit applied either early or late in the season (Matthews and
Anderson 1988, Castellarin et al. 2007a, Deluc et al. 2009). It was suggested that both
ABA and sugar signalling might affect accelerated anthocyanin development.
Considering the brassinosteroid synthetic pathway which is implicated in hormonal control
of ripening (Symons et al. 2006), the gene DWF1 was found up-regulated in WS vines
throughout véraison (Castellarin et al., 2007b).
The induction in WS plants of structural and regulatory genes of the flavonoid pathway
and of genes that trigger brassinosteroid hormonal onset of maturation suggested that the
interrelationships between developmental and environmental signalling pathways were
magnified by water deficit which actively promoted fruit maturation and, in this context,
anthocyanin biosynthesis.
Transcriptomic analysis of genes encoding enzymes involved in the biosynthesis of
volatile compounds revealed an increase in the transcript abundance of one terpenoid
synthase, one carotenoid cleavage dioxygenase and several lipoxygenases under conditions
of water deficits (Deluc et al., 2009). However, the correlation of enzyme transcript
abundance with the reaction products they catalyse is not straightforward, given the
complexity of gene regulation, enzyme activity modulation and differential expression of
ultigenic families (Chaves et al., 2010). m
25

Figure 1.5. The pathway of flavonoid biosynthesis. See the text for gene identification. E,
eriodictyol; Nf, naringenin flavanone; Phf, pentahydroxyflavanone; Dhq, dihydroquercetin;
Dhk, dihydrokaemferol; Dhm, dihydromyricetin. (Figure by Castellarin et al., 2007b)
1.3 NEW OPTICAL SENSORS TO EVALUATE GRAPE QUALITY An appropriate evaluation of grape maturity is fundamental for the production of high-
quality wine (Conde et al. 2007, Kennedy et al., 2006). However, monitoring the phenolic
content of grape berries is difficult because of its large spatial and temporal heterogeneity
among the different vineyard plots (Bramley, 2005). Grape phenolic maturity is usually
determined by destructive laboratory analysis (Harbertson et al., 2006; Di Stefano et al.,
2008), which are time-consuming and require an accurate sampling approach to be
representative of the vineyard block considered. The development of new portable optical
sensors dedicated to the non-destructive assessment of Anth in grape clusters attached to
the vines represents a useful complementary tool to evaluate phenolic maturity and better
characterize grapevine varieties (Agati et al. 2009, Cerovic et al. 2009, Ben Ghozlen et al.
2010a,b).
26

These new optical techniques based on near infrared spectroscopy linked to chemometrics
are emerging (Gishen et al., 2005). Estimation of skin anthocyanins (ANTH) through
direct berry colour measurement without extraction has also been used (Carreño et al.,
1995). More recently, a method was proposed to assess the skin content of phenolics. It is
based on their screening of excitation of chlorophyll fluorescence (ChlF). The method is
applicable to winegrape leaves (Kolb and Pfu¨ ndel, 2005) and fruits (Kolb et al., 2003;
Agati et al., 2007) using either UV light for flavonols (FLAV) or visible light for ANTH.
A visible beam for which the epidermis is transparent is used as a reference (cf. Agati et
al., 2007). Assessment of FLAV and ANTH has also been attempted in apple skin by
devices originally developed for leaves (Hagen et al., 2006). Cerovic et al. (2008) used a
new instrument Dualex ANTH in addition to the leaf-clip Dualex FLAV, and a new
prototype hand-held optical sensor Multiplex. The latter stands for multiple excitation
fluorescence sensor and was derived from a work on fluorescence lidars (Ounis et al.,
2001). The validation of the use of fluorescence-base sensors was performed by Cerovic et
al., (2008) on wine grapes known to have large contents of ANTH. Dualex measurements
were performed on berry caps in order to calibrate the method on grapes. Multiplex
measurements were performed on whole bunches to evaluate the potential use of
fluorescence as signature of phenolic maturity.
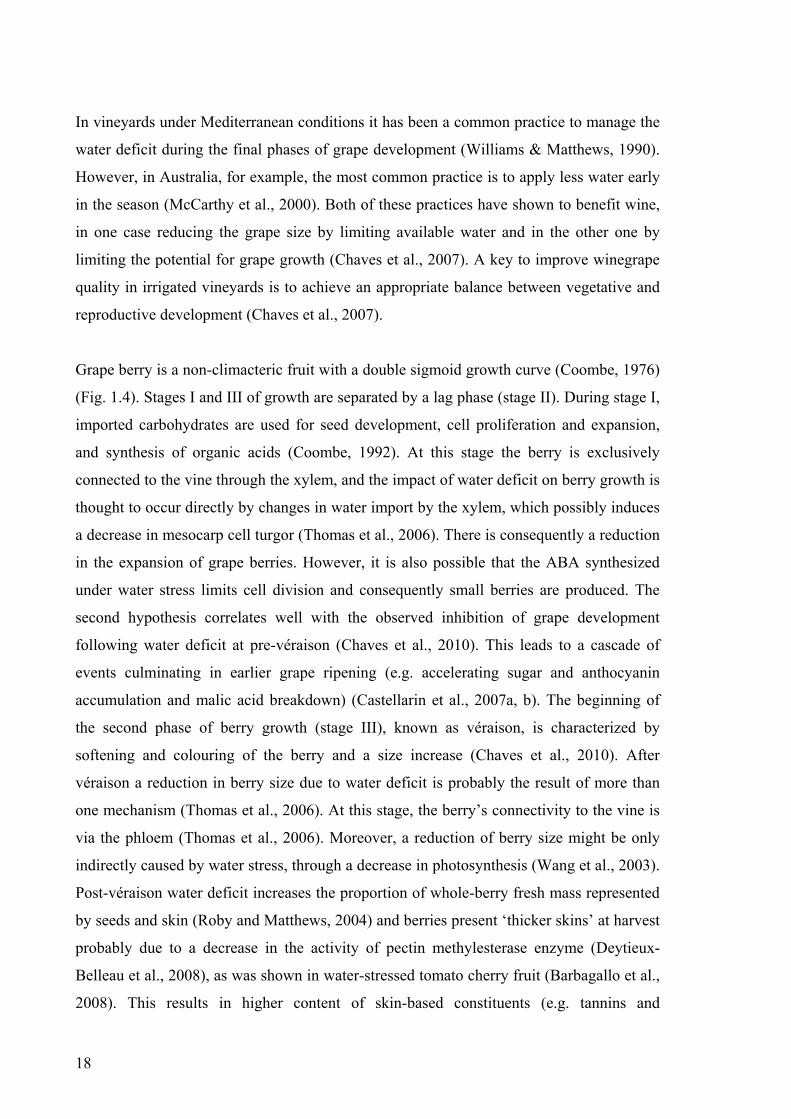
The Multiplex technique is based on chlorophyll fluorescence detection and the Anth
screening effect on the excitation light used for the measurement: the larger the Anth
concentration in the berry skin, the lower the chlorophyll fluorescence signal (Figure 1.6).
This method has been validated in the laboratory by others spectroscopic studies on
winegrape berries (Agati et al. 2007) and whole bunches (Agati et al. 2008) and also, due
to their insensitivity to ambient light, directly in the field.
The comparison of red grape to white grape varieties during a whole season revealed two
fluorescence ratios as potential signatures of grape phenolic maturity (Cerovic et al., 2008).
Form this study, both types of optical sensors are considered useful for viticulture: the
‘‘leaf-clip’’ type Dualex is inherently more precise and can yield quantitative data on
ANTH and FLAV in individual berries and these would be valuable for studies on
environmental effects on grape maturation; the non-contact sensor Multiplex, on the other
hand, has real potential for precision viticulture. Still, for very mature grapes an increase in
green source power would be welcome (Cerovic et al., 2008).
27
Figure 1.6. The Multiplex technique
1.4 AIM OF THE THESIS It is acknowledged that the timing and intensity of the response to soil and atmospheric
water deficits, namely in what concerns stomatal control, depends greatly on genotype
(Chaves et al., 2010). This has profound implications in irrigation management, in
particular the timing and amount of irrigation to optimize source–sink relationships, in
order to achieve optimal fruit quality in each variety (Medrano et al., 2003; Chaves et al.,
2007; Poni et al., 2007). Vitis vinifera L. is characterized by large genetic variability with
several thousand varieties/varieties being cultivated worldwide (Alleweldt et al., 1990;
Galet, 2000; Schultz, 2003). European countries like France, Spain or Portugal host a large
number of native V. vinifera varieties. However, most of those genotypes remain
uncharacterized, which limits their use for breeding, for example to increase WUE or
improve berry quality traits.
In the present research, we report the results of two consecutive seasons trial aimed to
characterize and improve the quality of Aleatico cv. under the Mediterranean climate
condition of South of Tuscany.
As several authors report (Düring et al., 1996, Wample and Smithyman, 2002, Medrano et
al., 2003, Fregoni, 2005), a moderate water deficit can result in higher quality production
which effects may vary depending on different factors, including genotype (Remorini et
28

al., 2010). Considering that, Aleatico vines were subjected to different water regimes in
order to study the physiological mechanisms and berry composition involved in the
response to water stress.
Besides indicators and parameters such as stem water potential, gas exchanges and sap
flow, the evolution of berry anthocyanin content was monitored in time using, in the field,
a new optical portable sensor, Multiplex®2 (Agati et al., 2009) as index of phenolic
maturity.
In order to study at molecular level the expression of specific genes linked to the
anthocyanins pathway and to possibly identify other specific processes and potential
biomarkers useful to monitor water stress conditions in Aleatico berries, a research stage
was carried out at the Dr. Lund’s laboratory - Wine Research Centre of the University of
British Columbia (Vancouver, Canada).
Although Canada is one of the youngest wine-producing regions in the world, the wine
industry has grown rapidly over the most recent 10 years and in addition to producing the
finest ice wines in the world, Canada has recently gained acclaim as a producer of high
quality, award-winning wines, crafted from classic French and German V. vinifera
varietals. Given the high economic value of grape production in numerous countries
worldwide, increasing investments have recently been directed towards better
understanding molecular mechanisms underlying ripening and berry flavour traits for
improvement of the grape industries. In particular The Dr Lund’s research group studies
regulatory and metabolic networks of gene expression during ripening in soft fruits for
viticulture and human health applications. They are currently working to better understand
the interaction of the grapevine genome, the vineyard environment, and viticultural
practices in order to develop molecular-based tools to assist growers in management
decision making in the vineyard each season and they are also using comparative
biochemical genomics to advance the understanding of the antioxidant capacities imparted
by vitamin C and anthocyanin flavonoids with the goal of developing molecular tools for
marker assisted breeding in raspberry and engineering improved anthocyanin
compositional chemistry in wine grapes.
29

30
2. MATERIALS AND METHODS
2.1 PLANT MATERIAL AND TREATMENTS
The experiment was conducted in two consecutive years (2008 and 2009) at the Bulichella
farm, Suvereto (Livorno, Italy; 43°04 N, 10°41 E) on 3-year-old (in 2008) vines of grape
(Vitis vinifera) cv Aleatico grafted on 110R, trained to 2–3 vertical shoots and spaced 0.6 ×
2.0 m. Vines were planted in February 2006 in North-South oriented rows. For both trial
periods, data from a nearby meteorological station were obtained from ARSIA, Tuscany
Regional Agrometeorological Service. Portable data loggers (Tinytag TGU-4500, Gemini,
Chichester, UK) were installed at the level of bunches and near the vineyard to monitor
temperature and relative humidity. Evapotranspiration (ETo) was calculated by using the
Blaney–Criddle’s theoretical method (Brouwer and Heibloem 1986); water requirement
was calculated as WR= ETP*Kc – Rainfall. Two treatments were applied: non-irrigated
(water stress, WS) and irrigated to prevent intense water stress (IR). The WS plants were
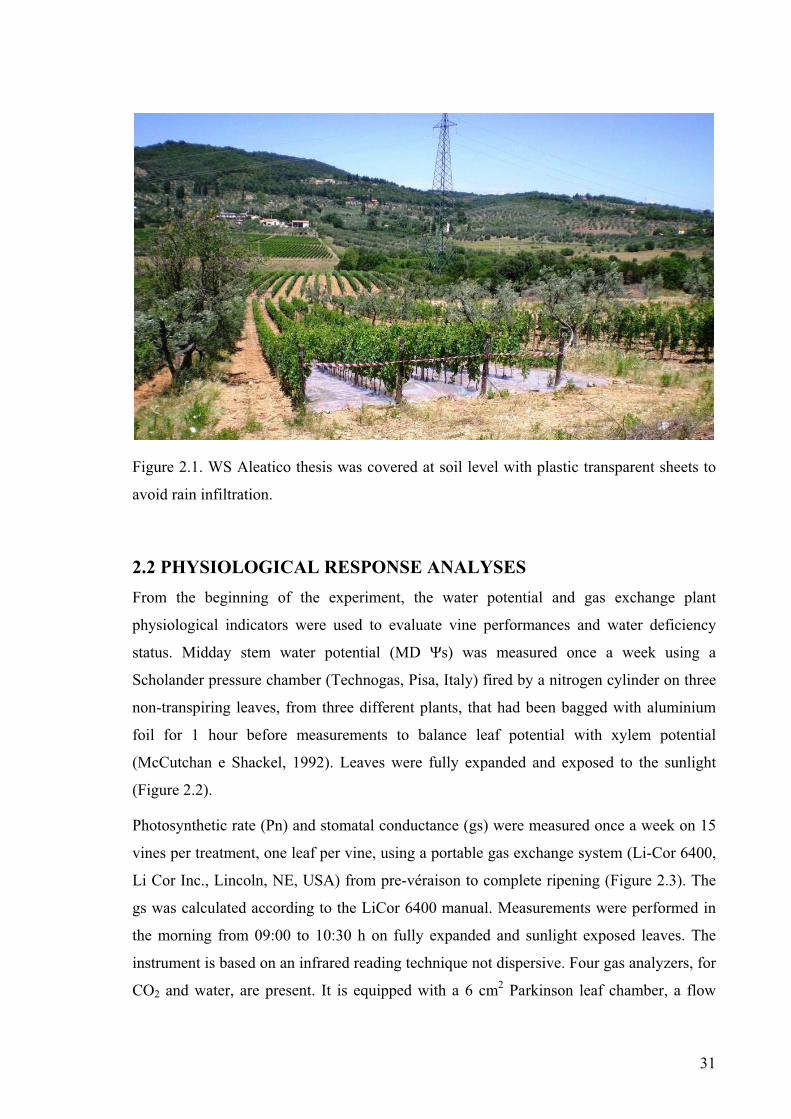
also covered at soil level with plastic transparent sheets to avoid rain infiltration (Figure
2.1). In 2008, the experiment lasted from 17 June (day of the year, DOY,169) to 5
September (DOY 249) when grapes were harvested at a °Brix of 27.0. Veraison occurred
at the beginning of August, as determined by visual assessment of 10% berries colouring
on 31 July (DOY 213). Water on IR plants was supplied on 28 July (DOY 210) and on 1
August (DOY 214) by a drip irrigation system applying 46.9 and 23.4 L water per plant,
respectively. A main rain event (40 mm) occurred on 15 August (DOY 228). In 2009,
vines were trained to horizontal cane. The experiment was carried out from 8 July (DOY
189) to 1 September (DOY 244) when grapes were harvested at a °Brix of 25.8. Veraison
occurred at the end of July (10% of berries colouring on 22, July, DOY 203). Water on IR
plants was supplied on 20 July (DOY 201) and on 15 August (DOY 227) applying 67.5
and 22.5 L of water per plant, respectively. A main rain event (20 mm) occurred on 4
August (DOY 216).
31
Figure 2.1. WS Aleatico thesis was covered at soil level with plastic transparent sheets to
avoid rain infiltration.
2.2 PHYSIOLOGICAL RESPONSE ANALYSES
From the beginning of the experiment, the water potential and gas exchange plant
physiological indicators were used to evaluate vine performances and water deficiency
status. Midday stem water potential (MD s) was measured once a week using a
Scholander pressure chamber (Technogas, Pisa, Italy) fired by a nitrogen cylinder on three
non-transpiring leaves, from three different plants, that had been bagged with aluminium
foil for 1 hour before measurements to balance leaf potential with xylem potential
(McCutchan e Shackel, 1992). Leaves were fully expanded and exposed to the sunlight
(Figure 2.2).
Photosynthetic rate (Pn) and stomatal conductance (gs) were measured once a week on 15
vines per treatment, one leaf per vine, using a portable gas exchange system (Li-Cor 6400,
Li Cor Inc., Lincoln, NE, USA) from pre-véraison to complete ripening (Figure 2.3). The
gs was calculated according to the LiCor 6400 manual. Measurements were performed in
the morning from 09:00 to 10:30 h on fully expanded and sunlight exposed leaves. The
instrument is based on an infrared reading technique not dispersive. Four gas analyzers, for
CO2 and water, are present. It is equipped with a 6 cm2 Parkinson leaf chamber, a flow

32
pump to supply the outside air, a CO2 mixer and an adjustable outside light source. It
works with an open cycle and the system can measure different parameters using several
sensors and the four reading cells. The outside air is filtered and corrected basing on values
previously set by the operator, to provide a constant composition. All measurements were
carried out using a PAR intensity of 1200 µmol m-2
s-1
to light the leaf. The instrument
detects the variations of CO2 concentration and water vapour that occur in the leaf chamber
per time unit, because of the photosynthetic activity of CO2 fixation and the gas emission
by transpiration.
In 2008, cumulated sap flow (SF) was measured using the heat balance system (Steinberg
et al., 1990). Sap flow sensors (Dinamax Inc., Houston, Texas) were applied on two
selected plants per treatment and connected to a data logger Campbell CR7 (Campbell
Scientific Inc., Logan, Utah). The measurements were taken at 15s intervals, their average
stored every 30 min by Dynamax software DGSF5.0 and at the end they were converted
according to the plant leaf area. The energy was constantly provided by solar panels
located close to the sensors so data was collected from the beginning to the end of the
experiment. The sensors were installed at mid-day (maximum reduction of diameter
dimension), the cortex was reduced and a G4 silicon product was applied between vegetal
tissues and sensors, to assure a good sensors adherence to the trunks. Sensors were
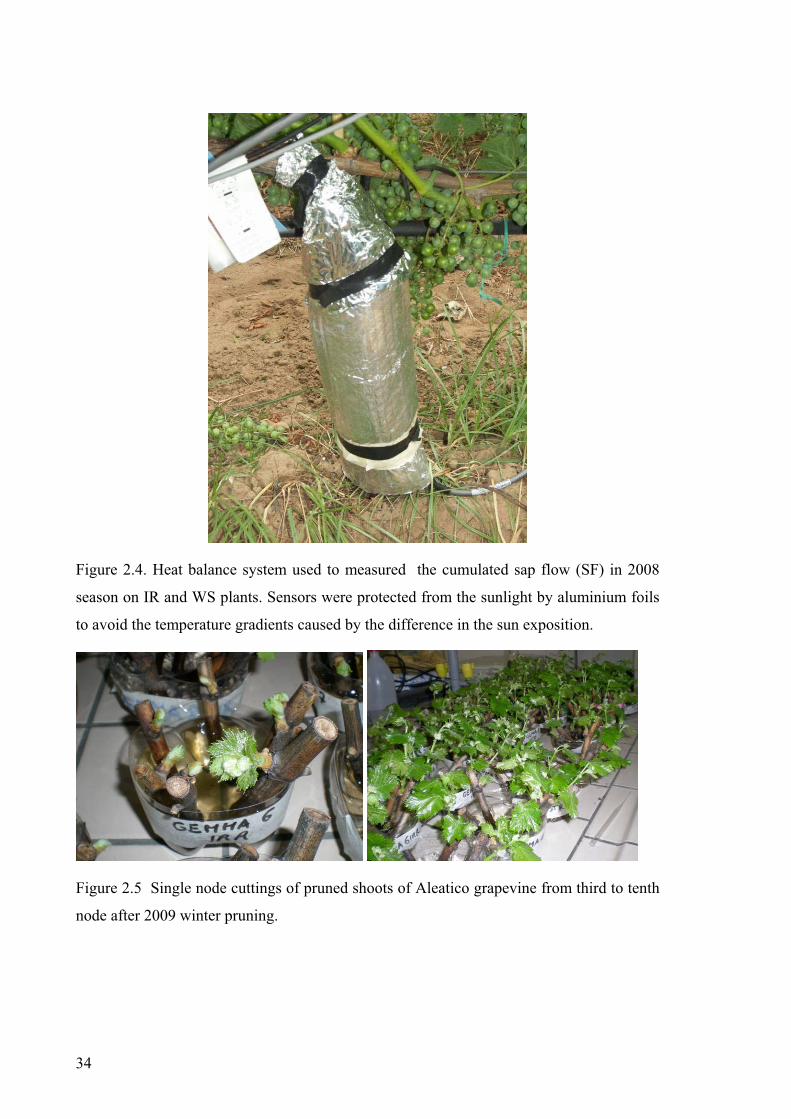
protected from the sunlight by aluminium foils to avoid the temperature gradients caused
by the difference in the sun exposition (Figure 2.4).
On 2009 and 2010 season the bud fertility was determined to evaluate the possible effect of
the different water regimes on flower differentiation. Pruning canes were weighed in
winter on 36 plants for each treatment to determine shoot vigour.
In addition, after 2009 winter pruning, 13 canes per treatment were cut in single node from
third to tenth node. Single cuttings were maintained in laboratory to induce budbreak,
clusters were then counted to determine bud fertility along the cane (Figure 2.5).

33
Figure 2.2. Scholander pressure chamber used to measure the midday stem water potential
(MD s) of IR and WS plants.
Figure 2.3. Portable gas exchange system used to measure the photosynthetic rate (Pn) and
stomatal conductance (gs) of IR and WS.
34
Figure 2.4. Heat balance system used to measured the cumulated sap flow (SF) in 2008
season on IR and WS plants. Sensors were protected from the sunlight by aluminium foils
to avoid the temperature gradients caused by the difference in the sun exposition.
Figure 2.5 Single node cuttings of pruned shoots of Aleatico grapevine from third to tenth
node after 2009 winter pruning.
35
2.3 THE FLUORIMETRIC SENSOR
To measure phenolic maturity, 60 (in 2008) and 50 (in 2009) different bunches distributed
on four adjacent rows were marked and measured by the fluorimetric sensor (Figure 2.6)
once a week from veraison to harvest, directly on the vines. The Multiplex 2 (Mx;
FORCE-A, Orsay, France) was a handheld battery-operated optical sensor consisting of
four excitation light-emitting diode (LED) sources in the UV-A (370 nm), blue (460 nm),
green (516 nm) and red (637 nm) and three detection channels in the blue-green, red and
far-red spectral regions. These two last detection bands at 680–690 nm (red fluorescence,
RF) and 730–780 nm (far-red fluorescence, FRF), respectively, corresponded to the two
emission peaks of chlorophyll (Cerovic et al. 1999). Being the LED sources pulsed and
synchronized to detection, the sensor was insensitive to ambient light and could be used
directly in the vineyard. The large detection area of the sensor (8-cm diameter) permitted
to the signal to be acquired from a large area of each cluster. Acquisition time for a single
bunch sample was 1s. The collected data were visible on a real-time display and stored on
a secure digital card for further analysis. Different combinations of the red (RF) and far-red
(FRF) fluorescence signals at the various excitation bands could be used as indices of
different compounds, such as flavonols (Flav), anthocyanins (Anth), and chlorophyll (Chl).
Considering the fluorescence signals RFR and FRFR, excited with red (R) light, and FRFG
and FRFUV, excited with green (G) and ultraviolet (UV) radiation, respectively, we can
define two ANTH indices:
ANTHRG = log(FRFR / FRFG ) (1)
and
ANTHR = log(5000 / FRFR), (2)
the Flav index:
FLAV = log(FRFR / FRFUV), (3)
and the Chl index:
CHL = FRFR / RFR. (4)
The choice of these equations is based on previous spectroscopic studies (Cerovic et al.
2002, Agati et al. 2007) and on the optical properties of Chl and Flav. Briefly, the intensity
of Chl fluorescence depends on the excitation light reaching the Chl layer inside the

36
berries. It is therefore reduced by Anth localized into the outer skin layers, which absorb
part of the excitation light. The higher the Anth concentration, the lower the Chl
fluorescence signal. The attenuation is also depending on the excitation wavelength,
according to its overlapping with the absorption spectrum of Anth, and therefore it will be
higher at the peak (at around 520 nm) than in the tail in the red of the Anth absorption
band. The definition of the ANTH index given in Eqn 1, by comparing the Chl
fluorescence intensity under G and R lights, represents a differential absorption
measurement (in accordance with the Beer–Lambert’s law) that is proportional to the Anth
content. The same above consideration applies in the case of Flav, with G light replaced by
UV radiation, in order to explain the origin of the FLAV index defined by Eqn 3. The use
of the single FRFR signal under R light in Eqn 2 relies on a sufficiently significant
absorption of Anth at 637 nm. The 5000 value in Eqn 2 represented the full-scale value in
mV of photodiodes. The ANTHRG and FLAV indices were corrected for differences in the
R versus G and R versus UV LED light intensities, respectively, using a fluorescence
standard film (FORCE-A) with known absorption properties. The CHL index (Eqn 4) is
based on the partial reabsorption of RF, depending on the Chl concentration (Buschmann
2007), and on the absence of reabsorption on the FRF band. Consequently, the CHL index
increases with the increase of Chl concentration.
Figure 2.6 The fluorimetric sensor Multiplex 2 used to measure phenolic maturity of grape
bunches directly in field.

37
2.4 BERRY SAMPLING AND DESTRUCTIVE MEASUREMENTS
In order to calibrate the Mx sensor for the Anth and Flav content, for each date during the
2008 season, three different bunches per treatment were randomly sampled. Fourteen
berries from the exposed side of each bunch were collected, measured by the Mx, weighed
and frozen for subsequent extraction and high-performance liquid chromatography (HPLC)
quantification of phenolic compounds. The skin from the upper half (flower scar face) of
14 berries was peeled off and ground under liquid nitrogen. The resulting skin powder was
transferred to 3 mL of acidified extraction solvent (70% EtOH, 25% H2O, 5% formic acid),
maintained under stirring in the dark for 1 h and then centrifuged for 3 min at 4100 × g.
The pellet was re-extracted twice using the same procedure, and the final three pooled
supernatants were adjusted precisely to 10 mL. The whole procedure was performed at
room temperature (20–25°C). Extracted samples were stored at -20°C until HPLC analysis.
For both seasons, a set of 200 berries was randomly collected weekly from the beginning
of veraison to harvest and processed for phenolic compounds extraction within the same
day. For each sampling, 60 berries were randomly chosen, divided into three groups of 20
berries, which were used as triplicates, and processed according to the method of Di
Stefano et al. (2008) slightly modified as follows. Berry skins of each replicate were
manually separated from pulp and seeds, and skins and seed were separately weighed and
extracted for 4 h at 25°C in 25 mL of a pH 3.2 tartaric buffer solution. This solution
contained 12% (v/v) ethanol, 2 g/L sodium metabisulphite, 5 g/L tartaric acid and 22 mL/L
NaOH 1 N. After grounding in a mortar and pestle, the extract was separated by
centrifugation for 10 min at 3000 rpm. The pellet was re-suspended in 20 mL of buffer and
centrifuged for 5 min. The final two pooled supernatants were adjusted precisely to 50 mL
with the buffer solution. The skins extract was measured spectrophotometrically at 540 nm
after dilution (1:20) with ethanol : water : HCl (70:30:1) and at 750 nm as the seeds extract
in the following solution: 0.1 mL of the extract, 6 mL H2O, 1 mL Folin-Ciocalteu reactive,
4 mL 10% Sodium Carbonate (after 5 min) and H2O up to 20 mL. Anth were expressed as
mg of equivalents of malvidin 3-O-glucoside and phenolic compounds as mg of
equivalents of (+)-catechin. Remaining berries (140) were used to determine the
concentration of total soluble solids (°Brix) by a digital refractometer (Model 53011, TR,
Forlì, Italy), the pH by a bench pH-meter (Hanna Instruments, Milano, Italy) and total
acidity by titration with NaOH 0.1 N.

38
2.5 HPLC/DAD ANALYSIS
In 2008, HPLC/DAD analyses were performed on a HP 1100L liquid chromatograph
equipped with a Diode Array Detector (DAD) detector and managed by an HP
Chemstation software (Agilent Technologies, Palo Alto, CA, USA). Hydroxycinnamic
acids and flavonoids were separated using a 4.6 × 250 mm Polaris E RP18 (5 µm) column
(Varian, Darmstadt, Germany) operating at 27 ± 0.5°C. The eluent was H2O (adjusted to
pH 3.2 by HCOOH)/CH3CN. A four-step linear gradient solvent system was used, starting
from 100% H2O to 100% CH3CN during a 53-min period, at the flow rate of 0.8 mL/min
as previously reported (Saracini et al. 2005). Anth were separated using a RP-80 C12
column (Phenomenex Synergi Max), 150 × 3 mm, 4 µ (Phenomenex, Torrance, CA, USA)
operating at 27 ± 0.5°C. The eluent was H2O (adjusted to pH 2.0 by HCOOH/CH3CN). A
four-step linear gradient solvent system, at the flow rate of 0.4 mL/min for 28 min, was
used (Mulinacci et al. 2008).
2.6 HPLC/MS ANALYSIS
In 2008, HPLC/Mass Spectrometry (MS) analyses were performed using the same
analytical conditions of HPLC/DAD analysis. In detail, the HPLC/DAD was interfaced
with a HP 1100 MSD API electrospray (Agilent Technologies) operating in negative and
positive ionization mode under the following conditions: nitrogen gas temperature 350°C,
nitrogen flow rate 10 L/min, nebuliser pressure 30 psi, quadrupole temperature 30°C,
capillary voltage 3500 V. The mass spectrometer operated at 120 eV of negative
fragmentor for flavonoid and caffeic derivatives, and at 120 eV positive fragmentor for
Anth.
2.7 QUANTITATIVE ANALYSES
In 2008, the identification of individual phenolics was carried out by means of HPLC
retention times, and both UV/Vis and MS spectra. Quantification of the single phenolic
compounds was directly performed by HPLC/DAD using a five-point regression curve
built with the available standards. Curves with a coefficient of determination r2 > 0.998
were considered. In particular, hydroxycinnamic acids amounts were calculated at 330 nm
using caffeic acid as reference. Quercetin and kaempferol glycosides were calibrated at
39
350 nm using quercetin 3-O-rutinoside and kaempferol 3-O-rutinoside, respectively.
Finally, Anth glycosides were calibrated at 520 nm using malvidin 3-O-glucoside (oenin)
as reference. The molecular weight correction has been applied, if necessary. Compound
concentrations were expressed as mg/g of skin fresh weight or as µg per cm2 of berry
surface.
In 2009, the Anth extracts, obtained by Di Stefano et al. (2008) method, were also used to
identify the skins Anth profile by HPLC quantification after purification of the extracts on
a 300 mg C18 cartridge. A syringe connected with the 300 mg C18 cartridge was activated
by using 2 mL of methanol and 2 ml of H2SO4 0,01 N. Afterwards 2 mL of H2SO4 0,1 N
and 0,5 mL of the Anth extracts were charged in the syringe. Samples were eluted on the
cartridge, washed with 2 mL of H2SO4 0,01 N and the Anth were eluted with 2 mL of
methanol, collecting the liquid phase in a 50 mL distillation ball, starting from the first
coloured drop. The solvent was vacuum evaporated, recovered by 1 mL methanol-formic
acid- water solution (50:10:40), filtered on a 0.2 µ membrane and injected in the following
conditions:
chromatograph Agilent 1100,
pre-column ODS Hypersil 20 x 2,1 C18 (5 µm),
column ODS Hypersil 200 x 2,1 mm (5 µm),
solvent A: formic acid 10% in water,
solvent B: formic acid 10%, methanol 50% in water,
flow: 0,225 mL,
wavelenght: 520 nm,
injected volume: 20 µl,
linear gradient from 65% of A to 45% of A in 25 minutes,
from 45% of A to 40% of A in 20 minutes,
from 40% of A to 5% of A in 25 minutes,
from 5% of A to 1% of A in 5 minutes,
from 1% of A to 65 % of A in 3 minutes,
time of balance: 5 minutes.
The picks area and the percentage of every Anth in the extracts were determined by
integration of the chromatogram. Compounds concentration was expressed as mg/g of

40
skin fresh weight, by using as reference (100%) the total Anth skins content (mg/g)
obtained by Di Stefano et al. (2008) method.
2.8 GENE EXPRESSION ANALYSES
For each sampling date during the 2009 season, 20 homogeneous berries randomly
detached from the exposed side of three different bunches per thesis were collected, frozen
in liquid nitrogen and stored at -80°C.
Total RNA was extracted from berry pericarp using Spectrum Plant Total Rna Kit (Sigma-
Aldrich) and double-strand cDNA was synthesized using Quantitec®
reverse transcription
kit (Quiagen) starting from 2 µg of RNA and finally quantified at the Dr. Lund's laboratory
-Wine Research Center (Vancouver, Canada) by spectrophotometer NanoDrop (Thermo
Scientific).
Preliminary qRT-PCR was performed at the Wine Research Centre of the University of
British Columbia (Vancouver, CA) with a 7500 System Software V2.0.1 (Applied
Biosystems) by using Dynamo HS SYBR Green qPCR kit (New England Biolabs). Each
reaction (20 µl) contained 2 µl [5µM] of each primer, 4 µl of diluted cDNA (20 µg/mL), 10
µl of Master mix [2x], 0.25 µl of ROX ref [50x], 1.25 µl RNAse free water. Thermal
cycling conditions were 50 °C for 2 min and 95 °C for 10 min followed by 95 °C for 15 s
and 60 °C for 1 min for 40 cycles, followed by a melting curve stage of 95°C for 15 s,
60°C for 1 min, 95°C for 30 s and 60 °C for 15 s. Each cDNA sample was analysed at a
dilution of 1:100 of the original cDNA and run in triplicate. Gene transcripts were
quantified upon normalization to Ubiquitin E (UbqE), by comparing the cycle threshold
(Ct) of the target gene with that of UbqE. Ubiquitin E was chosen because it showed the
smallest standard deviation in the expression of WS biological replicates from different
sampling dates compared with other eight putative reference genes: poliubiquitin (Ubq-
10), elongation factor 1 (EF1), Tubulin alpha (Tub-alpha), ubiquitin L40 (L40), malate
dehydrogenase (MDH), Sand, Actin, glucose-6-phosphate dehydrogenase (Gapdh) (Tab.
2.1). Gene expression was determined on one biological replicate for 3 sampling dates of
2009 season in order to analyse, in a preliminary way, a large number of genes putatively
sensitive to water stress and/or linked to processes related to berry quality. Based on these
preliminary results a further set of gene expression analyses (qRT-PCR) have been
performed at the Life Science Institute Transcriptomic Lab of the Scuola Superiore

41
Sant'Anna (Pisa, italy) adding new key-genes of the flavonoid pathway and using a 7300
System Software (Applied Biosystems) and the iTAQ SYBR Supermix w/ROX (Bio Rad
srl) at the same thermal cycling conditions. Each reaction (15 µl) contained 1.5 µl [5µM] of
each primer, 6 µl of cDNA (5 µg/mL), 7.5 µl of Master mix. Each cDNA sample was run
in duplicate. Gene transcripts were quantified upon normalization to Ubiquitin E (UbqE)
and Ubiquitin-conjugating factor (UbqCF) by using GeNorm VBA applet for Microsoft
Excel. Gene expression was determined on 3 biological replicates for each sampling date
(with the exception for IR first sampling date that, for technical problems, was analyzed in
duplicate) and the cDNAs was obtained after re-extraction of RNA from the same samples
stored at -80°C. Quantity and quality of RNA of all Aleatico samples was assessed by
using the Automated Electrophoresis Station (Biorad ExperionTM
). The results showed
values between 8.2 and 9.5 of RQI scale indicating a good quality for all samples (Table
2.2) as confirmed by the virtual gel (Figure 2.7).
Primers pairs for UbqCF were retrieved from literature (Castellarin et al., 2007b), UbqE,
NCED1, NCED2, Zeaxanthin epoxidase, MXK3, DREB, Dehydrin 1a, Pyrroline
reductase, Proline from the Dr. Lund's laboratory, FAOMT (Lucker et al., 2010), F3’H,
F3’5’H (Gutha et al., 2010), AOMT (Hugueney et al., 2009), UFGT, FLS1, MSA, PIP2;1,
DWF1 were newly designed on the original DNA sequences to amplify ~100 bp gene
fragments by using the software Primer Express (Applied Biosystems) (Tab. 2.3).
Reference Gene Code Ct mean Standard deviation
Ubiquitin E UbqE 25.45 0.893
Poliubiquitin Ubq 10 25.42 1.726
elongation factor 1 alpha EF1 28.93 1.385
Tubulin alpha Tub alpha 29.37 2.150
Ubiquitin L40 L40 26.57 1.516
malate dehydrogenase MDH 26.92 0.948
Sand Sand 29.03 1.584
Actin Actin 24.14 1.275
glucose 6 phosphate dehydrogenase Gapdh 27.18 1.016
Table 2.1 Comparison between eight putative reference genes: each Ct value is the mean of
Ct of WS biological replicates from different sampling dates. Ubiquitin E resulted to be the
most stable reference gene because it showed the smallest standard deviation

42
Sample Number Sample name Ratio [28S:18S] RQI RQI Classification
L Ladder
1 IR 1 1 1.52 8.6
2 IR 1 2 1.79 9.2
3 WS 1 1 1.69 9.5
4 WS 1 2 1.51 8.8
5 WS 1 3 1.54 9.2
6 IR 2 1 1.47 8.3
7 IR 2 2 1.55 9.0
8 IR 2 3 1.72 9.0
9 WS 2 1 1.68 9.2
10 WS 2 2 1.62 9.1
11 WS 2 3 1.31 8.2
12 IR 3 1 1.55 8.9
13 IR 3 2 1.47 8.9
14 IR 3 3 1.45 8.7
15 WS 3 1 1.50 8.6
16 WS 3 2 1.55 8.9
17 WS 3 3 1.54 8.7
18 IR 4 1 1.58 8.6
19 IR 4 2 1.54 8.7
20 IR 4 3 1.55 8.6
21 WS 4 1 1.38 8.5
22 WS 4 2 1.38 8.5
23 WS 4 3 1.42 8.6
24 IR 5 1 1.46 8.7
25 IR 5 2 1.56 8.3
26 IR 5 3 1.51 8.7
27 WS 5 1 1.49 8.4
28 WS 5 2 1.56 8.5
29 WS 5 3 1.67 9.0
Table 2.2 . RNAs quality of 2009 Aleatico samples measured by RQI scale: the RNA
quality indicator (RQI) automatically assigns a numerical quality rating for eukaryotic total
RNA samples to quickly judge the integrity of the total RNA sample (Experion Software,
Bio Rad srl). A specialised algorithm compares three regions of an electrophoretic profile
of RNA samples to a series of standardised degraded RNA samples. The RQI method
returns a number between 10 (intact RNA) and one (highly degraded RNA) for each
eukaryotic RNA sample run on an Experion RNA Stdsens or Highsens analysis chip. It
gives a consistent evaluation of RNA quality and is a convenient quantifier in determining
the extent of degradation of RNA samples.
1 RQI 4; 4<RQI 7; 7<RQI 101 RQI 4; 4<RQI 7; 7<RQI 10

43
Figure 2.7. Virtual gel of 2009 Aleatico RNAs samples (Experion Software for automated
electrophoresis, Bio Rad srl)

44
Table 2.3. List of all primer sequences used in qRT-PCR
2.9 STATISTICAL ANALYSIS
Statistical analysis was carried out with SigmaPlot for Windows Version 11.0 (Systat
Software, Inc., Erkrath, Germany) and statistical differences between treatments were
analysed by one-way analysis of variance (ANOVA). Results are reported as means ±
standard deviation (SD) or means ± standard error (SE).

45
3. RESULTS
3.1 PHENOLIC COMPOUND CHARACTERIZATION OF ALEATICO
BERRIES
The main anthocyanosides detected in Aleatico berry skin were the 3-O-glucosides
followed by the 3-O-p-cumaroylglucosides and 3-O-acetylglucosides; malvidin caffeate is
present in low amounts. Among the 3-O-p-cumaroylglucosides the most abundant were
malvidin and peonidin and, among the 3-O-acetylglucosides, malvidin is the predominant;
peonidin, petunidin, delphinidin and cyanidin 3-O-acetylglucosides, and petunidin,
delphinidin and cyanidin 3-O-p-cumaroylglucosides were also presents but in lower
amounts (Table 3.1). Malvidin is the main Anth in Aleatico berries either as 3-O-glucoside,
3-O-acetylglucoside and 3-O-p-cumaroylglucoside.
Among Flavonols (Flav), quercetin and kaempferol glycosides were detected, with
quercetin 3-O-glucuronide, quercetin 3-O-rutinoside, quercetin 3-O-glucoside as the main
compounds. Kaempferol 3-O-glucuronide, kaempferol 3-O-rutinoside, and kaempferol 3-
O-glucoside were present as minor compounds. Among hydroxycinnamic acids (HCA),
caffeoyl-tartaric acid and p-cumaroyl tartaric acid were identified (data not shown).
Total amounts of the three classes of phenolic compounds, HCA, Flav, and Anth, were
calculated as the sum of concentrations expressed as mg/g of skin FW of the compounds
identified for each class. The time course of HCA, Flav and Anth concentration (mg/g of
skin FW) throughout berry development is shown in Figure 3.1A. Anth started to increase
at DOY 213 (onset of veraison). Flav increased over the two first sampling dates and then
remained somewhat constant. If expressed in terms of content per berry (Figure 3.1B), Flav
followed a two-step increase separated by a lag phase; in fact, they increased up to the
onset of veraison and then increased again towards the end of the developmental cycle.
The rise in Anth biosynthesis appeared to be shifted in time with respect to Flav and the
concentration of HCA remained almost unchanged during the investigated period.

46
Compound mean ±sd mean ±sd mean ±sd mean ±sd mean ±sd
Delfinidin 3 O gluc. 5.05 ± 0.1 5.33 ± 0.2 6.21 ± 0.2 5.11 ± 0.4 5.38 ± 0.2
Cyanidin 3 O gluc. 3.83 ± 0.2 2.02 ± 0.3 1.53 ± 0.3 1.41 ± 0.4 2.88 ± 0.7
Petunidin 3 O gluc. 5.67 ± 0.2 6.99 ± 1.3 6.83 ± 0.7 5.64 ± 0.4 7.13 ± 1.7
Peonidin 3 O gluc. 23.39 ± 1.4 12.86 ± 1.5 10.70 ± 0.0 10.09 ± 0.2 14.06 ± 1.4
Malvidin 3 O gluc. 39.25 ± 0.2 49.78 ± 3.5 48.32 ± 0.4 54.98 ± 2.3 52.34 ± 2.1
Anth 3 O glucosides 77.19 ± 0.2 76.97 ± 0.2 73.60 ± 0.3 77.22 ± 0.1 81.79 ± 0.1
Delfinidin 3 O p cum. 1.07 ± 0.2 1.21 ± 0.0 1.34 ± 0.1 1.09 ± 0.0 1.00 ± 0.0
Cyanidin 3 O p cum. 0.43 ± 0.2 0.38 ± 0.2 0.27 ± 0.1 0.25 ± 0.1 0.25 ± 0.1
Petunidin 3 O p cum. 0.81 ± 0.3 0.88 ± 0.5 0.88 ± 0.1 1.02 ± 0.1 0.61 ± 0.1
Peonidin 3 O p cum. 4.09 ± 0.9 2.15 ± 0.6 2.00 ± 0.3 2.18 ± 0.6 1.72 ± 1.2
Malvidin 3 O p cum. 6.99 ± 0.1 8.80 ± 0.1 9.79 ± 0.2 13.23 ± 0.4 9.27 ± 0.2
Anth 3 O p cumaroylglucosides 13.40 ± 0.2 13.43 ± 0.3 14.28 ± 0.3 17.78 ± 0.0 12.85 ± 0.1
Delfinidin 3 O acetylgluc. 0.51 ± 0.2 0.50 ± 0.2 1.16 ± 0.1 0.24 ± 0.0 0.30 ± 0.1
Cyanidin 3 O acetylgluc. 0.18 ± 0.1 0.28 ± 0.2 0.09 ± 0.1 0.00 ± 0.1 0.00 ± 0.1
Petunidin 3 O acetylgluc. 0.62 ± 0.4 0.61 ± 0.5 1.06 ± 0.3 0.29 ± 0.3 0.28 ± 0.5
Peonidin 3 O acetylgluc. 2.56 ± 0.6 1.50 ± 0.9 1.23 ± 0.8 0.65 ± 1.6 0.79 ± 1.9
Malvidin 3 O acetylgluc. 4.85 ± 0.0 5.73 ± 0.0 7.96 ± 0.0 3.37 ± 0.0 3.65 ± 0.0
Anth 3 O acetylglucosides 8.72 ± 1.5 8.63 ± 3.3 11.50 ± 0.8 4.55 ± 2.9 5.02 ± 3.3
Malvidin caffeate 0.68 ± 1.7 0.97 ± 1.3 0.61 ± 0.7 0.44 ± 0.8 0.33 ± 1.3
tot.% 99.99 ± 0.5 100.00 ± 1.6 99.99 ± 1.2 99.99 ± 2.4 100.00 ± 2.2
05 Sept/DOY 24906 Aug/DOY 219 12 Aug/DOY 225 20 Aug/DOY 233 27 Aug/DOY 240
Tab 3.1 Anth profile in Aleatico grapevine during 2008 season. Values are the mean (± sd)
of three replicates for each date and expressed as percentage of total Anth content; values
in bold mean higher incidence of the specific category; ±sd = standard deviation, DOY =
day of the year.

47
Figure 3.1. Time course of the hydroxycinnamic acid (HCA), flavonols (Flav) and
anthocyanins (Anth) content determined by HPLC/ DAD analysis in Aleatico berry skin
extracts (2008 trial). The arrow indicates the beginning of veraison (10% of berries
colouring). Values are the mean (± SD) of three bunch samples (14 half-berries per bunch)
for each date and expressed as mg/g of skin fresh weight (A) or as mg per single berry (B).
DOY = day of the year.
3.2 MULTIPLEX INDEX CALIBRATION
When comparing the non-destructive ANTH indices with the related Anth contents from
the destructive 2008 HPLC analysis, the best correlation was obtained between the
compound concentration expressed on a surface basis and the ANTHRG index (Figure
3.2A). Here, only samples from complete veraison to harvest were considered. The

48
ANTHRG index was inversely correlated with the Anth surface concentration. The best
fitting of data was obtained with an exponential function:
ANTHRG = 0.27+1.253·exp(-Anth/97.94) (5)
giving a coefficient of determination, r2, of 0.875 (Figure 3.2A). Yet, a linear regression
(ANTHRG = 1.114–0.00371·Anth) can be appropriate as well (r2 = 0.856). In Figure 3.2B,
the concentrations of Flav expressed as µg per cm2 of berry surface are compared with the
Multiplex non-destructive FLAV index. In this case, the FLAV index was completely
uncorrelated to the Flav berry skin content. Our analysis show that while the ANTHRG
index can be used to predict the Anth content in grape skin, the FLAV index cannot be
considered a good proxy of Flav content, as explained below.

49
Figure 3.2. Relationship between the ANTHRG (A) and FLAV (B) indices measured in lab
by the Multiplex sensor and the surface-based concentration in berry skin of Anth and
Flav, respectively, as determined by HPLC.
3.3 COMPARISON OF 2008 AND 2009 SEASONS
The climatic parameters of the 2008 and 2009 seasons in the area where the experiments
were carried out were recorded. The global irradiance was higher (25% as average) in 2009
in comparison with 2008. Relative humidity was similar for the two seasons, ranging
between 40 and 80%. The air temperature frequently exceeded 26°C in 2008 (Figure
50
3.3A), while in 2009, this occurred and was concentrated mainly during the second part of
the season (Figure 3.3.B). ETo and precipitation for the two experimental periods were
comparable, with an average of 125 mm of rain during the pre-veraison phase of both
seasons (Figure 3.4). Relative humidity and air temperature recorded by the Tinytag
datalogger (located in the vineyard) did not markedly differ from those collected by the
meteorological station (data not shown).
The vapour pressure deficit calculated in both years revealed higher values on 2009
compared to 2008 in the earlier months of the season and during ripening, which
occurred in August and early September (Figure 3.5 A). The water requirement on 2009,
was higher during the initial months of the season, and during the second and third
decades of August which was the main period of ripening, if compared to the same period
of 2008 (Figure 3.5 B).
The climatic conditions and water supply affected the midday stem water potential (Figure
3.6A), and the gas exchange parameters (Figure 3.6B and C) that reached lower values in
2009 than in 2008, comparing the irrigated vines. In particular, the 2008 photosynthetic
activity (Figure 3.6B) and conductance of leaves (Figure 3.6C) increased during veraison
and maintained higher values than those detected in 2009 (IR treatment). During 2009,
both parameters were decreasing, apart from the partial recovery due to the water supply
on DOY 227. These data indicate that the control vines experienced more pronounced
stress conditions in 2009 than in the 2008 season.
This may be the reason for the differences in berry development and Anth concentration
observed at harvest between the two seasons (Table 3.1). The Anth concentration in 2009
expressed as mg/kg of berries were 8% higher than that of 2008. The difference reached
26% when Anth were expressed as mg/g of skin, because of the marked difference in skin
fresh weight. The time course of technological maturity, as indicated by the maturity index
(°Brix • pH; Van Rooyen et al. 1984) reported in Figure 3.6A, as well as the evolution of
berry fresh weight (Figure 3.7B) and the onset of veraison clearly indicated that a delayed
berry ripening process occurred in 2008.
Such evidence was confirmed by the results of the non-destructive in-field measurements
using the Mx optical sensor. The time course of the Anth indices derived by the Mx
measurements in situ showed that, in both seasons, the ANTHR index increased
exponentially starting from veraison (Figure 3.8A). On the other hand, the ANTHRG
showed a biphasic behaviour, increasing during the initial accumulation of Anth, reaching

51
a peak at full veraison (100% of berries colouring) and decreasing thereafter until harvest
(Figure 3.8B). The FLAV index decreased with time from veraison to harvest (Figure
3.8C), while the CHL index was linearly decreasing over the whole ripening period (Figure
3.8D). By comparing the time course of the 2008 and 2009 Mx indices, it is evident that
berry ripening resulted anticipated in 2009, in agreement with phenological data (onset of
veraison) and harvesting dates for the two seasons. The higher values in ANTHRG recorded
at harvest for 2008 with respect to 2009 suggested that, in the latter season, a more
pronounced accumulation of these pigments occurred. This was confirmed by the
destructive analysis of berry samples as shown in Table 3.2.
Figure 3.3 Climatic parameters for the 2008 (A) and 2009 (B) seasons. Data were obtained
from the Tuscany Regional Agro-meteorological Service.
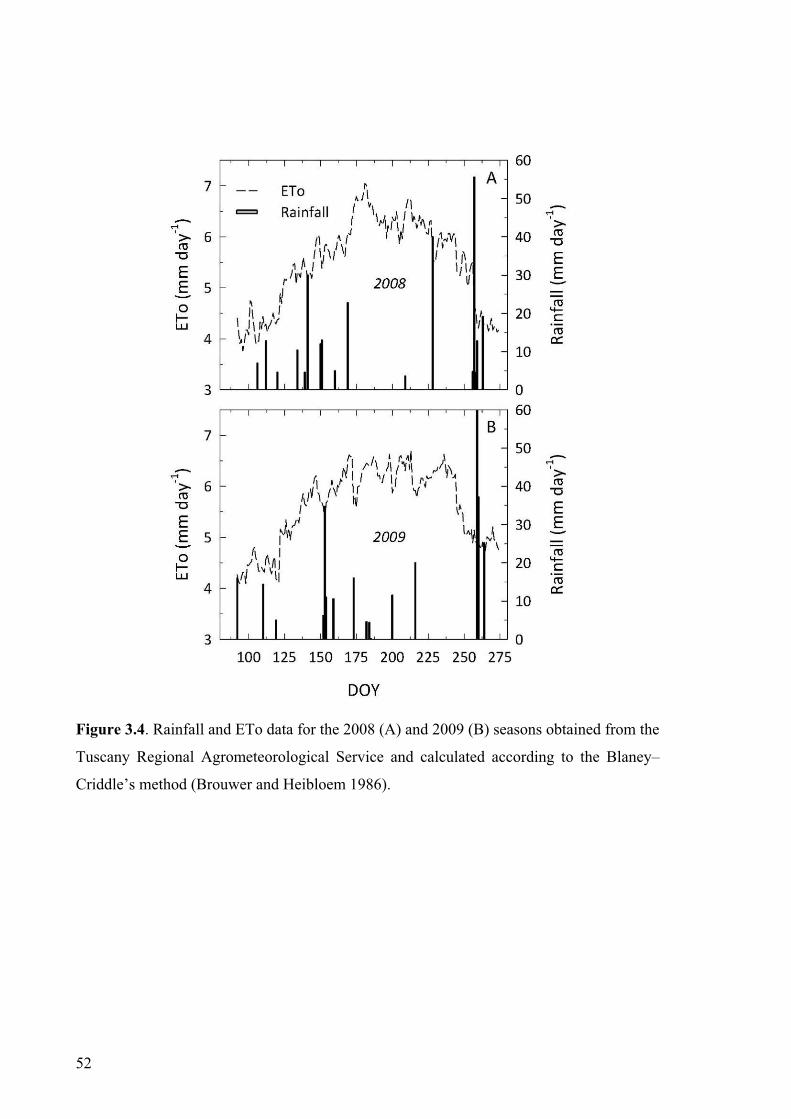
52
Figure 3.4. Rainfall and ETo data for the 2008 (A) and 2009 (B) seasons obtained from the
Tuscany Regional Agrometeorological Service and calculated according to the Blaney–
Criddle’s method (Brouwer and Heibloem 1986).
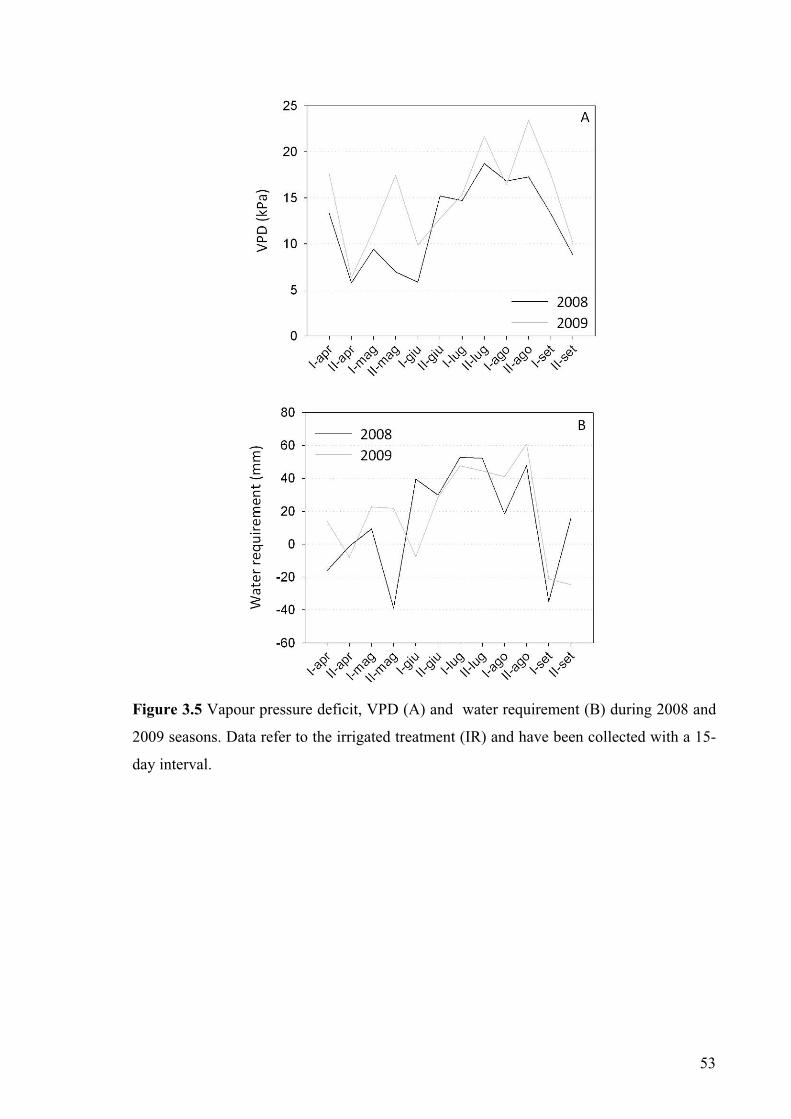
53
Figure 3.5 Vapour pressure deficit, VPD (A) and water requirement (B) during 2008 and
2009 seasons. Data refer to the irrigated treatment (IR) and have been collected with a 15-
day interval.

54
Figure 3.6 Changes in midday stem water potential (A), photosynthetic rate (B) and
stomatal conductance (C) of Aleatico plants during the 2008 and 2009 seasons. Data refer
to the irrigated vine (IR) treatment. Arrows in (A) show the onset of veraison. Water
potential values are the average of three replicates. Gas exchange data are the average of
15 leaf samples measured between 9:00 and 10:30 a.m. Error bars represent the standard
deviations.

55
Table 3.2 Aleatico whole berry and berry skin weights, and anthocyanin (Anth)
concentration (referred to berry FW and skin FW) at harvest for the 2008 and 2009 seasons
for irrigated vines (IR) treatment. Values with different letters are significantly different at
P < 0.05. Data are the average (±SD) of three replicates. Anth are expressed as weight of
malvidin 3-O-glucoside equivalents.
Figure 3.7 Time course of the maturity index (A) and mean berry fresh weight (B) of
Aleatico berries for the 2008 and 2009 seasons. Data refer to the irrigated vine (IR)
treatment. Arrows in (A) show the onset of veraison. Values are the average of three
replicates; error bars in (B) represent the standard deviations.
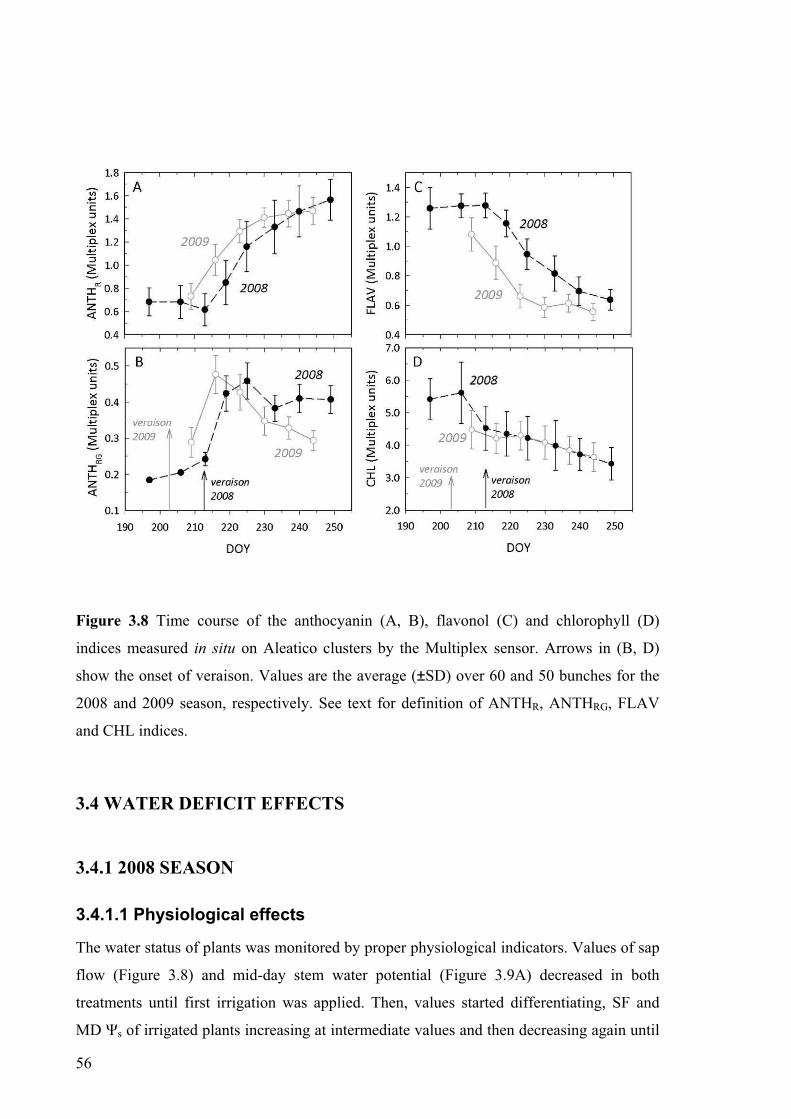
56
Figure 3.8 Time course of the anthocyanin (A, B), flavonol (C) and chlorophyll (D)
indices measured in situ on Aleatico clusters by the Multiplex sensor. Arrows in (B, D)
show the onset of veraison. Values are the average (±SD) over 60 and 50 bunches for the
2008 and 2009 season, respectively. See text for definition of ANTHR, ANTHRG, FLAV
and CHL indices.
3.4 WATER DEFICIT EFFECTS
3.4.1 2008 SEASON
3.4.1.1 Physiological effects
The water status of plants was monitored by proper physiological indicators. Values of sap
flow (Figure 3.8) and mid-day stem water potential (Figure 3.9A) decreased in both
treatments until first irrigation was applied. Then, values started differentiating, SF and
MD s of irrigated plants increasing at intermediate values and then decreasing again until

57
the next watering event. In the non-irrigated (WS) plants these parameters decreased
progressively reaching minimum values at the end of the experiment.
Diurnal values of Pn (Figure 3.9B) and gs (Figure 3.9C) decreased in WS plants
throughout the considered period and in IR plants only at the beginning of August in
correspondence of the decrease of vegetative activity (data not shown).
The time course of the Anth index (Figure 3.9D) derived by the Mx measurements in situ
increased exponentially starting from veraison for both treatments. The Anth accumulation
for the WS treatment was significantly higher just at the end of the ripening. This pattern is
confirmed by the Anth concentration evaluated spectrophotometrically in lab (Figure
3.10A, B and C) on berries that had similar berry and skin weights for both treatments
(Figure 3.10D).
The evolution of total extractable phenolic compounds expressed as mg per berry showed
significant difference between treatments only at DOY 233 (Figure 3.11), and this appears
to be determined by the difference in phenolic compound concentration present in seeds
rather than in skins (Figure 3.12 A and B).
Soluble solids, total acidity and pH values were not significantly affected. At ripening they
resulted similar in both treatments (average values: 25°brix, 4.9 g/L total acidity, 3.70 pH).
Figure 3.8 Seasonal cumulated sap flow (SF) on irrigated (IR) and non-irrigated (WS)
plants during 2008 season. Values are the average of two selected plants per treatment.
Arrows indicate a rain event (thin line) and water supply (thick lines). Bars represent the
standard errors.

58
Figure 3.9. Time course of midday stem water potential (A), photosynthetic rate (B),
stomatal conductance (C) and the ANTHRG index (D) measured in situ by the Multiplex
sensor for irrigated (IR, circles) and non-irrigated (WS, triangles) plants during the 2008
season. IR data are the same presented in Figures 3 and 5B for water potential and gas
exchange parameters and ANTHRG, respectively. Up arrow in D indicate the onset of
veraison; arrows in A indicate a rain event (thin line) and water supply (thick lines). Water
potential values are the average of three replicates. Gas exchange data are the average of
15 leaf samples measured between 9:00 and 10:30 a.m. ANTHRG values are the average of
60 bunches. Error bars represent the standard deviations. Values in D with different letters
indicate significance at P < 0.05 and no letters = not significant

59
Figure 3.10. Time course of total anthocyanins concentration measured in lab and
expressed as mg/g of skin fresh weight (A), mg/kg of berries (B), mg per berry (C) of
irrigated (IR, circles) and non-irrigated (WS, triangles) plants during the 2008 season.
Whole berry and skin weights are also shown in panel (D). Arrows in (C, D) indicate the
onset of veraison. Each data is the average of three replicates. Error bars represent the
standard deviations; values with different letters indicate significance at P < 0.05; no letters
= not significant.

60
Figure 3.11 . Time course of total phenolic compounds measured in lab and expressed as
mg per berry from irrigated (IR, circles) and non-irrigated (WS, triangles) plants during the
2008 season. Arrow indicates the onset of veraison. Each point is the average of three
replicates. Error bars represent the standard deviations; values with different letters
indicate significance at P < 0.05; no letters = not significant.

61
Figure 3.12 Total phenolic compounds concentration in skins (A) and seeds (B) of berry
from irrigated (IR, circles) and non-irrigated (WS, triangles) plants during the 2008 season.
Arrow indicates the onset of veraison. Each data is the average of three replicates. Error
bars represent the standard deviations; values with different letters indicate significance at
P < 0.05; no letters = not significant.

62
3.4.2 2009 SEASON
3.4.2.1 Physiological effects
The vine physiological response to the two irrigation regimes is represented by the
temporal evolution of the midday stem water potential (Figure 3.13A), photosynthetic rate
(Figure 3.13B) and stomatal conductance (Figure 3.13C). These physiological indicators
revealed that the water stress in WS plants was already intense at veraison and increased
thereafter. WS conditions induced a decrease of stem water potential to values lower than -
1.4 MPa (Figure 3.13A), whereas under IR treatment, these levels were registered only for
short periods. Values of Pn (Figure 3.13B) and gs (Figure 3.13C) were markedly different
between the two applied water regimes during the whole season.
The ANTHRG index measured in the field was used to compare the effect of vine water
status on Anth accumulation in berries during the 2009 season. This index showed that the
evolution of ANTHRG was similar for IR and WS vines (Figure 3.13D); however, starting
from DOY 230, the index values for stressed plants were significantly (P < 0.05) lower
than those of plants under IR, indicating a higher accumulation of Anth under water-stress
condition. This difference in the Anth content between the two samples was increasing
with ripening (P = 0.015 at DOY 237 and P < 0.001 at DOY 244). The higher content of
Anth in bunches of the WS vines as compared with IR samples was confirmed by the
destructive analysis (Figure 3.14). The Anth concentration in WS samples started to
increase more markedly than in IR berries after DOY 216 (Figure 3.14A, B, C). The
difference between the two treatments increased with time and then partially attenuated
towards harvest.
Total phenolic compound concentration per berry showed a significant difference between
treatments only at harvest where IR samples displayed higher values than those detected in
WS (Figure 3.15) and this might be due to the total phenolic compounds content present in
the seeds (Figure 3.16B). The trend of total phenolic compound concentration in skin
increased reaching a maximum at DOY 230 when the value in WS samples was
significantly higher than that detected in IR (Figure 3.16A) and remained constant up to
the harvest, differently from that observed in the seeds which decreased during ripening
(Figure 3.16B).
The sugar accumulation process resulted more pronounced in WS berries and this was
paralleled by higher titratable acidity values (Figure 3.17). At the end of the experiment all

63
technological parameters were higher in WS than in IR, including the pH values (3.70 in
WS vs 3.54 in IR).
The bud fertility recorded in the field, expressed as bunches/shoot, was higher in 2010
than in 2009 and was not significantly affected by treatments, although WS plants
showed slightly higher values than those of IR in both years (Figure 3.18A).
Additional observations were also made on bud fertility along the pruning canes sampled
in winter 2010. The fertility gradient (Figure 3.18B) determined in laboratory on one node
cuttings from positions 3-10, tended to increase from basal nodes to the median positions.
The bud fertility was not significantly affected by water stress except at the eighth node
level where it was found a decrease.
In 2009 shoot vigour was practically unaffected by treatments as the mean shoot weight
was 77.83 gr for WS and 77.21 gr for IR; WS plants had an average number of 4.4 shoots,
IR plants of 4.9 shoots.
Figure 3.13 Time course of midday stem water potential (A), photosynthetic rate (B),
stomatal conductance (C) and the ANTHRG index (D) measured in situ by the Multiplex
sensor for irrigated (IR, circles) and non-irrigated (WS, triangles) plants during the 2009
season. IR data are the same presented in Figures 3 and 5B for water potential and gas

64
exchange parameters and ANTHRG, respectively. Arrows in (C, D) indicate the onset of
veraison. Water potential values are the average of three replicates. Gas exchange data
come from the average of 15 leaf samples measured between 9:00 and 10:30 a.m. ANTHRG
values are the average of 50 bunches. Error bars represent the standard deviations. Arrows
in (A) indicate a rain event (thin line) and water supply (thick line). Values with different
letters in D indicate significance at P < 0.05; ns = not significant
Figure 3.14. Time course of total anthocyanins measured in lab and expressed as mg/g of
skin fresh weight (A), mg/kg of berries (B), mg per berry (C) and of berry and skin weight
(D) of irrigated (IR, circles) and non-irrigated (WS, triangles) plants during the 2009
season. Arrows in (C, D) indicate the onset of veraison. Each point represents the average
of three replicates. Error bars represent the standard deviations; values with different letters
indicate significance at P < 0.05; ns = not significant.
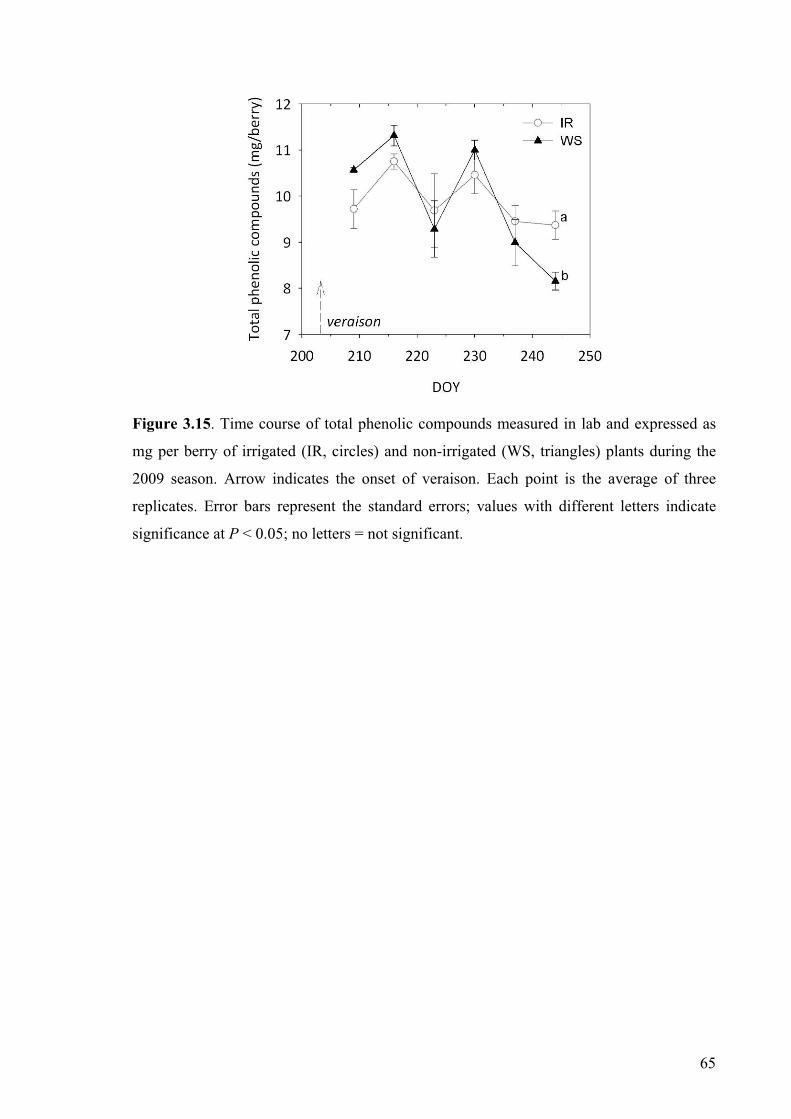
65
Figure 3.15. Time course of total phenolic compounds measured in lab and expressed as
mg per berry of irrigated (IR, circles) and non-irrigated (WS, triangles) plants during the
2009 season. Arrow indicates the onset of veraison. Each point is the average of three
replicates. Error bars represent the standard errors; values with different letters indicate
significance at P < 0.05; no letters = not significant.

66
Figure 3.16. Total phenolic compounds contribution from skins (A) and seeds (B) per
berry of irrigated (IR, circles) and non-irrigated (WS, triangles) plants measured in lab
during the 2009 season. Arrows indicate the onset of veraison. Each point is the average of
three replicates. Error bars represent the standard deviations; values with different letters
indicate significance at P < 0.05; no letters = not significant.
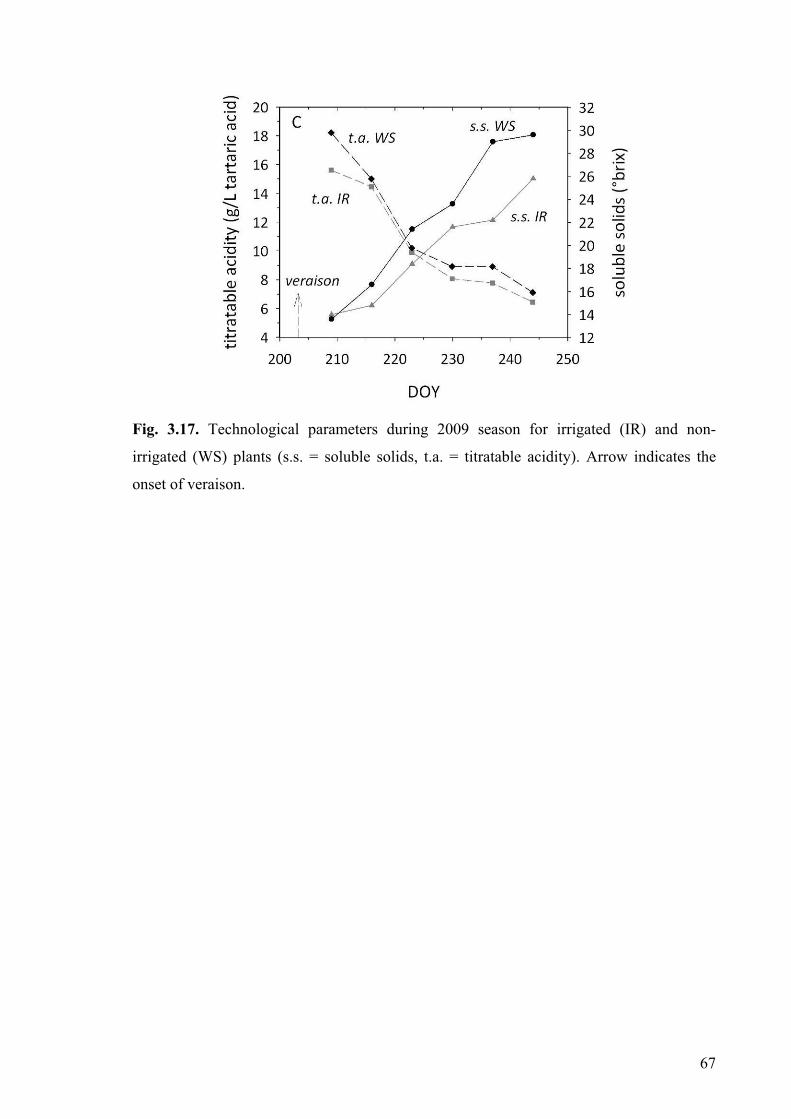
67
Fig. 3.17. Technological parameters during 2009 season for irrigated (IR) and non-
irrigated (WS) plants (s.s. = soluble solids, t.a. = titratable acidity). Arrow indicates the
onset of veraison.

68
Figure 3.18. Aleatico fertility (expressed as number of bunches per node) in irrigated (IR)
and non-irrigated (WS) plants. A) Comparison between 2009 and 2010 seasons; B) fertility
gradient along the cane in 2010 determined in laboratory on single node cuttings (number
of cluster per node from third to tenth node). Error bars represent the standard errors.
3.4.2.2 Biomolecular results
The research stage at Dr. Lund's laboratory -Wine Research Center of the University of
British Columbia (Vancouver, Canada)- started with a preliminary expression analysis of
target genes previously selected in that lab as putative drought biomarkers in leaves and
recognized to be expressed in fruit tissues, too (Grimplet et al., 2007; Pilati et al., 2007;
Castellarin et al., 2007a; Deluc et al., 2007; Zamboni et al., 2010). In addition, other genes
known to be affected by water deficit and/or related to berry quality processes were
selected, new primers were designed and their expression level evaluated in berry samples
collected from IR and WS Aleatico plants in 2009.
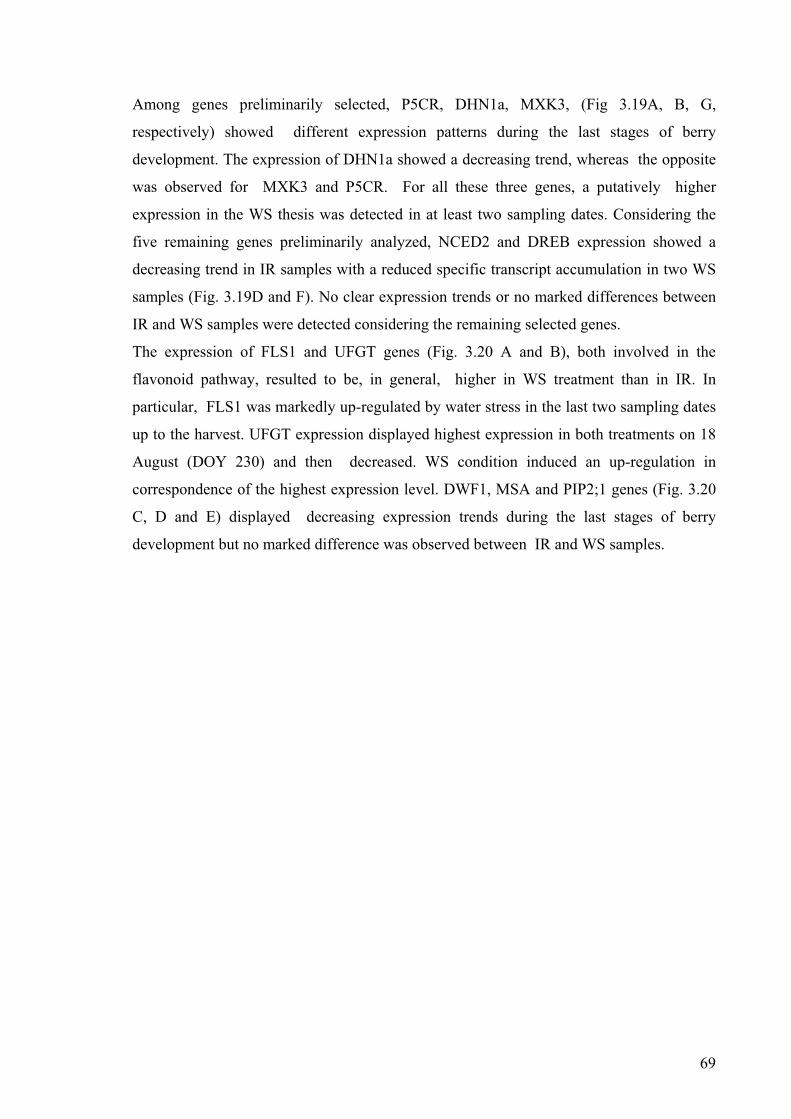
69
Among genes preliminarily selected, P5CR, DHN1a, MXK3, (Fig 3.19A, B, G,
respectively) showed different expression patterns during the last stages of berry
development. The expression of DHN1a showed a decreasing trend, whereas the opposite
was observed for MXK3 and P5CR. For all these three genes, a putatively higher
expression in the WS thesis was detected in at least two sampling dates. Considering the
five remaining genes preliminarily analyzed, NCED2 and DREB expression showed a
decreasing trend in IR samples with a reduced specific transcript accumulation in two WS
samples (Fig. 3.19D and F). No clear expression trends or no marked differences between
IR and WS samples were detected considering the remaining selected genes.
The expression of FLS1 and UFGT genes (Fig. 3.20 A and B), both involved in the
flavonoid pathway, resulted to be, in general, higher in WS treatment than in IR. In
particular, FLS1 was markedly up-regulated by water stress in the last two sampling dates
up to the harvest. UFGT expression displayed highest expression in both treatments on 18
August (DOY 230) and then decreased. WS condition induced an up-regulation in
correspondence of the highest expression level. DWF1, MSA and PIP2;1 genes (Fig. 3.20
C, D and E) displayed decreasing expression trends during the last stages of berry
development but no marked difference was observed between IR and WS samples.

70
Figure 3.19. Expression analysis of target genes (previously selected as putative drought
biomarkers in leaves) in berries collected from irrigated (IR, circles) and non irrigated
(WS, triangles) Aleatico plants during the last developmental stages in 2009 season.
Pyrroline-5-carboxylate reductase (P5CR) (A), Dehydrin 1a (DHN1a) (B), 9-cis-
epoxycarotenoid dioxygenase 1 (NCED1) (C), 9-cis-epoxycarotenoid dioxygenase 2
(NCED2) (D), Zeaxanthin epoxidase (ZEP) (E), Dehydration responsive element-binding
protein (DREB) (F), ABC transporter (MXK3) (G), Proline (PrDh) (H). Each point
represents one biological replicate.

71
Figure 3.20. Expression analysis of selected genes (known to be affected by water deficit
and/or related to berry quality processes in grapes) in berries collected from irrigated (IR,
circles) and non irrigated (WS, triangles) Aleatico plants during the last developmental
stages in 2009 season. Flavonol synthase (FLS1) in A, Flavonoid 3-O-glucosyltransferase
(UFGT) in B, Dwarf1 (DWF1) in C, Abscisic acid-, stress-, and ripening-induced (ASR)
gene (MSA) in D, Aquaporin (PIP2;1) in E. Each point represents one biological replicate.
Based on the above described preliminary data on gene expression, specific genes have
been selected and their expression analyzed more in detail in WS and IR berry samples
from veraison stage till complete ripening. Considering the flavonoid pathway, the
expression of FLS1 increased constantly in WS up to the end of the experiment,

72
differently from IR samples where specific transcript reached the highest accumulation on
25 August (DOY 237) and then decreased. Hence, at harvest FLS1 resulted markedly up-
regulated in WS samples showing a significant difference with control berries. (Figure
3.21). The trend of UFGT gene expression (Fig. 3.22 A) shows that the highest expression
levels occur when Anthocyanin content reaches the plateau (Fig. 3.22 B), with a significant
difference between IR and WS samples 2 weeks before harvest. Delphinidin-3-glucoside
resulted to be more abundant than Cyanidin-3-glucoside and appeared to be more
influenced by WS (Fig. 3.22 C, D).
F3’H and F3’5’H are key-genes in the flavonoid pathway determining respectively the
biosynthesis of di-substituted and three-substituted Anth. The expression of F3’5’H (Fig.
3.23 A) was higher than that of F3’H (Fig. 3.23 B), promoting, consequently, a higher
biosynthesis of 3’4’5’-OH than of 3’4’-OH Anth (Fig.3.23 C, D). The highest expression
of F3’H and F3’5’H in WS treatment corresponded to the time of the highest
accumulation of Anth (Fig. 3.22B).
AOMT is a gene showing a preference for 3’5’ methylation, while FAOMT, identified at
the Wine research Centre - Univ. Bristish Columbia, encodes for a methyltransferase that
resulted to be highly specific for delphinidin-3-glucoside and consequently for the
biosynthesis of malvidin and petunidin (Lucker, 2010). AOMT showed the highest
expression at the onset of ripening whereas FAOMT expression data indicated the presence
of one week shift to reach the highest values in transcript accumulation (Fig. 3.24 A). No
significant effects of the two water regimes were observed on the expression of these genes
responsible for Anth methoxylation, but the methoxylated Anth content of WS treatment
was significantly higher than that observed in IR treatment. Considering methylated Anth,
Malvidin-3-glucoside appeared to be the most abundant in Aleatico berries (Fig. 3.24 B),
followed by peonidin-3-glucoside (Fig. 3.24 C) and petunidin-3-glucoside (Fig. 3.24 D).

73
Figure 3.21. Expression of FLS1 gene in berries collected from irrigated (IR, circles) and
non irrigated (WS, triangles) Aleatico plants during the last developmental stages in 2009
season. Bars represent ±SE, values with different letters indicate significant difference at P
< 0.05 . No letters = not significant.

74
Figure 3.22. Expression of UFGT gene in berries collected from irrigated (IR, circles)
and non irrigated (WS, triangles) Aleatico plants during the last developmental stages in
2009 season (A), time course evolution of total Anth (B), delfinidin-3-glucoside (C) and
cyanidin-3-glucoside (D) concentration in berry skin. Total Anth (B) data are the same
presented in Figure 3.14A for the last fruit developmental stages. Bars represent ±SE (A),
±SD (B, C, D); values with different letters indicate significant difference at P < 0.05. No
letters = not significant

75
Figure 3.23. Expression of F3’5’H gene (A) and F3’H gene (B) in berries collected from
irrigated (IR, circles) and non irrigated (WS, triangles) Aleatico plants during the last
developmental stages in 2009 season, and time course of 3’4’5’-OH anth (C) and 3’4’-OH
anth (D) concentration in berry skin. Bars represent ±SE (A, B), ±SD (C, D); values with
different letters indicate significant difference at P < 0.05. No letters = not significant
76
Figure 3.24. Expression of FAOMT and AOMT genes in berries collected from irrigated
(IR, circles) and non irrigated (WS, triangles) Aleatico plants during the last developmental
stages in 2009 season (A), and time course of malvidin-3-monoglucoside (B), peonidin-3-
monoglucoside (C) and petunidin-3-monoglucoside (D) concentration in berry skin. Bars
represent ±SE (A), ±SD (B, C, D); values with different letters indicate significant
difference at P < 0.05. no letters = not significant
DHN1a showed significant differences between treatments throughout the considered
sampling period, being WS samples characterized, in general, by higher transcript
accumulations (Fig 3.25 A). The ABC transporter MXK3 did not show significant
differences between WS and IR samples, but despite a high biological variability, it
resulted expressed throughout the last berry developmental stages with higher transcript
accumulation trend in WS samples (Fig 3.25 B).

77
Figure 3.25. Expression of Dehydrin 1a (A) and MXK3 (B) genes in berries collected
from irrigated (IR, circles) and non irrigated (WS, triangles) Aleatico plants during the last
developmental stages in 2009 season. Bars represent ±SE, values with different letters
indicate significant difference at P < 0.05. No letters = not significant.

4. DISCUSSION For several years the Anth profile has been used for a taxonomic purpose and for the
varietal traceability of high quality red wines (Mattivi et al., 1990; Castia et al., 1992;
Valenti et al., 1993; Bucelli et al., 1998; Gomez-Ariza et al., 2006; Baer et al., 2008;
Kallithraka et al., 2009). This is very important and relevant also for Aleatico grapevine
that recently received the ‘Denomination of Controlled and Guaranteed Origin (DOCG)’
that is the top ranking in the Italian wine ranking system. As reported in a previous study
(Boselli et al., 2003), the most abundant anthocyanosides detected in Aleatico berry skin
are the monoglucoside Anth due mainly to the malvidin 3-O-glucosides followed by
petunidin 3-O-glucosides. These compounds can increase the wine quality more than the
others Anth because they have a higher red and blue colour intensity. The high percentage
contribution of malvidin is common in several varieties as Cabernet Sauvignon (Gonzàlez-
Neves et al., 2006), Cabernet Franc, Carmenère, Grenache, Malbec, Sagrantino, Teroldego
(Storchi et al., 2008), Nerello Mascalese and Corinto Nero (Nicolosi et al., 2007), Syrah
(Huguney et al., 2009), but the entire profile can differ very much among varieties. The
highest similarity is found with Cabernet Sauvignon, Grenache and Syrah (Storchi et al.,
2008) that show malvidin as the main pigment followed by peonidin, delfinidin and
petunidin in similar quantity, and cyanidin only in small amount as in Aleatico Anth
profile. The 3-O-acetylglucosides are scarce whereas the 3-O-p-cumaroylglucosides are
well represented. Anthocyanin accumulation (in particular if referred to mg/berry) follows
a bi-phasic pattern: the initial high rates detected immediately after the inception of
veraison and lasting about 20-25 days are followed by slower rates of accumulation. In
2008, the highest Anth concentration was reached 10-15 days before harvest, and is
considered an information of great importance for the management of field operations
(harvesting, in particular) and vinification as it concerns the timing of phenol maturation.
Water deficit was shown to accelerate ripening and induce changes in gene expression
regulating flavonoid biosynthesis, especially the anthocyanin pathway as measured by the
increase in total anthocyanins (Castellarin et al., 2007a). Our results on Aleatico grapes are
consistent with this study; in 2009 trial water deficit increased the accumulation of the five
major anthocyanins relative to berries from IR vines (Figs 3.22 and 3.24). In fact, water
stress conditions in general induced a magnification of these accumulating processes
78

resulting in a significant increase in total anthocyanin concentration at harvest. This
appears due to an increased expression of UFGT in correspondence of 2 weeks before
harvest (Figure 3.22 A and B): this stage can be considered the period of the highest rate
for Anth biosynthesis in Aleatico grapes with our experimental conditions (corresponding
also to the maximum of the solar radiation).
Castellarin et al., (2007a) showed a constant effect of UFGT up-regulation by water stress
throughout the last berry developmental stage: in our experiment this effect was less
evident, probably because, in 2009, the IR treatment reached a moderate water stress
before the water supply. Similar results and pattern of UFGT expression, induced by WS,
were reported by Deluc et al. (2009) in a transcriptomic approach on Cabernet Sauvignon
berries. Considering different Anth categories glycosylated by UFGT, delphinidin-3-
glucoside showed a more pronounced increment induced by WS than cyanidin-3-
glucosyde (Figure 3.22 C and D), thus confirming the hypothesis that water stress affects
Anth composition more than total concentration (Bindon et al., 2010; Chaves et al., 2010).
The relative proportion of the two types of Anth (cyanidin/delphinidin) is largely under
genetic control and typical for each cultivar (Castellarin et al., 2006). F3’H and F3’5’H are
key genes in the biosynthesis of such types of Anth. In grapes, a higher expression of
F3’5’H than F3’H has been reported by Mattivi et al., (2006) and Castellarin et al., (2007b)
and our results confirm this condition (Figure 3.23 A and B): results show a higher
concentration of tri-substituted than that of di-substituted Anth (Figure 3.23 C and D).
Castellarin et al., (2007b) reported that in Merlot the expression pattern of F3’5’H gene
shows a decreasing trend from veraison to harvest, whereas F3'H has a less variability. Our
results confirm these findings and also confirm that WS induces a marked increment of
F3’5’H expression in correspondence of the highest rate of anth biosynthesis, as concluded
in the same paper by Castellarin et al., (2007b). WS promoted the conversion of
hydroxylated anthocyanins (cyanidin and delphinidin) into all their methoxylated
derivatives (peonidin, petunidin and malvidin) (Fig. 3.24). This behaviour is slightly
different from that observed in Merlot (Castellarin et al., 2007b) where petunidin
(methoxylated at 3' position) did not increase, differently from malvidine and peonidin,
under drought conditions. The expression pattern of the two studied OMT genes (FAOMT
and AOMT , Fig. 3.24A) is consistent with these observations. AOMT was characterised
by Hugueney et al., (2009) in Syrah and Nebbiolo cv. that have a different Anth profile
79

(malvidin dominant and peonidin dominant, respectively) and it showed a preference for
3’5’ methoxylation. Aleatico resulted to have an Anth profile (Figure 3.24B) more similar
to Syrah than Nebbiolo.
FAOMT was identified at the Wine research Centre and it codes for a methyltransferase
that resulted to be highly specific for delphinidin-3-glucoside and consequently for the
biosynthesis of malvidin and petunidin (Lücker et al., 2010). In several V. vinifera cultivar,
OMT genes have the maximum expression at the onset of the ripening (Castellarin and Di
Gaspero, 2007; Lund et al., 2008; Lücker et al., 2009) as our FAOMT results on Aleatico
cv. confirmed (Figure 3.24A).
The Anth concentration in WS samples during 2009 season started to increase more
markedly than in IR berries after around two weeks from véraison. The divergence
increased with time and partially attenuated towards harvest. Since both total berry and
skin weights in stressed plants were significantly lower than in watered plants, it is clear
that a concentration (dilution) effect was present in the Anth values referred to g of skin or
kg of berries. However, when Anth were expressed on a per berry basis, there was still a
marked difference in the Anth content in favour of the WS samples, by up to 36%. On the
other hand, the mean increase of Anth concentration, expressed in mg/kg of berries,was
about 57% from DOY 223 to harvest in the WS samples, which cannot be accounted for
the 21% mean reduction of berry mass induced by water deficit. Analogously, the 45%
average higher Anth content, expressed as mg per skin fresh weight, in WS versus IR
treatments cannot be explained by the 16% average difference in skin berry weight.
Plants responded to the higher water deficit applied during 2009 season in a similar way to
those observed when water deficit was imposed to Cabernet Sauvignon vines (Castellarin
et al., 2007a). The attenuation in the difference of Anth concentration between the two
treatments, observed at the end of the trial, can be explained in terms of evolution of the
ripening process. Maturity was accelerated by WS, as reported in other works (Castellarin
et al., 2007a); therefore, WS berries reached the highest Anth content earlier than IR
samples. Furthermore, the marked stress conditions imposed (MD Ψs < -1.8 MPa) could
result in an increased structural complexity of phenolic compounds in the berry (i.e. higher
degree of polymerization), leading to a lower Anth extractability (Sivilotti et al., 2005).
Concerning other phenol compound categories, in more than 60 red grapes varieties, the
main flavonol appeared to be quercetin (mean = 43.99%), followed by myricetin (36.81%),
80

kaempferol (6.43%), laricitrin (5.65%), isorhamnetin (3.89%), and syringetin (3.22%)
(Mattivi et al., 2006). The characterization of Aleatico has been implemented through the
description and quantification of the different flavonol categories. These analyses showed
that this variety is characterized by the presence of quercetin 3-O-glucuronide, quercetin 3-
O-rutinoside, and quercetin 3-O-glucoside as the main compounds. The rise in Flav
biosynthesis appeared to be shifted in time with respect to Anth: this could be due to the
competition for the common substrate, dihydroflavonols, between flavonol synthase and
dihydroflavonol 4-reductase (Davies et al. 2003, Jaakola et al., 2004). FLS1 is the key step
in the flavonols biosynthesis. The expression increased at the onset of the ripening but its
trend during ripening has a varietal influence: in Chardonnay it increases very fast (steadly
towards harvest) at veraison stage, in Syrah increases slowly with a noticeable increase
three weeks post-veraison (Downey et al., 2003), while in Merlot slightly increases from
veraison to harvest as reported in Castellarin et al., (2007b). Similar expression trends have
been observed in Aleatico (Fig. 3.21) where WS conditions resulted in an increased
transcript accumulation at the end of the considered period (similarly to what was observed
in Chardonnay and Merlot), whereas in control grapes (IR) a decrease was observed in
correspondence of harvest. This expression pattern mirrors that of Flav concentration
measured in 2008 season for IR treatment.
These molecular data, coupled with physiological indicators, are extremely useful and
important for a better characterization of Aleatico responses to water deficit conditions.
When the response of this variety was compared to that of other varieties, it was found that
Aleatico had a similar behaviour to Cabernet Sauvignon while the sensitivity to water
stress appeared to be higher in Alicante, Petit Verdot, Syrah, and Sangiovese (Scalabrelli et
al., 2011).
During 2008 season the water stress in non-irrigated plants resulted to be only moderate
and occurring primarily in correspondence of the last berry developmental stage. This may
explain why differences on shoot growth, lateral shoot growth, and leaf area have not been
observed. As a normal event occurring in most vineyards of Tuscany (Scalabrelli, personal
communications), it is likely that growth stopped at time of veraison. In 2009 the water
stress in non-irrigated plants resulted to be more intense and starting from pre-veraison.
WS conditions determined a decrease of stem water potential which dropped to values
lower than - 1.4 MPa (Figure3.13A), whereas in IR treatment these levels were registered
only for short periods. Diurnal values of Pn and gs appeared markedly affected by the
81

applied water regimes during both seasons confirming a higher sensitivity of these
physiological indicators to water deficit (Flexas et al., 2002; Maroco et al., 2002; Cuevas et
al., 2006). In 2008 they decreased in non-irrigated plants throughout the experiment and in
irrigated plants only at the beginning of August in correspondence to the end of vegetative
activity (data not shown); in 2009 significant differences of Pn and gs between the two
treatments throughout the season were observed.
The water deficit of both seasons did not affect the plant fertility as reported by other
authors (Alaa Al-Joumayly, 2003) although in 2010 a decrease in bud fertility was
observed at the eighth node level (Figure 3.18 B), and this could be due to the stress
conditions of the previous year.
As a consequence of the moderate water deficit occurred in the 2008 season, soluble solids,
total acidity and pH values of berries were not significantly affected, whereas in the 2009
season WS conditions influenced the technological parameters resulting in a higher
concentration of soluble solids and titratable acidity at harvest (Figure 3.17).
As observed in our 2008 trial, other authors demonstrated that no changes in titratable
acidity (TA) are present in the must from moderately water-stressed vines (Matthews and
Anderson, 1989; Esteban et al., 1999), while some papers reported a reduction of TA due
to deficit irrigation (Sheltie, 2006; Santos et al., 2007); Malate/tartarate ratio is in general
lower due to malate breakdown in vines with low water status (Matthews and Anderson,
1989). However, Matthew et al. (1988) and Ferreyra et al. (2004) found an increase of this
parameter under water stress conditions. Consequently, the increase of titratable acidity on
Aleatico WS plants can be due to a concentration effect confirmed by the significant
decrease in berry weight (Figure 3.14D). The effects of water deficit on sugar content of
grapevine berries are variety-dependent (Gaudillère et al., 2002). For example, no
significant changes were observed in Merlot sugar content under water deficits, while a
significant increase in sugar content was observed in Cabernet Sauvignon berries
(Castellarin et al. 2007a, b). Similarly, Deluc et al. (2009) observed an increase in berry
sugar content under water deficits in Cabernet Sauvignon but not in Chardonnay.
Water stress could be considered a useful instrument to improve quality of dessert Aleatico
wines. The drought conditions imposed during the 2009 season favoured the decrease of
phenolic compounds from seeds at the end of the trial when a strong water stress occurred
(MD Ψs < -1.8 MPa). As reported in literature (Scalabrelli et al., 2004) Aleatico cv. is
82

characterized by a high quantity of tannins in seeds compared to those extracted from the
skins. Moreover seed astringency and bitter taste are very frequent during ripening
(Scalabrelli, personal communication) so phenolic maturity could be critical to obtain a
dessert wine from Aleatico. The typical wine produced by post-harvest dehydration of
Aleatico berries is sweet, hence an adequate amount of sugars can balance the tannic
component making the astringency less pronounced. The water stress could have a positive
effect on accelerating the degeneration/evolution of tannins in seeds (Roby et al., 2009), or
promoting their polymerization as reported by Sivilotti et al., (2005) although more
detailed studies on phenolic compounds should be carried out to corroborate these
hypotheses.
In order to better manage water deficit conditions and understand plant reaction to this (and
other) kind of stress, the elucidation of metabolic processes, particularly those affected by
drought, and the identification of bio-markers can be extremely useful. Among the genes
studied for this purpose, DHN1a resulted one of the most sensitive to water stress in shoot
tips (Cramer et al., 2007) DHN1a encodes for proteins that accumulate in vegetative
tissues to protect plants from different stresses (Xiao, 2006). These proteins are regulated
by ABA and their role and mechanism of stress adaptation is not clear yet. DHN1a could
be involved also in the berry ripening regulation (Pilati et al., 2007). DHN1a is considered
a sensitive drought biomarker in shoot tips (Cramer, 2007) and leaves (Xiao, 2006) where
the expression is reported to be increased during the vegetative growth, whereas on our
trials in berries the expression decreased during the last developmental stages with a
significant up regulation caused by WS. The effects of drought on DHN1a was studied
only post-harvest where the expression increases when berries undergo partial dehydration
(Zamboni et al., 2008). Considering the significant differences observed between
treatments starting from the post-veraison stage (Figure 3.25B), this gene appears to be a
good candidate as a biomarker for the detection of stress conditions in the berries.
MXK3 is an ABC transporter (Grimplet et al., 2007); ABC is a generic protein family
associated with membranes having function of ions, water, sugars and also anthocyanins
transport (Deluc et al., 2007). If marked increases in the gene expression had been detected
in shoot tips after 16 days of water stress (Cramer et al., 2007), no significant difference in
terms of transcript accumulation had been observed in berries (Figure 3.25C) even though
an increasing trend was observed in the post-veraison stage. In addition to specific genes of
83
the phenylpropanoid biosynthetic pathways, our results indicate that other genes can be
used to describe and monitor water stress conditions in the grape berries.
Together with the identification of biomarkers, the development and practical application
of portable and non-destructive instruments to detect compositional changes of grape
berries is strategic for a modern viticulture. In this context, the Multiplex®2 sensor resulted
to be a very useful instrument as preliminarily described by Agati et al., (2009).
The timewas anticipated in 2009 (Figure 3.7), in agreement with phenological data (onset
of veraison) and harvesting dates for the two seasons, and that the vines experienced more
pronounced general stress conditions in 2009 than in the 2008 season.
With regards to Mx indices trends, the biphasic behaviour of ANTHRG can be explained by
considering the difference in the absorption properties of Anth at the two excitation
wavelengths in the green (516 nm) and in the red (637 nm). With increasing Anth
concentration, i.e. with increasing DOY, both FRFG and FRFR signals will decrease,
because of an increased screening effect on Chl, but the latter with a lower rate because of
the lower absorptivity of Anth in the red. Applying the logarithmic function of Eqn 1 to
calculate the time course of ANTHRG, according to the Beer–Lambert’s law, results in the
difference of two components that increase exponentially with time but with different rate
constants (see also Ben Ghozlen et al., 2010a). Consequently, an initial increase in the
index is followed by a decrease. Once the maximum has been reached, ANTHRG is
expected to be inversely correlated to the Anth content.
The sharp decrease of FLAV starting at DOY 213 (Figure 3.7C) is in contrast with the time
course of Flav resulting from the HPLC analysis (Figure 3.1). This was not unexpected
because of the absence of correlation between the Mx FLAV index and the Flav
concentration (Figure 3.2B). It is because of the accumulation of Anth, which largely
affects the FRFR signal, while the FRFUV was changed slightly. Consequently, according to
their definition (Eqn 1 and 2), the FLAV index becomes similar to the inverse of the
ANTHR index (FLAV ∝-ANTHR), as seen in Figure 3.7 (C and A). The same decrease
with time in FLAV was previously observed in cvs. Pinot Noir and Pinot Meunier, while
an increase in FLAV with time was found for the Anth-free cv. Chardonnay (Ben Ghozlen
et al. 2010b).
Our analysis shows that while the ANTHRG index can be used to predict the Anth content
in grape skin, the FLAV index cannot be considered a good proxy of Flav content.
84

The ANTHRG index measured in the field was used to compare the effect of the different
vine water status of WS and IR treatments on Anth accumulation in berries during the
2008 and 2009 seasons. The accumulation of Anth determined by the ANTHRG index
increased exponentially for both treatments, during both years (Figure 3.9D and Figure
3.13D) starting from veraison that corresponds to the initial phase of Anth biosynthesis
(Figure 3.10 A, B, C and Figure 3.14 A, B, C).
As reported in literature, the Mx sensor has real potential for precision viticulture. Still, for
very mature grapes an increase in green source power would be welcome (Cerovic et al.,
2008).
85

5. CONCLUSIONS
The variety ‘Aleatico’ appeares to be tolerant to water stress conditions and this
information could be useful also for setting up targeted post-harvest dehydration strategies
to produce dessert wines. However, the effects of the same and other (more intense) water
stress must be studied in different seasons and on vines of different age.
The Anth profile was defined, identifying Malvidin as the predominant compound. The
Aleatico anthocianic profile was defined showing high percentage of glycosylated Anth,
with Malvidin and Petunidin as the main compounds; the 3-O-acetylglucosides are scarce
whereas the 3-O-p-cumaroylglucosides are well represented. Among Flav, quercetin 3-O-
glucuronide, quercetin 3-O-rutinoside and quercetin 3-O-glucoside are the most
represented. Flav biosynthesis appears related to the plant capacity to respond to climatic
stress (Remorini et al, 2008) and the remarkable amount of Flav found in the Aleatico
variety suggests the possibility that this variety is able to respond better to environmental
stress.
The water deficit applied had positive effects on quantity and quality of Anth and our
results confirm previous observations that, in different varieties, WS not only increases
Anth accumulation in berries as a result of a reduced berry size and a stimulation of Anth
biosynthesis, but also has an influence on the Anth composition.
Considering biomolecular results, and as a future prospective, thorough studies about
putative drought biomarkers in berries should be performed considering our results on
Dehydrin 1a.
More in-depth and wider studies of varieties in response to environmental stresses are
instrumental to the understanding of grapevine adaptation to more arid climates. Further
knowledge of berry development, including the timing of accumulation of various berry
components, and their dependence on water availability, is critical for an optimal choice of
irrigation strategy. In this context, an additional interesting result is represented by the
validation of a new important innovative technology for viticulture, the Mx sensor, a
86

portable non destructive instrument to measure Anth content directly in the vine, quickly
and with a high level of precision.
The sensor evaluation of the large spatial and temporal heterogeneity in Anth accumulation
can be useful as a support parameter in the harvest date decision or for vineyard zoning of
phenolic maturity. It represents a rapid and non-invasive tool to compare the effect of
different vineyard managements, soil and environmental factors on grape phenolic
maturity. Using an appropriate calibration curve for the Mx indices, obtained by
comparison between non-destructive measurements and destructive Anth analyses on the
largest range of Anth concentrations, the Anth content, expressed as g/kg of grape, in
different vineyard blocks can be predicted. The sensor cannot provide, at the moment,
indices of Flav content in red winegrape because of the covering effect of Anth. However,
it can be applied to white grapes where the FLAV index dynamics may represent a new
useful parameter to follow maturity (Lenk et al., 2007). The capacity to retrieve non
invasively at the same time, multiple parameters is an attractive advantage of the Mx
sensor. Beside the information on the Anth content, the degradation of Chl can be followed
simultaneously on the same samples. The Chl fluorescence decrease during grape berry
ripening was proved to be inversely correlated to sugar concentration (Kolb et al., 2006,
Lenk et al., 2007). Therefore, the Mx can also supply a rapid assessment of sugar content.
Indeed, a first good correlation between the CHL Mx index and total soluble sugar in the
cultivars Pinot Noir, Pinot Meunier and Chardonnay has been found (Ben Ghozlen et al.,
2010a). Optical non-destructive sensors, such as that used in the present work, appear to be
well suited as tools for integration in grapevine management practices facing the influence
of global climate change on fruit quality and production (Keller, 2010). The cv. Aleatico
proved to be tolerant to WS conditions, as preliminarily observed in potted plants
(unpublished data), allowing its cultivation in territories where irrigation is not available or
saving water when the irrigation must be used in severe dry conditions.
87

88
6. REFERENCES
Aasamaa, K., Sõber, A., Rahi M. (2001). Leaf anatomical characteristics associated with
shoot hydraulic conductance, stomatal conductance and stomatal sensitivity to changes of
leaf water status in temperate deciduous trees. Australian Journal of Plant Physiology 28:
765–774.
Acevedo-Opazo, C., Ortega-Farías S., Fuentes S. (2010). Effects of grapevine (Vitis
vinifera L.) water status on water consumption, vegetative growth and grape quality: An
irrigation scheduling application to achieve regulated deficit irrigation. Agricultural
Water Management 97: 956–964.
Agati, G., Mattii, G., Tuccio, L., Remorini, D., Tonutti, P. and Scalabrelli, G. (2009). Non
destructive in vineyard monitoring of winegrape phenolic maturity using a portable
fluorescence sensor. 5th International specialized conference on sustainable viticulture:
winery waste and ecologic impacts management – Winery 2009, Trento, Italy (Università
degli Studi di Trento, Trento: City) 455–458.
Agati, G., Meyer, S., Matteini, P. and Cerovic, Z.G. (2007). Assessment of anthocyanins in
grape (Vitis vinifera L.) berries using a non-invasive chlorophyll fluorescence method.
Journal of Agricultural and Food Chemistry 55: 1053–1061.
Agati, G., Traversi, M.L. and Cerovic, Z.G. (2008). Chlorophyll fluorescence imaging for
the non-invasive assessment of anthocyanins in whole grape (Vitis vinifera L.) bunches.
Photochemistry and Photobiology 84: 1431–1434.
Alleweldt, G, Spiegel-Roy P, Reisch B. (1990). Grapes (Vitis). Acta Horticulturae 290:
291–327.
Baer, D., Rentzsch, M., Hitschfeld, M. A., Mardones, C., Vergara, C., Winterhalter, P.
(2008). Relevance of chromatographic efficiency in varietal authenticity verification of
red wines based on their anthocyanin profiles: Interference of pyranoanthocyanins
formed during wine ageing. Analytica Chimica 621 (1): 52-56.
Barbagallo, R. N., Chiari, M., Branca, F., Spagna, G. (2008). Pectin methylesterase,
polyphenol oxidase and physicochemical properties of typical longstorage cherry
tomatoes cultivated under water stress regime. Journal of the Science of Food and
Agriculture 88: 389–396.
89
Ben Ghozlen, N., Cerovic, Z.G., Germain, C., Toutain, S. and Latouche, G. (2010a). Non-
destructive optical monitoring of grape maturation by proximal sensing. Sensors 10:
10040–10068.
Ben Ghozlen, N., Moise, N., Latouche, G., Martinon, V., Mercier, L., Besançon, E. and
Cerovic, Z.G. (2010b). Assessment of grapevine maturity using new portable sensor:
Non-destructive quantification of anthocyanins. Journal International des Sciences de la
Vigne et du Vin 44: 1–8.
Bindon, K.A, Dry, P.R., Loveys, B.R., (2008b). The Interactive Effect of Pruning Level
and Irrigation Strategy on Grape Berry Ripening and Composition in Vitis vinifera L. cv.
Shiraz. Afr. J. Enol. Vitic. 29 (2).
Bindon, K.A., Dry, P.R., Loveys, B.R., (2008a). The interactive effect of pruning level and
irrigation strategy on water use efficiency of Vitis vinifera L. cv. Shiraz. S. Afr. J. Enol.
Vitic. 29: 59-70.
Bota, J., Flexas, J., Medrano, H. (2001). Genetic variability of photosynthesis and water
use in Balearic grapevine cultivars. Annals of Applied Biology 138: 353–361.
Boulton, R. (2001). The copigmentation of anthocyanins and its role in the colour of red
wine: a critical review. American Journal of Enology and Viticulture 52: 67–87.
Boyer, J.S., Wong, S.C., Farquhar, G.D. (1997). CO2, and water vapour exchange across
leaf cuticle (epidermis) at various water potentials. Plant Physiology 114: 185–191.
Bravdo, B., Hepner, Y., Loinger, C., Tabacman, H. (1985). Effect of irrigation and crop
level on growth, yield and wine quality of Cabernet Sauvignon. American Journal of
Enology and Viticulture 36: 132–139.
Brouwer, C. and Heibloem, M. (1986) Irrigation water management: irrigation water needs
(Food and Agriculture Organization of the United Nations (FAO): Rome, Italy).
Bucelli, P., Scalabrelli, G., Giannetti, F. (1998). Potenziale fenolico e profilo antocianico
di una serie di vitigni a bacca nera rinvenuti in Lunigiana. Atti del 4° Convegno
Nazionale ”Biodiversità - Germoplasma locale e sua valorizzazione” Alghero, 8-11
settembre 1998. 371-374.
Cameron,, K.D., Teece, M.A., Smart, L.B. (2006). Increased accumulation of cuticular
wax and expression of lipid transfer protein in response to periodic drying events in
leaves of tree tobacco. Plant Physiology 140: 176–183.

90
Castellarin, S.D. and Di Gaspero, G. (2007). Transcriptional control of anthocyanin
biosynthetic genes in extreme phenotypes for berry pigmentation of naturally occurring
grapevines. BMC Plant Biol. 7:46.
Castellarin, S.D., Matthews, M.A., Di Gaspero, G. and Gambetta, G.A. (2007a) Water
deficits accelerate ripening and induce changes in gene expression regulating flavonoid
biosynthesis in grape berries. Planta 227: 101–112.
Castellarin, S.D., Pfeiffer, A., Sivilotti, P., Degan, M., Peterlunger, E., Di Gaspero, G.
(2007b). Transcriptional regulation of anthocyanin biosynthesis in ripening fruit of
grapevine under seasonal water deficit. Plant, Cell and Environment 30: 1381–1399.
Castia, T., Franco, M.A., Mattivi, F., Muggiolu, G., Sferlazzo, G., Versini, G. (1992).
Characterization of grapes cultivated in Sardinia: Chemometric methods applied to the
anthocyanic fraction. Sciences des Aliments, Paris 12:239-255.
Cerovic, Z.G., Goutouly, J.-P., Hilbert, G., Destrac-Irvine, A., Martinon, V. and Moise, N.
(2009). Mapping winegrape quality attributes using portable fluorescence-based sensors.
FRUTIC 09, Conception, Chile (Progap INIA, Chillian, Chile: City) 301–310.
Cerovic, Z.G., Moise, N., Agati, G., Latouche, G., Ben Ghozlen, N. and Meyer, S. (2008)
New portable optical sensors for the assessment of winegrape phenolic maturity based on
berry fluorescence. Journal of Food Composition and Analysis 21: 650–654.
Cerovic, Z.G., Ounis, A., Cartelat, A., Latouche, G., Goulas, Y., Meyer, S. and Moya, I.
(2002). The use of chlorophyll fluorescence excitation spectra for the non-destructive in
situ assessment of UV-absorbing compounds in leaves. Plant, Cell and Environment 25:
1663–1676.
Cerovic, Z.G., Samson, G., Morales, F., Tremblay, N. and Moya, I. (1999). Ultraviolet
induced fluorescence for plant monitoring: present state and prospects. Agronomie:
Agriculture and Environment 19: 543–578.
Chapman, D.M., Roby, G., Ebeler, S.E., Guinard, J.X., Matthews, M.A. (2005). Sensory
attributes of Cabernet Sauvignon wines made from vines with different water status.
Australian Journal of Grape and Wine Research 11: 339-347.
Chatelet, D.S., Rost, T.L., Matthews, M.A., Shackel, K.A. (2008). The peripheral xylem of
grapevine (Vitis vinifera) berries. 2. Anatomy and development. Journal of Experimental
Botany 59: 1997–2007.
Chaves, M.M., Flexas, J., Pinheiro, C. (2009). Photosynthesis under drought and salt
stress: regulation mechanisms from whole plant to cell. Annals of Botany 103: 551–560.
91
Chaves, M.M., Oliveira, M.M. (2004). Mechanisms underlying plant resilience to water
deficits – Prospects for water-saving agriculture. Journal Experimental Botany 55: 2365–
2384.
Chaves, M.M., Pereira, J.S., Maroco, J. (2003). Understanding plant response to drought –
from genes to the whole plant. Functional Plant Biology 30: 239–264.
Chaves, M.M., Santos, T.P., Souza, C.R.,(2007). Deficit irrigation in grapevine improves
water-use efficiency while controlling vigour and production quality. Annals of Applied
Biology 150: 237–252.
Chaves, M.M., Tenhunen, J.D., Harley, P., Lange, O.L. (1987). Gas exchange studies in
two portuguese grapevine cultivars. Physiologia Plantarum 70: 639–647.
Chaves M. M., Zarrouk, O., Francisco, R., Costa, J. M., Santos, T., Regalado, A. P.,
Rodrigues, M. L. (2010). Grapevine under deficit irrigation: hints from physiological and
molecular data. Annals of Botany 105: 661–676.
Chouzouri, A., Schultz, H.R. (2005). Hydraulic anatomy, cavitation susceptibility and gas-
exchange of several grapevine varieties. Acta Horticulturae 689: 71–78.
Cifre, J., Bota, J., Escalona, J.M., Medrano, H. and Flexas, J. (2005). Physiological tools
for irrigation scheduling in grapevine (Vitis vinifera L.) An open gate to improve water-
use efficiency? Agriculture Ecosystems & Environment 106: 159–170.
Conde, C., Silva, P., Fontes, N., Dias, A.C.P., Tavares, R.M., Sousa, M.J., Agasse, A.,
Delrot, S. and Gerós, H. (2007). Biochemical changes throughout grape berry
development and fruit and wine quality. Food 1: 1–22.
Coombe, B.G. (1976). The development of fleshy fruits. Annual Review of Plant
Physiology 27: 207–228.
Coombe, B.G. (1992). Research on the development and ripening of the grape berry.
American Journal of Enology and Viticulture 43: 101–110.
Cramer G. R. (2010). Abiotic stress and plant responses from the whole vine to the genes.
Australian Journal of Grape and Wine Research 16: 86-93.
Cramer, G. R., Ali E., Grimplet J., Tillett R. L. et al. (2007). Water and salinity stress in
grapevines: early and late changes in transcript and metabolite profiles. Funct. Integr.
Genomics 7:111–134.
Cuevas, E., Baeza, P. and Lissarrague, J.R. (2006). Variation in stomatal behaviour and gas
exchange between mid-morning and mid-afternoon of north–south oriented grapevines

92
(Vitis vinifera L. cv. Tempranillo) at different levels of soil water availability. Scientia
Horticulturae 108: 173–18.
Davies, W.J., Wilkinson, S., Loveys, B. (2002). Stomatal control by chemical signalling
and the exploitation of this mechanism to increase water use efficiency in agriculture.
The New Phytologist 153: 449–460.
Davies, K.M., Schwinn, K.E., Deroles, S.C., Manson, D.G., Lewis, D.H., Bloor, S.J. and
Bradley, J.M. (2003). Enhancing anthocyanin production by altering competition for
substrate between flavonol synthase and dihydroflavonol 4-reductase. Euphytica 131:
259–268.
Deluc, L. G., Grimplet, J., Wheatley, M. D., Tillett, R. L., Quilici, D. R., Osborne, C.,
Schooley, D. A, Schlauch, K. A, Cushman, J. C. and Cramer, G. R. (2007).
Transcriptomic and metabolite analyses of Cabernet Sauvignon grape berry
development. BMC Genomics, 8:429
Deluc, L. G, Quilici, D. R, Decendit, A., Grimplet, J., Wheatley, D. M., Schlauc, K. A.,
Mérillon, J. M., Cushman, J. C. and Cramer G. R. (2009). Water deficit alters
differentially metabolic pathways affecting important flavor and quality traits in grape
berries of Cabernet Sauvignon and Chardonnay. BMC Genomics, 10:212-245.
Di Stefano, R., Mattivi, F., Caburazzi, M., Giustini, E. and Bonifazi, L. (2008). Evoluzione
della composizione fenolica dell’uva Sagrantino durante la maturazione. Rivista di
Viticoltura e di Enologia 1: 39–61.
Dixon, R.A., Xie, D.Y., Sharma, S.B. (2005). Proanthocyanidins: a final frontier in
flavonoid research? New Physiologist 165: 9–28.
Dokoozlian, N.K., Kliewer, W.M. (1996). Influence of light on grape berry growth and
composition varies during fruit development. Journal of the American Society of
Horticultural Science 121: 869–874.
Downey, M.O., Dokoozlian, N.K., Krstic, M.P. (2006). Cultural practice and
environmental impacts on the flavonoid composition of grapes and wine: a review of
recent research. American Journal of Enology and Viticulture 57: 257–268.
Downey, M.O., Harvey, J.S., Robinson, S.P. (2003). Analysis of tannins in seeds and skins
of Shiraz grapes throughout berry development. Australian Journal of Grape and Wine
Research 9: 15–27.
.

93
Dry, P. and Loveys, B.R. (1998). Factors influencing grapevine vigour and the potential
for control with partial rootzone drying. Australian Journal of Grape and Wine Research
4: 140–148.
Dry, P.R., Loveys, B.R., McCarthy, M.G., Stoll, M. (2001). Strategic irrigation
management in Australian vineyards. Journal International de Science de la Vigne et du
Vin 35: 129–139.
Dry, P., Loveys, B., Botting, D. & During, H. (1996). Effects of partial root-zone drying on
grapevine vigour, yield, composition of fruit and use of water. Proceedings of 9th
Australian Wine Ind. Tech. Conf., July 1985, Adelaide, Australia 128 – 131
Du, Toit, P.G., Dry, P.R., Loveys, B. (2003). A preliminary investigation on partial
rootzone drying (PRD): effects on grapevine performance, nitrogen assimilation and
berry composition. S. Afr. J. Enol. Vitic. 24: 43-54.
Düring, H., Loveys, B.R. and Dry, P.R. (1996). Root signals affect water use efficiency
and shoot growth. Acta Horticulturae 427: 1–14.
Esteban, M.A., Villanueva, M.J., Lissarrague, J.R. (1999). Effect of irrigation on changes
in berry composition of Tempranillo during maturation. Sugars, organic acids, and
mineral elements. American Journal of Enology and Viticulture 50: 418–434.
Flexas, J., Bota, J., Escalona, J.M., Sampol, B., Medrano, H. (2002). Effects of drought on
photosynthesis in grapevines under field conditions: an evaluation of stomatal and
mesophyll limitations. Functional Plant Biology 29 : 461–471.
Fregoni, M. (2005) Viticoltura di qualità (Tecniche Nuove: Milano).
Galet, P. (2000). Précis de viticulture, 7th edn. Montpellier: Imprimerie Déhan. Gamalei Y.
1989. Structure and function of leaf minor veins in trees and herbs. A taxonomic review.
Trees 3: 96–110.
Gaudillère, J.P., Van Leeuwen, C., Ollat, N. (2002). Carbon isotope composition of sugars
in grapevine, an integrated indicator of vineyard water status. Journal of Experimental
Botany 53: 757–763.
Geny, L., Saucier, C., Bracco, S., Daviaud, F., Glories, Y. (2003). Composition and
cellular localization of tannins in grape seeds during maturation. Journal of Agricultural
and Food Chemistry 51: 8051–8054.
Gishen, M., Dambergs, R.G. and Cozzolino, D. (2005) Grape and wine analysis enhancing
the power of spectroscopy with chemometrics. A review of some applications in the
Australian wine industry. Australian Journal of Grape and Wine Research 11: 296–305.

94
Gollop, R., Even, S., Colova-Tsolova, V., Perl, A. (2002). Expression of the grape
dihydroflavonol reductase gene and analysis of its promoter region. Journal of
Experimental Botany 53: 1397–1409.
Gollop, R., Farhi, S., Perl, A. (2001). Regulation of the leucoanthocyanidin dioxygenase
gene expression in Vitis vinifera. Plant Science 161: 579–588.
Gomez-Ariza, J. L., Garcia-Barrera, T., Lorenzo, F. (2006). Anthocyanins profile as
fingerprint of wines using atmospheric pressure photoionisation coupled to quadrupole
time-of-flight mass spectrometry. Analytica Chimica Acta 570 (1): 101-108.
González-Neves, G., Franco, J., Barreiro, L., Gil, G., Moutounet, M. and Carbonneau,
A. (2006). Varietal differentiation of Tannat, Cabernet-Sauvignon and Merlot grapes and
wines according to their anthocyanic composition European Food Research and
Technology Volume 225, Number 1: 111-117.
Grimplet, J., Deluc, L. G., Tillett, R. L., Wheatley, M. D., Schlauch, K. A, Cramer, G. R
and Cushman, J. C. (2007b). Tissue-specific mRNA expression profiling in grape berry
tissues. BMC Genomics 8:187
Holbrook, N.M., Shashidhar, V.R., James, R.A., Munns, R. (2002). Stomatal control in
tomato with ABA-deficient roots: response of grafted plants to soil drying. Journal of
Experimental Botany 53: 1503–1514.
Jaakola, L., Määttä-Riihinen, K., Kärenlampi, S. and Hohtola, A. (2004). Activation of
flavonoid biosynthesis by solar radiation in bilberry (Vaccinium myrtillus L.) leaves.
Planta 218: 721–728.
Jeong, S.T., Goto-Yamamoto, N., Hashizume, K., Esaka, M. (2006). Expression of the
flavonoid 3’-hydroxylase and flavonoid 3’,5’-hydroxylase genes and flavonoid
composition in grape (Vitis vinifera). Plant Science 170: 61–69.
Jones, G.V., White, M.A., Owen, R.C., Storchmann, C. (2005). Climate change and global
wine quality. Climate Change 73: 319–343.
Kallithraka, S., Aliaj, L., Makris, D. P., Kefalas, P. (2009). Anthocyanin profiles of major
red grape (Vitis vinifera L.) varieties cultivated in Greece and their relationship with in
vitro antioxidant characteristics. International Journal of Food Science and Technology
44 (12): 2385-2393.
Keller, M., Smith, J.P., Bondada, B.R. (2006). Ripening grape berries remain hydraulically
connected to the shoot. Journal of Experimental Botany 57: 2577–2587.

95
Keller, M. (2005). Deficit irrigation and vine mineral nutrition. American Journal of
Enology and Viticulture 56: 267–283.
Kennedy, J.A., Matthews, M.A., Waterhouse, A.L. (2000). Changes in grape seed
polyphenols during fruit ripening. Phytochemistry 55: 77–85.
Kennedy, J.A., Matthews, M.A. and Waterhouse, A.L. (2002) Effect of maturity and vine
water status on grape skin and wine flavonoids. American Journal of Enology and
Viticulture 53: 268–274.
Kolb, C.A., Wirth, E., Kaiser, W.M., Meister, A., Riederer, M. and Pfündel, E.E. (2006)
Non invasive evaluation of the degree of ripeness in grape berries (Vitis vinifera L. cv.
Bacchus and Silvaner) by chlorophyll fluorescence. Journal of Agricultural and Food
Chemistry 54: 299–305.
Lawlor, D.W., Tezara, W. (2009). Causes of decreased photosynthetic rate and metabolic
capacity in water-deficient leaf cells: a critical evaluation of mechanisms and integration
of processes. Annals of Botany 103: 561–579.
Lenk, S., Buschmann, C. and Pfündel, E.E. (2007). In vivo assessing flavonols in white
grape berries (Vitis vinifera L. cv. Pinot Blanc) of different degrees of ripeness using
chlorophyll fluorescence imaging. Functional Plant Biology 34: 1092–1104.
López, M. I., Sánchez, M. T., Díaz A., Ramírez P., José M. (2007). Influence of a deficit
irrigation regime during ripening on berry composition in grapevines (Vitis vinifera L.)
grown in semi-arid areas. International Journal of Food Sciences and Nutrition 58(7):
491 - 507
Lovisolo, C., Perrone, I., Carra, A., Ferrandino A., Flexas J., Medrano H., Schubert A.
(2010). Drought-induced changes in development and function of grapevine (Vitis spp.)
organs and in their hydraulic and non hydraulic interactions at the whole plant level: a
physiological and molecular update. Functional Plant Biology 37: 98-116.
Lovisolo, C., Schubert, A. (1998). Effects of water stress on vessel size and xylem
hydraulic conductivity in Vitis vinifera L. Journal of Experimental Botany 49: 693–700.
Lovisolo, C., Secchi, F., Cardini, A., Salleo, S., Buffa, R., Schubert, A. (2007). Expression
of PIP1 and PIP2 aquaporins is enhanced in olive dwarf genotypes and is related to root
and leaf hydraulic conductance. Physiologia Plantarum 130: 543–551.
Lücker, J., Martens, S., Lund, S. T. (2010). Characterization of a Vitis vinifera cv.
Cabernet Sauvignon 3’,5’-O-methyltransferase showing strong preference for
anthocyanins and glycosylated flavonols. Phytochemistry 71:1474–1484

96
Lücker, J., Laszczak, M., Smith, D., Lund, S.T. (2009). Computational approach to the
generation of an improved predicted peptide database from EST data and application to
iTRAQ analyses in grape (Vitis vinifera cv. Cabernet Sauvignon) berries at ripening
initiation. BMC Genomics 10:50.
Lund, S.T., Peng, F.Y., Nayar, T., Reid, K.E., Schlosser, J. (2008). Gene expression
analyses in individual grape (Vitis vinifera L.) berries during ripening initiation reveal
that pigmentation intensity is a valid indicator of developmental staging within the
cluster. Plant Molecular Biology 68:301-315.
Maroco, J.P., Rodrìgues, M.L., Lopes, C., Chaves, M.M. (2002). Limitations to leaf
photosynthesis in field-grown grapevine under drought – metabolic and modelling
approaches. Functional Plant Biology 29: 451–459.
Marsal, J., Mata, M., del Campo, J., (2008). Evaluation of partial rootzone drying for
potential field use as a deficit irrigation technique in commercial vineyards according to
two different pipeline layouts. Irrigation Science 26: 347–356.
Matthews, M.A., Anderson, M.M. (1989). Reproductive development in grape (Vitis
vinifera L.): responses to seasonal water deficits. American Journal of Enology and
Viticulture 40: 52–60.
Matthews, M.A., Nuzzo, V. (2007). Berry size and yield paradigms on grapes and wines
quality. Acta Horticulturae 754: 423–436.
Mattivi, F., Guzzon, R., Vrhovsek, U., Stefanini, M., and Velasco, R. (2006). Metabolite
Profiling of Grape: Flavonols and Anthocyanins. Journal of Agricultural and Food
Chemistry 54 (20): 7692-7702
Mattivi, F., Scienza, A., Failla, O., Villa, P., Anzani, R., Tedesco, G., Gianazza, E.,
Righetti, P. (1990). Vitis vinifera, a chemotaxonomic approach: Anthocyanins in the skin
Vitis. Special Issue 119-133.
Medrano, H., Escalona, J.M., Cifre, J., Bota, J. and Flexas, J. (2003). A ten-year study on
the physiology of two Spanish grapevine cultivars under field conditions: effects of water
availability from leaf photosynthesis to grape yield and quality. Functional Plant Biology
30: 607–619.
Merzlyak, M.N., Melø, T.B., Naqvi, K.R. (2008). Effect of anthocyanins, carotenoids, and
flavonols on chlorophyll fluorescence excitation spectra in apple fruit: signature analysis,
assessment, modelling, and relevance to photoprotection. Journal of Experimental
Botany 59: 349–359.
97
Moutinho-Pereira, J., Magalhães, N., Gonçalves, B., Bacelar, E., Brito, M., Correia, C.
(2007). Gas exchange and water relations of three Vitis vinifera L. cultivars growing
under Mediterranean climate. Photosynthetica 45: 202–207.
Moutinho-Pereira, J.M., Correia, C.M., Gonçalves B., Bacelar, E.A., Torres-Pereira, J.M.
(2004). Leaf gas exchange and water relations of grapevines grown in three different
conditions. Photosynthetica 42: 81–86.
Mulinacci, N., Ieri, F., Giaccherini, C., Innocenti, M., Andrenelli, L., Canova, G., Saracchi,
M. and Casiraghi, M.C. (2008). Effect of cooking on the anthocyanins, phenolic acids,
glycoalkaloids, and resistant starch content in two pigmented cultivars of Solanum
tuberosum L. Journal of Agricultural and Food Chemistry 56: 11830–11837.
Nicolosi Asmundo, C., Arena, E. and Grasso, A. (2007). Anthocyanic Profile of different
red grape varieties grown in Sicily. Acta Horticulturae (ISHS) 754:45-48
Ojeda, H., Andary, C., Kraeva, E., Carbonneau, A. and Deloire, A. (2002). Influence of
pre- and postvéraison water deficit on synthesis and concentration of skin phenolic
compounds during berry growth of Vitis vinifera L., cv Shiraz. American Journal of
Enology and Viticulture 53: 261–267.
Okamoto, G., Kuwamura, T. and Hirano, K. (2004). Effects of water deficit stress on leaf
and berry ABA and berry ripening in Chardonnay grapevines (Vitis vinifera). Vitis 43:
15–17.
Palliotti, A., Silvestroni, O., Petoumenou, D. (2009). Photosynthetic and photoinhibition
behavior of two field-grown grapevine cultivars under multiple summer stresses.
American Journal of Enology and Vitiulture 60: 189–198.
Poni, S., Bernizzoni, F., Civardi, S. (2007). Response of ‘Sangiovese’ grapevines to partial
rootzone drying: gas-exchange, growth and grape composition. Scientia Horticulturae
114: 96–103.
Remorini, D., Battelli, R., Tuccio, L., Ferroni, G., Massai, R. and Scalabrelli, G. (2010).
Applicazione di indicatori fisiologici nella gestione del deficit idrico della vite in pieno
campo. Italus Hortus 17: 224–228.
Roby, G., Harbertson, J. F., Adams, D. A. and Matthews, M. A. (2004). Berry size and
vine water deficits as factors in winegrape composition: Anthocyanins and tannins.
Australian Journal of Grape and Wine Research 10: 100–107.

98
Roby, G. and Matthews, M.A. (2004) Relative proportions of seed, skin and flesh, in ripe
berries from Cabernet Sauvignon grapevines grown in a vineyard either well irrigated or
under water deficit. Australian Journal of Grape and Wine Research 10: 74–82.
Rogiers, S.Y., Greer, D.H., Hutton, R.J., Landsberg, J.J. (2009). Does nigh-time
transpiration contribute to anisohydric behaviour in a Vitis vinifera cultivar? Journal
Experimental Botany 60: 3751–3763.
Santos, T., Lopes, C., Rodrigues, M.L. et al. (2003). Partial rootzone drying effects on
growth and fruit quality of field-grown grapevines (Vitis vinifera). Functional Plant
Biology 30: 663–671.
Santos, T., Lopes, C., Rodrigues, M.L., et al. (2005). Effects of partial rootzone drying
irrigation on cluster microclimate and fruit composition of Castelão field-grown
grapevines. Vitis 44: 117–125.
Santos, T., Lopes, C.M., Rodrigues, M.L., et al. (2007). Partial rootzone drying irrigation
affects cluster microclimate improving fruit composition of ‘Moscatel’ field-grown
grapevines. Scientia Horticulturae 112: 321–330.
Saracini, E., Tattini, M., Traversi, M.L., Vincieri, F.F. and Pinelli, P. (2005). Simultaneous
determination of ellagitannins, flavonoid glycosides and acyl-glycosyl flavonoids in
Cistus salvifolius L. leaves by HPLC-DAD and HPLC-MS. Chromatographia 62: 245–
249.
Scalabrelli, G., Loreti, F., Ferrosi, G., Vignai, R., Scali, M., Cresti, M., (2002). Stato
attuale delle ricerche sulla selezione clonale dell'Aleatico: aspetti agronomici e genetico-
molecolari. Atti Convegno Le Strade del Vino e le Vie del Mare, Elba (LI) 8-9 dicembre
2001. 14-27.
Scalabrelli, G., Loreti, F., Ferroni, G. (2004). La selezione clonale dell’Aleatico dell’Elba:
aspetti agronomici e ampelografici. Atti Convegno “Miglioramento qualitativo delle
produzioni vitivinicole e del materiale di propagazione” Quaderno ARSIA 1: 47-59.
Scalabrelli G., Remorini D., Tuccio L., Tonutti P., (2011). Qualità dell’uva e del vino e
interventi irrigui. Informatore Agrario 20: 2-9.
Schachtmann, D.P., Goodger, J.Q.D. (2008). Chemical root to shoot signalling under
drought. Trends in Plant Science 13: 281–287.
Schlauch, K. A, Cushman, J. C. and Cramer, G. R. (2007). Transcriptomic and metabolite
analyses of Cabernet Sauvignon grape berry development. BMC Genomics 8:429.

99
Schultz HR. (1996). Water relations and photosynthetic responses of two grapevine
cultivars of different geographical origin during water stress. Acta Horticulturae 427:
251–266.
Schultz, H.R. (2000). Climate change and viticulture: a European perspective on
climatology, carbon dioxide and UV-B effects. Australian Journal of Grape and Wine
Research 1: 1–12.
Schultz, H.R. (2003). Differences in hydraulic architecture account for near-isohydric and
anisohydric behaviour of two field-grown Vitis vinifera L. cultivars during drought.
Plant, Cell and Environment 26: 1393–1405.
Schultz, H.R. (2007). Climate change: implications and potential adaptation of vine growth
and wine composition. In: Proceedings Congress on Climate and Viticulture. Saragoza,
Centro Transferencia Agroalimentaria 87–92.
Sheltie, K.C. (2006). Vine and berry response of Merlot (Vitis vinifera L.) to differential
water stress. American Journal of Enology and Viticulture 57: 514–518.
Sivilotti, P., Bonetto, C., Paladin, M. and Peterlunger, E. (2005). Effect of soil moisture
availability on Merlot: from leaf water potential to grape composition. American Journal
of Enology and Viticulture 56: 9–18.
Soar, C.J., Speirs, J., Maffei, S.M., Penrose, A.B., McCarthy, M.G., Loveys, B.R. (2006).
Grape vine varieties Shiraz and Grenache differ in their stomatal response to VPD:
apparent links with ABA physiology and gene expression in leaf tissue. Australian
Journal of Grape and Wine Research 12: 2–12.
Souza, C.R., Maroco, J., Santos, T., et al. (2005a). Control of stomatal aperture and carbon
uptake by deficit irrigation in two grapevine cultivars. Agriculture, Ecosystems and
Environment 106: 261–274.
Souza, C.R., Maroco, J., Santos, T., et al. (2005b). Impact of deficit irrigation on water use
efficiency and carbon isotope composition (d13C) of field grown grapevines under
Mediterranean climate. Journal of Experimental Botany 56: 2163–2172.
Souza, C.R., Maroco, J.P., Santos, T., et al. (2003). Partial rootzone-drying: regulation of
stomatal aperture and carbon assimilation in field grown grapevines (Vitis vinifera cv
Moscatel). Functional Plant Biology 30: 653–662.
Sperry, J.S., Hacke, U.G., Comstock, J.P., Oren, R. (2002). Water deficits and hydraulic
limits to leaf water supply. Plant, Cell and Environment 25: 251–264.

100
Sperry, J.S. (1986). Relationship of xylem embolism to xylem pressure potential, stomatal
closure, and shoot morphology in the palm Rhapis excelsa. Plant Physiology 80: 110–
116.
Stoll, M., Loveys, B., Dry, P. (2000). Hormonal changes induced by partial rootzone
drying of irrigated grapevine. Journal of Experimental Botany 51: 1627–1634.
Storchi, P., Baldi, M., Faviere, V., Riannetti, F., Leporini, M., Peduto, F. (2008).
Valutazione del comportamento produttivo e della componente fenolica in vitigni a bacca
nera coltivati in Toscana Quaderno di Viticoltura ed Enologia Università di Torino 30:5-
21.
Syvertsen, J.P., Lloyd, J., McConchie, C., Kriedemann, P.E., Farquhar, G.D. (1995). On
the relationship between leaf anatomy and CO2 diffusion through the mesophyll of
hypostomatous leaves. Plant, Cell and Environment 18: 149–157.
Thomas, T.R., Matthews, M.A., Shackel, K.A. (2006). Direct in situ measurement of cell
turgor in grape (Vitis vinifera L.) berries during development and in response to plant
water deficits. Plant, Cell and Environment 29: 993–1001.
Tyerman, S.D., Niemietz, C.M. and Bramley, H. (2002). Plant aquaporins: multifunctional
water and solute channels with expanding roles. Plant, Cell and Environment 25: 173–
194.
Valenti L., Mattivi F., Mastromauro F., Anzani R., Scienza A. (1993). Italian wild
grapevine, Vitis vinifera silvestris, description by the aid of anthocyanic pigments
profiles. Vignevini, Bologna 20 (9): 42-47.
Vandeleur, R.K., Mayo, G., Shelden, M.C., Gilliham, M., Kaiser, B.N. and Tyerman, S.D.
(2008). The role of PIP aquaporins in water transport through roots: diurnal and drought
stress responses reveal different strategies between isohydric and anisohydric cultivars of
grapevine. Plant Physiology 645: 108–128.
Van Rooyen, P.C., Ellis, L.P. and Du Plessis, C.S. (1984). Interactions between grape
maturity indices and quality for Pinotage and Cabernet Sauvignon wines from four
localities. South African Journal of Enology and Viticulture 5: 29–34.
Versari, A., Parpinello, G.P., Tornelli, G.B., Ferrarini, R., Giulivo, C. (2001). Stilbene
compounds and stilbene synthase expression during ripening, wilting and UV treatment
in grape cv. Corvina. Journal of Agriculture and Food Chemistry 49: 5531–5536.
101
Walker, A.R., Lee, E., Bogs, J., McDavid, D.A.J., Thomasand, M.R., Robinson, S.P.
(2007). White grapes arose through the mutation of two similar and adjacent regulatory
genes. Plant Journal 49: 772–785.
Wample, R.L. and Smithyman, R. (2002). Regulated deficit irrigation as a water
management strategy in Vitis vinifera production. In: Deficit irrigation practices – FAO
water reports. (FAO: Rome, Italy) 89–100.
Wang, Z., Deloire, A., Carbonneau, A., Federdpiel, B., Lopez, F. (2003). An in vivo
experimental system to study sugar phloem unloading in ripening grape berries during
water deficiency stress. Annals of Botany 92: 523–528.
Webb, L.B., Whetton, P.H., Barlow, E.W.R. (2007). Modelled impact of future climate
change on the phenology of winegrapes in Australia. Australian Journal of Grape and
Wine Research 13: 165–175.
Xie, D.Y., Dixon, A. (2005). Proanthocyanidin biosynthesis-still more questions than
answers? Phytochemistry 66: 2127–2144.
Zamboni, A., Di Carli, M., Guzzo, F., Stocchero, M., Zenoni, S., Ferrarini, A., Tononi, P.,
Toffali, K., Desiderio, A., Lilley, K. S., Pé, M. E., Benvenuto, E, Delledonne, M. and
Pezzetti, M. (2010). Identification of Putative Stage-Specific Grapevine Berry
Biomarkers and Omics Data Integration into Networks Plant Physiology 154: 1439-1459.
Zamboni, A., Minoia, L., Ferrarini, A., Tornelli, G. B., Zago, E., Delledonne, M. and
Pezzetti M. (2008). Molecular analysis of post-harvest withering in grape by AFLP
transcriptional profiling. Journal of Experimental Botany 59(15): 4145–4159.
Zsòfi, Z, Gà, L., Szilàgyi, Z., et al. (2009a). Use of stomatal conductance and pre-dawn
water potential to classify terroir for the grape variety Kékfrankos. Australian Journal of
Grape and Wine Research 15: 36–47.


ACKNOWLEDGMENTS
I’m grateful to my supervisors prof. Scalabrelli and prof. Tonutti for the support and the
scientific advices during these doctorate years. Thanks to Dr. Lund for accepting me in the
lab, and to the whole dr. Lund's group (Carlo and Tanya in particular) for the great
opportunity they offered me to learn and to share research skills and for their friendship.
I also want to thank Dr. Remorini for the concrete help, especially during the in-field
experiments, Prof. Massai that contributed to set up the trial, and Dr. Agati for having
chosen me to cooperate in the study and in the application of the Multiplex sensor.
I also wish to thank Dr. Giannetti and Dr. Pinelli for the contribution in the Anthocyanins
profiling and to Dr. Martinelli and Dr. Tosetti for the help in the biomolecular analysis.
I wish to thank the Italian CNR through the ‘Ricerca Spontanea a Tema Libero’ grant, the
Foundation ‘Cassa di Risparmi di Livorno’ and ‘PRIN 08’ for the financial support and
Bulichella winery for hosting the trials.
Thanks to everybody who shared these PhD years with me at the Faculty, during classes, at
the Research Center of Viticulure and Oenology – San Piero a Grado, at the Scuola S.Anna
Biolabs, but also during the week-ends in Florence or in the long promenades in Pisa.
My enduring gratitude and love to Elisa, Gabriella, Maria Cielo, Giampy: I can say that it’s
true that the distance can’t change real friendship.