Embed Size (px)
Citation preview
1
S P R I N G 2 0 1 7
Alabama Public Opinion Survey
2
Alabama Public Opinion Survey
Spring 2017
Survey and analysis conducted by:
Dr. Randolph Horn Professor of Political Science
Director, Strategic and Applied Analysis Samford University
Published by the Public Affairs Research Council of Alabama
Ryan Hankins, Executive Director
3
PARCA’S MISSION The Public Affairs Research Council of Alabama provides independent, objective research,
evaluation, and analysis to improve public policy in Alabama.
PARCA’S HISTORY PARCA was founded in 1998 by former Alabama Governor Albert Brewer and a group of civic leaders,
including Tom Corts, Emil Hess, Henry McPherson, Jim North, Fred Renneker, III, William E. Smith, Jr.,
Jim H. White, III, and John Woods. In the almost 30 years since its founding, PARCA has become
Alabama’s trusted source for independent research and data analysis, respected by the leaders in the
public, private, and non-profit sectors and by those across the political spectrum.
PARCA’S WORK Data Analysis: Data should be a flashlight, not a hammer. PARCA provides complex data analysis to
illuminate opportunities and improve outcomes.
Research and Recommendations: Numbers may tell what, but they don’t tell why. PARCA seeks to
understand what is working, what is not working, and what changes might be feasible.
Performance Evaluation: Trying hard is not enough. PARCA works with nonprofits, schools, and
government agencies to define goals, measure accomplishments, and identify areas for
improvement.
Implementation Services: Policies and programs are only as good as their implementation. PARCA
works with administrators to design and implement evidence-based solutions.
PARCA’S FUNDING PARCA is a 501(c)(3) nonprofit corporation. Contract research projects and data analysis generate
approximately 40% of annual revenue. The remaining 60% of annual revenue is provided through
tax-deductible contributions from individuals, foundations, and corporations. These generous donors
ensure that PARCA can continue to provide objective, nonpartisan research for the public good. To
support the public research of PARCA, send contributions to P.O. Box 293931, Birmingham, Alabama
35229, or give online at www.parcalabama.org.
4
2017 Board of Directors
PHILIP DOTTS
PRESIDENT*
Managing Director
Public Financial
Management, Inc.
PRESTON BOLT
VICE-PRESIDENT*
Managing Partner
Hand Arendall
JESSE VOGTLE
IMMEDIATE PAST PRESIDENT*
Partner
Balch & Bingham
—
Fred Blackwell
President
Fred Blackwell Roofing
Fred O. Braswell, III
President & CEO
Alabama Rural
Electric Association
William J. Canary
President & CEO
Business Council of Alabama
Bob Davis
Associate Publisher/Editor
The Anniston Star
David Donaldson*
VP of Governmental &
Community Relations
Vulcan Materials Company
Bruce P. Ely
Partner
Bradley Arant
Boult Cummings
Tyrone Fenderson, Jr.*
Senior Vice-President
BBVA Compass Bank
Ann D. Florie
Executive Director
Leadership Birmingham
Kevin R. Garrison+
Attorney
Baker, Donelson, Bearman,
Caldwell & Berkowitz
Robert A. Gates
Executive Vice President
Wells Fargo Bank
Betsy Bugg Holloway. Ph.D.*
Vice President Marketing and
Communication
Samford University
Ashley Hugunine+
Attorney
Baker, Donelson, Bearman,
Caldwell & Berkowitz
Donny Jones
COO
Chamber of Commerce
of West Alabama
Barbara W. Larson
Executive Director
Leadership Alabama
Deborah J. Long*
Exec. VP, Secretary, &
Chief Legal Officer
Protective Life Corporation
Gordon Martin
Senior Vice President, Corporate &
Administrative Services
Alabama Power Company
Larkin Martin*
Managing Agent
Martin Farms
Fred McCallum, Jr.
President
AT&T Alabama
Scott McLain
Principal and Managing Broker
Coldwell Banker Commercial
McLain Real Estate
David Muhlendorf
President & CEO
LDM Company, Retired
Jerry W. Powell
General Counsel
Cadence Bank, N.A.
J.T. Price*
CEO
McKinney Capital
Dudley Reynolds
CEO
Alagasco, Retired
Clint Shelton
Publisher
The Decatur Daily
J. Robin Stone
Vice President, Gov’t Affairs
Blue Cross/Blue Shield of Alabama
John M. Turner, Jr.
Senior Executive VP & Head of Corporate
Banking Group
Regions Financial Corporation
Lynne Berry Vallely
Realtor
Berry Millsaps Properties
Neal Wade
Director, Economic
Development Academy
University of Alabama
Andrew Westmoreland, Ed.D
President
Samford University
James H. White, III*
Chairman
Porter, White & Company
*Executive Committee
+Ex Officio, PARCA Roundtable
5
T A B L E O F C O N T E N T S
6
List of Figures
7 Introduction
8 Major Areas of State Investment
12 Revenue
15 Public Education
22 Public Connection to State Officials
24 Conclusion
6
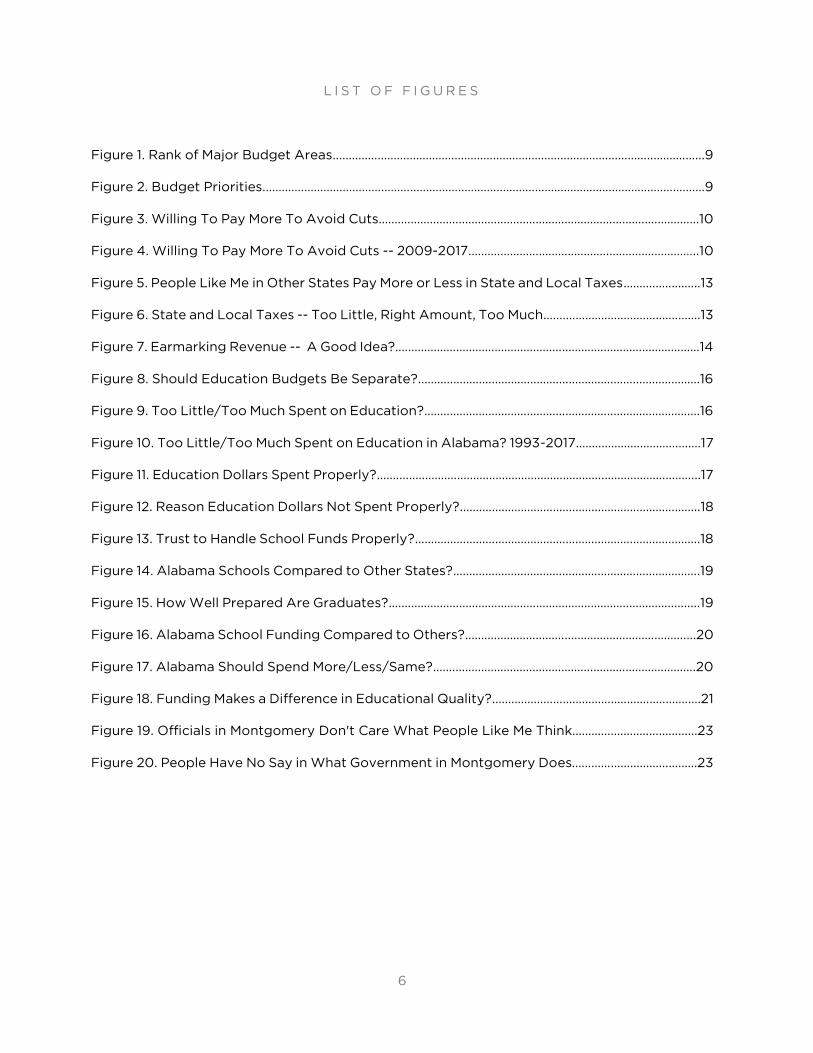
L I S T O F F I G U R E S
Figure 1. Rank of Major Budget Areas..……………………………………………………………………………………...…………...9
Figure 2. Budget Priorities.………………………………………………………………………………………………………….…….………9
Figure 3. Willing To Pay More To Avoid Cuts.……………………………………………………………………….…..…………10
Figure 4. Willing To Pay More To Avoid Cuts -- 2009-2017.……………………………………..……….……………..10
Figure 5. People Like Me in Other States Pay More or Less in State and Local Taxes.………..…….…..13
Figure 6. State and Local Taxes -- Too Little, Right Amount, Too Much.……………….…………….………….13
Figure 7. Earmarking Revenue -- A Good Idea?.…………………………………………………….……………………………14
Figure 8. Should Education Budgets Be Separate?..………………………………………….……….………………………16
Figure 9. Too Little/Too Much Spent on Education?..……………………………………….………..………………………16
Figure 10. Too Little/Too Much Spent on Education in Alabama? 1993-2017..…………………………….…17
Figure 11. Education Dollars Spent Properly?.……………………………………………………………..………………………..17
Figure 12. Reason Education Dollars Not Spent Properly?.………….………………………..…………………………..18
Figure 13. Trust to Handle School Funds Properly?.…………………….…………………………..………………………….18
Figure 14. Alabama Schools Compared to Other States?.…………………………………..……………….…………….19
Figure 15. How Well Prepared Are Graduates?.……………………………………………………..……………………..........19
Figure 16. Alabama School Funding Compared to Others?.………………………….………………………………....20
Figure 17. Alabama Should Spend More/Less/Same?.…………………………………………..………………………….20
Figure 18. Funding Makes a Difference in Educational Quality?.………………………………..…….….…..……….21
Figure 19. Officials in Montgomery Don't Care What People Like Me Think……………………………...…23
Figure 20. People Have No Say in What Government in Montgomery Does…………………………………23
7
I N T R O D U C T I O N
The Public Affairs Research Council of Alabama collaborated with Samford
University to conduct a telephone survey of Alabama citizens between
January 3, 2017 and January 28, 2017. The survey director was Dr. Randolph
Horn and was under the field direction of Grace Okoro. The statewide
random-digit dial survey of both cell phone and landlines produce 361
completed interviews yielding a margin of error of +/- 5.2%. Responses were
weighted by race and gender to match state demographics. The survey
addressed topics including state budget priorities, the quality of
representation in state government, and in partnership with the Alabama
Association of School Boards, questions about public education in Alabama.
8
Major Areas of State Investment
M A J O R A R E A S O F S T A T E I N V E S T M E N T
9
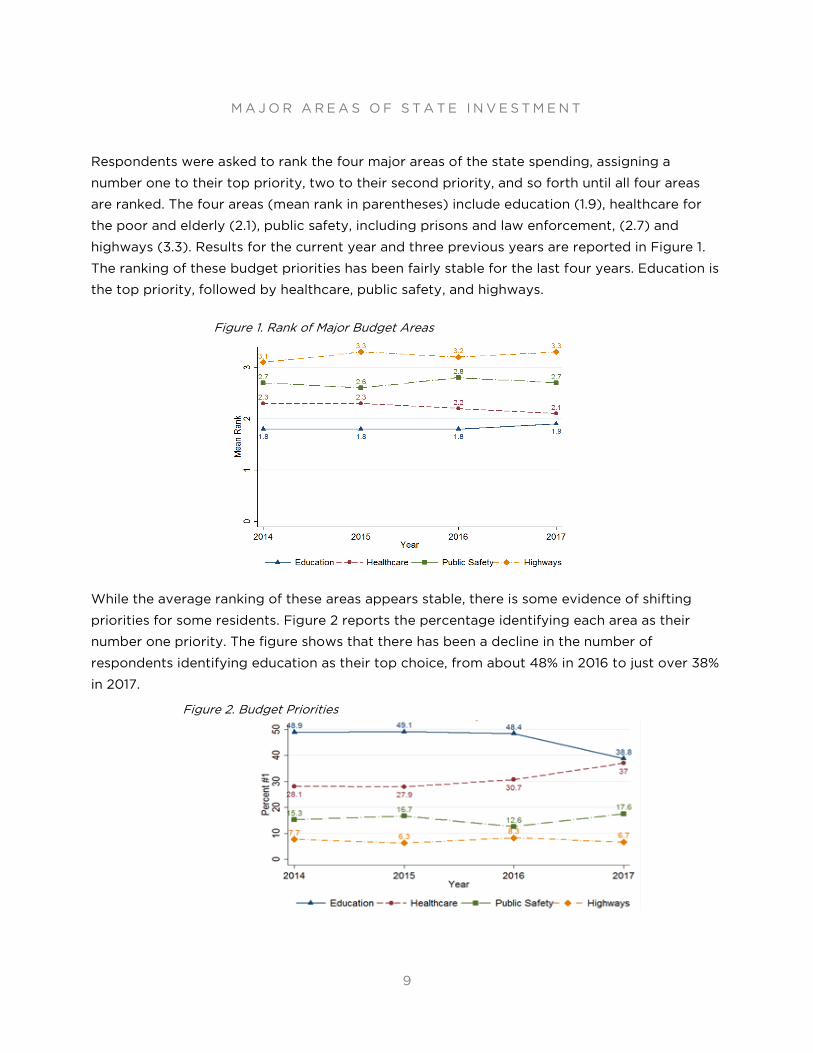
Respondents were asked to rank the four major areas of the state spending, assigning a
number one to their top priority, two to their second priority, and so forth until all four areas
are ranked. The four areas (mean rank in parentheses) include education (1.9), healthcare for
the poor and elderly (2.1), public safety, including prisons and law enforcement, (2.7) and
highways (3.3). Results for the current year and three previous years are reported in Figure 1.
The ranking of these budget priorities has been fairly stable for the last four years. Education is
the top priority, followed by healthcare, public safety, and highways.
While the average ranking of these areas appears stable, there is some evidence of shifting
priorities for some residents. Figure 2 reports the percentage identifying each area as their
number one priority. The figure shows that there has been a decline in the number of
respondents identifying education as their top choice, from about 48% in 2016 to just over 38%
in 2017.
Figure 2. Budget Priorities
Figure 1. Rank of Major Budget Areas
M A J O R A R E A S O F S T A T E I N V E S T M E N T
10
Similarly, there has been an increase in the proportion of respondents identifying healthcare as
the top priority, rising from about 31% in 2016 to about 37% in 2017. One possible explanation is
that discussion of healthcare in the presidential campaigns of 2016 and in the dawning of a new
administration have heightened concerns for some residents. For example, those with lower
incomes and lower levels of education are more likely to list healthcare as a top priority, so
those who are more vulnerable to changes in the healthcare system may be more likely to list it
as a top priority.
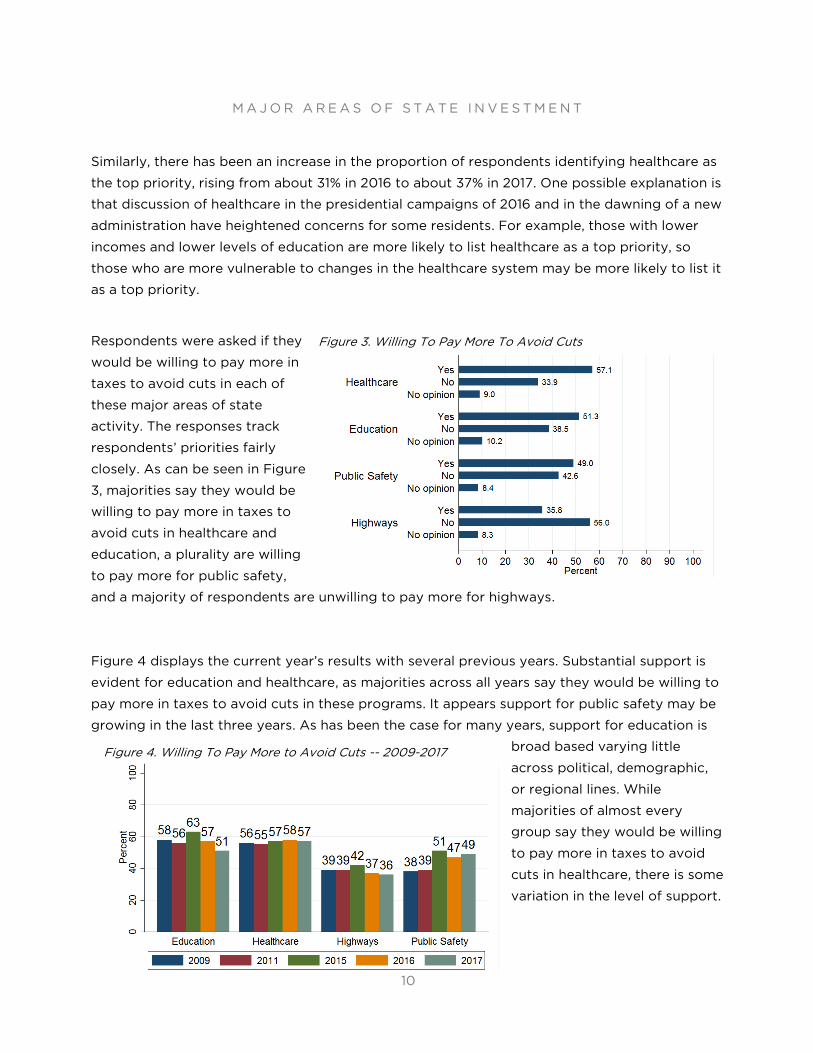
Respondents were asked if they
would be willing to pay more in
taxes to avoid cuts in each of
these major areas of state
activity. The responses track
respondents’ priorities fairly
closely. As can be seen in Figure
3, majorities say they would be
willing to pay more in taxes to
avoid cuts in healthcare and
education, a plurality are willing
to pay more for public safety,
and a majority of respondents are unwilling to pay more for highways.
Figure 4 displays the current year’s results with several previous years. Substantial support is
evident for education and healthcare, as majorities across all years say they would be willing to
pay more in taxes to avoid cuts in these programs. It appears support for public safety may be
growing in the last three years. As has been the case for many years, support for education is
broad based varying little
across political, demographic,
or regional lines. While
majorities of almost every
group say they would be willing
to pay more in taxes to avoid
cuts in healthcare, there is some
variation in the level of support.
Figure 3. Willing To Pay More To Avoid Cuts
Figure 4. Willing To Pay More to Avoid Cuts -- 2009-2017
M A J O R A R E A S O F S T A T E I N V E S T M E N T
11
Higher percentages of Democrats and Independents say they would be willing to pay more in
taxes to avoid cuts in healthcare. Similarly lower-income respondents are more willing to pay
more in taxes for healthcare than higher-income respondents. Finally, older respondents are
more willing to pay more for public safety than younger respondents.
12
Revenue

R E V E N U E
13
Previous PARCA research (see the December 2015 PARCA Perspective) has indicated that
Alabamians pay less in per capita state and local taxes than residents of most other states. We
asked respondents, “Thinking about how much you pay in state and local taxes here in
Alabama, do you think people like you in neighboring states pay more, less, or about the same
in state and local taxes?” Only 19% said they pay less than residents in other states (see Figure
5). About a third say
they pay about the
same, and just under a
third say they pay
more. There were no
significant differences
in this pattern across
and political,
demographic, or
regional
subpopulations.
Despite some reforms in recent decades, the tax system retains several regressive elements,
meaning that lower-income residents pay a larger proportion of their income in taxes than
those who are better off. For a discussion of state and local tax fairness, see the Institute on Tax
and Economic Policy, which in
recent years has included
Alabama in its “Terrible 10” list of
states with the most regressive
state and local tax systems. If
residents are shaky on the details
of comparative state revenue
systems, the results presented in
Figure 6 indicate they are aware
of the regressive nature of the
Alabama taxes. When asked if
people in different income
groups paid too much, too little, or the right amount in state and local taxes, pluralities
indicated that lower-income people paid too much, middle-income people paid about the right
amount, and a majority indicated that upper-income people paid too little. Those with lower
levels of education were more likely to think that they and people like them paid too much in
state and local taxes than others. Majorities of Independents and Democrats say that lower-
Figure 5. People Like Me in Other States Pay More or Less in State and Local Taxes
Figure 6131. State and Local Taxes -- Too Little, Right Amount, Too Much
R E V E N U E
14
income people pay too much in taxes, while a plurality of Republicans say lower-income people
pay the right amount. People who actually are low-income were more likely to say the poor
paid too much while pluralities in higher-income groups said the poor paid the right amount.
There was little systematic variation across subpopulation concerning the amount that upper-
income people pay in taxes except for party identification. A plurality of Republicans, about
two thirds of Independents, and about three quarters of Democrats say upper-income people
pay too little in state and local taxes.
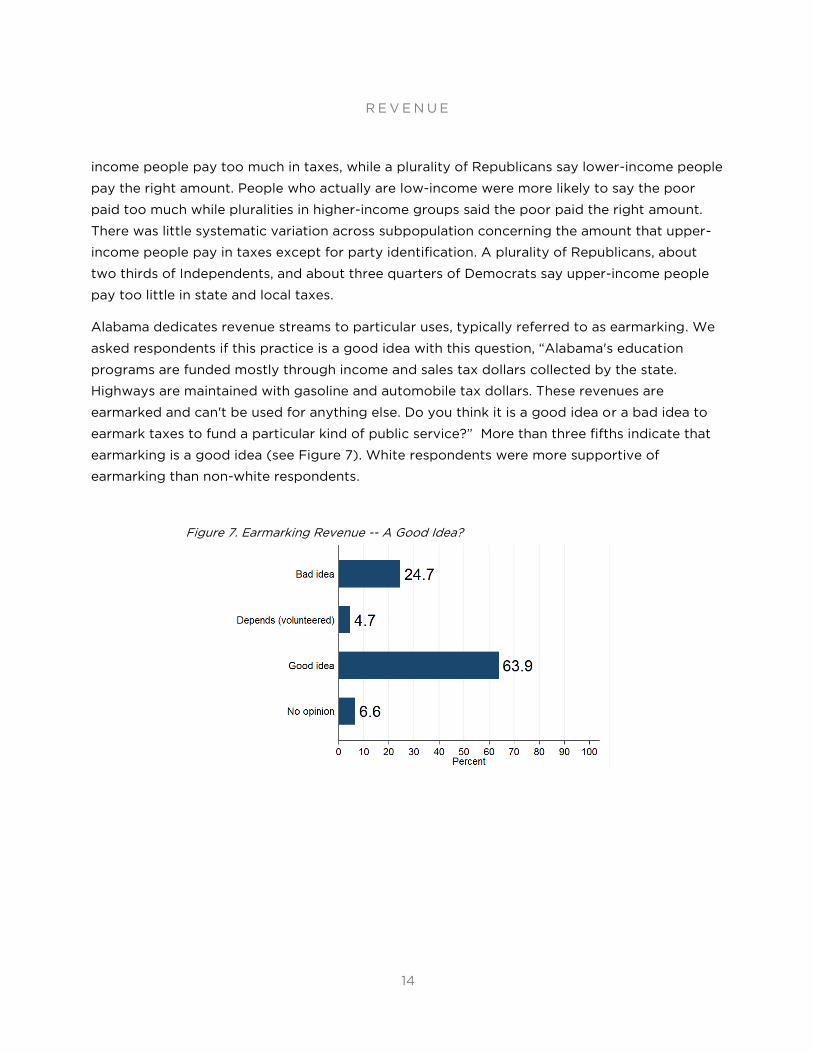
Alabama dedicates revenue streams to particular uses, typically referred to as earmarking. We
asked respondents if this practice is a good idea with this question, “Alabama's education
programs are funded mostly through income and sales tax dollars collected by the state.
Highways are maintained with gasoline and automobile tax dollars. These revenues are
earmarked and can't be used for anything else. Do you think it is a good idea or a bad idea to
earmark taxes to fund a particular kind of public service?” More than three fifths indicate that
earmarking is a good idea (see Figure 7). White respondents were more supportive of
earmarking than non-white respondents.
Figure 7. Earmarking Revenue -- A Good Idea?
15
Public Education
P U B L I C E D U C A T I O N
16
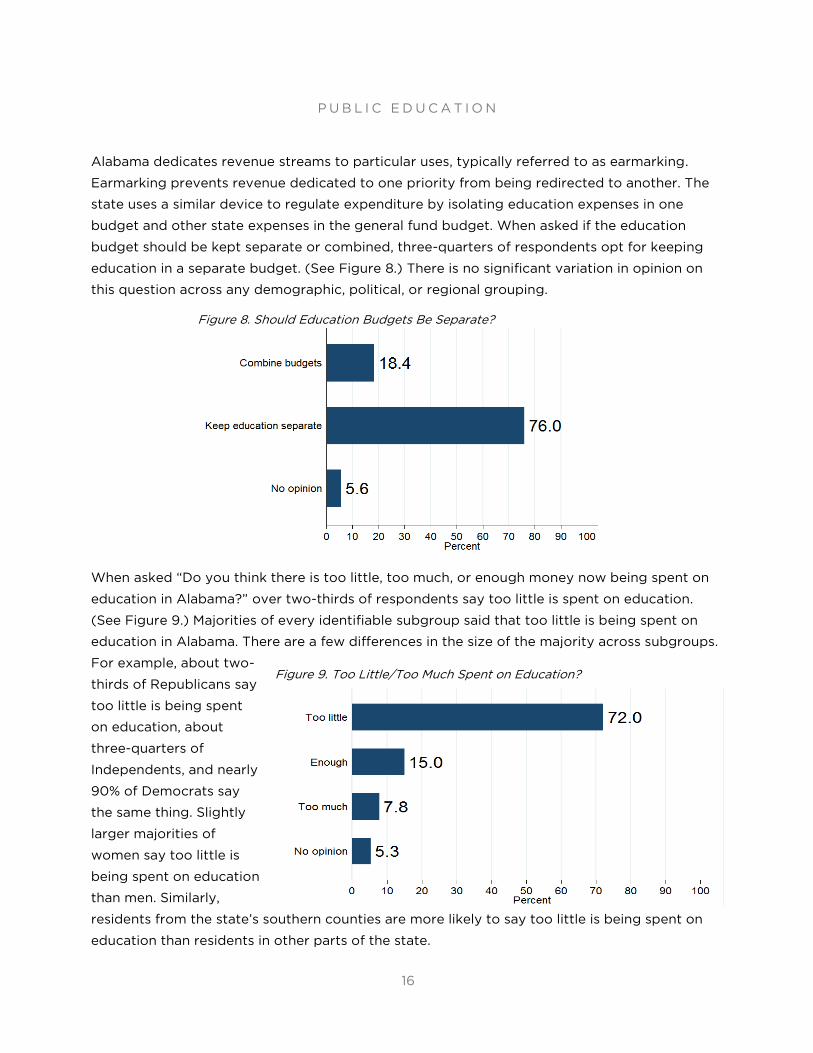
Alabama dedicates revenue streams to particular uses, typically referred to as earmarking.
Earmarking prevents revenue dedicated to one priority from being redirected to another. The
state uses a similar device to regulate expenditure by isolating education expenses in one
budget and other state expenses in the general fund budget. When asked if the education
budget should be kept separate or combined, three-quarters of respondents opt for keeping
education in a separate budget. (See Figure 8.) There is no significant variation in opinion on
this question across any demographic, political, or regional grouping.
When asked “Do you think there is too little, too much, or enough money now being spent on
education in Alabama?” over two-thirds of respondents say too little is spent on education.
(See Figure 9.) Majorities of every identifiable subgroup said that too little is being spent on
education in Alabama. There are a few differences in the size of the majority across subgroups.
For example, about two-
thirds of Republicans say
too little is being spent
on education, about
three-quarters of
Independents, and nearly
90% of Democrats say
the same thing. Slightly
larger majorities of
women say too little is
being spent on education
than men. Similarly,
residents from the state’s southern counties are more likely to say too little is being spent on
education than residents in other parts of the state.
Figure 9. Too Little/Too Much Spent on Education?
Figure 8. Should Education Budgets Be Separate?
P U B L I C E D U C A T I O N
17
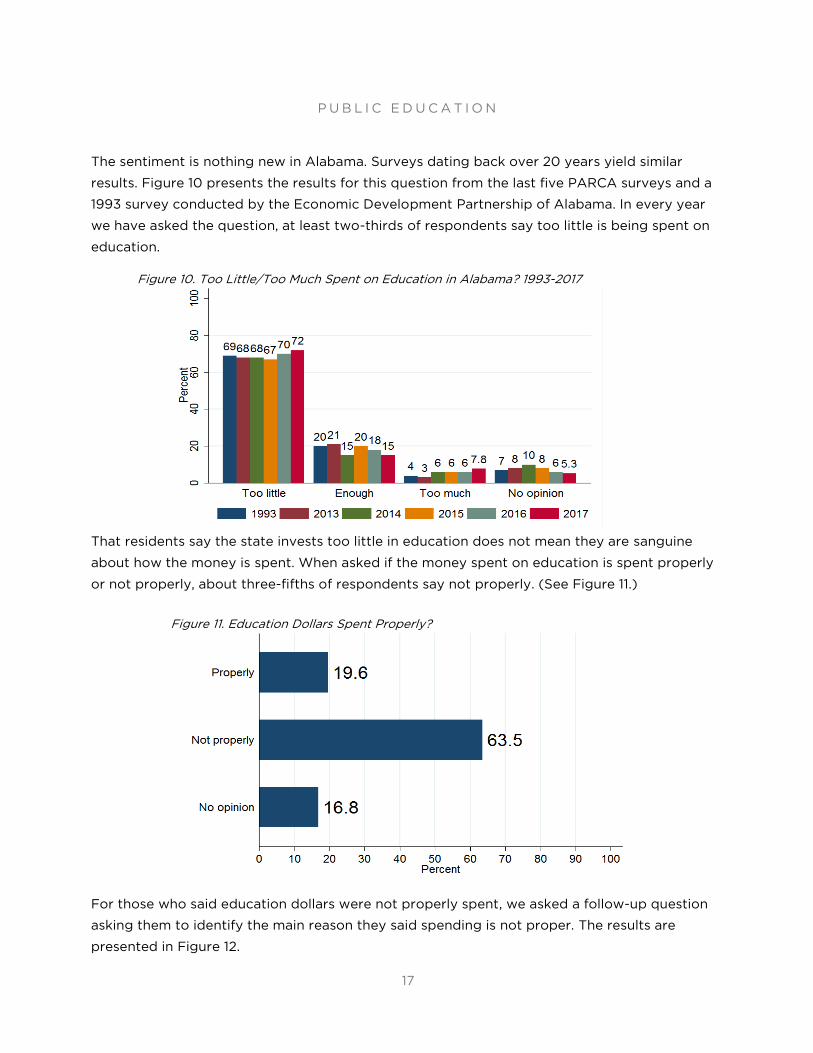
The sentiment is nothing new in Alabama. Surveys dating back over 20 years yield similar
results. Figure 10 presents the results for this question from the last five PARCA surveys and a
1993 survey conducted by the Economic Development Partnership of Alabama. In every year
we have asked the question, at least two-thirds of respondents say too little is being spent on
education.
That residents say the state invests too little in education does not mean they are sanguine
about how the money is spent. When asked if the money spent on education is spent properly
or not properly, about three-fifths of respondents say not properly. (See Figure 11.)
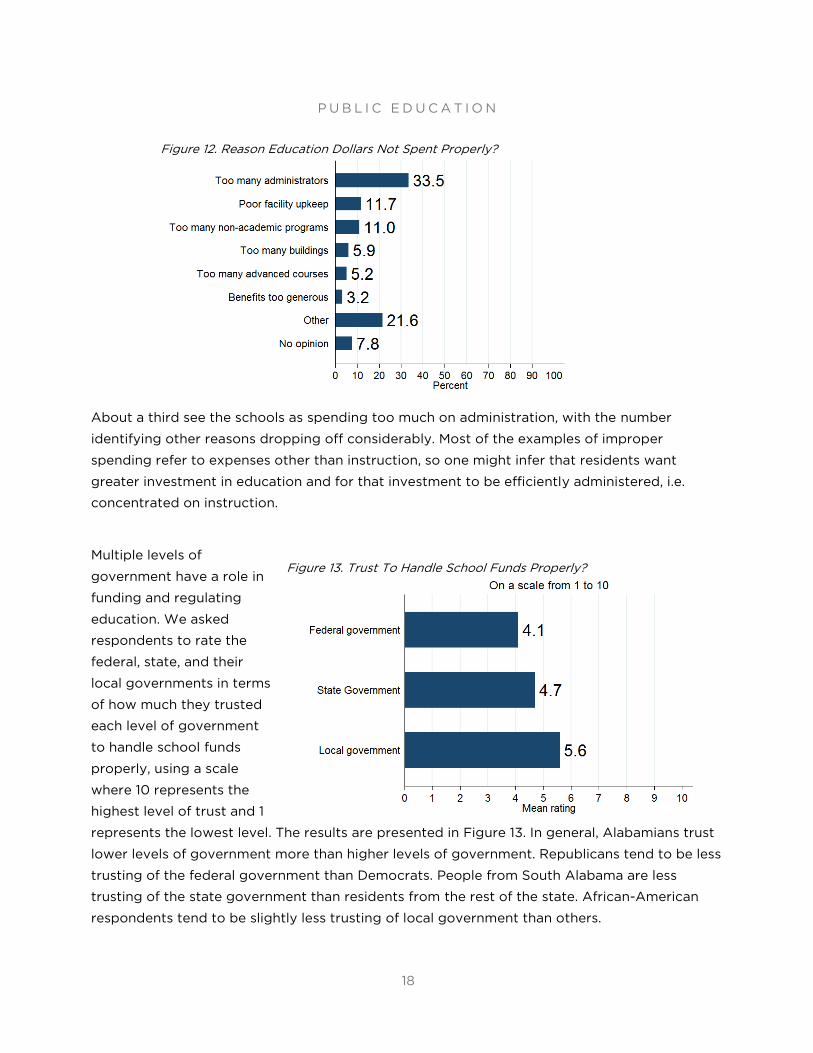
For those who said education dollars were not properly spent, we asked a follow-up question
asking them to identify the main reason they said spending is not proper. The results are
presented in Figure 12.
Figure 10. Too Little/Too Much Spent on Education in Alabama? 1993-2017
Figure 11. Education Dollars Spent Properly?
P U B L I C E D U C A T I O N
18
About a third see the schools as spending too much on administration, with the number
identifying other reasons dropping off considerably. Most of the examples of improper
spending refer to expenses other than instruction, so one might infer that residents want
greater investment in education and for that investment to be efficiently administered, i.e.
concentrated on instruction.
Multiple levels of
government have a role in
funding and regulating
education. We asked
respondents to rate the
federal, state, and their
local governments in terms
of how much they trusted
each level of government
to handle school funds
properly, using a scale
where 10 represents the
highest level of trust and 1
represents the lowest level. The results are presented in Figure 13. In general, Alabamians trust
lower levels of government more than higher levels of government. Republicans tend to be less
trusting of the federal government than Democrats. People from South Alabama are less
trusting of the state government than residents from the rest of the state. African-American
respondents tend to be slightly less trusting of local government than others.
Figure 13. Trust To Handle School Funds Properly?
Figure 12. Reason Education Dollars Not Spent Properly?
P U B L I C E D U C A T I O N
19
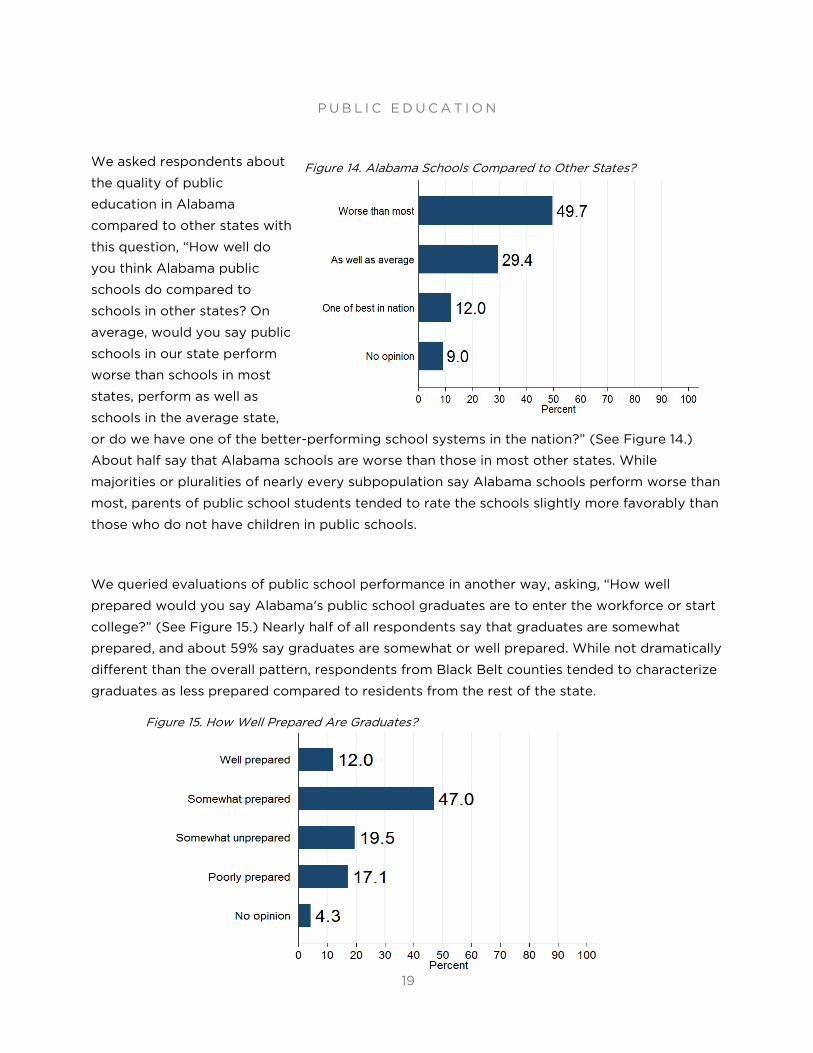
We asked respondents about
the quality of public
education in Alabama
compared to other states with
this question, “How well do
you think Alabama public
schools do compared to
schools in other states? On
average, would you say public
schools in our state perform
worse than schools in most
states, perform as well as
schools in the average state,
or do we have one of the better-performing school systems in the nation?” (See Figure 14.)
About half say that Alabama schools are worse than those in most other states. While
majorities or pluralities of nearly every subpopulation say Alabama schools perform worse than
most, parents of public school students tended to rate the schools slightly more favorably than
those who do not have children in public schools.
We queried evaluations of public school performance in another way, asking, “How well
prepared would you say Alabama's public school graduates are to enter the workforce or start
college?” (See Figure 15.) Nearly half of all respondents say that graduates are somewhat
prepared, and about 59% say graduates are somewhat or well prepared. While not dramatically
different than the overall pattern, respondents from Black Belt counties tended to characterize
graduates as less prepared compared to residents from the rest of the state.
Figure 14. Alabama Schools Compared to Other States?
Figure 15. How Well Prepared Are Graduates?
P U B L I C E D U C A T I O N
20
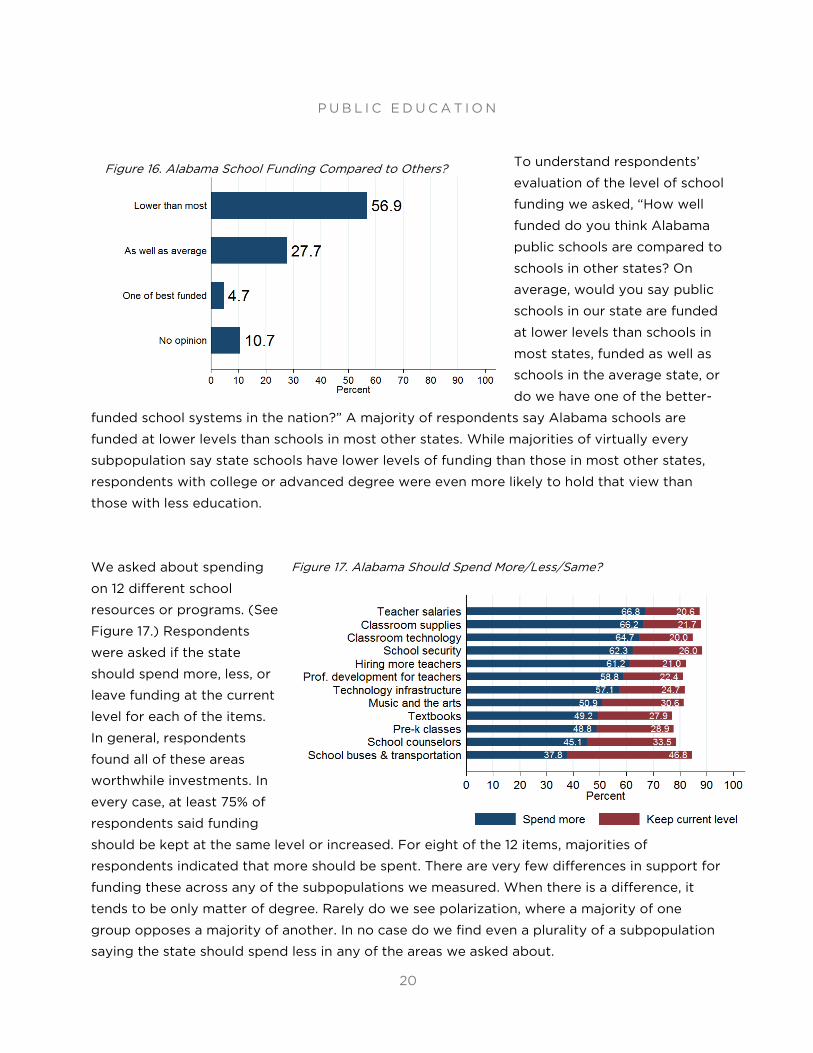
To understand respondents’
evaluation of the level of school
funding we asked, “How well
funded do you think Alabama
public schools are compared to
schools in other states? On
average, would you say public
schools in our state are funded
at lower levels than schools in
most states, funded as well as
schools in the average state, or
do we have one of the better-
funded school systems in the nation?” A majority of respondents say Alabama schools are
funded at lower levels than schools in most other states. While majorities of virtually every
subpopulation say state schools have lower levels of funding than those in most other states,
respondents with college or advanced degree were even more likely to hold that view than
those with less education.
We asked about spending
on 12 different school
resources or programs. (See
Figure 17.) Respondents
were asked if the state
should spend more, less, or
leave funding at the current
level for each of the items.
In general, respondents
found all of these areas
worthwhile investments. In
every case, at least 75% of
respondents said funding
should be kept at the same level or increased. For eight of the 12 items, majorities of
respondents indicated that more should be spent. There are very few differences in support for
funding these across any of the subpopulations we measured. When there is a difference, it
tends to be only matter of degree. Rarely do we see polarization, where a majority of one
group opposes a majority of another. In no case do we find even a plurality of a subpopulation
saying the state should spend less in any of the areas we asked about.
Figure 16. Alabama School Funding Compared to Others?
Figure 17. Alabama Should Spend More/Less/Same?
P U B L I C E D U C A T I O N
21
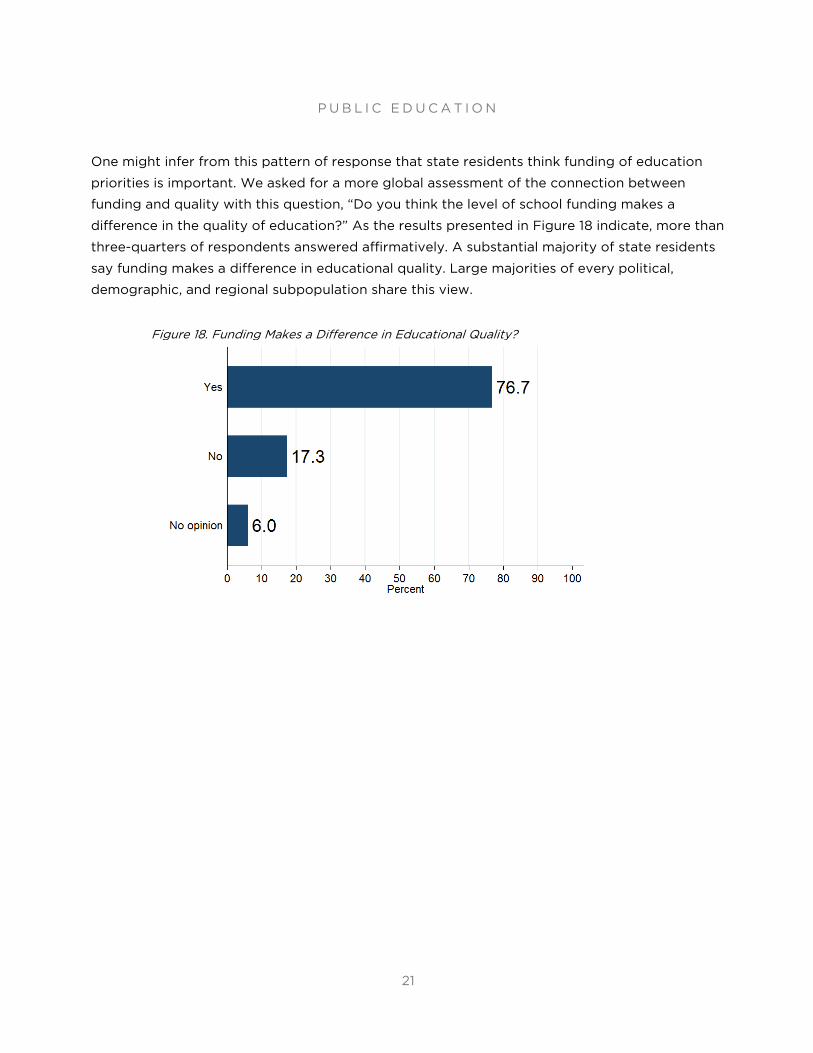
One might infer from this pattern of response that state residents think funding of education
priorities is important. We asked for a more global assessment of the connection between
funding and quality with this question, “Do you think the level of school funding makes a
difference in the quality of education?” As the results presented in Figure 18 indicate, more than
three-quarters of respondents answered affirmatively. A substantial majority of state residents
say funding makes a difference in educational quality. Large majorities of every political,
demographic, and regional subpopulation share this view.
Figure 18. Funding Makes a Difference in Educational Quality?
22
Public Connection to State Officials
P U B L I C C O N N E C T I O N T O S T A T E O F F I C I A L S
23
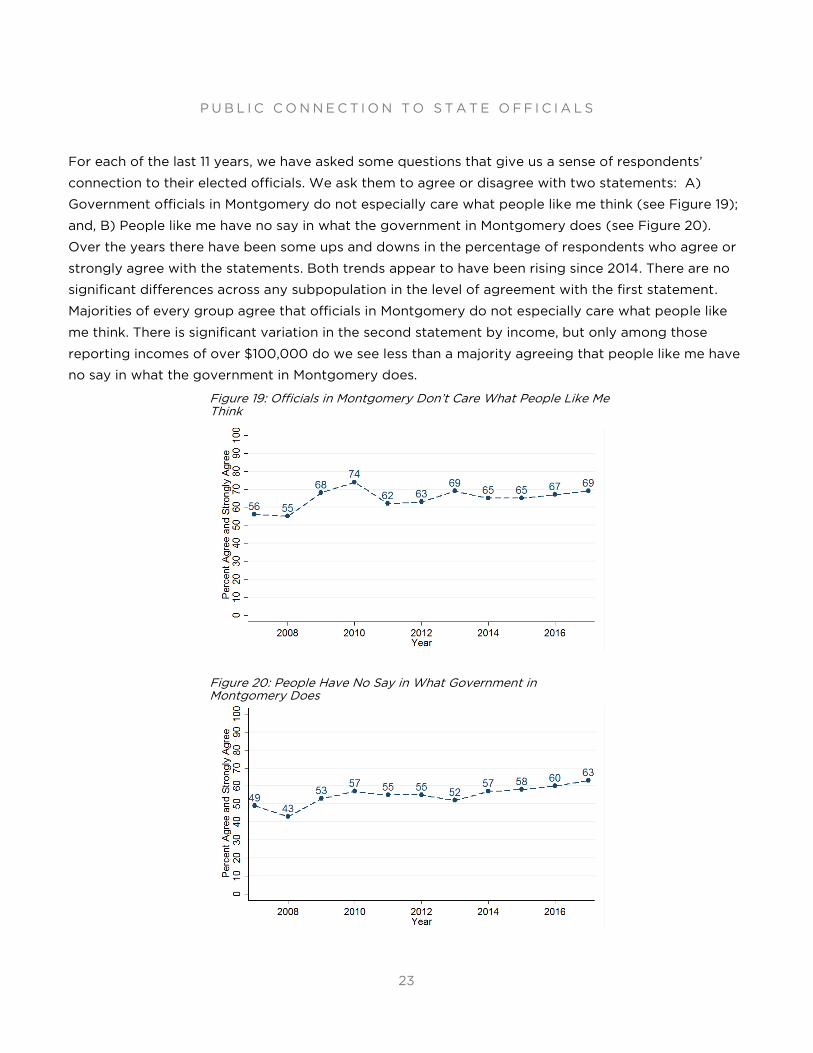
For each of the last 11 years, we have asked some questions that give us a sense of respondents’
connection to their elected officials. We ask them to agree or disagree with two statements: A)
Government officials in Montgomery do not especially care what people like me think (see Figure 19);
and, B) People like me have no say in what the government in Montgomery does (see Figure 20).
Over the years there have been some ups and downs in the percentage of respondents who agree or
strongly agree with the statements. Both trends appear to have been rising since 2014. There are no
significant differences across any subpopulation in the level of agreement with the first statement.
Majorities of every group agree that officials in Montgomery do not especially care what people like
me think. There is significant variation in the second statement by income, but only among those
reporting incomes of over $100,000 do we see less than a majority agreeing that people like me have
no say in what the government in Montgomery does.
Figure 19: Officials in Montgomery Don’t Care What People Like Me Think
Figure 20: People Have No Say in What Government in Montgomery Does
Conclusion
24
C O N C L U S I O N
25
Results from this year’s survey are consistent with previous years’ results in some important
ways. Residents value state investments in education and healthcare. They believe education is
inadequately funded. There is substantial evidence that respondents have limited faith in public
officials. Support for earmarking revenues and keeping the education budget separate from the
general fund may indicate concern that officials would misspend those resources if they could.
Majorities think the state government does not care what they think or that they have no say in
what the government does.
Public officials are in a difficult position. As Edmund Burke and others have noted, there is often
a tension between the preferences of constituents in a district and the collective interest of a
state or nation. Officials, seeing their colleagues defeated in primaries from the more extreme
wing of their parties, may underestimate the scope they have when working to solve important
public policy challenges. Similarly, officials may underestimate their capacity to educate their
constituents on what it may take to address the problems confronting the state. Results of
PARCA polls indicate many opportunities for officials to demonstrate responsiveness to public
concerns and leadership in crafting public policy solutions.
P.O. BOX 293931
800 LAKESHORE DRIVE
BIRMINGHAM, ALABAMA 35229
205-726-2482
PARCALABAMA.ORG