Embed Size (px)
Citation preview
Akorn, Inc. N a s d a q : A K R X
March 2014
Barclays Global Healthcare Conference

2
DISCLAIMER
• This presentation includes certain forward-looking statements regarding our views with respect to our business, operations, current and future acquisitions, economic model, and our expected performance for future periods, as well as the pharmaceutical industry conditions. These statements are intended as “forward-looking statements” under the Private Securities Litigation Reform Act of 1995.
• Actual results may differ materially from our expectations due to the risks, uncertainties and other factors that affect our business. These factors include, among others, changing market conditions in the overall economy and the industry; the success of implementing our corporate strategies; the effects of federal, state and other governmental regulation on our business; current and future litigation; the success of new acquisitions and new product launches; our success in developing, manufacturing, acquiring and marketing new products; the success of our strategic partnerships for the development and marketing of new products; our ability to obtain and maintain regulatory approvals for our products; and the effects of competition from other generic pharmaceuticals and from other pharmaceutical companies; loss of key personnel; our ability to obtain additional funding or financing to operate and grow our business; our liquidity; and other factors detailed in our Annual Report on Form 10-K and our other reports filed from time to time with the Securities and Exchange Commission (“SEC”).
• These factors also include factors specific to our pending acquisition of Hi-Tech Pharmacal Co., Inc. (“Hi-Tech”), including the occurrence of any event, change or other circumstances that could give rise to the termination of the merger agreement with Hi-Tech; the failure to satisfy conditions to completion of the merger, including receipt of regulatory approvals; changes in the business or operating prospects of Hi-Tech; our ability to successfully integrate Hi-Tech businesses and its products; and other factors related to the acquisitions and integration of Hi-Tech.
• If any of these risks or uncertainties materialize, or if our underlying assumptions prove to be incorrect, actual results may vary significantly from what we projected. Any forward-looking statement you see or hear during the presentation reflects Akorn, Inc.’s current views with respect to future events and is subject to these and other risks, uncertainties, and assumptions. You are cautioned not to place undue reliance on these forward-looking statements, which speak only as of the date on which they are made.
• For more complete information about Akorn, you should read the reports filed by Akorn with the SEC. You may get these documents for free through EDGAR on the SEC website at www.sec.gov, which you may also access through our website at http://www.akorn.com.
• You should also read the reports filed by Hi-Tech with the SEC which are similarly available through EDGAR and Hi-Tech’s website at http://www.hitechpharm.com.

AKORN OVERVIEW
3

4
Acquires four branded ophthalmic products
COMPANY TRANSFORMATION
Acquires AVR to expand presence in $1.2 billion
OTC eye care market
Divests Akorn-Strides JV to focus on
strategic priorities
2007 2008 2010 2011 2012 2013 2009
Listed on the NASDAQ
Enters into an agreement to acquire Hi-Tech
Expands manufacturing footprint to India through
asset acquisition
PROVEN EXECUTION COMPANY PROFILE Fast growing pharmaceutical company with proven
execution of strategic initiatives and focus on niche dosage forms
Headquarters: Lake Forest, IL
R&D: Vernon Hills, IL Copiague, NY (Hi-Tech)
Manufacturing: Somerset, NJ Amityville, NY (Hi-Tech) Decatur, IL Paonta Sahib, India
Raj Rai named CEO
Acquires three branded injectable products
from H. Lundbeck
Ophthalmics 21%
Hospital / Injectables
33%
Contract 4%
Hi-Tech Pharma
42%
$540mm+ Revenue
Post Hi-Tech deal close
2010 2011 2012 2013
Pipeline / R&D
($mm)
ANDA’s filed 1 22 25 12
ANDA’s under review 11 31 55 63
R&D spend $6.8 $11.6 $15.9 $19.9
Revenue ($mm)
Ophthalmics $32.8 $68.6 $129.7 114.5
Injectables $28.9 $55.1 $103.8 179.6
Total Revenue $86.4 $136.9 $256.2 $317.7
Gross Margin
Ophthalmics 59.4% 62.8% 56.7% 55.4%
Injectables 47.5% 54.6% 64.3% 58.2%
Total Gross Margin 49.1% 58.2% 58.0% 54.1%

5
Pace of consolidation to continue in specialty pharma & generics
Generic market opportunity remains strong (generics ~83% of Rx volume)*
Elevated scrutiny on both regulatory environment & approval process
Over 100 drugs currently on FDA shortage list, majority are sterile injectables
Globalization provides new opportunities in high growth emerging markets
Commitment to R&D, recent acquisitions and focused growth strategy support Akorn’s position as a key generics player
*Data from IMS - YTD September 2013
MARKET DYNAMICS & OPPORTUNITY
Focus on quality and robust R&D processes enables continued success and supports future growth
Akorn produces over a dozen products that have appeared on the FDA shortage list; the approval of Akorn India will increase overall injectable capacities for the U.S. market
Acquisition of manufacturing assets in India have positioned Akorn to pursue a global strategy over the long-term
Successful business transformation has positioned company well to be a key acquirer in the industry

6
Be #1 in generic ophthalmics
Be a top 5 player in generic injectables
Increase market leadership position for Hi-Tech dosage forms
Expand sales reach to over 30 countries
Become a $1 billion revenue company
STRATEGIC GOALS
US Generic Ophthalmology Competitive Landscape
# 15 in Sales # 10 in Molecules
US Generic Injectable Competitive Landscape
IMS Data for 12 months ended 10/31/13. Some data may have been excluded based on company judgment of comparability.
TOD
AY
3
– 5
YEA
R G
OA
LS
# 3 in Sales and Molecules

7
INTEGRATE Hi-Tech
• Leverage scale and diversification
• Tap into non-sterile platform
• Capture synergies
DEVELOP New
Products
• Continue R&D investment
• Strengthen Hi-Tech’s R&D pipeline
• Maturing R&D pipeline
• Private label opportunity
PURSUE Strategic
M&A
• Strategic fit
• Revenue enhancing
• Accretive
BUILD Brand
Platform
• Maximize value from recent acquisitions
• Leverage & expand existing ophthalmology sales infrastructure
EXECUTE India
Strategy
• Obtain regulatory approvals in US and RoW
• Effectively manage approval timelines
• Leverage new manufacturing capacity
STRATEGIC EXECUTION

8
Anticipated Transaction Benefits Creates a larger, more diversified specialty generics player
Builds scale, breadth of products and dosage forms, enhances diversification
Over 130 combined company approved ANDAs/NDAs
Over $540 million in combined company revenues
Approximately 40% accretive to non-GAAP earnings with synergies1
Expect rapid pay-down of debt from strong combined cash flow
1 Pro forma for full year 2013 as if expected synergies were fully realized. Does not include recent branded ophthalmic acquisitions
(Pro Forma1)
Total Sales (LTM 12/31/13)
$318mm Total Sales (LTM 1/31/14)
$227mm Total Pro Forma Sales
$540+ mm
INTEGRATE
A UNIQUE COMBINATION
Hospital Drugs & Injectables
57%
Contract Services
7%
Ophthalmics 36%
HT Generics 83%
ECR 10%
HCP 7%
Hospital Drugs & Injectables
33%
HT Generics 35% Ophthalmics
21%
Contract Services
4%
ECR 4%
HCP 3%
9
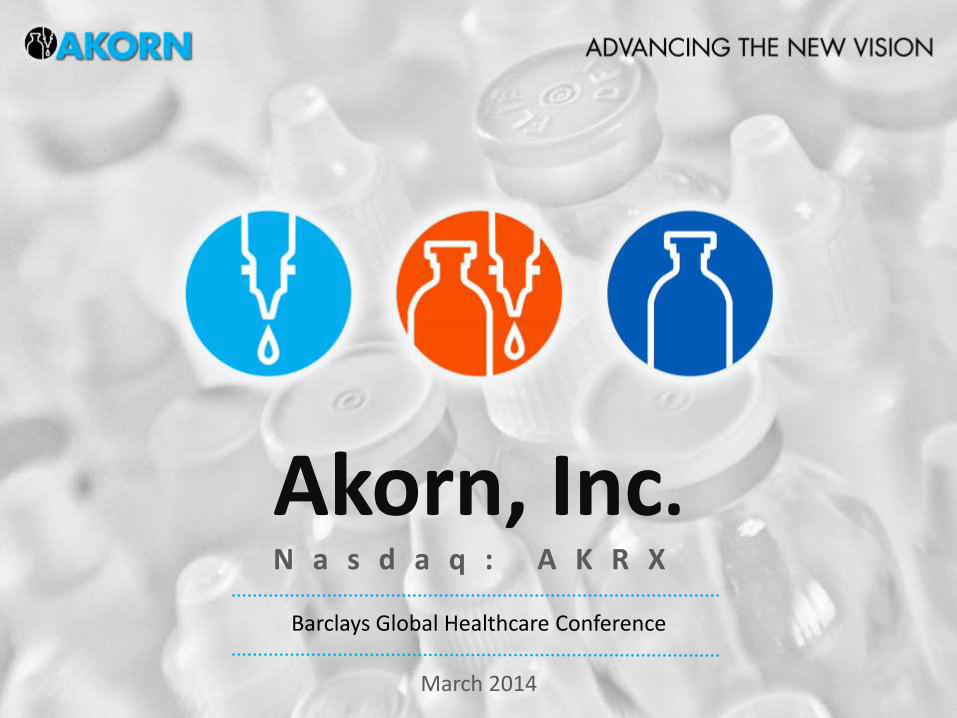
HI-TECH
Source: IMS Health and company analysis
AKORN
Sterile Products: • Solutions • Ointments • Gels • Injectables
• Liquid • Lyophilized
Non-Sterile Products: • Nasal sprays
• Oral liquids
• Topical solutions, gels,
creams, ointments
• Unit dose cups
Market Market Size (IMS $bn)
Akorn Hi-Tech AKORN (post close)
Injectables $16.5
Ophthalmics $6.0
Topicals $9.3
Oral Liquid $3.5
Nasal Spray $2.9
Otics $0.5
Over $16 billion in newly
addressable Non-Sterile
market opportunity
post deal close
Sterile Products: • Solutions,
ointments, gels
INTEGRATE
NEW MARKET OPPORTUNITIES

10
HI-TECH INTEGRATION PLAN
Deal Close 6 months 12 months
Consolidate corporate functions
Implement Akorn Quality Policy
Optimize capacity across sterile ophthalmic plants (2)
Implement new R&D strategy
Achieve annual synergy
run-rate $15 - 20mm
INTEGRATE
Opportunity for significant cost savings due to overlap with minimal risk or disruption to business operations

11
3 6
2 3 1
22 25
12
2010 2011 2012 2013
Hi-Tech
Akorn
$7.0
$11.6
$15.9
$19.9
$39-$43 8.1% 8.4% 6.2% 6.3%
7.5%
0%
1%
2%
3%
4%
5%
6%
7%
8%
9%
$0
$5
$10
$15
$20
$25
$30
$35
$40
$45
$50
2010 2011 2012 2013 2014
($mm) % of Revenue
Long-term commitment to R&D to support growth
New R&D Centers
– Akorn: 19,200 ft2 center can house up to 50 scientists
– Hi-Tech: 18,000 ft2 center can house up to 50 scientists
Filings under review today:
– Akorn: 65 with market value ~ $5.6bn – Hi-Tech: 16 with market value ~ $2.0bn
Flexible R&D and pipeline strategy selectively targets Paragraph IV products
– Akorn: 10 PIV Challenges – Hi-Tech: 4 PIV Challenges
Goal to increase filings to 35-40 per year by 2015
AKORN R&D SPEND
DEVELOP
NUMBER OF ANDAs FILED
INVESTMENT IN R&D
Market value of filings per IMS Health 12 months ended December 2013. Guidance assumes an April 1, 2014 close of the Hi-Tech acquisition.

12
A growing number of products have been with the FDA for over 36 months.
DEVELOP
MATURING PIPELINE
Filings shown are Akorn only and do not include any of Hi-Tech’s filings

13
$500 million Estimated newly addressable Non-Sterile
OTC market for private label creams, liquids, nasal sprays
Akorn has established itself as a player in the private label OTC ophthalmic market:
Source: Market value is based on IRI retail sales data and company analysis
DEVELOP
Through Hi-Tech
PRIVATE LABEL OPPORTUNITY

14 Source: IMS Market Prognosis, Apr 2012
Market Size (2016 Sales - $US bn)
CAGR (2012 – 2016)
Approved Registrations Dossiers # of Countries
Global Market $1,175 – 1,205 3 – 6%
North America $375 – 405 1 – 4% Akorn Domestic Market
Western Europe $175 – 205 -1 – 2%
Japan $105 – 135 1 – 4%
Central & Eastern Europe $71 – 81 4 – 7%
Asia Pacific $240 – 270 11 – 14% 15 3
Latin America $95 – 105 10 – 13% 2 2
MEA & CIS (Main Markets) $74 – 78 8 – 10% 6 3
Middle East & Africa $41 – 51 8 – 11% 20 4
Aggressively Pursue US FDA Approvals • Expand Operations • Expand Globally
EXECUTE
AKORN INDIA – GLOBAL OPPORTUNITY

15
Increased emphasis on quality in India to support approval timeline in US and RoW
• Incremental staffing
• Training initiatives
• Compliance management
US FDA Filing Timeline
• First filing in Q1’14 – tech transfer of existing NDA product
• Followed by three other filings in 2014
• Begin manufacturing for US market in 2015
Support expansion into higher growth geographies
• Pursue WHO and PIC/S approvals
US FDA TIMELINE
Development Initiated
Exhibit Batch Produced
Filing Submitted to FDA
Approval
General Injectable
2013 2014 2015 2016
Cephalosporin
Carbapenem
Hormone
(NDA product transfer)
Facility Inspections
& Approvals
(Tech transfer acquired ANDA product)
(Develop ANDA product)
(Develop ANDA product)
INDIA
INDIA REGULATORY APPROVALS EXECUTE

16
14 37
68
225
300
14
262
368
0
50
100
150
200
250
300
350
400
2009 2012 2015
Cap
acit
y in
mil
lion
un
its
US India Total Capacity
2009 2012 2015
18.7 X 1.4 X
EXPANDED CAPACITY FOR US/ROW MARKETS
Akorn India’s manufacturing capacity
allows Akorn to become a significant player in the
$27 billion addressable global injectable market
EXECUTE
LEVERAGE INDIA INFRASTRUCTURE

17
BUILD
BRANDED OPHTHALMOLOGY PLATFORM
Plan to utilize and expand sales team to reinvigorate revenues of four branded ophthalmic products recently acquired from Merck and Santen
– Leverages existing ophthalmic sales force and physician relationships
– Elevates Akorn’s reputation with prescribers
– Creates a prescription branded ophthalmic strategy
– Broadens existing platform that includes TheraTears, Akten, and IC Green
Platform supports future acquisitions and in-licensing of branded ophthalmic products
Recent product acquisitions will benefit revenue by $42 - $47 million and adjusted EPS by $0.12 – $0.15 per share

18
PURSUE
M&A STRATEGY Continue to seek companies and/or products that build upon our expertise Acquire companies and/or products within same or adjacent market space – leverage pipeline,
marketing, distribution channels, etc. Acquire companies that provide additional value to supply chain either through capacity or cost benefits
PURSUE STRATEGIC M&A
AKORN GROWTH THROUGH M&A ACTIVITY
2011 • Expanded product portfolio and strengthened position in niche area of
OTC ophthalmics with acquisition of Advanced Vision Research
2011 • Accelerated growth rate as a result of acquisition of Nembutal, Diuril and
Cogentin from H. Lundbeck
2012 • Increased capacity for US FDA products & expanded int’l presence with
acquisition of injectable manufacturing assets from Kilitch India
2013 • Hi-Tech acquisition will bring critical mass to generics business and
diversifies product offering and areas of expertise with niche products
2013 • Acquisition of branded ophthalmic products elevates reputation with
prescribers and creates prescription ophthalmic strategy

19
FINANCIAL PERFORMANCE

20
FINANCIAL MOMENTUM
REVENUE ADJUSTED EBITDA ADJUSTED EPS
54% CAGR (’10-’13) 75% CAGR (’10-’13) 51% CAGR (’10-’13)
Transformation has led to strong and consistent performance
$86 $137
$256 $318
2010 2011 2012 2013 2014
$540-560
G
U
I
D
A
N
C
E
$21
$45
$96 $111
2010 2011 2012 2013 2014
$179-185
G
U
I
D
A
N
C
E
$0.16
$0.35
$0.52 $0.55
2010 2011 2012 2013 2014
$0.76-0.79
G
U
I
D
A
N
C
E
All Value millions, except EPS
Guidance assumes an April 1, 2014 close of the Hi-Tech acquisition.

21
STRONG BALANCE SHEET & FREE CASH FLOW
$12.3
$19.7
$26.2
$57.3
$0
$10
$20
$30
$40
$50
$60
$70
2010 2011 2012 2013
Improving cash flow generation
Strong synergy opportunity in Hi-Tech integration
Cash position $34mm (as of 12-31-13)
$600 million Term Loan B; 3.8x leverage at Hi-Tech close
– Total leverage objective of 2.0-2.5x
$150M ABL revolving credit facility available
Strong Financial Position
Capital Priorities
Invest in business and growth strategy
Strategic M&A opportunities
Rapid debt reduction post Hi-Tech close
Cash from Operations ($mm)

22
Attractive industry dynamics
Injectable and ophthalmic products represent niche segments
with limited competition and high barriers to entry Acquisition of Hi-Tech adds over 50 products in attractive niche
categories
Generic market opportunity remains strong core business – Generics make-up ~83% of all Rx volume
Proven Execution
Investing in infrastructure improvements
Clear strategy for sustained growth
Strong revenue growth and increasing margins, profitability and
cash flow
Strategic company/product M&A
Increasing capacity and improving efficiency
Upgrading to comply with ever-changing regulatory environment
Robust product pipeline and R&D program
Global expansion through Akorn India
Acquisitions / In-licensing opportunities
INVESTMENT HIGHLIGHTS
23

24
ROBUST R&D PIPELINE DETAILS (US MARKET)
Filed In Development Total
Mkt Value Count Mkt Value Count Mkt Value Count Mkt Value Count
Brand $2,966 26 $1,834 10 $2,096 19 $6,896 55
Generic $2,588 39 $20 2 $1,358 33 $3,965 74
Total $5,553 65 $1,854 12 $3,455 52 $10,862 129
To Be Filed Filed To Be Filed In Development Total
Mkt Value Count Mkt Value Count Mkt Value Count Mkt Value Count
Ophthalmic $1,859 24 $953 7 $561 14 $3,373 45
Injectable $2,717 33 $901 5 $2,509 36 $6,127 74
Other $977 8 - 0 $384 2 $1,361 10
Total $5,553 65 $1,854 12 $3,455 52 $10,862 129
Market value is based on IMS 12 months ended Dec 2013. Pipeline status is as of February 2014. Akorn only, Hi-Tech’s filings are not included.

25 Market value is based on IMS 12 months ended Dec 2013. Filed product count as of February 2014. Akorn only, Hi-Tech’s filings are not included.
MATURING PIPELINE