Embed Size (px)
Citation preview

© 2015 Akastor © 2015 Akastor
Creating value through
active ownership
London | 17 March 2015
Frank O. Reite and Leif Borge

© 2015 Akastor
THIS IS AKASTOR Frank O. Reite
CEO
March 17, 2015 Slide 2
Agenda
FINANCIALS Leif Borge
CFO

© 2015 Akastor Slide 3
Akastor is set up to create value through active ownership
Our portfolio
Oilfield services investment
company with a flexible mandate
for long-term value creation
Value creation through active
ownership combining a range of
strategic, operational and
financial measures
Portfolio companies with
multiple levers for growth and
improvements
Our mandate
Our approach
March 17, 2015

© 2015 Akastor
8 Portfolio
companies
13.0 Billion NOK
net capital employed*
7,600 Employees
worldwide
Akastor - the investment portfolio
21.4 Billion NOK
revenue*
*2014 numbers
March 17, 2015 Slide 4

© 2015 Akastor
MHWIRTH
Global provider of drilling systems,
products and services
AKOFS OFFSHORE
Well construction and intervention
services to the oil and gas industry
FJORDS PROCESSING Global provider of process systems
and services for oil, gas and water
treatment
KOP SURFACE PRODUCTS
Provider of surface wellheads and
trees in APAC and MENA
FRONTICA BUSINESS
SOLUTIONS
Global provider of business and
corporate services
REAL ESTATE AND
FINANCIAL HOLDINGS
Our investments – eight stand-alone companies
FIRST GEO
Petroleum sub-surface consultancy
STEP OILTOOLS Provider of Drilling Waste
Management products and services
March 17, 2015 Slide 5

© 2015 Akastor March 17, 2015 Slide 6
AKOFS
MHWirth
Real Estate
and other
KOP
Fjords Processing Frontica
The Akastor portfolio of investments
NET CAPITAL EMPLOYED
13 Billion NOK (2014)
REVENUE
21.4 Billion NOK (2014)
MHWirth
Real Estate and other
KOP
AKOFS
Fjords
Processing
Frontica

© 2015 Akastor
• Dialogue with stakeholders
• Financial and operational
benchmarking
• Assessment of historic
performance and strategy
• Identify areas for improvement,
short-, mid- and long term
• Decide on time horizon and
actions
• Define metrics and milestones
• Close interaction with
management
• Frequent reporting
• Corrective actions
• Focus on speed in execution
and simplicity (80/20)
March 17, 2015 Slide 7
Systematic value creation “the Akastor way”
ASSESS SITUATION
DEFINE VALUE
CREATION PLAN
EXECUTE, ADJUST
AND FOLLOW-UP
2
3
1
© 2015 Akastor March 17, 2015 Slide 8
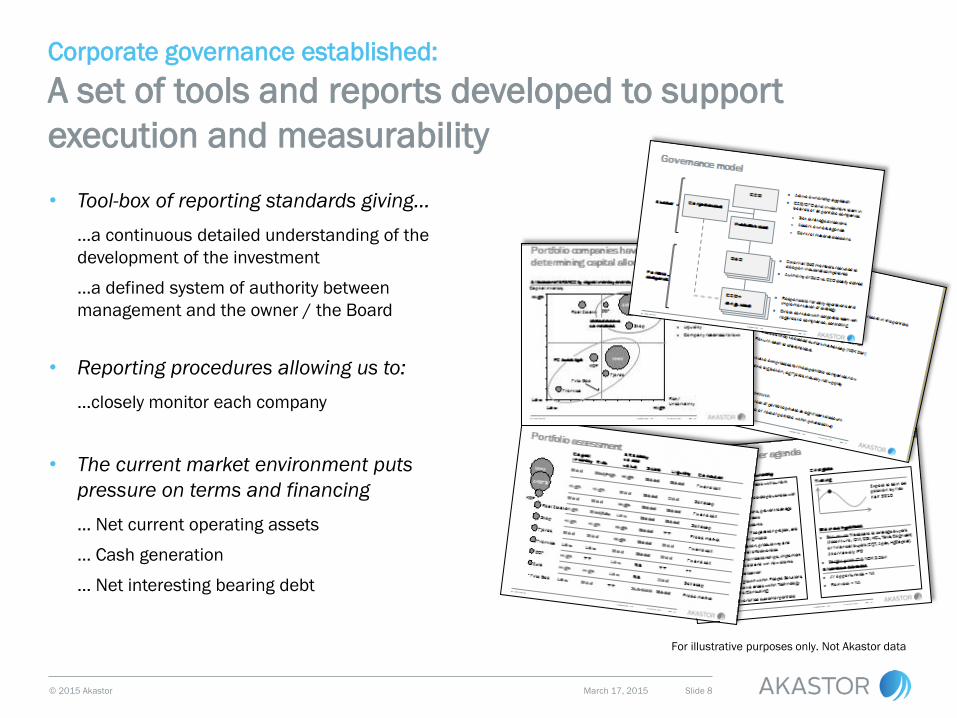
Corporate governance established:
A set of tools and reports developed to support
execution and measurability
• Tool-box of reporting standards giving…
…a continuous detailed understanding of the
development of the investment
…a defined system of authority between
management and the owner / the Board
• Reporting procedures allowing us to:
…closely monitor each company
• The current market environment puts
pressure on terms and financing
… Net current operating assets
… Cash generation
… Net interesting bearing debt
For illustrative purposes only. Not Akastor data
© 2015 Akastor March 17, 2015 Slide 9
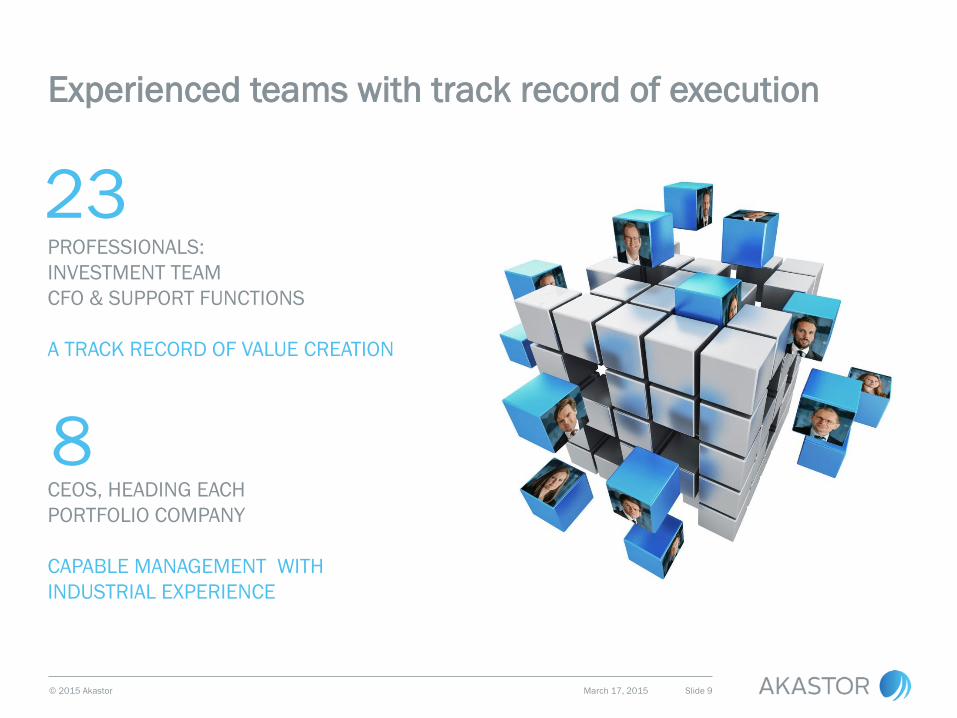
Experienced teams with track record of execution
PROFESSIONALS:
INVESTMENT TEAM
CFO & SUPPORT FUNCTIONS
A TRACK RECORD OF VALUE CREATION
CEOS, HEADING EACH
PORTFOLIO COMPANY
CAPABLE MANAGEMENT WITH
INDUSTRIAL EXPERIENCE
8
23

© 2015 Akastor
MHWirth
MHWirth is a leading global provider of first-class drilling solutions, equipment and services.
One of only two providers of complete topside packages and riser systems for floaters.
10,681 Million NOK
Revenue in 2014
941 Million NOK
EBITDA in 2014
4,237 Employees
Real Estate

© 2015 Akastor
Installed base supports long term life cycle business
CURRENT INSTALLED BASE BY REGION PER END 2014 78 in total
13
18
30
9
8
US
Brazil
Africa
Europe
Asia/ MENA
INSTALLED BASE DEVELOPMENT
55 58 67
72 74 78 88
95
2009 2010 2011 2012 2013 2014 2015 2016
Number of drilling packages
+8%
INSTALLED BASE BY AGE AND TYPE
37
20
15 6
JU
Semi
Fixed
platforms
Drillship 23
23
16
16
5-10
>20
0-5
10-20
By type By age
March 17, 2015 Slide 11
Real Estate

© 2015 Akastor March 17, 2015 Slide 12
Substantial oversupply in floater market
Source: RS Platou Rig Monthly, 17 February 2015
ACTIVE SUPPLY AND REGIONAL DEMAND
Floaters
FLOATERS SCRAPPED (2005-2015)
• Steep drop in utilization due to oversupply
• Currently a total of 394 floaters in service and
on book (278 active, 31 passive fleet, 84 on
order)
• Demand recovery estimated at 280-290 units
• As per 17.2.2015 owners have announced
intent to remove/scrap 23 floaters
RIG UTILIZATION
Active Supply
No. of
rigs
No. of
rigs
Flo
ate
rs
Real Estate

© 2015 Akastor Slide 13
NEAR TERM
• Very challenging market with a low activity level
resulting in capacity costs and pressure on
margins
• Cost base and capital discipline
• Initiated capacity reduction process aiming
to reduce 500-750 personnel
• Estimated NOK 500-600 million annual
cost reduction
• Managing Brazilian exposure
ROADMAP FOR VALUE CREATION
• Protect DLS business
• Standardization and streamlining
• Strengthening customer relations
• Organizational effectiveness
• Challenging markets may create interesting
opportunities
MHWirth: Focusing on the core
March 17, 2015
Real Estate

© 2015 Akastor
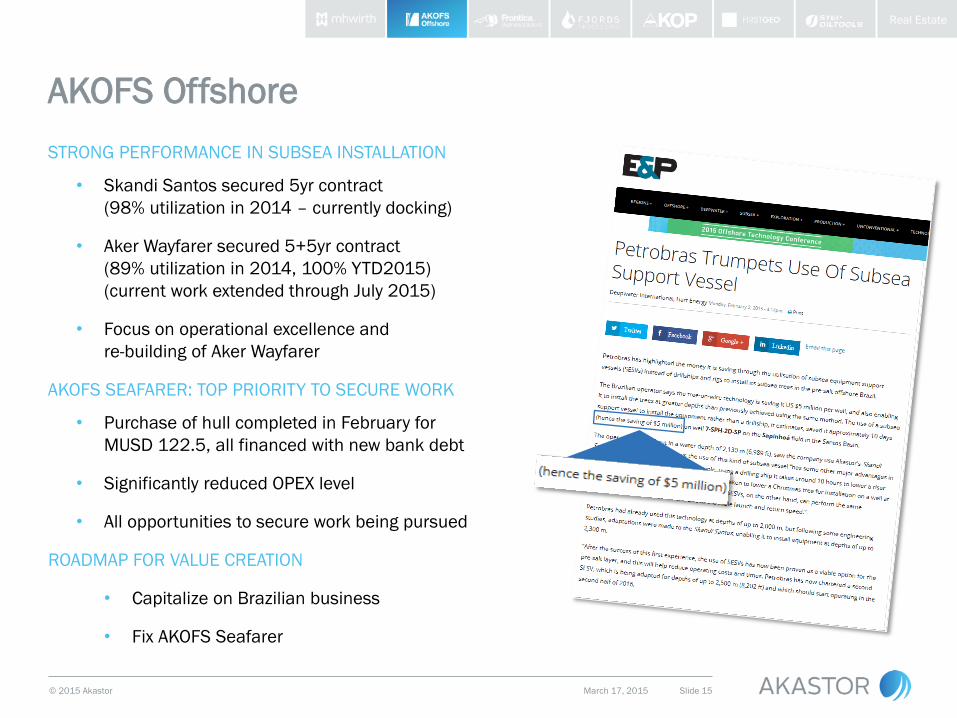
AKOFS Offshore
AKOFS Offshore is a global provider of vessel based subsea well construction and intervention
services to the oil and gas industry.
1,542 Million NOK
Revenue in 2014
175 Million NOK
EBITDA in 2014
115 Employees
Real Estate
© 2015 Akastor
STRONG PERFORMANCE IN SUBSEA INSTALLATION
• Skandi Santos secured 5yr contract
(98% utilization in 2014 – currently docking)
• Aker Wayfarer secured 5+5yr contract
(89% utilization in 2014, 100% YTD2015)
(current work extended through July 2015)
• Focus on operational excellence and
re-building of Aker Wayfarer
AKOFS SEAFARER: TOP PRIORITY TO SECURE WORK
• Purchase of hull completed in February for
MUSD 122.5, all financed with new bank debt
• Significantly reduced OPEX level
• All opportunities to secure work being pursued
ROADMAP FOR VALUE CREATION
• Capitalize on Brazilian business
• Fix AKOFS Seafarer
AKOFS Offshore
March 17, 2015 Slide 15
Real Estate
© 2015 Akastor March 17, 2015 Slide 16
3,000 IT users
managed daily
300,000 Pay checks processed
per year
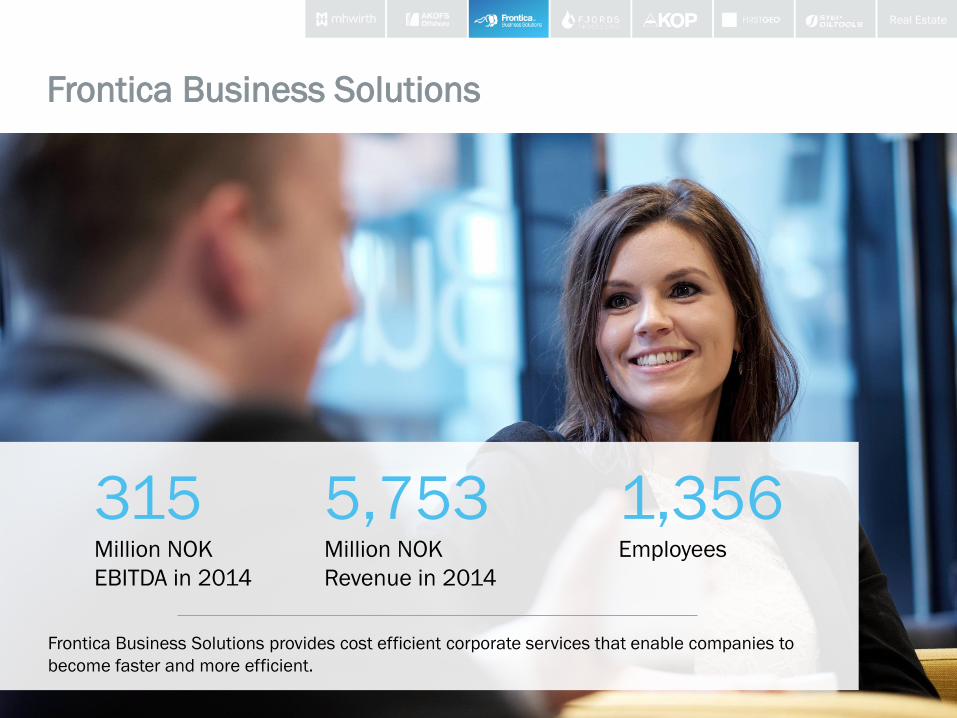
Frontica Business Solutions
Frontica Business Solutions provides cost efficient corporate services that enable companies to
become faster and more efficient.
5,753 Million NOK
Revenue in 2014
315 Million NOK
EBITDA in 2014
1,356 Employees
Real Estate

© 2015 Akastor
Frontica Business Solutions
COMPETITIVE POSITION
• Manpower, and Service provider to the
Oil & Gas industry
• Portfolio of 3 000 highly skilled
engineering consultants
• Managing 30 000 IT users
• Global delivery model, local presence
ROADMAP FOR VALUE CREATION
• Leverage current platform
• Cost optimisation
• Gradually broaden customer base
March 17, 2015 Slide 17
Real Estate

© 2015 Akastor
Fjords Processing
Fjords Processing provides well stream processing technology, systems, and services to the
upstream oil and gas industry
2,322 Million NOK
Revenue in 2014
52 Million NOK
EBITDA in 2014
617 Employees
Real Estate

© 2015 Akastor
Fjords Processing
COMPETITIVE POSITION
• Provider of complete processing systems,
both onshore and offshore
• Comprehensive product portfolio
• World leading processing technologies
within defined niches
ROADMAP FOR VALUE CREATION
• Increase profitability through improving
and streamlining operations
• Grow Lifecycle Services
• Secure technology differentiation
March 17, 2015 Slide 19
Real Estate

© 2015 Akastor
KOP Surface Products
KOP Surface Products is a provider of surface-installed wellheads, Xmas trees, valves and
actuators for offshore and land-based oil and gas production
1,119 Million NOK
Revenue in 2014
156 Million NOK
EBITDA in 2014
854 Employees
Real Estate

© 2015 Akastor
77 94
131 148
12
17
29
0
5
10
15
20
0
20
40
60
80
100
120
140
160
180
17
KOP Surface Products
COMPETITIVE POSITION
• Reliable products
• Competitive manufacturing capabilities
• Strong foothold in APAC
ROADMAP FOR VALUE CREATION
• Expand manufacturing capacity with
minimal capex
• Increase profitability through identified
cost potential
• Enter and grow in the Middle-East
+26%
2014
177
2013
149
2012
111
2011
89
EBITDA% Hardware revenues SLS revenues
MUSD %
A REMARKABLE GROWTH STORY
March 17, 2015 Slide 21
Real Estate
© 2015 Akastor March 17, 2015 Slide 22
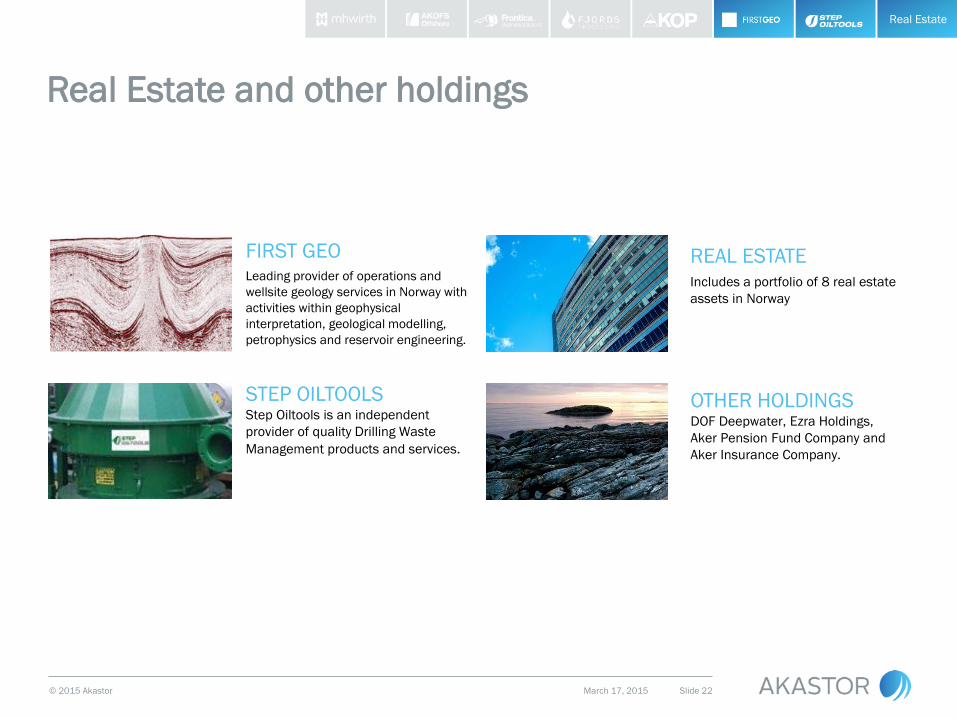
Real Estate
REAL ESTATE Includes a portfolio of 8 real estate
assets in Norway
FIRST GEO Leading provider of operations and
wellsite geology services in Norway with
activities within geophysical
interpretation, geological modelling,
petrophysics and reservoir engineering.
STEP OILTOOLS Step Oiltools is an independent
provider of quality Drilling Waste
Management products and services.
Real Estate and other holdings
OTHER HOLDINGS DOF Deepwater, Ezra Holdings,
Aker Pension Fund Company and
Aker Insurance Company.
© 2015 Akastor
THIS IS AKASTOR Frank O. Reite
CEO
March 17, 2015 Slide 23
Agenda
FINANCIALS Leif Borge
CFO
© 2015 Akastor Slide 24
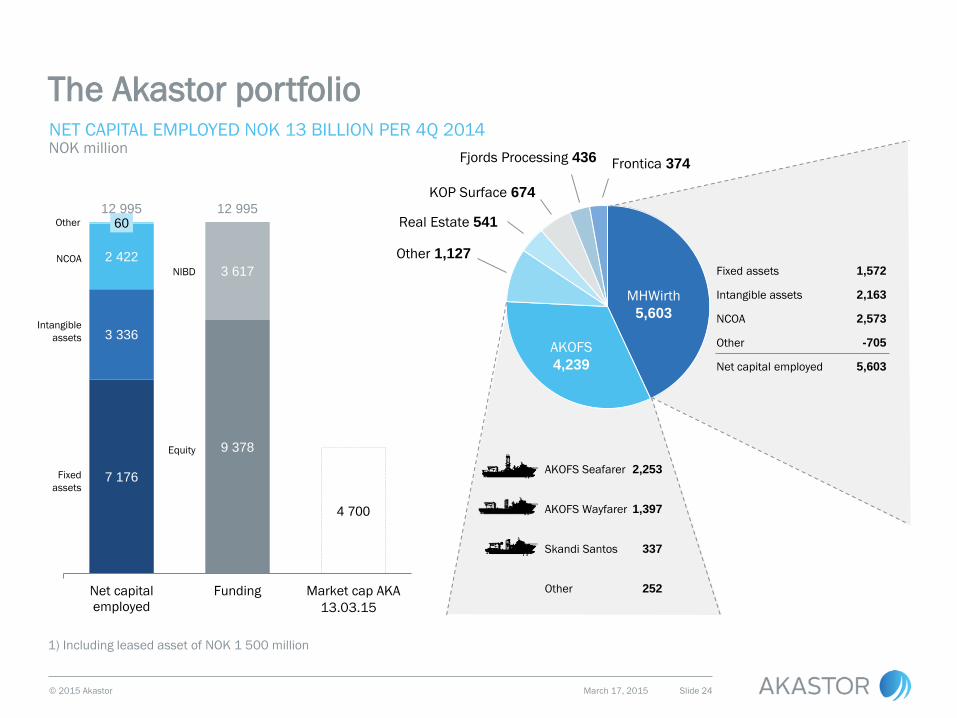
NET CAPITAL EMPLOYED NOK 13 BILLION PER 4Q 2014
AKOFS
4,239
MHWirth
5,603
Other 1,127
KOP Surface 674
Fjords Processing 436 Frontica 374
The Akastor portfolio
NOK million
Fixed
assets
Intangible
assets
NCOA
Other
Equity
NIBD
1) Including leased asset of NOK 1 500 million
Real Estate 541
AKOFS Seafarer
AKOFS Wayfarer
Skandi Santos
Fixed assets 1,572
Intangible assets 2,163
NCOA 2,573
Other -705
Net capital employed 5,603
2,253
1,397
337
Other 252
7 176
3 336
2 422
60
9 378
3 617
4 700
12 995 12 995
Net capital
employed
Funding Market cap AKA
13.02.1513.03.15
March 17, 2015
© 2015 Akastor
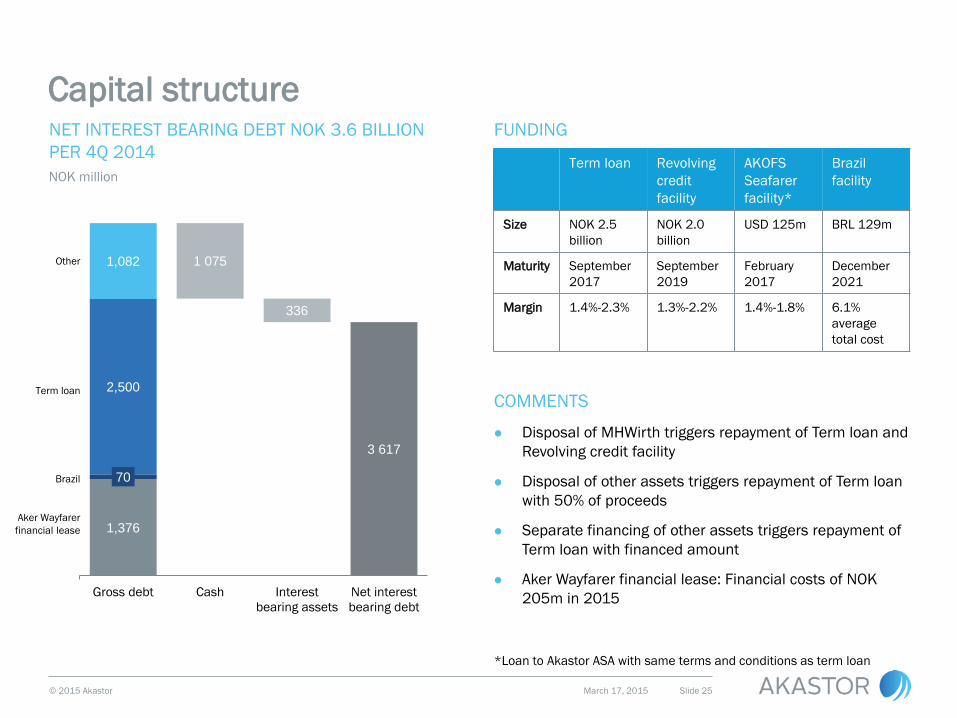
NET INTEREST BEARING DEBT NOK 3.6 BILLION
PER 4Q 2014
Slide 25
Capital structure
NOK million
1,376
3 617
70
2,500
1,082 1 075
336
Gross debt Cash Interest
bearing assets
Net interest
bearing debt
Other
Term loan
Brazil
Aker Wayfarer
financial lease
FUNDING
COMMENTS
Disposal of MHWirth triggers repayment of Term loan and
Revolving credit facility
Disposal of other assets triggers repayment of Term loan
with 50% of proceeds
Separate financing of other assets triggers repayment of
Term loan with financed amount
Aker Wayfarer financial lease: Financial costs of NOK
205m in 2015
Term loan Revolving
credit
facility
AKOFS
Seafarer
facility*
Brazil
facility
Size NOK 2.5
billion
NOK 2.0
billion
USD 125m BRL 129m
Maturity September
2017
September
2019
February
2017
December
2021
Margin 1.4%-2.3% 1.3%-2.2% 1.4%-1.8% 6.1%
average
total cost
*Loan to Akastor ASA with same terms and conditions as term loan
March 17, 2015

© 2015 Akastor © 2015 Akastor March 17, 2015 Slide 26
www.akastor.com

© 2015 Akastor March 17, 2015 Slide 27
Copyright and disclaimer
Copyright Copyright of all published material including photographs, drawings and images in this document remains vested in
Akastor and third party contributors as appropriate. Accordingly, neither the whole nor any part of this document shall
be reproduced in any form nor used in any manner without express prior permission and applicable
acknowledgements. No trademark, copyright or other notice shall be altered or removed from any reproduction.
Disclaimer This Presentation includes and is based, inter alia, on forward-looking information and statements that are subject to
risks and uncertainties that could cause actual results to differ. These statements and this Presentation are based on
current expectations, estimates and projections about global economic conditions, the economic conditions of the
regions and industries that are major markets for Akastor ASA and Akastor ASA’s (including subsidiaries and affiliates)
lines of business. These expectations, estimates and projections are generally identifiable by statements containing
words such as “expects”, “believes”, “estimates” or similar expressions. Important factors that could cause actual
results to differ materially from those expectations include, among others, economic and market conditions in the
geographic areas and industries that are or will be major markets for Akastor ASA. oil prices, market acceptance of
new products and services, changes in governmental regulations, interest rates, fluctuations in currency exchange
rates and such other factors as may be discussed from time to time in the Presentation. Although Akastor ASA believes
that its expectations and the Presentation are based upon reasonable assumptions, it can give no assurance that
those expectations will be achieved or that the actual results will be as set out in the Presentation. Akastor ASA is
making no representation or warranty, expressed or implied, as to the accuracy, reliability or completeness of the
Presentation, and neither Akastor ASA nor any of its directors, officers or employees will have any liability to you or any
other persons resulting from your use.


![Company Presentation [Company Update]](https://img.dokumen.tips/doc/110x75/577cb1c71a28aba7118bdd5f/company-presentation-company-update.jpg)