Embed Size (px)
Citation preview

Airline
Insurance
Market
Review
2006

Contents
Foreword 3
Executive Summary 4
Market Overview 5
Losses Overview 10
Hull War, Excess Third Party War 14
& Allied Perils Liability Market Overview
Industry Overview 16
Long Term Data Suggests Market Changes 20
US Aviation Pandemic Risk Exercise 22
Highlights need for Better Preparation
Don’t Let your Directors Sink as you Prepare to Float 23
Weather Difficulties Highlight Value 24
of Derivative Products
Looking Ahead 26
Analysis
> Monthly Analysis 30
> Regional Analysis 36
> Fleet Value Analysis 40
> Sector Analysis 44
AIMR Q1-4_06

> If you would like to subscribe to Aon aviation information
newsletters, which provide monthly industry analysis of
both the aviation and aerospace industries, market reviews
and special reports, please email
To read back issues of our publications, go to the aviation
and aerospace industry section of www.aon.com
As always, we welcome feedback on the issues we have
addressed as well as suggestions for future coverage. These
should be sent to [email protected] or
For information and analysis, please contact:
Kelly Fuller : +44 (0)20 7668 9589, [email protected]
Paul Mitchell : +44 (0)20 7216 3641, [email protected]
> The information featured in this review is representative of
market trends only. We regret that due to vertical or
fragmented marketing, sourcing exact percentage rate
movements and/or shifts in premiums can sometimes
prove difficult.
Our analysis is therefore representative of all airline
programmes with an insured average fleet value equal to or
greater than US$150 million.
> Due to the sensitive nature of the issues involved, the losses
overview features only those incidents with an incurred hull
and liability loss value of US$1 million or above, with
liability being reported as a monthly, quarterly and year-to-
date figure.
Rate and premium movement percentages are based on the
London lead rate in 2006 against the London lead rate in
2005.
Where airlines have cancelled and replaced their
programmes or have implemented short-term policies, the
full annual figures have been used for calculation purposes
on their accounts. If placements have, through the addition
or deletion of airlines, changed, no allowance has been
made in the expiring figures.
It should also be noted that for comparison purposes all
local currencies are converted to US dollars.
Reproduction permitted with written authorisation
© Copyright 2007 by Aon Aviation. All rights reserved.

AIMR Q1-4_061quarter_ 2 3 4
Welcome to the Aon Aviation Airline Insurance Market
Review for 2006.
The main story for the last year has been the addition
of a large swathe of new capacity in the airline
insurance markets globally. This added competition has
delivered significant benefits to our clients when
renewing their programmes.
At times in the past, there has been a perception that
new capacity entering the market has not necessarily
had the financial strength it would need in the event of
a significant loss, but this does not appear to be the
case this time around.
With the backing that it has, the new capacity has
presented some very attractive options that we have
been able to work with to significantly improve our
clients’ programmes. With our unparalleled knowledge
of the aviation insurance markets, finding the most
effective way of making the most of these
opportunities is where Aon’s teams of aviation brokers
really come into their own.
The reality is, however, that insurance serves the vital
purpose of supporting operations when there is an
accident. There is some concern that pricing in the
markets has reached a low point and that any further
decreases may lead to an adverse reaction in the event of
a significant loss. Our analysis suggests, however, that
the favourable conditions for buyers is likely to continue.
The simple reason for this is that while average lead
premium in the airline insurance market has fallen at a
breathtaking rate over the last quarter, it potentially still
has some way to go before it reaches the bottom when
capacity in the airline insurance markets, the
contribution of the excess third-party war coverage,
technological and safety improvements and the
renewal cycle, which is due to continue until October,
are taken into account.
The airline industry has once again delivered a safe year
in comparison with historical averages. This is a
continuation of an impressive loss history that has now
continued for over five years. This is a credit to many
aviation companies and organisations that have driven
Foreword
3
significant improvements to operating standards across
the industry over the last five years.
From an Aon point of view, 2006 was another excellent
year. We have continued to offer buyers the most
transparent insurance programmes, going significantly
further than international regulatory requirements or
our competitors.
We continue to strive to present our clients with the
full benefits of working with an organisation the size
and expertise of Aon. As organisations and the financial
markets become more and more complex, buyers of
insurance want to be able to work with a broker that
can support the full spectrum of their risk and
insurance needs, be it for property, enterprise risk
management, electronic risk or even products such as
weather derivatives. Aon has the scope and the
expertise to meet these needs as well as the experience
to spot emerging risks and offer support in managing
them. Please do not hesitate to discuss your needs with
your Aon contacts.
I hope that this review provides you with a useful
overview of how the airline insurance market evolved
during 2006 and gives you plenty of insight about the
direction of the insurance market in 2007.
DOUG PETERSON
Aviation Global Practice Leader – Aon

Executive Summary
This review examines activity in the aviation insurance
market during 2006, bringing together all of the data
that Aon has collected throughout the last year and
using it to explain how the market is evolving.
The most significant development in the market over
the last 12 months has been the introduction of a
number of new aviation underwriters. Their launch
increased capacity in the aviation insurance market, and
the average rate of premium reduction accelerated
throughout the final quarter of 2006 as a result.
Premium reductions in the Excess Third Party War Liability
market have been greater than those delivered in the core
Hull and Liability market. This has added to the savings
that buyers of airline insurance have been enjoying.
Given the investment that has been made to enter the
market, the high level of capacity is forecast to continue
into 2008, when the continuation of the expected lead
premium reductions may result in some capacity
exiting the market. Any underwriter consolidation may
well bring this forward.
At the same time, however, advances in technology
have meant a reduction in the cost of market entry for
underwriting operations. This could stave off a flight of
capacity from what is a high profile, if not massively
significant, market in terms of large global insurers’
total insurance activities.
While premium levels seem low at first glance,
historical analysis suggests that there is scope for
further declines on 2007/8 policies.
One of the key reasons for this is Excess Third Party
War AVN 52E coverage, which continues to add a
significant amount to the core hull and liability
premium total. Excess AVN 52E coverage was split out
from standard hull and liability policies in the wake of
9/11, and adding it back into the full year numbers
for 2006 boosts the overall lead premium level by
over US$300m.
The premium reductions have not only been the result
of the new capacity; the loss record for the airline
industry has continued to be impressive. The
cumulative loss record for the full year is fractionally
lower than 2005, comfortably below the average loss
rate for 2000-2005, and significantly below the loss
records for every year between 2001 and 1996.
While the loss levels were very good in 2005 from a
hull insurance point of view, the high number of
fatalities was a cause for concern. There have been
fewer fatalities in 2006, with a notable reduction in
losses at the smaller end of the market.
Meanwhile, while there has been a significant amount
of manoeuvring and posturing around the industry,
relatively few airline operations have actually merged
over the last twelve months. There is a strong possibility
negotiations during 2006 could result in significant
deals in Asia, Europe and North America over the next
few months, but last year was notable for its relative
lack of airline mergers and acquisitions activity.
That said, while the number of organisations involved
in successful full merger and acquisition activity has
been limited, the trend for insurance programme
consolidation has continued, with the Gulf Co-
operation Council and Lufthansa programmes both
adding operations to their group policies. There have
been increasing developments in the number of
parallel placements, where programmes are placed in
conjunction with each other despite differentiated
loss experiences.
4
Full Year 2006
Compared to the same period in 2005
Premium has fallen by -17%
Fleet values have grown by +5%
Passenger numbers have risen by +10%
Source: Aon Market Data
5AIMR Q1-4_061quarter_ 2 3 4
US
$ B
illio
ns
2002 2003 2004 2005 2006
Airline ClaimsAirline Premium
0
1
2
3
4
Source: Aon Market Data
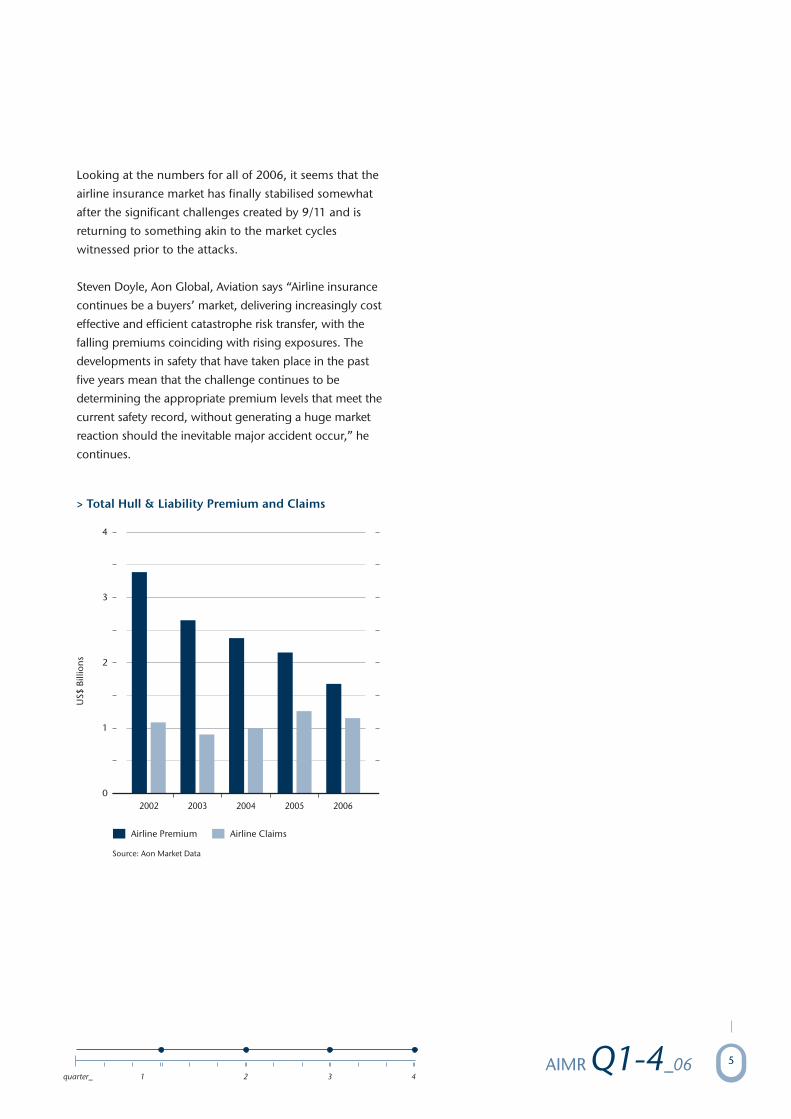
> Total Hull & Liability Premium and Claims
Looking at the numbers for all of 2006, it seems that the
airline insurance market has finally stabilised somewhat
after the significant challenges created by 9/11 and is
returning to something akin to the market cycles
witnessed prior to the attacks.
Steven Doyle, Aon Global, Aviation says “Airline insurance
continues be a buyers’ market, delivering increasingly cost
effective and efficient catastrophe risk transfer, with the
falling premiums coinciding with rising exposures. The
developments in safety that have taken place in the past
five years mean that the challenge continues to be
determining the appropriate premium levels that meet the
current safety record, without generating a huge market
reaction should the inevitable major accident occur,” he
continues.

Market Overview
There has been a year of further change in the aviation
insurance market during 2006, as the primary drivers of
capacity and claims have developed to increase the
level of underwriting capacity and the excellent
industry loss record have all continued to develop.
At -17% for the full year, the average premium
reductions that insurance programmes received during
2006 are the highest since 2003, when there was a
correction in response to the hardening that took place
in the aftermath of 9/11.
In reality, the premium reductions have meant that the
aviation insurance market has reached a comparable
level to 2000, suggesting that the market has returned
to its pre-9/11 norms. The industry however, seems
significantly safer.
In terms of the composition of the overall hull and
liability premium, hull coverage represented just over
30% in 2006, around the same levels are reported in
2005. The global total contains some significant
regional differences, however, with North America,
Latin America and Europe hull coverage representing
under 30% of coverage, Asia and the Middle East both
at 36% and Africa at 45%, reflecting the loss histories
and underwriting approach taken to each region.
The average insurance cost per passenger in 2006 was
US$0.73, compared to US$0.98 in 2005, highlighting
the significant reductions in the cost of insurance that
have occurred over the last year.
The average premium reduction trend has accelerated
significantly since August, prior to which, the trend had
been pointing towards a continuation of the -7%
average that had been in place since 2004.
While long-term industry consolidation, the impressive
overall loss histories and a number of other factors have
had an impact, the main driver of these significant
reductions has been the amount of new capacity that
entered the market during 2006.
Market capacity currently sits at around 185% based on
a US$1.5bn limit for the perfect insurance programme,
known as the ideal risk. What this means is that the
most attractive aviation insurance programme, which
has an exemplary loss record, the most up-to-date
aircraft, teams of pilots with good experience and only
flies between politically stable countries, could fill its
insurance requirements needs nearly two times over.
The play of market forces makes this improbable, but the
high level of capacity means that most programmes
could be heavily oversubscribed, and this competition is
driving down the cost of core hull and liability insurance.
While the cost of insurance reaching its lowest point in
five years might seem to be an inherently good thing
for those that have to buy it, it does create significant
concerns. Primarily, aviation is a catastrophe market,
which needs to be in a position to ensure coverage in
the event of a major loss or string of losses. Given the
rate at which the annual amount of aviation insurance
premium has fallen, and the fact that fleets are
significantly more valuable than they were even five
years ago, there is a growing concern about there
being a rapid hardening in the market in the event of
an aviation catastrophe. Analysis of historical data
shows that the longer and further the market falls, the
more significant and rapid the market hardening is
when the catalyst of change comes into play.
6
YearAverage Premium
Change
2006
2005
2004
2003
2002
2001
6 Year Average
-17%
-7%
-7%
-18%
-4%
+55%
+0.33%
Source: Aon Market Data

As a result of the falling costs of insurance, total annual
hull and liability premium has fallen well below the
US$2bn level, which market experts have been describing
as psychologically important over the last five years.
In Aon’s January to August 2006 Review, we suggested
that total annual premium would be around
US$2.01m, with a possibility of falling to around
US$1.8bn as a result of vertical marketing. The fact that
the full year figures have come in considerably below
even the low-end forecast highlights the speed with
which the acceleration in premium reductions has
taken place. With significantly increased levels of
verticalisation, the actual lead hull and liability
premium levels are considerably lower.
While the US$2bn threshold is psychologically
significant, programmes with a combination of the
most desirable risk profile and premium volume and
loss history as well as a strong market relationship,
should be judged on individual merit and reflect the
realities of an organisation's insurance requirements,
rather than simply the imposition of a premium rate
that has risen or declined according to market averages.
In this respect, the aviation insurance market is
significantly more efficient and balanced than it has
been in the past.
That said, the Excess Third Party War Liability AVN52
market has been valued at about US$312m for 2006.
Adding this to the total lead premium figure for the full
year tops up the market to over US$1.99bn. The excess
AVN52 market was created in the aftermath of 9/11 to
cover terrorist risk, but there has never been a claim
and it has not yet been fully re-absorbed into standard
airline insurance policies, suggesting that it offers
underwriters a consistent return alongside the core hull
and liability market.
The new capacity put price pressure on the leaders, but
there was no notable growth in the number of airlines
changing leader during 2006. Just over 20 airline
programmes changed leader during the year,
compared to over 30 in 2005. There may be more
leader changes if leaders begin to try and resist
premium reductions during 2007.
Of the leader changes that did take place, just below
50% occurred during the final quarter of the year. This
highlights the attraction of moving accounts in the
current highly competitive environment, although the
picture is complicated by fact that the majority of airline
insurance activity takes place in the final quarter of the
year when most of the new capacity became available.
In terms of brokers, meanwhile, there have been 16
account changes in 2006, compared to 23 in 2005.
Despite the limited industry consolidation, there has
been a consistent level of consolidation among airline
insurance programmes as companies seek to take
advantage of the significant economies of scale that the
market offers to programmes with high fleet values.
This means that the premium pot over the next few
years will increasingly come from a smaller number of
larger buying groups and as a result, the requirement
for participation in the aviation insurance market will be
increased as a result. This will increase competition for
major programmes even further.
“Experienced airline insurance buyers recognise the
value of long-term insurer relationships, but they also
have a corporate duty to maximise premium savings for
their organisation,” observes Simon Knechtli, Head of
the Europe, Middle East and African Aviation Team at
Aon. “If new insurance capacity is engaged it can
squeeze out some historic supporting markets on the
insurance programme. While both buyers and insurers
always seek to continue their relationships, the current
philosophy appears to be that reduced cost is the
primary driver and insurers have to be accommodating
and ride-out the downward market cycle to maintain
their position with a client. Every airline should consult
its broker and carefully consider its strategy in the price
versus relationship conundrum. Our role is to use our
experience and market relationships to deliver value on
this finely balanced challenge to ensure that we deliver
our goal of client satisfaction.”
7AIMR Q1-4_061quarter_ 2 3 4

8
> Airline Premium & Claims: All Markets
US
$ B
illio
ns
1998 19991997 2000 2001 2002 2003 2004 2005 2006
Hull War Premium XS AVN52 Premium Source: Aon Market DataAirline Premium
0
1.0
0.5
1.5
2.5
3.5
4.5
5.5
2.0
3.0
4.0
5.0
6.0
Hull War ClaimsAirline Claims


Losses Overview
Loss levels throughout 2006 have once again been
impressive, around 1% lower than the non-attritional
loss rate in 2005 and comfortably below the 1996-2005
average. The estimated figure for 2006 with the
attritional losses taken into account puts the overall loss
total at US$1,273m.
Overall, there was one less incident than in meeting our
criteria in 2005. Interestingly, according to Aon data,
there has been a significant reduction in the number of
losses at the smaller end of the market, with a third
fewer losses in the US$1-10m range.
As technology improves throughout the aviation
industry, it seems that there is a significant
improvement in the loss rates across all bands,
although the main improvements over the last sixteen
years have been in the US$1-10m bracket, in terms of
the numbers of incidents.
Industry debate over the last few years has focused
around whether the safety improvements made at the
top end of the industry would lead to any
improvement among smaller operations and those in
developing countries. Results over the last two years
suggest that the improvements have had an impact,
with 2006 delivering the smallest number of losses in
the US$1-10m range since 1990. 2005 delivered the
fourth smallest amount over the same period.
This would support the suggestion that the focus on
the smaller operations from a safety point of view has
10
1st Quarter
2nd Quarter
3rd Quarter
4th Quarter
Totals
6
11
16
11
44
Crew
6
110
314
105
535
Pax &
Ground
12
121
330
116
579
Total
1.13
1.00
298.56
0
300.69
Liabilities
(US$m)
Hull Losses
(US$m)
57.38
260.15
140.50
45.45
503.48
4
11
7
3
25
US$5m+
10
17
14
8
49
Total
Incidents Fatalities
January
February
March
April
May
June
July
August
September
October
November
December
Total
3
3
4
2
7
8
6
3
5
3
3
2
49
Number of Losses
12.77
9.21
35.40
4.60
165.85
89.70
51.73
25.50
63.27
11.10
10.50
23.85
503.48
Hull Loss
(US$m)
0
0
1.13
0
0.75
0.25
0
188.31
110.25
0
0
0
300.69
Liability Loss
(US$m)
12.77
9.21
36.53
4.60
166.60
89.95
51.73
213.81
173.52
11.10
10.50
23.85
804.17
2006 Total Loss
(US$m)
42.00
8.10
22.80
2.30
33.20
19.10
61.7
403.60
22.10
35.8
5.00
4.30
660.00
2005 Total Loss
(US$m)
Source: Aon Market Data

paid off, although it should always be remembered that
aviation is a catastrophe business and an incident free
year is virtually impossible.
The number of fatalities during 2006 was once again
been cause for concern, although the total fatality
numbers, including passengers, crew and people on
the ground, were down from 2005 and 24% below the
average number of fatalities from 1990-2005.
The number of fatalities in Europe and Latin America
were up on the 1999-2005 average by 21% and 25%
respectively.
In Europe, this was the result of a single loss in Russia in
July, when an Airbus A310-324 operated by S7 Airlines,
formerly Sibir Airlines, landed at Irkutsk but failed to
stop. It collided with a barrier and burst into flames.
124 of the 203 people onboard perished.
The rise in Latin America was similarly caused by a
single incident. In September, following a corporate jet
aircraft colliding with it in mid-air, a Boeing 737-800
operated by GOL Transportes Aereos, crashed into a
densely forested area in the Amazon rain forest. All 154
people onboard the 737 perished, which was flying
from Manaus to Brasilia.
The falling number of incidents would suggest that the
work that has been going on worldwide to improve
safety standards not just in the developed but also in
emerging countries, led by organisations such as
International Air Transport Association (IATA), and its
IATA Operational Safety Audit (IOSA), might be having
an effect.
The reality is that losses have fallen by around 55% since
1990 in real terms. Liability limits have not increased by
55% over the last 16 years, however, and passenger
award levels have exceeded this increase so while the level
of cover has not changed, its reach has diminished.
If there are fewer losses but potentially higher payouts,
the impact of any loss on the market is exacerbated.
11AIMR Q1-4_061quarter_ 2 3 4
US
$ M
illio
ns
Januar
y
Febru
ary
Mar
chApril
May
June
July
August
Septe
mber
Oct
ober
Nove
mber
Dec
ember
Average 1996-2005 2005 2006
0
300
150
450
750
1050
1350
600
900
1200
1500
Source: Aon Market Data
> Cumulative Loss Graph(Excludes September 11th Losses)

12
> Number of Incidents by Value – 1990-2006
US
$ B
illio
ns
199219911990 1998 19991996 19971994 19951993 2000 2001 2002 2003 2004 2005 2006
0
20
40
60
80
100
US$11-50 Million US$51-200 Million Source: Aon Market Data
*Excludes war losses, eastern built aircraft and 9/11
US$1-10 Million
> Number of Fatalities by Region – 1990-2006
Fata
liti
es
199219911990 1998 19991996 19971994 19951993 2000 2001 2002 2003 2004 2005 2006
Source: Aon Market Data
*Excludes war losses, eastern built aircraft and 9/11
Asia Europe Latin America Middle East North AmericaAfrica
0
500
1000
1500
2000

Hull War, Excess Third Party War &
Allied Perils Liability Market Overview
The LSW 555D policy form appears to have become
universally accepted in the hull war market during the
last few months of 2006, with all brokers seemingly
shifting their clients to the new wording. The LSW
555D wording was introduced in March 2006 as a
result of hull war insurers becoming increasingly
sympathetic to the need for increased weapons of mass
destruction (WMD) coverage without the risk of
exposure to ruinous accumulation.
Hull War pricing has fallen somewhat, driven by both
the high capacity in the airline market generally as well
as the lack of major incidents. Reductions have not
tended to be as significant as in the direct insurance
market because there has been concern that the market
has declined to such a level that the market might be
adversely affected by a major wide-body loss.
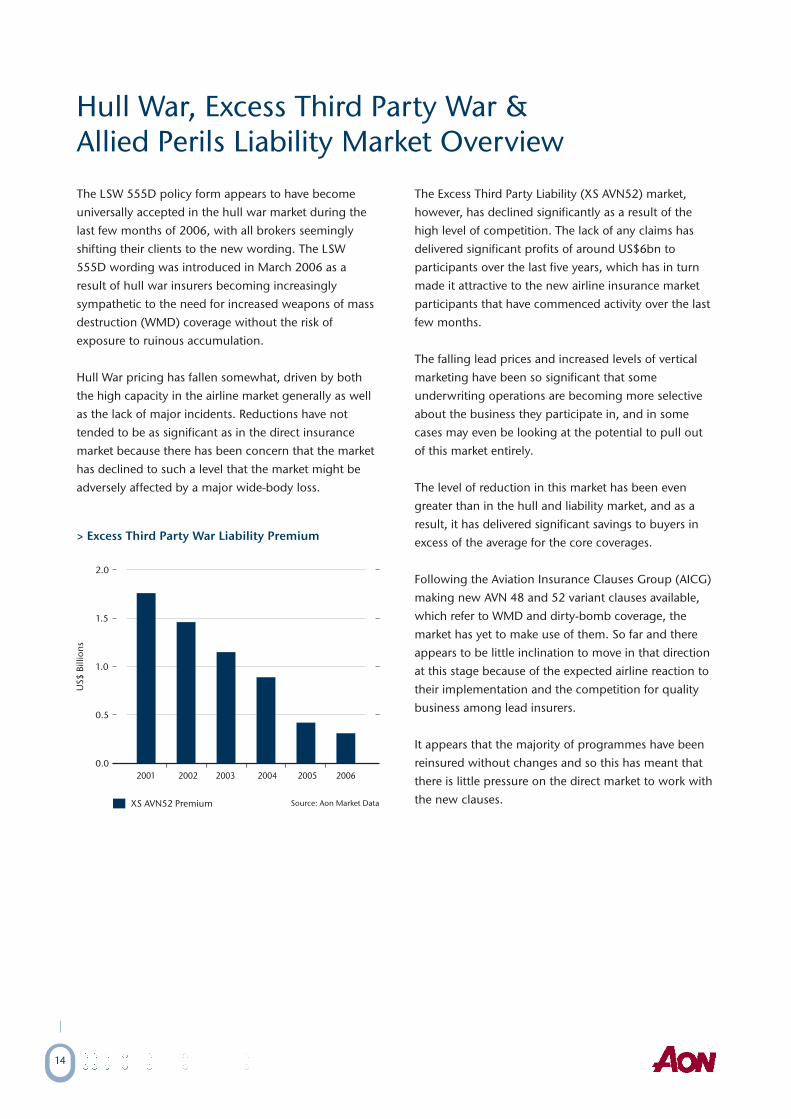
The Excess Third Party Liability (XS AVN52) market,
however, has declined significantly as a result of the
high level of competition. The lack of any claims has
delivered significant profits of around US$6bn to
participants over the last five years, which has in turn
made it attractive to the new airline insurance market
participants that have commenced activity over the last
few months.
The falling lead prices and increased levels of vertical
marketing have been so significant that some
underwriting operations are becoming more selective
about the business they participate in, and in some
cases may even be looking at the potential to pull out
of this market entirely.
The level of reduction in this market has been even
greater than in the hull and liability market, and as a
result, it has delivered significant savings to buyers in
excess of the average for the core coverages.
Following the Aviation Insurance Clauses Group (AICG)
making new AVN 48 and 52 variant clauses available,
which refer to WMD and dirty-bomb coverage, the
market has yet to make use of them. So far and there
appears to be little inclination to move in that direction
at this stage because of the expected airline reaction to
their implementation and the competition for quality
business among lead insurers.
It appears that the majority of programmes have been
reinsured without changes and so this has meant that
there is little pressure on the direct market to work with
the new clauses.
14
US
$ B
illio
ns
20022001 2003 2004 2005 2006
XS AVN52 Premium
0.0
0.5
1.0
1.5
2.0
Source: Aon Market Data
> Excess Third Party War Liability Premium

1quarter_ 2 3 4
> Total Hull War Premium and Claims
US
$ M
illio
ns
1991 1992 1998 19991996 19971994 19951993 2000 2001 2002 2003 2004 2005 2006
0
100
200
300
400
500
600
Hull War ClaimsHull War Premium
Average ClaimsAverage Premium
Source: Aon Market Data

Industry Overview
The airline industry has continued to focus on oil
prices, and pandemic, pension and environmental risk.
Oil prices have continued to be a key issue for the
aviation industry as a whole. While prices have cooled
from some of the record levels witnessed over the last
eighteen months, their fluctuations, often driven by
geo-political incidents rather than simple market
demand, continue to be a major consideration for
aviation organisations.
Meanwhile, the potential impact of a global outbreak of
influenza has driven a great deal of academic debate
over the last eighteen months. From a practical point-
of-view, should there be a major outbreak, the
implications for the airline industry could be significant.
Martin Dockrill, a consultant with Aon Risk Services and
author of the Aon white paper Pandemic Influenza:
Exploding the Myths, says “Aviation is one of the most
vulnerable industries to the threat of an influenza
pandemic. There is a lot of supposition and scare
mongering across the globe about how an outbreak
could impact the business, but airlines and airports need
to have an accurate assessment of their risk to ensure an
effective response in the event of an outbreak.”
Coupled with the economic considerations of high
aviation fuel prices, the current environmental debate,
particularly in Europe and parts of Asia, is leading
airlines to focus on their green credentials. A number of
carriers responded to the current debate and scrutiny of
the industry with high profile announcements.
Meanwhile, during 2006, the aviation industry has very
much focused on the mergers that in the end did not
happen, as well as the few that did.
In North America, after a protracted and relatively
public negotiation process, US Airways has now
dropped its bid for Delta Air Lines.
While nothing resulted from the discussions at this
stage, the talk of Delta and US coming together is said
to have led to United Airlines and Continental Airlines
holding merger talks, and Northwest Airlines is said to
be evaluating possible strategies, including mergers
and acquisitions, to help it out of its current difficulties.
Southwest Airlines stated that it would be very
interested in acquiring any assets that would be sold if
Delta and US had come together.
AirTran Airways made an “unsolicited but friendly”
approach for Midwest Air Group. The initial bid took
place in October and valued Midwest at US$290m, but
this has subsequently been increased to around
US$345m. The bid includes both Midwest Airlines and
Midwest Express.
Meanwhile, in Europe, Alitalia has come into play,
although the Italian government has put a number of
caveats on its sale of 30% of the airline, which may
make it a less attractive target for another international
flag carrier. The government currently owns a total of
49% of the airline, and is said to be looking for new
partners to shore-up the business. The move follows
discussions that were allegedly taking place between
Alitalia and Air France-KLM, which some say may turn
out to be the eventual buyer. According to the Italian
government, it had received 11 expressions of interest
by the end of January.
Ryanair made and subsequently dropped an unsolicited
offer for Irish flag carrier Aer Lingus. The EC launched a
full investigation into the proposed deal, which was
roundly rebuffed by the Aer Lingus management.
Ryanair currently holds around a 25% stake in Aer
Lingus.
Bulgarian carrier Hemus completed its acquisition of
Bulgaria Air, the national carrier.
There have been numerous rumours about other
European flag carriers, suggesting that there is an
16

expectation of further activity. There has already been
significant activity in Europe during 2007, with the
announcement that Thomas Cook and MyTravel are in
the process of coming together. If the move is
successful, it will create an operation with a fleet valued
at over US$4.5bn before synergies.
The government in India is still said to be discussing the
potential to merge Air India and Indian Airlines.
Bringing the two fleets together would create a fleet
valued at around US$4.7bn before synergies.
Meanwhile, despite some rumours to the contrary at
the beginning of the final quarter, there appears to be
no movement on the stalled merger between Air
Sahara and Jet Airways.
Asia has seen major activity focused around Chinese
and Hong Kong-based carriers. Dragonair has become a
wholly owned subsidiary of Cathay Pacific Airlines,
creating an airline with a fleet value of around
US$14bn, the fourth largest in the region, and is also
expected to become an affiliate member of the
Oneworld alliance in 2007. The merger had no impact
on the 2006/7 insurance programmes, which were
again placed separately but in conjunction, although
they are expected to come together for the 2007/8
renewal. Both operations currently renew in November.
Hong Kong-based CR Airways was renamed Hong
Kong Airlines in November following its acquisition
by China’s Hainan Airlines, which is expected to
renew in April.
Macquarie Bank is part of a consortium that is
attempting to gain control of Qantas. The bank was
involved with Ferrovial’s 2006 take-over of British
Airports Authority, and continued to be active in both
the airline and aerospace market throughout the year.
An improved offer has been approved by the non-
executive directors, which could lead to a completed
deal during the first quarter of 2007.
The consortium has said that it has no intention of
breaking up the Qantas group and will look to expand
the business under low-cost subsidiary Jetstar. The
Australian government is said to be looking at the
implications of a takeover.
From an insurance point of view, this activity is likely to
lead to the continuation of the trend for programme
consolidation that has been witnessed over the last five
years. Despite the high number of new operations that
have been set up, and the thriving low-cost sector and
high level of activity that has followed de-regulation in
a number of countries particularly in the Asia, there are
now 6% fewer insurance programmes renewing in
comparison with 2001. The value of the global fleet has
risen by 11% over the same period.
“The aviation insurance market rewards economies of
scale, so bringing programmes together can deliver
significant benefits for airline operators,” says Greg
Boothright, Asia Team Leader for Aon Aviation. “While
joint programmes can mean that a loss can have wider
implications in terms of a programme’s loss history, this
tends to be outweighed by annual premium savings for
an insurance programme.”
As a result of these changes, the premium generated in
the market will increasingly come from fewer major
accounts. Fleets valued in excess of US$5bn already
represent 54% of the market in terms of lead hull and
liability premium and we expect this proportion to
increase over the next decade.
While market price reductions continue across the
board, the impact is more noticeable on the larger
premium programmes. This is on top of any discount
for volume that has been given in the past. The
participation on these larger risks is going to be
increasingly important for underwriting operations to
maintain their participation in the airline insurance
market and competition will continue to be fierce.
17AIMR Q1-4_061quarter_ 2 3 4
As these companies come together, there will be an
increasing number of synergies in terms of route
structure, and older aircraft will be sold on or retired as
a result. This can be expected to continue the process
of making the industry safer, which in turn could drive
premiums down still further.
A merger demands a very effective management
approach, as it can be one of the most exacting and
difficult times in the life of a company. The current
global regulatory and reporting expectations placed
on companies means that there are increasing levels
of expertise required. “Given the challenges facing
top executives in the airline industry, there is a
growing need for products such as Directors and
Officers insurance,” says Kurt Rothmann, Associate
Director at Aon’s European D&O practice. “It has
become an accepted practice for global companies to
carry directors and officers liability insurance
programmes and in fact it is an essential component
when seeking to attract and retain talented main
board executives. Aon is witnessing increasing
demand for its D&O expertise.
18


20
Long Term Data Suggests Market Changes
While the total annual premium for the hull and liability
airline insurance market in 2006 is at a similar level as
2000, there have been changes in the profile of when
the renewals take place.
The main change has come as a result of an increase in
the numbers of renewals in April, May and particularly
July, which has risen from 6% of the total annual
premium renewing in 2001 to over 11% in 2006.
Comparing 2006 renewals with those that took place in
2001 also highlights the declining importance of October
in the renewal season. Although a significant number of
major renewals still take place during the month, in 2001
it represented over 18% of the total annual premium, in
comparison with less than 7% in 2006.
This suggests that there might be a gradual balancing
out of the annual premium profile as airline
programmes look to differentiate themselves and
benefit from the increased attention they can receive by
renewing outside of the final quarter.
Changes to the annual premium profile also highlight
the evolution that has taken place in the airline
insurance market. While the majors, which traditionally
renew during the final quarter renewal season, low-cost
and regional operators have grown in stature over the
last five years, increasing the amount of premium that
renews during the first three quarters.
December has also been through some significant
changes. In 2000, the month represented only around
30% of the total annual lead premium renewed. By
2003, this had grown to over 52% but has
subsequently declined to around 49% as the reaction
to 9/11 subsided.
The differences for October are more marked. Between
2000 and 2002, the month represented nearly 20% of
the total annual lead premium. This has now declined
to under 7% in 2006.
One key point to remember when looking at the
market in this way is the significant softening of the
market that occurred during the final quarter of 2006,
which would have depressed the total annual
contribution. Although there has been a steady change
throughout the last couple of years, it will take another
couple of years before we can state categorically if the
market is changing its renewal pattern.
That said, the process of change to the premium profile
looks set to continue in 2007 when one of the world’s
largest airlines is expected to align its insurance
programme with a full renewal in April. Its recent
renewals have been split between April and November.
It seems possible that there will be further changes
throughout the early stages of 2007, as organisations
look to take advantage of the current premium
reductions available as a result of the spirited
competition in the airline insurance market. With
October representing the start of the cycle, there are
perceived to be significant advantages to renewing
outside of the October to December renewal season in
terms of the level of focus that an airline can expect
from the underwriting community.
With the introduction of a new generation of aircraft
due to take place over the next couple of years,
coupled with the added complication of the
ballooning number of air taxi operations due to be
introduced that will populate the airspace, the
aviation industry is going to continue its rapid
evolution. With this level of unknowns, it continues
to be vitally important that the level of insurance
premium is apportioned correctly and closely reflects
the actual level of risk of each buyer.

1st Quarter 2nd Quarter 3rd Quarter 4th Quarter
Source: Aon Market Data
> Airline Quarterly Premium Profile 2001
1st Quarter 2nd Quarter 3rd Quarter 4th Quarter
Source: Aon Market Data
> Airline Quarterly Premium Profile 2006
21AIMR Q1-4_061quarter_ 2 3 4

22
US Aviation Pandemic Risk Exercise
Highlights Need for Better Preparation
It seems that 2006 was a pivotal year in aviation risk
management. From now on business contingency
planning (BCP) and risk analysis will have a role to play
in understanding how airline operations deal with a
pandemic. Unfortunately little seems to have been
learned from the outbreak of Severe Acute Respiratory
Syndrome (SARS) in 2003.
The need for aviation organisations’ BCP operations to
raise their game became clear in the spring when US
airports undertook an exercise to see how well they
would cope with a significant outbreak. Most were
surprised at how difficult they found it. One operation
simply gave up, admitting it had not really realized how
difficult it would be to house quarantined travellers that
came in on a flight from an infected country. Another
was delighted at the end of the exercise as it had found
a site to house possible infected travellers, until an
inspector pointed out that the building had no
plumbing and as a result was not fit for habitation.
Risk analysis also seems set to play an increased role,
providing assessments of how important certain
airports are. Northwestern University published a major
report that used publicly available data on available
flights between major airports to see how fast disease
could spread.
This piece was subsequently used by the World Health
Organisation (WHO) to consider how it should react
during a pandemic. Echoing what many air operators
have said in the past on risk analysis in aviation, part of its
conclusion stated: “Computers are never going to replace
expertise in risk assessment”. The WHO, however, went
on to state “...but in the future, [computer risk modelling]
will allow us to look at theoretical scenarios how different
interactions would impact them”.
Certainly the report showed where effective risk
modelling could be used to help airlines deal with
disease because it tried to find which hubs are the most
important in the spread of disease. Surprisingly, the
key air travel hubs were not necessarily in the most
popular geographical areas. Paris and Frankfurt, for
instance, have similar levels of air traffic yet Paris is
more crucial in the global air network, and so would
require far more attention from the authorities to stop
any spread of disease.
There is a perception that the task of preparing for an
outbreak of pandemic influenza is so large and far
beyond the day-to-day scope of operations for an
aviation organisation that there is little that can be
done. Equally, there is the comforting belief that
governments will step in and support the industry if
the need arises.
The harsh reality, however, is that there is a massive
need for aviation organisations to be ready for the
worst, because lack of preparedness can have a
significant impact both from the point of view of
corporate responsibility and the bottom line. As Asian
carriers showed following the SARS outbreak,
managing the aftermath of an outbreak can be very
expensive indeed.
As the Aon White Paper showed, we are at the forefront
of helping operations assess not only the BCP aspects
of their operations but also how much a pandemic
could affect a firm’s profit. The aviation industry
learned some hard lessons about its inability to deal
with a pandemic in 2006, many of which it should have
learned in 2003 after SARS. Hopefully, 2007 will be the
year of change.
Martin Dockrill, Consultant with Aon Risk Services and author of Exploding the
Myths: Pandemic Influenza, an Aon white paper published in 2006, provides his
thoughts on attempts during the last year to understand the risk of a pandemic
influenza outbreak.

23AIMR Q1-4_061quarter_ 2 3 4
Don’t Let Your Directors Sink As You
Prepare To Float
It remains to be seen whether the 2006 surge of
aviation industry initial public offerings (IPOs) will ebb
in 2007. As directors and officers (D&O) strive to
prepare a prospectus that attracts investors to their
company, they must also understand that they face
liabilities that could affect them personally.
When raising capital by offering shares on a stock
exchange, companies are bound by strict rules on
how they prepare and verify the information in the
offering document. As the prospectus influences an
investor’s purchasing decision, the information it
contains is strictly regulated to ensure accuracy. If an
investor makes a loss due to misleading information,
anybody named in the document can be held liable
for the costs required to defend themselves as well as
the significant penalties incurred.
Becoming a listed company is one of the greatest risks
that director and officers face in the corporate
environment. If the company does not have D&O
liability insurance in place, it should be seriously
considered to protect senior management, employees
and sponsors from certain claims, such as legal fees
from a regulatory investigation or crisis management
expenses. However, as an IPO is not an everyday
business exposure, many risks are often excluded.
When considering listing liabilities, companies have a
number of options:
Option 1 – retention of risk: Although it is not
recommended and most businesses buy some form of
protection, companies may decide not to insure any part
of the exposures incurred in the proposed flotation.
Option 2 – D&O extension on annual basis: If
considering insurance, companies can purchase a D&O
extension to include public offering of securities
insurance (POSI). This provides cover on an annual
basis with one (aggregate) limit for all claims. The
exposures created in going public are then bundled
with those faced in the normal course of business and
are covered under the same policy.
Option 3 – separate POSI policy: There is an insurance
solution available to protect the specific, long-term
exposures (up to seven years) from raising capital via a
public offering. A D&O policy is also purchased to
cover the day-to-day trading exposures.
Having created the product, insurers believe POSI offers
the best protection from IPO risks. The solution has a
range of benefits in addition to going further than
D&O cover:
Having created the product, insurers believe POSI offers
the best protection from IPO risks. The solution has a
range of benefits in addition to going further than
D&O cover:
Price: as exposure to these risks is low outside the US,
pricing is relatively cheap
Limits: underwriters recommend that companies cover
10-15% of the money raised, which, considering the
huge sums involved, makes an insurance solution an
attractive option
Added security and comfort: knowing that a POSI
policy is in place gives institutional investors comfort
when exiting a company. Also, more companies are
being asked how they are dealing with these liabilities.
As companies go through a public offering they must
protect their directors from unnecessary risks especially
at a time when there is growing shareholder litigation
and increasingly pro-investor changes to legislation.
Tailor-made solutions can offer cover for the full term of
the liability to ensure a flotation takes off smoothly.
As aviation companies continue to raise capital by offering shares on a stock
exchange, Aon’s Transaction Liability Unit outlines how tailor-made insurance
solutions can cover the complex exposures facing your directors and officers.

24
Weather Difficulties Highlight Value of
Derivative Products
The fog which crippled aviation infrastructure in the UK
over the festive season, the difficulties at Bristol Airport
and the storms that have swept the US and Europe,
have highlighted how vulnerable airline operators are
to the weather.
While there were no serious incidents related to the
recent weather conditions, the issues created
highlighted the difficulties that aviation operators can
find themselves in as a result of weather conditions that
are above or below seasonal norm.
Unexpected weather, be it rain, snow, fog or simply
freezing conditions can increase the possibility of flight
delays, diversions or even cancellations, as well as
complicate airport renovation activity. An airline needs
to be able to manage any situations successfully to
ensure that its customers are happy with the service
they receive, but putting travellers up in hotels
overnight or arranging last minute alternative routes
can be a significant drain on even the best managed
bottom lines.
It is not only headline-grabbing weather conditions that
can have an impact. Weather patterns that are simply
one degree above or below the seasonal norm can
create unexpected demand for hot or cold drinks, for
example, that an airline needs to meet to deliver
customer satisfaction and make the most of potential
revenue while minimising aircraft weight.
Weather risk management insurance can offer a way of
balancing any potential impact.
Implementing a weather risk management product
offers an organisation some return in the event of
specified weather related issues. For example, if an
airline regularly flies to an airport where rain forces
diversions, a weather risk product can offer support to
the airline in the event that there are more rainy days
than average.
Well implemented weather risk management
techniques can help ensure that budgeted financial
performance is achieved. At a time when the aviation
industry faces many challenges and severe cash
constraints, the efficient management of all operating
risks is paramount, and purchasing weather risks
contacts can form part of this strategy.
Aon has practitioners that are experienced in
structuring and executing weather risk management
insurance contracts and can help minimise the impact
of adverse weather on the bottom line.
Aon's experienced professionals are able to assist by
analysing the correlation between profits and adverse
weather, supporting a client’s decision as to whether
weather risks can be an effective product for them.

1quarter_ 2 3 4
Looking Ahead
This time a year ago, there was discussion in the market
about when the market would harden, but the market
has continued to be soft, and was getting softer
throughout the final quarter. The level of investment
made by the new market participants to enter the
aviation insurance market means it is unlikely that there
will be any contraction in capacity for the next 12
months, unless there is consolidation in the underwriter
market. As a result, the favourable conditions for airline
insurers buyers will likely continue throughout 2007 and
potentially into 2008.
At the same time, however, there is a chance that some
underwriters, that have been committed to aviation
historically, may look at the level of competition and begin
to reassess their commitment to the market during 2007. It
must also be remembered that aviation insurance
represents a small proportion of the majority of the world’s
largest insurance organisations’ activity and therefore the
desire for participation and spread of risk may be greater
than the significant returns of recent years.
Aviation industry exposure is continuing to enjoy
sustained growth levels and with manufacturer order
books and passenger growth forecasts at the levels they
are this looks set to continue. Fundamentally, it is the
level of claims that drives the price of aviation insurance,
and the recent loss history has continued to be
impressive. While the returns continue to be steady, if
less than spectacular, there may be a temptation to
continue in the aviation insurance market. If this
happens, there may be little to halt the slide in premium.
The significant acceleration in lead hull and liability
premium reductions during the final quarter of 2006
would suggest that the market runs in an October to
October, rather than a January to January cycle.
Grouping together all airlines to suggest an industry or
annual renewal cycle may be a somewhat simplistic
approach, however. There are significant differences to
how the underwriting community approaches different
airline types, with particular benefit being given for
economies of scale. With the concentration of flag
carriers in the final quarter, any change in market
direction will be most apparent during that period.

1quarter_ 2 3 4
Meanwhile, the disparity between the coverage for
weapons of mass destruction (WMD) between the US and
the rest of the world continues. The US government has
once again extended coverage under the US Homeland
Security Act, which offers aviation operations, including
airlines and airports, coverage in the event of a WMD
attack. The reason this coverage is offered is the belief that
such an attack would be the result of government policy
rather than airline activities.
Governments in the rest of the world believe that such an
attack should be provisioned for under commercial
insurance programmes because government intervention
could be perceived as anti-competitive. Aon continues to
use its global reach and reputation to lobby governments
in the best interests of its clients and the aviation industry
as a whole.
Meanwhile, with the amount of merger activity that was
threatened during 2006, it seems likely that there will be a
reduction in the number of programmes renewing during
2007. The activity appears to be taking place in all regions,
with the high level of growth in the Asian market, the
maturing of the low-cost sector in Europe, and the
continuing difficulties of a number of majors in the
Americas operating in bankruptcy all suggesting that there
could be changes in programme composition over the
next 12 months.
The balance between cost effective insurance for buyers
and reasonable sustained returns for underwriters
continues to be difficult. The boom and bust market cycle
however seems too powerful to stabilise for all market
participants. Stable pricing that is influenced by capacity
and claims seems to be out of reach in the current climate.
Premium rates that reflect the level of risk should be the
least that airline insurance buyers should expect.
Loss records are improving in actual US dollar terms
despite the huge increases in exposure that have taken
place over the last five years. The threat of a large
catastrophe remains and exposure levels continue to grow,
and it is this that is playing in the minds of underwriters.
With increased consolidation potentially taking place,
resulting in older aircraft being retired, purchasing power
and risk profiles are improving. More premium will be
derived from the already dominant merged insurance
programmes and competition will increase as a result. This
is taking place in a market that represents a fraction of the
major underwriting organisations’ overall portfolios.

Analysis
> Monthly Analysis
> Regional Analysis
> Fleet Value Analysis
> Sector Analysis

1quarter_ 2 3 4

1st Quarter 2nd Quarter 3rd Quarter 4th Quarter 1st Quarter 2nd Quarter 3rd Quarter 4th Quarter
Source: Aon Market DataSource: Aon Market Data
> Airline Quarterly Premium Profile 2006> Airline Quarterly Premium Profile 2005
Monthly Analysis
30
Percentage
Change
Percentage
Change
Percentage
Change
Total Renewals Fleet ValuePassenger
MovementHull/Liability Premium
January
February
March
April
May
June
July
August
September
October
November
December
Total
1st Quarter
2nd Quarter
4th Quarter
3rd Quarter
Totals
-2%
-5%
-6%
-21%
-17%
+12%
+19%
+16%
+7%
+9%
+4%
+13%
+3%
+3%
+4%
61.78
187.31
245.99
1,186.30
1,681.38
2006
(US$m)
63.03
196.35
261.55
1,510.62
2,031.54
2005
(US$m)
+14%
-12%
+13%
+3%
+2%
Percentage
Change
16
46
45
103
210
2006
14
52
40
100
206
+3%
-13%
0%
-8%
0%
-3%
-8%
-12%
+31%
-22%
-19%
-22%
-17%
+25%
-2%
+14%
+22%
+18%
+18%
+10%
+33%
+55%
+6%
+9%
+6%
+9%
+9%
-7%
+7%
+14%
+14%
+13%
+1%
+9%
+19%
+1%
+8%
+1%
+4%
19.34
12.94
29.50
90.16
51.90
45.25
192.21
26.16
27.62
114.27
250.42
821.61
1,681.38
18.69
14.79
29.55
98.14
51.80
46.41
210.80
29.60
21.15
147.01
307.85
1,055.76
2,031.54
0%
+100%
0%
-4%
-13%
-21%
+17%
-25%
+80%
0%
+10%
0%
+2%
5
4
7
22
13
11
27
9
9
16
32
55
210
5
2
7
23
15
14
23
12
5
16
29
55
206
2005
Percentage
Change
Percentage
Change
Percentage
Change
Total Renewals Fleet ValuePassenger
MovementHull/Liability Premium
2006
(US$m)
2005
(US$m)
Percentage
Change
20062005
Source: Aon Market Data

31AIMR Q1-4_061quarter_ 2 3 4
The start of the year always represents a significant drop both
in terms of the volume and size of renewals, and as a result
averages were heavily influenced by small numbers of renewals
not just in January, but throughout the first half of the year.
January renewal Independence Air, formerly Atlantic Coast,
ceased operations suggesting that the 2005’s contraction in the
number of insurance programmes might continue in 2006,
particularly in the challenging US sector.
Total/
Average
Year
2005
2006
Renewals
5
5
US$bn Percentage Change
3.11
3.41
-2%
+9%
0%
+25%
-5%
+3%
Fleet Value
JanMillions Percentage Change
7.93
9.87
Passenger
US$m Percentage Change
18.69
19.34
Premium
February had the lowest number of renewals and premium of
any month in both 2005 and 2006.
The largest renewal in February was MyTravel, with a fleet that
is nearly five times larger than Tarom. How the MyTravel
programme will be impacted by the proposed merger with
Thomas Cook remains to be seen, although it is unlikely that
there will be any change before at least December when
Thomas Cook renews.
Total/
Average
Year
2005
2006
Renewals
2
4
US$bn Percentage Change
2.42
2.24
-19%
-7%
-25%
-2%
-25%
-13%
Fleet Value
FebMillions Percentage Change
9.40
9.23
Passenger
US$m Percentage Change
14.79
12.94
Premium
The largest renewal in March was Iranair, which represented
nearly 60% of the month’s total premium, making it another
month that was influenced significantly by a single programme.
In terms of changes to March renewals, CCM Airlines extended
its coverage for an extra month under its 2005 terms. Following
its merger with Jetstar Asia, ValuAir was included under the
Qantas programme, but Latin American carrier Tame and
Europe’s InterExpress experienced fleet growth and were
included in our criteria, meaning that the same amount of
renewals took place.
The growth in average fleet value in March followed a 27% rise
in 2005, which was the result of strong fleet growth in a number
of programmes. These changes did not result in a significant rise
in premium, highlighting that the current market environment
means that premium levels do not necessarily grow in tandem
with exposure growth.
Total/
Average
Year
2005
2006
Renewals
7
7
US$bn Percentage Change
2.28
2.44
+27%
+7%
+21%
+14%
-1%
0%
Fleet Value
MarMillions Percentage Change
16.52
18.85
Passenger
US$m Percentage Change
29.55
29.50
Premium

32
April had a total of six renewals with a fleet value in excess of
US$1bn, compared to just three in the first quarter as a whole.
With the second largest number of renewals and the second
highest level of premium outside the final quarter in 2005,
April offered the first real insight into the direction of the
market for 2006, and the trend for exposure growth and rating
and premium reductions was firmly established.
European tour operator TUI Group, which has a fleet value in
excess of US$5billion, was the largest renewal so far in 2006.
With a fleet value of over US$4bn, China-based Hainan Airlines
was the second largest renewal in April, its rapid growth
reflecting the level of development taking place in China and
Asia as a whole.
Jet Airways of India came to market during April while in the
process of trying to complete its protracted acquisition of local
rival Air Sahara. If it had been completed, the airline would
have had a fleet value in excess of US$2.5bn and carried
approximately thirteen million passengers annually, reportedly
representing about half of the domestic Indian market, before
any synergies from the merger were realised.
Total/
Average
Year
2005
2006
Renewals
23
22
US$bn Percentage Change
19.54
22.25
+18%
+14%
+30%
+22%
+5%
-8%
Fleet Value
AprMillions Percentage Change
90.69
110.81
Passenger
US$m Percentage Change
98.14
90.16
Premium
Market activity in May slowed after the relatively busy April.
Despite 13 renewals taking place, the largest three represented
two thirds of the fleet value for the month and nearly half of the
total hull and liability premium that came to market. As a result,
they had significant influence on the full month’s figures.
The month was dominated by the Virgin Group parallel
placement. In 2005, the group contributed 44% of the hull
exposures and 21% of the premium for the month, while in
2006 it represented 54% of the hull exposures and 35% of the
premium. In the first half of the year, the programme
represented 16% of the hull exposures and 6% of the
premium. Passenger growth has also been around 10%.
Taca International and Kingdom Holdings, which previously
renewed in May, extended their renewals to July.
The majority of May’s renewals had both excellent loss
records and significant five-year credit balances, and as a
result they continued the downward pressure on average
premium during 2006.
Tarom changed broker from Marsh to Lockton and extended its
programme from October 2005 into May 2006, becoming the
second largest of the month’s renewals.
Total/
Average
Year
2005
2006
Renewals
15
13
US$bn Percentage Change
13.10
14.91
+17%
+14%
+29%
+18%
+2%
0%
Fleet Value
MayMillions Percentage Change
57.63
67.76
Passenger
US$m Percentage Change
51.80
51.90
Premium
Market activity in June was at a similar level to May in terms of
premium. The 11 renewals that took place represent around
5% of the total annual number of renewals. The size of the
programmes renewing however meant that the month
generated less than 3% of the total annual premium.
Wizz Air, which previously renewed in May, purchased an
extended policy in 2005 and renewed in June to be placed in
parallel with Tiger Airways as a result of common ownership.
Two renewals, Eva Air and Cintra Group, dominated the
month and contributed over half of the premium volume. The
latter is undergoing a significant internal change as a result of
its movement out of state ownership. The new two
independent parts of the business, Aeromexico and Mexicana,
are still placing their insurance business together to ensure
that they benefit from economies of scale.
Total/
Average
Year
2005
2006
Renewals
14
11
US$bn Percentage Change
10.32
11.69
+13%
+13%
+19%
+18%
-12%
-3%
Fleet Value
JunMillions Percentage Change
43.78
51.71
Passenger
US$m Percentage Change
46.41
45.25
Premium

33AIMR Q1-4_061quarter_ 2 3 4
July’s significance in terms of the monthly premium profile
increased further this year, as a result of a number of renewals
migrating into the month. Aigle Azur and Kingdom Holdings
both extended their policies to renew during the month, while
Audeli Air, a new Spanish start-up last year, joined the
selection criteria after significant fleet value increases.
This move away from the year-end renewal season by some
carriers suggests that they are looking to capitalise on the
differentiation they can receive from the market.
As a result of the changes, July consolidated its position as
the third largest premium month in the airline insurance
renewal calendar.
There were 27 renewals in July, representing just over 12% of
the total number of annual renewals for the full year and 11%
of the total annual premium. In terms of the first three
quarters, however, July represented 25% of the renewals and
39% of the premium.
American Airlines was the month’s largest renewal and the first
US major to renew in 2006. Federal Express its changed
renewal date and became the second largest programme in
July in fleet value terms. These were the largest renewals to
have taken place at that point in 2006.
Air India’s programme, another of the largest renewals in July,
came to market with a reduced fleet value. The airline,
however, is making a significant fleet investment, and
discussions continue regarding a formal merger with Indian
Airlines, which is also owned by the Indian government.
SriLankan Airlines, which previously renewed in July, became
part of the Gulf Co-operation Council last year.
Total/
Average
Year
2005
2006
Renewals
23
27
US$bn Percentage Change
51.71
52.08
+4%
+1%
+7%
+10%
-14%
-8%
Fleet Value
JulMillions Percentage Change
168.90
186.06
Passenger
US$m Percentage Change
210.80
192.21
Premium
August saw airline renewal activity levels drop significantly,
with the renewals representing just 2% of the annual premium
volume. Premium volumes have reduced as a number of
programmes moved their renewal date to July, including the
world’s largest cargo carrier programme.
Like the majority of renewals, all but one of the renewals have
generated a market credit over the past five years. The
monthly renewal averages were influenced by a small number
of significant renewals.
The largest fleet to renew in August was UK tour operator
Monarch, the only fleet valued in excess of US$1bn. There
were only three other programmes with fleet values in excess
of US$500m.
Total/
Average
Year
2005
2006
Renewals
12
9
US$bn Percentage Change
3.88
4.22
-3%
+9%
+20%
+33%
-5%
-12%
Fleet Value
AugMillions Percentage Change
16.11
21.36
Passenger
US$m Percentage Change
29.60
26.16
Premium

34
September is one of the quietest months in the aviation
insurance market calendar, with only nine renewals that meet
our criteria. In 2005, the month represented less than 1% of
the total annual premium. Doubling the numbers of renewals
has meant that the month now represents 2% of the total
annual lead premium.
Air Sahara is September’s largest renewal in fleet value terms,
although the current status of its insurance programme is
unclear as a result of the protracted ramifications of its failed
merger with Jet Airways earlier in the year. The company’s
recent US$700m order for 10 Boeing 737-800s would suggest
that its fleet value will continue to grow, and it also announced
14 additional routes would be introduced by the end of 2006.
Centurion Air Cargo extended into September, having
previously renewed in August. SkyWest, which was previously a
September renewal, extended into October in 2005 following
its acquisition of Atlantic Southeast Airlines. It has subsequently
extended into December.
Two of the nine renewals had fleet growth of over 175% as well
as significant passenger growth. Given the limited number of
renewals during the month, these changes drove the significant
rises in fleet value and passenger percentage change.
Total/
Average
Year
2005
2006
Renewals
5
9
US$bn Percentage Change
2.70
3.22
+45%
+19%
+60%
+55%
+12%
+31%
Fleet Value
SepMillions Percentage Change
12.20
18.91
Passenger
US$m Percentage Change
21.15
27.62
Premium
Despite its relative decline over the last few years, October
still marks the beginning of the airline insurance market’s
renewal season.
October’s prominence remains significant in terms of the
average amount of premium per renewal. It still delivers the
third highest average premium per renewal of the year, and
was only around 11% lower than November. The ratio actually
narrowed in comparison with 2005, when there was a 30%
difference between average premium per renewal compared
with November. By this gauge, the month was only a fraction
higher than July in 2006, however.
There are six airlines that renew in October with a fleet value
of over US$1bn, two with more than US$6bn. Overall, nine of
the 16 renewals have fleets valued at over US$500m.
Consolidation had an impact, with Mandarin Airlines, which
previously renewed in October, now being included in the
China Airlines programme, which achieved a significantly
above average premium reduction. Indian Airlines also
received an above average premium reduction, setting the
trend for the renewal season.
There were also changes to renewal dates, with American
Trans Air migrating its renewal to December.
Skywest Airlines (USA) was the second largest airline to renew
so far in 2006, with a fleet value in excess of $6bn. The airline
witnessed a small increase in exposures and was placed on a
parallel with Mesa Airlines and Republic Airways, although the
latter renewed in November. All three airlines are expected to
renew in December in 2007.
Total/
Average
Year
2005
2006
Renewals
16
16
US$bn Percentage Change
25.67
25.96
+12%
+1%
+19%
+6%
-18%
-22%
Fleet Value
OctMillions Percentage Change
90.73
96.06
Passenger
US$m Percentage Change
147.01
114.27
Premium

35AIMR Q1-4_061quarter_ 2 3 4
There were over 30 airline insurance programmes renewing
with a fleet value of more than US$150m during November.
Of these, more than half had a fleet value of over US$1bn,
compared with just six in October.
The largest renewal of the month was the Gulf Co-Operation
Council programme. This continued to swell, having added
Jazeera Airways to its roster in 2006, following the addition of
Yemenia and SriLankan Airlines in 2005. The group’s exposures
increased by more than 10%.
The addition of Dragonair to the Cathay Pacific Airways
insurance programme, following the latter’s acquisition of the
former, is expected to remove a fleet valued at over US$2bn
from the numbers for November for future renewals.
Another significant change to the list of November renewals
was British Airways’ decision to extend its programme and
renew in April 2007. This will potentially add around 20% to
the premium contribution April makes next year, but remove
around 11% of the November premium.
Total/
Average
Year
2005
2006
Renewals
29
32
US$bn Percentage Change
114.82
123.83
+10%
+8%
+13%
+9%
-10%
-19%
Fleet Value
NovMillions Percentage Change
239.43
260.72
Passenger
US$m Percentage Change
307.85
250.42
Premium
December’s renewal list contains the largest number of
renewals and many of the world’s largest airline insurance
programmes. In total, 55 programmes with a fleet value of
over US$150m renewed during the month.
Of these, 16 had a fleet value of US$5bn, and three had a fleet
value of over US$30bn, highlighting the impact of the
December renewal season on premium levels for the rest of
the year.
The Civil Aviation Authority of China (CAAC) fleet increased by
16% for its 2007/8 programme, making it the world’s largest
airline group placement.
Lufthansa is now the third largest airline group by fleet value.
Its fleet fell by 2% due to the removal of Thomas Cook Airlines,
which also renewed on a stand alone basis this month.
In terms of average premium per renewal, December was over
twice the average for the rest of the year, despite the year-on-
year decline in total premium.
The Royal Air Maroc (RAM) and Tunisair group programme
split, so the airlines were placed separately. The RAM
programme is now placed by JLT, while Aon places the newly
re-named Tunisian Airline Team.
It is interesting to see that while consolidation is still
happening, some airlines are deciding that, rather than getting
lost under a group placement, they want to take more control
of their insurance programme, not reliant on the loss ratios of
others, and with market conditions meaning that for some
there may not be a significant pricing differential.
Total/
Average
Year
2005
2006
Renewals
55
55
US$bn Percentage Change
323.43
328.02
+5%
+1%
+8%
+6%
-6%
-22%
Fleet Value
DecMillions Percentage Change
1,348.18
1,432.44
Passenger
US$m Percentage Change
1,055.76
821.61
Premium

36
Regional Analysis
The significant reductions in lead premium are fairly
evenly spread across all regions, with only
Latin America receiving a single digit reduction, mainly
the result of significant exposure growth and some
recent loss activity. Reflecting the competition that
currently exists among underwriters in the expectation
of continued growth, Asia enjoyed the most significant
reduction in lead hull and liability premium.
Latin America and the Middle East continue to see the
fastest growth in fleet value, building on +21% and
+10% respective growth levels for the whole of 2005.
The size of exposure in these regions means that there
is a significant difference between the actual and the
percentage growth figures.
Only North America has seen fleet decline, following a
+2% fleet growth in 2005, as the region downsizes and
renews rather than expands its fleet in the difficult
economic environment.
The fleet investments that have been made in the
Middle East and Latin America appear to be paying off
at this stage and are being reflected by strong
passenger growth, although there has been double
digit passenger growth in all regions except Asia and
North America. While this may seem somewhat
surprising in the context of the various growth stories
to come out of Asia in recent years, it should be
remembered that many Asian carriers are awaiting
deliveries of new generation aircraft, some of which are
not due until well into the next decade.
In terms of lead premium contribution, there has been
little year-on-year change, with North America
declining fractionally and contributing just under 32%
of the total annual amount in 2006, compared to just
over 32% in 2005. In terms of fleet value, however,
the dominance of North America continues to decline.
Since 2001, the region’s proportional share of the
global fleet has fallen from 37% to 31% in 2006, as
airlines in the region focus on continuing route
consolidation and load factor improvements, and
airlines outside the region continue to grow
significantly.
The cost of insurance per passenger has declined fairly
evenly by around a quarter for all sectors.
Europe Asia North America Latin America Middle East Africa
Source: Aon Market Data
Renewals Premium Credit Balance

Africa
Middle East
Europe
Asia
North America
Latin America
Total/Average
1,045.45
1,073.08
959.33
1,214.55
1,165.73
926.67
1,075.69
Total
(US$m)
-17%
-13%
-16%
-20%
-18%
-2%
-17%
Percentage
Change
59.21
83.36
453.63
474.87
535.44
74.87
1,681.38
2006
(US$m)
71.66
96.22
541.75
591.18
654.28
76.46
2,031.54
2005
(US$m)
11
13
75
55
41
15
210
2006
Total Renewals Premium Average Liability Limit
8
14
76
47
44
17
206
2005
1.78
1.01
0.70
0.79
0.66
0.69
0.73
US$
-25%
-22%
-25%
-25%
-22%
-26%
-24%
Percentage
Change
+10%
+11%
+12%
+7%
+4%
+32%
+9%
Percentage
Change
33.20
82.92
649.97
600.32
813.16
108.03
2,287.60
Total (m)
+3%
+10%
+6%
+7%
-3%
+21%
+4%
Percentage
Change
13.29
41.75
159.03
178.01
186.41
16.26
594.75
Total
(US$bn)
Credit Balance* Fleet Value Passengers Cost Per Passenger
150.08
390.43
1,542.47
1,986.10
3,030.47
150.98
7,250.53
Total
(US$m)
Africa
Middle East
Europe
Asia
North America
Latin America
Total/Average
Source: Aon Market Data
* Excludes 9/11 losses
Latin
America
Africa Middle
East
Europe Asia North
America
Latin
America
Africa Middle
East
Europe Asia North
America
Source: Aon Market DataSource: Aon Market Data
> Regional Fleet Value 2006 > Regional Passenger Numbers 2006
37AIMR Q1-4_061quarter_ 2 3 4

38
This region is dominated by the Gulf Co-operation Council
(GCC) group programme, which included 13 airline
organisations in the current renewal. The GCC has been
responsible for a large amount of the decline in lead premium
in the region, reflecting the airline insurance market’s tendency
to reward the economies of scale that come with placing a
group programme which has grown both organically and
through acquisition from 10 airlines in 2004.
The region has the second largest growth in fleet value, built
on strong growth in two programmes. Growth in passenger
numbers has been strong across all programmes. The growth
in 2006 follows strong growth in 2005, when fleet values in
the region grew 23% and passenger numbers were up 28%
compared to 2004.
Growth is likely to continue strongly over the next few years as
aircraft that are currently on order are delivered and the region
continues its ambitious growth plans.
The region’s credit balance has grown slightly in comparison
with the reported numbers for 2005.
Total annual lead premium for Europe has fallen by a slightly
lower than average amount in 2006, while passenger growth
has been the second largest. Fleet value growth, however, has
been modest.
The region continues to have the largest number of renewals,
over a third of the global total, although Asia is climbing
rapidly. This reflects the high number of low-cost and regional
airlines that operate in Europe, as well as the rapid expansion
of activity in the former Eastern European states, where
increased use of western built aircraft should continue to
improve safety figures.
While the region contributes around 35% of the total number
of renewals, Europe generates only 27% of the total lead
premium and a similar amount of the total fleet and
passengers. This highlights the number of low-cost and
smaller organisations that operate in the region. In 2005, the
region represented 28% of the total annual lead premium,
29% of the total global fleet and 30% of total passengers,
from around the same proportion of renewals.
Given the level of discussion that is currently taking place in the
market, it seems likely that 2007 will witness some potentially
significant consolidation over the next twelve months.
The region has the third largest credit balance, which has
fallen by 25% since 2005, but interestingly the second lowest
average liability limit.
Middle East
Europe
The number of renewals in Africa has grown during 2006. At
first glance, this could reflect the growth of the aviation
industry in the region, but there has also been a split in a
major group programme and there was a decline in the
number of renewals between 2004 and 2005.
This highlights difficulties in trying to directly compare the
programmes that renew from year to year. The region is also
significantly influenced by a small number of large renewals.
Africa has enjoyed the third largest decline in premium,
although it also makes the smallest annual lead hull and
liability premium contribution and as a result is more
susceptible to relatively small changes in the numbers.
In the region where passenger award levels are at the lowest
end of the scale, the total cost of insurance per passenger is by
far the largest in the world. That said, it has decreased
significantly since 2005, when it stood at US$2.47 per
passenger.
As a result of our selection criteria, Africa is almost entirely
comprised of flag carriers.
Africa

39AIMR Q1-4_061quarter_ 2 3 4
North American carriers enjoyed the second largest average
lead premium reduction during 2006, although exposures did
not see anywhere near the level of change witnessed in other
regions, as the total fleet value declined and passenger
numbers showed only a slight rise. This highlights the airline
industry’s maturity in the region.
The decline in fleet value is built on carriers in the region’s
concentration on aircraft downsizing, and the increasing use of
regional as opposed to wide-body aircraft as operators attempt
to improve load factors and focus on economic routes.
Prior to the renewal season, North American programmes
showed an average -8% reduction in lead premium. The
acceleration of average reductions to -18%, very much in line
with the global average reduction of -17%, reflects the region’s
importance in terms of the global airline insurance market.
North America’s strong safety record is reflected in its credit
balance, which remains over US$3bn, the largest amount
globally. This highlights that despite the size of potential
payouts, the region continues to be highly profitable for
underwriters.
The US federal government’s Aviation War Risk Insurance
Program, which underwrites US carriers’ terrorist and war
risk, complicates premium comparisons on a global level and
saves the equivalent on average of a further 27% of the hull
and liability premium from some of the world’s largest
insurance programmes.
North America
Latin America’s average lead premium reduction was the lowest
of any region, but the growth of the low-cost airline industry is
reflected by it having the highest rise in passenger growth and
fleet value. That said, Latin America is still the third smallest of the
six regions, and as a result any change in passenger numbers or
fleet value can have a disproportionate impact.
Following a number of significant hull losses during 2006, the
region’s credit balance has reduced by half compared to 2005.
The region has the second lowest cost per passenger, reflecting
the region’s relatively low average pay-outs.
Latin America
Asia’s growth is exemplified by the increase in the number of
insurance programmes that have been placed during 2006.
The region witnessed 55 renewals with a fleet value of over
US$150m, compared to 39 in 2004, as governments in the
region continued to liberalise and operators vie for a slice of
the region’s large number of potential passengers.
Despite the growth in the number of programmes and exposure,
average lead premium has actually declined -20% over the last
year, the highest level of decline globally. This builds on a -8%
average lead premium reduction recorded in 2005.
The region has the fourth lowest level of insurance cost per
passenger, which has fallen by the most significant level over
the last twelve months.
Fleet value grew by +7%, the same number reported in 2005.
Passenger numbers also grew +7% in 2006 but slowed
compared to +11% in 2005.
The region has the second highest credit balance after North
America, reflecting Asia’s significant premium volume and
much improved safety record over the last five years.
Asia’s hull and liability lead premium contribution held fairly
steady compared to 2005 at just below 30% of the total
global amount.
Asia

Looking at the aviation insurance market by fleet value
highlights the impact that the major carriers have on
the total hull and liability premium levels. While the
sector of the industry with fleet values of more than
US$5bn only contributes 13% of the total number of
renewals, it contributes around 70% in terms of
premium. At the other end of the industry, airline
operations with fleet values of US$150-500m contribute
43% of the total number of renewals, but only 12% of
the premium.
All five sectors have seen a decline in lead premium,
although the reductions have been most apparent
among the larger programmes, reflecting the benefits
that underwriters offer to larger programmes. This
factor may continue to encourage consolidation in
insurance programmes among established low-cost
and regional carriers.
At the same time, the growing trend for larger grouped
risks means that the participation of these programmes
becomes increasingly important to the effective
functioning of the airline insurance market.
The smaller operations, however, continue to enjoy
good loss records, strong growth in passenger
numbers and fleet values as they tap into new potential
passenger groups globally.
Premium reductions appear to have been split along a
size divide, with the top three sectors receiving
significant reductions while the bottom two sectors
have more modest premium reductions, highlighting
perhaps that the few pay for the losses of the many in
the airline insurance industry.
The key reason for the premium divide in the airline
insurance market through 2006 is the renewal
pattern. The final quarter renewal season sees the
majority of major airlines renew, and in 2006, this
coincided with the introduction of significant levels of
new capacity coming into the insurance market. This
new capacity was keen to gain business and as a
result offered attractive premium reductions on the
significant premium volumes that the established
operations had to follow in order to maintain their
airline insurance portfolios.
A second factor in the reductions is the significant credit
balances that the three largest sectors have built up,
which gives them a strong negotiating position when it
comes to the renewal process.
The final factor is the credit that the airline insurance
market gives for economies of scale, which has also
been a factor in driving insurance programme
consolidation over the last few years.
Meanwhile, based on the information that we have
collected, airline operations below the US$150 fleet
value threshold that Aon applies for inclusion within
this review add a further US$186m to the annual lead
premium total. This sector of the market also has a
significant credit balance.
Fleet Value Analysis
40

AIMR Q1-4_061quarter_ 2 3 4
41
US$5bn+
US$2-5bn
US$1-2bn
US$500m-1bn
US$150-500m
Total/Average
1,707.14
1,238.33
1,277.08
922.43
836.98
1,075.69
Total
(US$m)
-22%
-12%
-21%
-4%
-2%
-17%
Percentage
Change
912.12
297.74
154.16
115.58
201.78
1,681.38
2006
(US$m)
1,171.32
339.61
194.08
120.75
205.78
2,031.54
2005
(US$m)
28
30
24
37
91
210
2006
Total Renewals Premium Average Liability Limit
27
30
28
32
89
206
2005
0.62
0.66
1.13
1.12
1.65
0.73
US$
-24%
-29%
-24%
-20%
-25%
-24%
Percentage
Change
+3%
+24%
+5%
+19%
+30%
+9%
Percentage
Change
1,476.00
449.95
136.25
102.90
122.50
2,287.60
Total (m)
+1%
+16%
-1%
+14%
+14%
+4%
Percentage
Change
411.91
98.26
32.94
25.19
26.44
594.75
Total
(US$bn)
Credit Balance Fleet Value Passengers Cost Per Passenger
4,519.96
1,249.82
826.05
245.24
409.47
7,250.53
Total
(US$m)
US$5bn+
US$2-5bn
US$1-2bn
US$500m-1bn
US$150-500m
Total/Average
Source: Aon Market Data
* Excludes 9/11 losses
US$1500-500m US$500-1bn US$11-2bn US$2-5bn US$5bn+
Source: Aon Market Data
Renewals Premium Credit Balance

42
The relatively modest growth in both fleet value and
passengers reflects the maturity of airlines in the largest sector
of the airline industry. The sector is composed of a variety of
different carrier types and continues to command the highest
rate of premium reductions as the underwriting community is
currently competing fiercely for participation in the largest
global programmes.
Basically static fleet growth underscores the maturity of
operations in this sector, which has focused on fleet
replacement rather than growth over the last few years.
Fleet value growth in 2005 was +5%, and is likely to remain
fairly static for the near future as this sector includes the
majority of launch customers for the Airbus A380 and the
Boeing 787 Dreamliner. That said, the introduction of these
new aircraft might not lead to instant growth in fleet value
as they could be used for greater slot consolidation through
increased capacity.
This sector has the largest credit balance of any of the sectors,
contributing 62% of the annual total. As result, there will be
continued pressure on underwriters to recognise and reduce
the level of premium that operations in this sector contribute.
The strong loss record over the last five years will also be a
factor in this as operations negotiate their 2007/8 renewals.
This sector has the lowest insurance cost per passenger, and it
has also received the third largest reduction. In 2005, it also
had the lowest cost per passenger, but had the third lowest
premium reduction.
The sector is over two thirds made up of flag carriers.
US$5billion+
This sector has once again delivered strong average lead
premium reductions, following the -10% reduction recorded
in 2005. It should be remembered, however, that
underwriters are increasingly looking at programmes on an
individual basis and as a result there has been a wide
spectrum of premium changes, reflecting the wide variety of
different types of operations that make up this sector.
Low-cost operations now comprise a third of organisations
in the second largest sector of the market, while in 2001
there were no low-cost airline organisations in this sector of
the airline market. This reflects the growth of this business
model over the last decade.
Fleet value has risen by the largest amount of any of the
sectors during 2006, which builds on the +14% growth it
witnessed in 2005. Passenger growth has also been strong,
and has accelerated since the +15% recorded last year.
The sector has built a strong credit balance, a key factor in
the average lead premium reductions that have been
witnessed during 2006. This again highlights that increases
in exposure do not directly translate into claims.
US$2-5billion
There has been a decline in the number of operations in this
sector, as a result of fleet changes that have led to some
operations moving into the sector above, and some slipping
into the sector below. Nearly half of the operations in this
sector are flag carriers.
Mainly as a result of these changes, this is the only sector to
record a decline in fleet value during 2006. The largest fleet
reduction and the largest fleet growth were both at two
separate North American operations.
In 2005, fleet value in this sector only rose +3%, and
passenger numbers only rose +7%, suggesting that this is one
of the more stable sectors in the airline industry when
examined in this way.
US$1-2billion

43AIMR Q1-4_061quarter_ 2 3 4
This sector of the market continues to grow strongly, with two
operations joining as a result of fleet value growth. While there
has been a significant growth in fleet value and the numbers of
passengers in this sector, premiums have been fairly stable,
suggesting that the current levels of competition in the airline
insurance market are leading to insurance programmes
receiving the same cover despite increased exposure.
As last year, this sector contributes the lowest level of premium
of any group in the industry. Despite there being two more
renewals in this sector compared to 2005, premium has
continued to fall, albeit by a more modest amount than some of
the larger sectors when the market is examined in this way.
Fleet value has risen strongly, as have the number of passengers
carried, following similar growth trends to last year when they
rose +15% and +23% respectively.
Another factor in the relatively modest premium reduction is the
fact that this sector has the lowest credit balance of any.
Highlighting the vigour of the airline industry in Asia and
Europe, 70% of the operations in this sector come from these
regions where low-cost and charter airlines are flourishing.
US$500million-US$1billion
The smallest fleet value sector of the market has also recorded
the lowest average lead premium reduction. At the same time,
it has also enjoyed the quickest rise in passenger numbers as
well as showing a healthy rise in fleet value. This is the third
year in a row that this band has shown a greater than 30% rise
in passenger numbers.
Like the US$500m-1bn sector, a high proportion of operations
in this sector come from Europe and Asia, reflecting the
liberalisation process that has occurred in the airline industries
in these regions.
Credit balance is the second lowest in the industry, which
reflects the relatively modest premium reduction witnessed
over the last twelve months.
US$150-500million
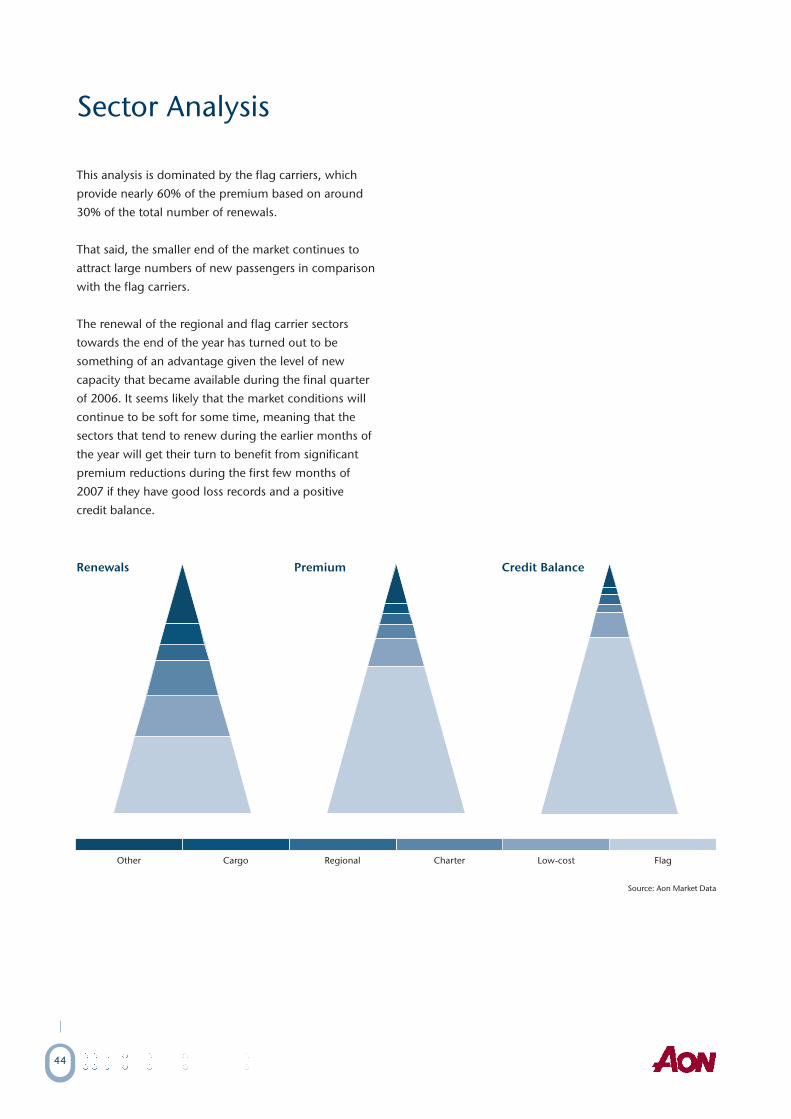
Sector Analysis
This analysis is dominated by the flag carriers, which
provide nearly 60% of the premium based on around
30% of the total number of renewals.
That said, the smaller end of the market continues to
attract large numbers of new passengers in comparison
with the flag carriers.
The renewal of the regional and flag carrier sectors
towards the end of the year has turned out to be
something of an advantage given the level of new
capacity that became available during the final quarter
of 2006. It seems likely that the market conditions will
continue to be soft for some time, meaning that the
sectors that tend to renew during the earlier months of
the year will get their turn to benefit from significant
premium reductions during the first few months of
2007 if they have good loss records and a positive
credit balance.
44
Other Cargo Regional Charter Low-cost Flag
Source: Aon Market Data
Renewals Premium Credit Balance

AIMR Q1-4_061quarter_ 2 3 4
45
Flag
Low-cost
Charter
Regional
Cargo
Other
Total/Average
-21%
-6%
-13%
-18%
-8%
-13%
-17%
Percentage
Change
964.71
185.07
88.24
108.35
64.29
270.71
1,681.38
2006
(US$m)
1,219.05
197.52
101.62
132.67
69.89
310.79
2,031.54
2005
(US$m)
61
33
25
25
16
50
210
2006
Total Renewals Premium
64
26
26
26
15
49
206
2005
0.72
0.48
1.14
0.71
N/A
0.80
0.73
US$
-23%
-23%
-14%
-29%
N/A
-26%
-24%
Percentage
Change
+3%
+22%
+1%
+16%
N/A
+18%
+9%
Percentage
Change
1,337.55
382.40
77.55
153.04
N/A
336.77
2,287.60
Total (m)
-1%
+15%
+4%
+10%
+6%
+15%
+4%
Percentage
Change
380.01
50.19
20.83
29.41
34.57
79.74
594.75
Total
(US$bn)
Credit Balance* Fleet Value Passengers Cost Per Passanger
4,323.49
687.04
298.96
296.75
200.92
1,443.37
7,250.53
Total
(US$m)
Average Liability Limit
1,346.72
918.18
1,071.20
758.00
1,037.50
1,022.30
1,075.69
Total
(US$m)
Flag
Low-cost
Charter
Regional
Cargo
Other
Total/Average
Source: Aon Market Data
* Excludes 9/11 losses

46
Generally, the sheer size of the insurance programmes in this
sector and the premium volume they generate enables them
to secure the best possible reductions. Flag carriers have also
contributed around 70% of the credit balance during 2006,
which has also been a significant factor in enabling the sector
to negotiate significant premium reductions.
Reflecting the impact of new capacity during the final
quarter and the benefit given for economies of scale in the
airline insurance market, the flag carrier sector has enjoyed
significant reductions in lead hull and liability premium
during 2006.
Mainly as a result of activity in North America, this is the
only sector to record a reduction in fleet value during 2006.
This reflects the steps being taken in the region to improve
profitability by introducing smaller, more economical
aircraft and withdrawing from less efficient routes in the
region as a number of carriers attempt to move out of
bankruptcy protection. This has resulted in four of the five
North American flag carriers recording reductions in fleet
value. Reflecting the maturity of the industry particularly in
North America but also across this type of operation
globally, passenger growth among flag carriers in the region
has been modest.
This sector contributes 60% of the premium, highlighting that
perhaps in reality the few pay for the losses of the many.
During 2005, premium in this sector fell by -11%, while fleet
values rose by +5% and passenger numbers rose by +6%.
The flag carriers contributed 62% of the fleet and 59% of
the passengers in 2006, compared to 69% of the fleet and
66% of the passengers in 2005. This reduction highlights
the continued growth of smaller carriers across the industry.
Flag
Fleet values and passenger numbers have continued to rise,
building on a +20% and +24% increase reported for 2005. In
terms of fleet investment, North America and Europe only
increased their average fleet value by 20% and 19%
respectively, while Asia increased 51%. Low-cost carriers in
Latin America increased their fleets by nearly 75% on average,
although these numbers are based on only three programmes.
In terms of passenger numbers, low-cost carriers in Asia grew
most quickly at +41% during 2006. Europe, considered to be
relatively mature in terms of the low-cost model, reported a
+20% increase.
While passenger numbers and fleet values have risen
dramatically in the low-cost sector, the average lead premium
has still fallen by -5%, driven by the current level of
competition among underwriters.
Cost per passenger continues to be the lowest in the industry,
but average premium reductions fell by the lowest rate during
2006. This suggests that while some sectors of the industry
can continue to fall further, the low-cost sector has begun to
come close to its nadir.
That said, low-cost carriers continue to focus their renewals
during their first three quarters of the year, so the sector may
decline further when 2007/8 renewals are negotiated as they
take advantage of prevailing market conditions.
The excellent loss record of this sector is highlighted by the
credit balance that has been generated by programmes in this
sector also highlights that because of safety improvements
across the industry in the last ten years, more exposure does
not necessarily translate into higher claims.
Low-cost
47AIMR Q1-4_061quarter_ 2 3 4
Charter airlines received the second lowest level of premium
reduction, as a result of significant fleet investments and
subsequent growth in passenger numbers. At the same time,
we reported in the last annual airline review that charter airlines
witnessed the second highest lead premium reduction during
2005, so the relatively low reductions may be the result of the
sector evening itself out, or equally the fact that nearly 75% of
renewals in this sector took place during the first few quarters of
2006, before the new insurance capacity became available.
Interestingly, this band recorded the lowest fleet growth in
2005, and has once again had a relatively low increase in fleet
value during 2006.
Charter airline activity is focused on Europe, where 80% of the
programmes are based, mainly as a result of the region’s
historical development.
Charter
The robust health of operators in this sector, at least from an
insurance point of view, is shown by it receiving the second
highest premium reduction during 2006 while at the same time
growing its fleet value and passenger numbers by double digits.
That said, the growth has calmed somewhat from 2005, when
fleet value surged by 32% and passenger numbers by 37%. The
cost of insurance per passenger has fallen by the highest amount.
The sector is dominated by European and Asian carriers, which
contain nine regional carriers each, while North America has five.
The main reason for this is that the majority of regional
operations in the US are included under larger flag carrier
programmes
Following the strong growth in the number of regional airlines in
2005, there has been a slight reduction in the number of
operators in this sector during 2006 as a result of consolidation at
the operational level and in terms of insurance programmes.
Regional
The cargo sector has continued its solid growth over the last
twelve months, with the -8% premium reduction for 2006
coming on the back of a +3% premium growth in 2005. The
cargo sector continues to have difficulties as a result of what is
perceived as a poor loss record, although the good credit
balance that the sector has built up during 2006 belies this belief.
The sector’s risk profile is gradually being improved by the
introduction of modern, purpose built aircraft into cargo
fleets over the last few years, replacing repurposed aircraft
that had been retired from passenger fleets. At the same
time, however, this will have an impact as a result of higher
valued hulls being covered.
There has not been a repeat of the cargo carrier consolidation
witnessed in 2005, but given the level of activity in the airline
industry as a whole, it would not be surprising if there was
further activity in 2007.
Cargo

48
Publications Produced by
the Aon Global Practice
Aviation & Aerospace
during 2006
> Airline Insurance Market Review Pre-Renewal Season 2006
> Airline Insurance Market News January 2006
> Airline Insurance Market News February 2006
> Airline Insurance Market News March 2006
> Airline Insurance Market News April 2006
> Airline Insurance Market News May 2006
> Airline Insurance Market News June 2006
> Airline Insurance Market News July 2006
> Airline Insurance Market News August 2006
> Airline Insurance Market News September 2006
> Airline Insurance Market News October 2006
> Airline Insurance Market News November 2006
> Airline Insurance Market News December 2006
> Aerospace Insurance Market Review, January to August 2006
> Aerospace Insurance Market News January 2006
> Aerospace Insurance Market News March 2006
> Aerospace Insurance Market News May 2006
> Aerospace Insurance Market News July 2006
> Aerospace Insurance Market News September 2006
> Aerospace Insurance Market News November 2006
Solution Briefs:
> Actuarial & Analytics
> Aggression Management
> Aviation Training and Seminars
> Computer Network Risk Insurance
> Directors & Officers Coverage
> Enterprise Risk Management
> Residual Value Insurance
> Weather Risk Management
Special Bulletin:
> Aviation Insurance Clauses Group

FEEDBACK ON ISSUES
SUGGESTIONS FOR FUTURE COVERAGE
COMMENTS AND ENQUIRIES ON DESIGN AND PRODUCTION
STEVEN DOYLE
AON GLOBAL, AVIATION
EMAIL: [email protected]
TEL: +44 (0)20 7216 3914
MAGNUS ALLAN
AVIATION INDUSTRY JOURNALIST
EMAIL: [email protected]
TEL: +44 (0)20 7086 1277

Published by Aon Limited
Registered office 8 Devonshire Square, London EC2M 4PL
© Copyright Aon Limited 2007. All rights reserved.
No part of this publication may be reproduced, stored in a
retrieval system, or transmitted in any way or by any
means, including photocopying or recording, without the
written permission of the copyright holder, application for
which should be addressed to the copyright holder.
Aon Limited is authorised and regulated by
the Financial Services Authority in respect of
insurance mediation activities only.
FP3655
Aon Limited
8 Devonshire Square
London EC2M 4PL
United Kingdom
tel: +44 (0)20 7623 5500
fax: +44 (0)20 7621 1511
www.aon.com