Embed Size (px)
Citation preview

Wageningen UR, 07 Oct. 2004 Symposium on “Trends in Geo-Information”
Airborne SpectroscopyAirborne Spectroscopy
Challenges Challenges -- PerspectivesPerspectives
Part 1: ChallengesPart 1: Challenges Klaus I.Klaus I. IttenItten, RSL, RSL
Part 2: PerspectivesPart 2: Perspectives Jens Jens NiekeNieke, RSL, RSL

Wageningen UR, 07 Oct. 2004 Symposium on “Trends in Geo-Information”
Airborne SpectroscopyAirborne Spectroscopy
Part 1: Challenges Challenges

Wageningen UR, 07 Oct. 2004 Symposium on “Trends in Geo-Information”
... a few definitionsImaging spectroscopy... is the art and science of analysing hyperspectral data
whereas
Imaging spectrometry... is the engineering task and science of making the hyperspectraldata available, e.g defining and building the instrument and taking the data in a meaningful way
in brief, hyperspectral remote sensing means... taking data in a great number (>>10) of spectrally contiguous bands with the aim of allowing for spectral analysis of measuredobjects

Wageningen UR, 07 Oct. 2004 Symposium on “Trends in Geo-Information”
Imaging SpectrometryImaging Spectrometry
Spectral Range: 380-2500 nmSpectral Bands: 200-300Flight altitude range: 2 - 20 km

Wageningen UR, 07 Oct. 2004 Symposium on “Trends in Geo-Information”
Airborne vs. spaceborne imaging spectrometry
Airborne imaging spectrometry- higher ground resolution (IFOV) vs. space based systems- more flexible in terms of time and spatial coverage- local to regional scale applications- cal/val for space missions- applications development for space missions- constrained by cloud cover
Spaceborne imaging spectrometry- monitoring capability- regional to global scale applications- long term data archives / continuity oriented- constrained by cloud cover
Wageningen UR, 07 Oct. 2004 Symposium on “Trends in Geo-Information”
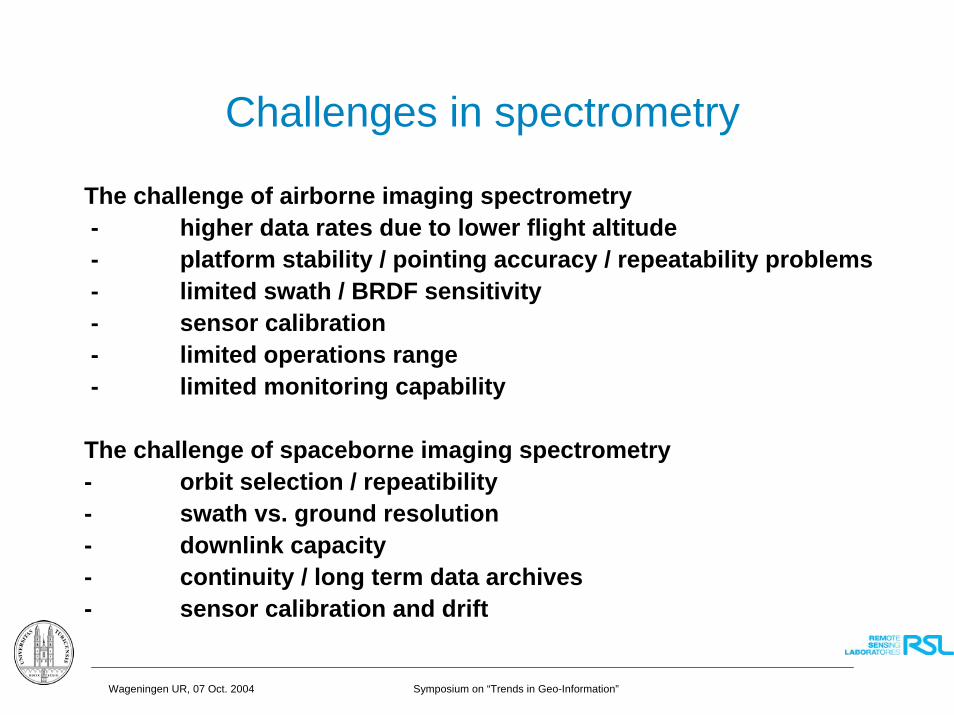
Challenges in spectrometry
The challenge of airborne imaging spectrometry- higher data rates due to lower flight altitude- platform stability / pointing accuracy / repeatability problems- limited swath / BRDF sensitivity- sensor calibration - limited operations range- limited monitoring capability
The challenge of spaceborne imaging spectrometry- orbit selection / repeatibility- swath vs. ground resolution- downlink capacity- continuity / long term data archives - sensor calibration and drift

Wageningen UR, 07 Oct. 2004 Symposium on “Trends in Geo-Information”
Applications
• Vegetation and precision farming• Forestry• Geology• Limnology• Coastal water• Air pollution - Trace gases• Security-relevant aspects• Snow and Ice• Simulation, Calibration and Validation of spaceborne sensor
systems

Wageningen UR, 07 Oct. 2004 Symposium on “Trends in Geo-Information”
Vegetation and Precision FarmingPlant Water Content
Spring Wheat July 16th 1999
Winter Barley July 16th 1999
82.0
17.0
37.0
4.0
Winter Barley
Spring Wheat
Plant Water [%] (average field value 50.4)
Plant Water [%] (average field value 17.94)
Limpach Valley HyMap Data Set
100.0%
0.0%
Plant Water Content retrieval using thestepwise multiple linear regression method and laboratory data Kneubuehler (2002)

Wageningen UR, 07 Oct. 2004 Symposium on “Trends in Geo-Information”
Vegetation and Precision Farming
Leaf Area Index (LAI)LAI map derived from
HyMap’ 99 Data using the WDVI method (Clevers 1989)
RGB, Barrax (SP) HyMap Data
LAI and Chlorophyll are examples of derived vegetation parameters. Products are used as input for ecology models.LAI Map
Huber (2002)

Wageningen UR, 07 Oct. 2004 Symposium on “Trends in Geo-Information”
Vegetation and Precision Farming
Huber (2002)
Leaf Chlorophyll map
RGB, Barrax (SP) HyMap Data
Leaf chlorophyll derived from HyMap 99 Data using a TCARI/OSAVI ratio and laboratory derived chlorophyll values

Wageningen UR, 07 Oct. 2004 Symposium on “Trends in Geo-Information”
Forestry
False-Color RGB, Swiss National Park (DAIS/ROSIS Data)
Example of derived biophysical and biochemical properties over the test sites in the Swiss National Park. Products are used as input into fire models.
Fractional Cover map
Koetz et al. (2004)

Wageningen UR, 07 Oct. 2004 Symposium on “Trends in Geo-Information”
GeologyAnalysis of Jarosite Mixture in Mine Tailings:USGS laboratory spectra are used as endmembers in theanalysis methods. Endmembers are pure reference spectra, which are characteristic for a specific material.(Jarosite KAl3(SO4)2(OH)6 is a secondary mineral formed in acid drainage processes.)
Jarosite influenced areas
Ph. Meier (2002)
RGB, copper mine in Arizona (US) AVIRIS Data
Jarosite mixture
high low

Wageningen UR, 07 Oct. 2004 Symposium on “Trends in Geo-Information”
Water constituentsMethodology:(1) correction for atmosphere effects, (2) correction for air-water interface effects, (3) inversion of the sub-surface radiation for the determination of the quality
parameters such as chlorophyll a or suspended matter. => Comparison of different methods on CASI imaging spectrometer over Lake
Zug
Chlorophyll a concentration from CASI in 1999 over Lake Zug (CH)
Keller (2001)

Wageningen UR, 07 Oct. 2004 Symposium on “Trends in Geo-Information”
Coastal WatersExceptional blooms (“red tides” or Harmful Alga Blooms (HABs)) in coastal areas are detectable with airborne imaging spectroscopy.
Kahru & Mitchell (1998) © Scripps Institution of Oceanography
Red Tide bloom off San Diego (US)
Toxic Dinoflagellate blooms detection
Toxic Dinoflagellate blooms results in low nLw380nLw412 ratio!

Wageningen UR, 07 Oct. 2004 Symposium on “Trends in Geo-Information”
Air Pollution
Aerosol optical depth retrieved from AVIRIS-Imaging Spectrometer data over Santa Monica, Los Angeles (US)
Bojinski et al. (2004)
Aerosol Optical Depth Map over Land
Sensor spectrum
Endmemberspectra
SWIRVIS
UnmixingRe-mixing
Database
Aerosol effect

Wageningen UR, 07 Oct. 2004 Symposium on “Trends in Geo-Information”
Air PollutionSpaceborne global NO2 Measurements:e.g. GOME (40 x 320 km2), OMI (24 x 13 km2)
Local In-Situ Measurements:e.g. NABEL stations
scale gap!High needs for better air quality monitoring:(1) Monitoring of trace gases in regional scale (2) Maps of pollution and transport in urban scale, e.g., airports(3) Validation of space sensor measurements in sub pixel grid
Airborne imaging spectroscopy allows toretrieve NO2 (and CH4) in local/regional scalewith a spatial resolution of ~ 30 m and a column retrieval precision of ~ 10%.
Kaiser, Schaub (2004)

Wageningen UR, 07 Oct. 2004 Symposium on “Trends in Geo-Information”
Security Relevant Aspects
Detection potential of camouflaged targets in rural environments
Target detection of camouflaged objects in rural environments
Camouflage
Black (=0) no detection potential; Red (=1) strong detection potential. The three images represent from left to right a forward scattering target, nadir view and backward scattering target.

Wageningen UR, 07 Oct. 2004 Symposium on “Trends in Geo-Information”
Challenges in spectroscopy
The challenge of spectroscopy- spectrum analyis requires calibrated data- high geometric and radiometric preprocessing requirements- high cal/val requirements- requires coordinated data take / simultaneous field investigations- forward and inverse modelling of radiation transfer dealing with
atmosphere and objects, including BRDF and HRDF
- Europe needs a greater capacity for airborne spectrometry (such as APEX and ARES) and ultimately the spaceborne mission SPECTRA

Wageningen UR, 07 Oct. 2004 Symposium on “Trends in Geo-Information”
Airborne SpectroscopyAirborne Spectroscopy
Part 2: Perspectives

Wageningen UR, 07 Oct. 2004 Symposium on “Trends in Geo-Information”
Hyperspectral Applications
100.0%
0.0%
Precision Farming
Ecology Modeling
Forest Fire Modeling
Water QualityAir Pollution
Natural Hazards

Wageningen UR, 07 Oct. 2004 Symposium on “Trends in Geo-Information”
Definition of application-driven user requirementsModeled LAI as a function of NedL and at-sensor-radiance to determine SNR requirements for imaging spectrometers.
Driver application for the radiometric requirement
Goal: Development of advanced methods for bio-geophysical parameter retrieval of
Vegetation, Soils, rocks & minerals, Snow & ice, Atmosphere, Coastal and inland waters analysis
and cross calibration with spaceborne EO systems
Schlaepfer & Schaepman (2002)

Wageningen UR, 07 Oct. 2004 Symposium on “Trends in Geo-Information”
Key Requirements 1/2 for APEXKey Requirements 1/2 for APEX
Field of View (FOV) – Swath: ± 14deg with 1000 across-track pixel
Instantaneous Field of View (IFOV): 0.028 deg
Flight altitude range: 3,500 – 10,000 m.a.s.l.
Standard aircraft interface for: Dornier Do-228 on stabilizing platform PAV 30 from LH-Systems
Spectral range: VNIR: 380 – 1000 nm, SWIR: 940 – 2500 nm
Spectral channels: VNIR: 312 (prior binning), SWIR: 199
Spectral sampling interval: 380 – 1050 nm: < 5 nm, 1050 – 2500 nm: < 10 nm
Center wavelength accuracy: < 0.2 nm

Wageningen UR, 07 Oct. 2004 Symposium on “Trends in Geo-Information”
Key Requirements 2/2 for APEXKey Requirements 2/2 for APEX
FWHM: ≤ 1.75 Sampling interval
Spectral / Spatial Misregistration: < 0.1 pixel
Spatial co-registration between VNIR and SWIR channel: goal: 0.16 pixel
Polarization sensitivity: less 0.03 in VNIR, less 0.05 in SWIR (goal)
Instrument temporal radiometric uncertainty within a flight section: better 0.02
Radiometric performance accuracy: instrument shall allow absolute calibration accuracy up to 0.03 (goal)
Interval for instrument re-calibration: after a complete flight season

Wageningen UR, 07 Oct. 2004 Symposium on “Trends in Geo-Information”
Scope of APEXAPEX: Airborne Prism EXperiment:
APEX is an airborne simulator for the support and development of futurespaceborne Earth Observation systems.
APEX will be able toSimulate,Calibrate, andValidate
planned ESA imaging spectrometer missions, e.g, SPECTRA etc.
APEX will foster the use of imaging spectrometer data in Europe and will support the application development for imaging spectroscopy products.
APEX is a joint Swiss/Belgian ESA PRODEX project with support from ESA Earth Observation Preparatory Programme and will complemented by other European initiatives, such as ARES (GFZ, DLR Germany)

Wageningen UR, 07 Oct. 2004 Symposium on “Trends in Geo-Information”
APEX Organization

Wageningen UR, 07 Oct. 2004 Symposium on “Trends in Geo-Information”
APEX Instrument descriptionAPEX Instrument description• Hyperspectral Imager for various standard airborne platforms, e.g.:
• Do228, Cessna types: T207A, C208B, 404, Twin Otter, Short SC7 Skyvan
• Falcon F20 (pressurized A/C for altitudes above 7.5 km)
• Pushbroom instrument with 2 spectrometer channels• Spectral Range: 0.38 up to 2.5 micron
• Spatial/spectral Resolution:
• 1000 samples @ 28° FOV, about 300 spectral bands
• “In-Flight Characterization Unit” (IFC) for excellent performance stability• Thermal Control Box for stable instrument operation independent from A/C
environmental conditions

Wageningen UR, 07 Oct. 2004 Symposium on “Trends in Geo-Information”
Schematic APEX Instrument Components

Wageningen UR, 07 Oct. 2004 Symposium on “Trends in Geo-Information”
Instrument SetInstrument Set--upup

Wageningen UR, 07 Oct. 2004 Symposium on “Trends in Geo-Information”
Instrument SetInstrument Set--up in Aircraftup in Aircraft
APEX Instrument with Stabilizing Platform integrated in Environmental Thermal Control Box
Aircraft I/F
Control and Storage Unit
Power Distribution Unit
Navigation Sub System
Operator
Monitor
Flight Management System

Wageningen UR, 07 Oct. 2004 Symposium on “Trends in Geo-Information”
APEXAPEX HyperspectralHyperspectral ImagerImager
• Sealed spectrometer compartment
• Thermal stabilized during operation: Better 2 ºC, gradient less 0.5 ºC
• Max. deformation of Optical Base Plate (OBP) less 0.040 mm due to air pressure variations
• Co-registration error VNIR-to-SWIR channels about 0.5 pixel
• Overall mass: 72 kg, without counterweight for COG adjustment
804 mmFits into PAV-30 Stabilizing Platform,Opening diameter 443 mm

Wageningen UR, 07 Oct. 2004 Symposium on “Trends in Geo-Information”
Spectrometer Spectrometer -- Design ConceptDesign Concept

Wageningen UR, 07 Oct. 2004 Symposium on “Trends in Geo-Information”
Spectrometer Spectrometer -- Optical Design ConceptOptical Design Concept

Wageningen UR, 07 Oct. 2004 Symposium on “Trends in Geo-Information”
VNIRVNIR-- DetectorDetector
Type CCD 55-30 from E2V Technologies (GB)
– Frame transfer mode, – 1252 x 1152 pixel (used 1000 x 393)– Pixel pitch 22.5 x 22.5 µm2, fill factor 100%– Back illuminated– Operated in non-inverted mode– Read out frequency 7 Mpix/s– Operated in dither clocking
mode without cooling – integration time independent
from frame transfer time
0
20
40
60
80
100
380 400 500 650 750 900 1000
Wavelength [nm]
Qua
ntum
Effi
cien
cy
[%]

Wageningen UR, 07 Oct. 2004 Symposium on “Trends in Geo-Information”
SWIR DetectorSWIR Detector• HgCdTe detector array - hybridized on CMOS multiplexer• 1000 x 256 square pixel, 30x30 µm2, addressable readout, fast operation• Integrated in cryostat cooler assembly • WL range: 0.94 – 2.50 micron• QE: > 55 % average• Top.: 130 – 165 K
Dewar
Cooler
Sapphire Window
Transfer Line
Focal Plane Assembly BBPre-EM Detector with Cryostat/Dewar Assembly

Wageningen UR, 07 Oct. 2004 Symposium on “Trends in Geo-Information”
APEX Electronic: Data Streams Overview

Wageningen UR, 07 Oct. 2004 Symposium on “Trends in Geo-Information”
APEX PAF: The Processor Foundation PAF Hardware: Linux,PAF Hardware: Linux,Archiving SystemArchiving System
PAF: IDLPAF: IDL--emacsemacs, XML, XML--tools,tools,CVS, TCL/CVS, TCL/webshwebsh
PAF Processor: PAF Processor: IDL, XML, CIDL, XML, C
APEX PAF
SearchAPEX
Archive
Server
Core
Web
Processor
Input
ToolsProcessing
ToolsCollaboration
ToolsBrowsing
Docs
Co-Developers
Users
Operators
CHB Data

Wageningen UR, 07 Oct. 2004 Symposium on “Trends in Geo-Information”
APEX higher processing Level 1B, 1C, 2, 3
Atmosph. AuxilaryData
Image Attribute
Data
Quality Description
ParametricOrthorecti-
fication(PARGE)
AtmosphericTopographicCorrection(ATCOR)
Geometry Index
AtmosphericTopographic
Corrected Cube
CubeGeocoding
Geocoded,HDRF Cube
DEM
Calibrated Uniform
Image DataCube
Calibrated Position
and AttitudeCustom
products
ProductGeneration
Product Description
Level 1B Level 1C Level 2CLevel 2A Level 2B
Bad Pixel Map
Rectification(PARGE)
Rectified Uniform
Cube AtmosphericNormalization
Geometry Index
ApparentReflectance
Cube
Level 3A Level 3B
Standard products
Product Description
Research products
Product Description
Level 3C

Wageningen UR, 07 Oct. 2004 Symposium on “Trends in Geo-Information”
APEX APEX -- Schedule / ConclusionSchedule / Conclusion
• Phase C/D – begin July 2002– Baseline Design Review – September 2002 – Preliminary DR – close out 7 May 2003– Critical DR – close out planned Mar 2005– Acceptance Review – 1st quart. 2006
• First acceptance flight – springtime 2006• Exploitation - as of mid 2006• Envisaged operation time 5 - 10 years
Call for experiments will be released for the 2006/07 time frame.