Embed Size (px)
Citation preview
CHAPTER 10 – AIR - 234 -
The CARICOM Environment in Figures 2004
AIR1: EMISSIONS OF SULPHUR DIOXIDE (SO2)
Sulphur dioxide, or SO2, belongs to the family of sulphur oxide gases (SOx). These gases dissolve easily in water. Sulphur is prevalent in all raw materials, including crude
oil, coal, and ore that contains common metals like aluminium, copper, zinc, lead, and iron. SOx gases are formed when fuel-containing sulphur, such as coal and oil, is burned, and when gasoline is extracted from oil, or metals are extracted from ore. SO2 dissolves in water vapour to form acid, and interacts with other gases and particles in the air to form sulfates and other products that can be harmful to people and their environment. Over 65 per cent of SO2 released to the air, or more than 13 million tons per year, comes from electric utilities, especially those that burn coal. Other sources of SO2 are industrial facilities that derive their products from raw materials like metallic ore, coal, and crude oil, or that burn coal or oil to produce process heat. Examples are petroleum refineries, cement manufacturing, and metal processing facilities. Also, locomotives, large ships, and some non-road diesel equipment currently burn high sulphur fuel and release SO2 emissions to the air in large quantities. (see http://www.epa.gov/air/urbanair/so2/[last accessed: July 14th 2009]).
Definitions of selectable source categories
Fuel combustion (Sectoral Approach): Total emissions of all greenhouse gases from all fuel combustion activities. Other greenhouse gases from biomass fuel combustion are considered net emissions and are included. Incineration of waste for waste-to-energy facilities are included here and not under Waste. Emissions from fuel used in ships or aircraft engaged in international transport are not included here. Energy Industries comprises emissions from fuels combusted by the fuel extraction or energy producing industries. Transport: Emissions from the combustion and evaporation of fuel for all transport activity, regardless of the sector. Emissions from fuel sold to any air or marine vessel engaged in international transport (international bunker fuels) are not included. Industrial Processes: By-product or fugitive emissions of greenhouse gases from industrial processes. Emissions from fuel combustion in industry are included under Fuel Combustion.
Concept and Definition
H

CHAPTER 10 – AIR - 235 -
The CARICOM Environment in Figures 2004
Solvent and Other Product Use: Emissions resulting from the use of solvents and other products containing volatile compounds. When the solvents and other products are, or are produced from, petroleum products, the carbon in the NM-VOC emissions will be included in the CO2 inventory if the Reference Approach for CO2 emissions from energy is used. All other non-energy emissions not included under Industrial Processes are included here. Agriculture: All anthropogenic emissions from agriculture except for fuel combustion and sewage emissions. Other: Emissions that do not fit under any other emission source/sink categories of the main categories described above.
Air emissions data are usually estimated according to international methodologies on the basis of national statistics on energy balances, industrial and agricultural production, waste management and land use, etc. The
most accepted and well-known methodologies are the revised 1996 Guidelines of the Intergovernmental Panel for Climate Change (IPCC) (see http://www.ipcc-nggip.iges.or.jp/public/gl/invs4.html [last accessed: July 2nd 2009]) which is the basis for reporting to the United Nations Framework Convention for Climate Change (UNFCCC) (see: http://unfccc.int/ index.html). These are linked to the UNECE EMEP/CORINAIR Atmospheric Inventory Guidebook (see http://www.ipcc-nggip.iges.or.jp/public/2006gl/index.html [last accessed: July 2nd 2009]). Sulphur dioxide emissions are measured (and regulated, where appropriate) for a number of activities, for example electric power plants and large industrial installations. For those activities for which direct measurements are not directly available, it is possible to estimate emissions by considering the amount of fuel consumed, together with emission factors related to particular combustion processes. In order, however, to determine the appropriate emission factor for these activities it is imperative to have relevant statistical data related to the fuel characteristics, and machinery specifications, taking into account the effects of various control techniques (e.g. disulphurisation units etc.). It must be noted that detailed methodologies (such as the CORINAIR programme) already exist for the estimation of SO2 emissions from all anthropogenic activities. The unit of measurement is Kt SO2 per year.
Sulphur dioxide emissions are partly responsible for acid depositions on the surface and the occurrence of winter smog episodes. In addition, the oxidisation of SO2 has also been
found to contribute to visibility degradation due to high concentrations of aerosol sulphates in the atmosphere.
Indicator Relevance
Method of Computation

CHAPTER 10 – AIR - 236 -
The CARICOM Environment in Figures 2004
All reporting Member States followed the internationally recommended definitions for emissions of Sulphur dioxide. This indicator is, therefore, regionally and internationally conceptually
harmonized. Only two of the reporting eighteen Member States/Associate Members of the Community provided data for this indicator.
In accordance with the decision that the UNSD/UNEP would provide data on waste, water, land, and air to the CARICOM Secretariat, data for this indicator was collected from the UNSD/UNEP instead of
from Member States and Associate Members. Please refer to Appendix 1.10.1 (a) for the original sources of the data, as specified by the UNSD/UNEP, on air for Member States and Associate Members.
Tables 10.1 (a) and (b) show estimated SO2 emissions for Jamaica in 1994 and for Trinidad and Tobago in 1990 and 1996. The data shows that estimated SO2 emissions from energy activities associated with fuel
combustion in manufacturing industries and construction (63 thousand tonnes), Energy industries (30 thousand tonnes), other fuel combustion (3.6 thousand tonnes) and energy industries (2.1 thousand tonnes) together with total fugitive emissions from fuels at 0.61 thousand tonnes totalled 99.5 thousand tonnes. Total emissions for Jamaica was 99.7 thousand tonnes for the year 1994 which included emissions from Industrial processes (0.2 thousand tonnes). Total SO2 emissions in Trinidad and Tobago in 1990 and 1996 were 8.7 and 8.6 thousand tonnes respectively. According to the Environmental Management Authority of Trinidad and Tobago, industrial processes generated emissions of 0.2 thousand tonnes of sulfur dioxide while energy activities accounted for 8.5 thousand tonnes or 97 per cent sulfur dioxide emissions in 1990. In 1996, SO2 emissions from industrial processes amounted to 0.2 thousand tonnes while fuel combustion from energy activities declined to 8.4 thousand tonnes of which transport consisted 70 per cent, energy industry 20 per cent and Manufacturing industries and construction, 8 per cent.
Evaluation
Data Assessment
Data Sources

CHAPTER 10 – AIR - 237 -
The CARICOM Environment in Figures 2004
Table 10.1 (a) - Emissions of Sulphur Dioxide (SO2): 1990, 1994 and 1996 (1000 t)
Country Year TOTAL emissions
TOTAL Energy
activities Industrial processes
Solvent
use
Agriculture
Other
sources of emissions
JM a
1994 99.7 99.46 0.24 TT
1990 a 8.7 8.5 0.2 b c e
1996 8.6 8.4 0.2
Table 10.1 (b) - Emissions of Sulphur Dioxide (SO2) from Energy Activities: 1990, 1994 and 1996
(1000 t)
Total fuel combustion Country Year
TOTAL Energy
activities
Total fugitive
emissions from fuels
Energy industries
Manufacturing industries and construction
Transport Other fuel combustion
JM
1994 99.46 0.61 30.12 63.04 2.10 3.59 TT
1990 a 8.5 0.0 c c c d d d
1996 8.4 0.0 1.7 0.7 6.0

CHAPTER 10 – AIR - 238 -
The CARICOM Environment in Figures 2004
AIR2: EMISSIONS OF NITROGEN OXIDES (NOx)
Nitrogen oxides, or NOx, is the generic term for a group of highly reactive gases, all of which contain nitrogen and oxygen in varying amounts. Many of the nitrogen oxides
are colorless and odorless. However, one common pollutant, nitrogen dioxide (NO2) along with particles in the air can often be seen as a reddish-brown layer over many urban areas. Nitrogen oxides form when fuel is burned at high temperatures, as in a combustion process. The primary manmade sources of NOx are motor vehicles, electric utilities, and other industrial, commercial, and residential sources that burn fuels. NOx can also be formed naturally. Nitrogen oxides are indirect greenhouse gases. They have been the target of environmental policies for their role in forming ozone (O3), as well for their direct acidification effects. Fuel combustion activities are the most significant anthropogenic source of NOx. Within fuel combustion, the most important sources are the energy industries and mobile sources. Please refer to AIR1: Emissions of Sulphur Dioxide (SO2) for definitions of selectable source categories.
Local authorities perform regular inspections in order to determine the conformity of a number of works and activities with environmental regulations. In this context,
NOx emissions are measured (and regulated, where appropriate) for a number of activities, for example electricity production stations and large industrial installations. For those activities for which measurements are not directly available, it is possible to estimate emissions by considering the amount of fuel consumed (both fossil fuels and biomass) together with emission factors related to particular combustion processes. The total annual amount of nitrogen oxides emissions must be derived for all economic activities, and particularly energy production and transformation, industry, transportation and domestic and tertiary sectors. The unit of measurement is Kt NOx per year.
The purpose of this indicator is to identify the activities mostly responsible for the release of nitrogen oxides into the atmosphere. Nitrogen oxides emitted into the atmosphere can
be transported over large distances and can be deposited at the surface often hundreds or thousands of kilometres away from the site of the source. They are partly responsible for a series of problems, including acidification and increased concentration of photo-oxidants in the atmosphere that result in the occurrence of photochemical smog episodes. Nitrogen oxides are also associated with both respiratory morbidity and mortality in humans.
Concept and Definition
Method of Computation
Indicator Relevance
H

CHAPTER 10 – AIR - 239 -
The CARICOM Environment in Figures 2004
All reporting Member States followed the internationally recommended definitions for emissions of Nitrogen oxides. This indicator is, therefore, regionally and internationally conceptually
harmonized. Only three of the reporting eighteen Member States/Associate Members of the Community provided data for this indicator.
In accordance with the decision that the UNSD would provide data on waste, water, land, and air to the CARICOM Secretariat, data for this indicator was collected from the UNSD instead of directly from
Member States and Associate Members. Please refer to Appendix 1.10.2 (a) for the original sources of the data, as specified by the UNSD, on air for Member States and Associate Members.
Tables 10.2 (a) and (b) provides data on emissions of Nitrogen Oxides (NOx) for Jamaica, Suriname and Trinidad and Tobago. Suriname’s total reported Nitrogen Oxides emissions declined by 49 per cent from 1975
to 1999, decreasing from 20.1 thousand tonnes in 1975 to 10.3 thousand tonnes in 1999. Suriname’s data also reveals that following an initial drop in emissions by 66 per cent for the five year period 1980 to 1985, emissions increased stealthily towards the end of the period. Data reported for Jamaica in 1994 reveals that road transport contributed to 12.2 thousand tonnes or 39 per cent of total emissions from energy activities followed by emissions from manufacturing industries which contributed 10.8 thousand tonnes or 35 per cent of total emissions while energy industries and other fuel combustion contributed to 5.9 thousand tonnes or 19 per cent and 1.9 thousand tonnes or 6 per cent of total emissions respectively. In 1990, Trinidad and Tobago registered total emissions of Nitrogen Oxides at 37.2 thousand tonnes comprising 97 per cent emissions from energy activities.
Data Assessment
Evaluation
Data Sources

CHAPTER 10 – AIR - 240 -
The CARICOM Environment in Figures 2004
Table 10.2 (a) - Emissions of Nitrogen Oxides (NOx): 1975-1999
(1000 t)
Country Year TOTAL emissions
TOTAL Energy
activities Industrial processes
Solvent
use
Agriculture
Other
sources of emissions
JM a
1994 30.92 30.92
SR 1975 20.1 1980 25.0 1985 8.6 1990 8.9 1995 9.9 1998 10.2 1999 10.3
TT
1990 a 37.2 36.1 0.1 0.4 0.6
1996
Table 10.2 (b) - Emissions of Nitrogen Oxides (NOx) from Energy Activities: 1975-1999
(1000 t)
Total fuel combustion Country Year
TOTAL Energy
activities
Total fugitive
emissions from fuels
Energy industries
Manufacturing industries and construction
Transport Other fuel combustion
JM
1994 30.92 0.04 5.94 10.83 12.20 1.91 SR
1975 1980 1985 1990 1995 1998 1999
TT
1990 a 36.1 35.1 0.4
1996 12.9 2.5 25.6

CHAPTER 10– AIR - 241 -
The CARICOM Environment in Figures 2004
AIR3: EMISSIONS OF NON-METHANE VOLATILE ORGANIC COMPOUNDS (NM-VOCs)
Non-methane volatile organic compounds (NM-VOCs) are a group of solvent-like organic compounds that easily evaporate at normal temperatures. They are produced
mainly in fuel combustion and in processes that use solvents or solvent-based products such as painting, metal degreasing etc. Several of these chemicals are harmful to human health if inhaled, ingested, drunk or get in contact with skin. NM-VOCs are significant precursors to ground level ozone formation. NM-VOCs are the sum of all hydrocarbon air pollutants except methane. Non-methane volatile organic compounds emissions from anthropogenic activities are primarily comprised of total emissions from the use of fuels for energy purposes, evaporative emissions during industrial processes and non-industrial use of organic solvents. Please refer to AIR1: Emissions of Sulphur Dioxide (SO2) for definitions of selectable source categories.
The total annual amount of non-methane volatile organic compounds emissions must be derived for all economic activities, and particularly energy-related activities,
industrial processes and non-industrial use of organic solvents. The unit of measurement is Kt of NM-VOCs per year.
The purpose of this indicator is to identify the activities mostly responsible for the release of non-methane volatile organic compounds into the atmosphere. The annual NM-VOCs
emissions are directly related to the amount of biomass and fossil fuels used for energy production, the amount of solid and liquid fossil fuels that is produced, transported, distributed and stored, and the quantity of organic solvents used for non-industrial purposes.
All reporting Member States followed the internationally recommended definitions for emissions of Non-methane volatile organic compounds (NM-VOCs). This indicator is,
therefore, regionally and internationally conceptually harmonized. Only two of the reporting eighteen Member States/Associate Members of the Community provided data for this indicator.
Concept and Definition
Method of Computation
Indicator Relevance
H
Data Assessment Data Assessment

CHAPTER 10– AIR - 242 -
The CARICOM Environment in Figures 2004
In accordance with the decision that the UNSD would provide data on waste, water, land, and air to the CARICOM Secretariat, data for this indicator was collected from the UNSD instead of directly from
Member States and Associate Members. Please refer to Appendix 1.10.3 (a) for the original sources of the data, as specified by the UNSD, on air for Member States and Associate Members.
Data on Emissions of Non-Methane Volatile Organic Compounds (NM-VOCs) for Jamaica and Trinidad and Tobago are provided in Tables 10.3 (a) and (b) below. Energy-related activities were the
primary sources of Jamaica’s NM-VOCs emissions in 1994, accounting for 83 per cent and industrial processes the remaining 17 per cent. The transport sector accounted for 34.9 thousand tonnes NM-VOCs representing 73 per cent of total NM-VOCs emissions from fuel combustion; the largest share of any end-use economic sector. Other fuel combustion activities accounted for 25 per cent or 7 thousand tonnes of NM-VOCs emissions from fuel combustion. The remaining 2 per cent was associated with Manufacturing industries and construction (0.3 thousand tonnes) and Energy industries (0.2 thousand tonnes). Fugitive emissions and emissions from energy activities accounted for the majority of NM-VOCs emissions which was estimated at 93.1 thousand tonnes for Trinidad and Tobago in 1996. Emissions from energy activities accounted for approximately 66 per cent of NM-VOCs emissions while Industrial processes accounted for 34 per cent in 2006.
Evaluation
Data Sources

CHAPTER 10– AIR - 243 -
The CARICOM Environment in Figures 2004
Table 10.3 (a) - Emissions of Non-Methane Volatile Organic Compounds (NM-VOCs):
1990 and 1994 (1000 t)
Country Year TOTAL emissions
TOTAL Energy
activities Industrial processes
Solvent
use
Agriculture
Other
sources of emissions
JM a
1994 34.89 29.05 5.84 TT
1990 a 93.1 61.1 32.0
Table 10.3 (b) - Emissions of Non-Methane Volatile Organic Compounds (NM-VOCs) from Energy Activities: 1990 and 1994
(1000 t)
Total fuel combustion Country Year
TOTAL Energy
activities
Total fugitive
emissions from fuels
Energy industries
Manufacturing industries and construction
Transport Other fuel combustion
JM
1994 29.05 1.63 0.15 0.28 20.02 6.97 TT
1990 a 61.1 33.2

CHAPTER 10– AIR - 244 -
The CARICOM Environment in Figures 2004
AIR4: EMISSIONS OF CARBON DIOXIDE (CO2)
Carbon dioxide (CO2) is a colourless, odourless and non-poisonous gas formed by combustion of carbon and in the respiration of living organisms and is considered a
greenhouse gas. Carbon dioxide (CO2) is the most common greenhouse gas produced by anthropogenic activities, accounting for about 60 per cent of the increase in radiative forcing since preindustrial times (IPCC, 1992). By far the largest source of CO2 emissions is from the oxidation of carbon when fossil fuels are burned, which accounts for 70-90 per cent of total anthropogenic CO2 emissions. When fuels are burned, most carbon is emitted as CO2 immediately during the combustion process. Some carbon is released as CO, CH4, or non-methane hydrocarbons, which oxidise to CO2 in the atmosphere within a period from a few days to 10-11 years. United Nations. United Nations Framework Convention on Climate Change (A/AC.237/18 (Part II)/Add.1 and Corr.1). Opened for signature at Rio de Janeiro on 4 June 1992. (Section C) United Nations. Glossary of Environment Statistics. Series F, No. 67 (United Nations publication, Sales No. E.96.XVII.12). http://www.ipcc-nggip.iges.or.jp/public/gl/guidelin/ch1ref1.pdf Please refer to AIR1: Emissions of Sulphur Dioxide (SO2) for definitions of selectable source categories.
Total anthropogenic carbon dioxide (CO2) emissions from the sectors energy, industrial processes, solvent and other product use, agriculture, land use change and forestry, and
waste. Since CO2 removals are also accounted for, this indicator concerns net emissions. Natural emissions are not accounted for. The unit of measurement is tonnes CO2 per year.
The scientific community acknowledges that atmospheric concentrations of CO2 have continued to increase, and that “the balance of evidence suggests a discernible human
influence on global climate”. Future climate change is expected to have major impacts on e.g. agriculture, water resources, ecosystems and human health. The indicator is linked to the indicators of other greenhouse gases. Furthermore, the indicator is linked to those in the area of Ozone Depletion. Ozone is a greenhouse gas, and therefore changes in stratospheric ozone should be considered in assessing climate change. Moreover, greenhouse gases are believed to affect stratospheric ozone depletion. These effects include both positive and negative effects.
Concept and Definition
Indicator Relevance
Method of Computation
H

CHAPTER 10– AIR - 245 -
The CARICOM Environment in Figures 2004
All reporting Member States followed the internationally recommended definitions for emissions of Carbon dioxide (CO2). This indicator is, therefore, regionally and internationally
conceptually harmonized. Only three of the reporting eighteen Member States/Associate Members of the Community provided data for this indicator with countries reporting data for select categories only.
In accordance with the decision that the UNSD would provide data on waste, water, land, and air to the CARICOM Secretariat, data for this indicator was collected from the UNSD instead of from Member
States and Associate Members. Please refer to Appendix 1.10.4 (a) for the original sources of the data, as specified by the UNSD, on air for Member States and Associate Members.
Three CARICOM Member States reported emissions of Carbon Dioxide (CO2). Suriname reported average emissions of 1.9 million tonnes for the period 1981 to 1997. Estimates of CO2 emissions for
Jamaica in 1994 for energy activities and industrial processes only was 8.2 million tonnes comprising the combustion of fuels from various activities while Industrial processes totalled 0.4 million tonnes. Manufacturing industries and construction accounted for 4.1 million tonnes or 50 per cent of CO2 emissions while activities in energy industries accounted for 2.3 million tonnes or 27 per cent of CO2 emissions in Jamaica. Road transport and other fuel combustion accounted for the remaining 23 per cent. CO2 emissions for Trinidad and Tobago were reported for 1990, 1996 and 2000. In 1990 emissions from energy activities associated with fuel combustion were reported at 9.9 million tonnes while emissions from industrial processes were 5.1 million tonnes. In 1996 emissions of 3.7 million tonnes of CO2 was reported for energy activities associated with fuel combustion. Trinidad and Tobago emissions caused by the burning of fossil for the year 2000 was reportedly 11.7 million tonnes of which manufacturing industries and construction accounted for 68 per cent, energy industries accounted for 18 per cent, road transport for 12 per cent and other fuel combustion activities accounted for the remaining 2 per cent.
Data Assessment
Data Sources
Evaluation

CHAPTER 10– AIR - 246 -
The CARICOM Environment in Figures 2004
Table 10.4 (a) - Emissions of Carbon Dioxide (CO2): 1981-2000, various years
(million tonnes)
Country Year TOTAL emissions
TOTAL Energy
activities Industrial processes
Solvent
use
Agriculture
Other
sources of emissions
JM
1994 8.20 0.38 SR
1981 2.0 1983 1.4 1985 1.6 1987 1.8 1989 1.9 1991 2.1 1993 2.1 1995 2.1 1997 2.1
TT
1990a 15.0 9.9 5.1 1996b 2000c 11.7 d
Table 10.4 (b) - Emissions of Carbon Dioxide (CO2): 1981-2000, various years (million tonnes)
Total fuel combustion Country Year
TOTAL Energy
activities
Total fugitive
emissions from fuels
Energy industries
Manufacturing industries and construction
Transport Other fuel combustion
JM
1994 8.20 2.25 4.11 1.26 0.59 SR
1981 1983 1985 1987 1989 1991 1993 1995 1997
TT
1990a 9.9 1996b 3.7 2000c 2.1 8.0 1.4 0.2

CHAPTER 10– AIR - 247 -
The CARICOM Environment in Figures 2004
AIR5: EMISSIONS OF METHANE (CH4)
This is the total anthropogenic methane (CH4) emissions from the sectors energy, industrial processes, solvent and other product use, agriculture, land use change and forestry,
and waste. Natural emissions are not accounted for in this indicator. The unit of measurement is tonnes CH4 per year. CH4 is a powerful greenhouse gas whose levels have already doubled. The main purpose of this indicator is to monitor total anthropogenic CH4 emissions. The indicator is linked to the indicators of other greenhouse gases. Furthermore, the indicator is linked with those in the area of Ozone Depletion. CH4 emissions are believed to affect stratospheric ozone depletion. Moreover, ozone is also a greenhouse gas, and therefore changes in stratospheric ozone should be considered in assessing climate change. The main sources of CH4 are agriculture (mainly flooded rice paddies and livestock), waste dumps, coal mining and natural gas production and transportation. CH4 is besides a direct greenhouse gas also a precursor of tropospheric ozone and stratospheric water vapour. The radiative forcing capacity (RF) is the amount of energy per unit area per unit time, absorbed by the greenhouse gas, that would otherwise be lost to space. Please refer to AIR1: Emissions of Sulphur Dioxide (SO2) for definitions of selectable source categories.
The 1996 “Guidelines for National Greenhouse Gas Inventories” have been formally adopted by the IPCC as the international method to estimate emissions.
Although total CH4 emissions are relatively small compared with total CO2 emissions, the radiative forcing capacity of CH4 is relatively large. Methane, the primary component of natural
gas, accounts for 16 percent of all greenhouse-gas emissions resulting from human activities. It is 23 times as effective at trapping heat in the atmosphere as carbon dioxide and has a relatively short atmospheric lifetime of approximately 12 years. This makes methane-emissions reductions particularly effective at mitigating global warming in the near term. Capturing methane emissions and using them as a clean energy source can also increase energy security, enhance economic growth, improve local air quality and industrial safety. http://www.esrl.noaa.gov/research/themes/forcing/Methane.pdf
Concept and Definition
Indicator Relevance
Method of Computation
H

CHAPTER 10– AIR - 248 -
The CARICOM Environment in Figures 2004
All reporting Member States followed the internationally recommended definitions for emissions of methane (CH4). This indicator is, therefore, regionally and internationally conceptually
harmonized. Only Jamaica and Trinidad and Tobago reported data on this indicator of the reporting eighteen Member States/Associate Members of the Community.
In accordance with the decision that the UNSD would provide data on waste, water, land, and air to the CARICOM Secretariat, data for this indicator was collected through the UNSD.
Please refer to Appendix 1.10.5 (a) for the original sources of the data, as specified by the UNSD, on air for Member States and Associate Members.
Due to the limited availability of quantitative data, no analysis will be presented.
Evaluation
Data Assessment
Data Sources

CHAPTER 10– AIR - 249 -
The CARICOM Environment in Figures 2004
Table 10.5 (a) - Emissions of Methane (CH4): 1990 and 1994
(1000 t)
Country Year TOTAL emissions
TOTAL Energy
activities Industrial processes
Solvent
use
Agriculture
Other
sources of emissions
JM
1994 0.68 TT
1990a 32.75 1.4 0.8 6.3 24.2
Table 10.5 (b) - Emissions of Methane (CH4): 1990 and 1994 (1000 t)
Total fuel combustion Country Year
TOTAL Energy
activities
Total fugitive
emissions from fuels
Energy industries
Manufacturing industries and construction
Transport Other fuel combustion
JM
1994 0.68 0.02 0.08 0.12 0.39 0.07 TT
1990a 1.40 0.05
CHAPTER 10– AIR - 250 -
The CARICOM Environment in Figures 2004
AIR6: EMISSIONS OF NITROUS OXIDE (N2O)
Total anthropogenic nitrous oxide (N2O) emissions from the sectors energy, industrial processes, solvent and other product use, agriculture, land use change and forestry, and
waste. Natural emissions are not accounted for in this indicator. The unit of measurement is tonnes N2O per year. The indicator is linked to the indicators of other greenhouse gases. Furthermore, the indicator is linked with those in the area of Ozone Depletion. Due to the long lifetime of N2O, N2O emissions can reach the stratosphere and affect the destruction of the ozone layer. Moreover, ozone is also a greenhouse gas, and therefore changes in stratospheric ozone should be considered in assessing climate change. The main sources of anthropogenic N2O are intensive agriculture using high levels of fertilisers, and a number of industrial processes. Natural sources are poorly quantified, but are probably twice as large as anthropogenic sources. Natural emissions are not accounted for in this indicator. The radiative forcing capacity (RF) is the amount of energy per unit area per unit time, absorbed by the greenhouse gas, that would otherwise be lost to space. Please refer to AIR2 for definitions of selectable source categories.
The 1996 “Guidelines for National Greenhouse Gas Inventories” have been formally adopted by the IPCC as the international method to estimate emissions of Nitrous
Oxide.
N2O is one of the major greenhouse gases. The main purpose of this indicator is to monitor total anthropogenic N2O emissions. Although total N2O emissions are relatively small
in comparison with total CO2 emissions, the radiative forcing capacity of N2O is relatively large.
All reporting Member States followed the internationally recommended definitions for air and emissions of nitrous oxide (N2O). This indicator is, therefore, regionally and internationally
conceptually harmonized. Jamaica and Trinidad and Tobago were the only member states to provide data on this indicator.
Concept and Definition
Method of Computation
Indicator Relevance
H
Data Assessment

CHAPTER 10– AIR - 251 -
The CARICOM Environment in Figures 2004
In accordance with the decision that the UNSD would provide data on waste, water, land, and air to the CARICOM Secretariat, data for this indicator was collected through the UNSD.
Please refer to Appendix 1.10.6 (a) for the original sources of the data, as specified by the UNSD, on waste of Member States and Associate Members.
Due to the limited availability of quantitative data, no analysis will be presented.
Evaluation
Data Sources

CHAPTER 10– AIR - 252 -
The CARICOM Environment in Figures 2004
Table 10.6 (a) - Emissions of Nitrous Oxide (N2O): 1990 and 1994
(1000 t)
Country Year TOTAL emissions
TOTAL Energy
activities Industrial processes
Solvent
use
Agriculture
Other
sources of emissions
JM
1994 0.11 0 TT
1990a 0.82 0.04 0.7 0.08
Table 10.6 (b) - Emissions of Nitrous Oxide (N2O): 1990 and 1994 (1000 t)
Total fuel combustion Country Year
TOTAL Energy
activities
Total fugitive
emissions from fuels
Energy industries
Manufacturing industries and construction
Transport Other fuel combustion
JM
1994 0.11 0 0.02 0.03 0.01 0.05 TT
1990a 0.04
CHAPTER 10– AIR - 253 -
The CARICOM Environment in Figures 2004
AIR7: TOTAL EMISSIONS OF LEAD (Pb) AND CONSUMPTION OF LEADED PETROL
Pure lead is a silvery-white metal that oxidizes and turns bluish-gray when exposed to air. Lead is primarily used in the manufacture of lead-acid batteries, lead alloys, lead
oxides in pigments, glass, lead cable coating, and a variety of lead products including ammunition and radiation shielding. Lead is emitted into the atmosphere from mining and smelting; from its use as a feedstock in the production of lead alloys, lead compounds and other lead-containing products; from mobile sources; and from combustion sources. The major sources of Pb emissions have historically been motor vehicles and industrial sources.
Total amounts of leaded petrol oil imported and used for road transportation are readily available from local as well as regional and international organisations (e.g. IEA,
EUROSTAT). Air emissions data are usually estimated according to international methodologies on the basis of national statistics on energy balances, industrial and agricultural production, waste management and land use, etc. The most accepted and well-known methodologies are the revised 1996 Guidelines of the Intergovernmental Panel for Climate Change (IPCC) (see http://www.ipcc-nggip.iges.or.jp /public/gl/invs4.htm) which is the basis for reporting to the United Nations Framework Convention for Climate Change (UNFCCC) (see: http://unfccc.int/index.html). These are linked to the UNECE EMEP/CORINAIR Atmospheric Inventory Guidebook (see http://reports.eea.eu.int /EMEPCORINAIR3 /en/tab_abstract_RLR).
The main purpose of this indicator is to monitor the amount of emissions of lead due to its potential and proven carcinogenic effect. The use of lead as a petrol additive has been a
catastrophe for public health. Leaded petrol has caused more exposure to lead than any other source worldwide. By contaminating air, dust, soil, drinking water and food crops, it has caused harmfully high human blood lead levels around the world, especially in children (Organisation for Economic Cooperation & Development / United Nations Environment Programme. Phasing lead out of gasoline: an examination of policy approaches in different countries. Paris: OECD; 1999.). These findings, together with data showing that lead can damage the catalytic converters of cars, have triggered strong governmental action. Nations around the world have begun to ban lead in petrol.
All reporting Member States followed the internationally recommended definitions for the consumption of leaded petrol. This indicator is, therefore, regionally and internationally
conceptually harmonized.
Concept and Definition
Measurement
Indicator Relevance
H
Data Assessment
CHAPTER 10– AIR - 254 -
The CARICOM Environment in Figures 2004
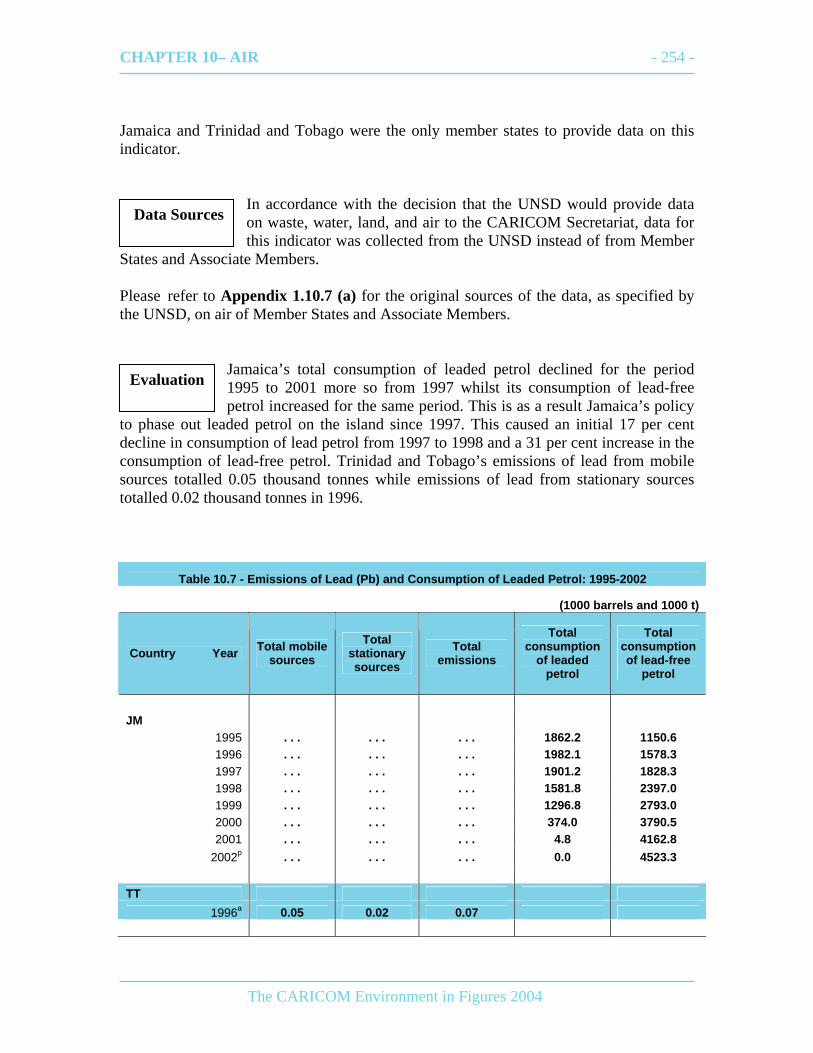
Jamaica and Trinidad and Tobago were the only member states to provide data on this indicator.
In accordance with the decision that the UNSD would provide data on waste, water, land, and air to the CARICOM Secretariat, data for this indicator was collected from the UNSD instead of from Member
States and Associate Members. Please refer to Appendix 1.10.7 (a) for the original sources of the data, as specified by the UNSD, on air of Member States and Associate Members.
Jamaica’s total consumption of leaded petrol declined for the period 1995 to 2001 more so from 1997 whilst its consumption of lead-free petrol increased for the same period. This is as a result Jamaica’s policy
to phase out leaded petrol on the island since 1997. This caused an initial 17 per cent decline in consumption of lead petrol from 1997 to 1998 and a 31 per cent increase in the consumption of lead-free petrol. Trinidad and Tobago’s emissions of lead from mobile sources totalled 0.05 thousand tonnes while emissions of lead from stationary sources totalled 0.02 thousand tonnes in 1996.
Table 10.7 - Emissions of Lead (Pb) and Consumption of Leaded Petrol: 1995-2002
(1000 barrels and 1000 t)
Country Year Total mobile sources
Total stationary sources
Total emissions
Total consumption
of leaded petrol
Total consumption of lead-free
petrol
JM
1995 . . . . . . . . . 1862.2 1150.6 1996 . . . . . . . . . 1982.1 1578.3 1997 . . . . . . . . . 1901.2 1828.3 1998 . . . . . . . . . 1581.8 2397.0 1999 . . . . . . . . . 1296.8 2793.0 2000 . . . . . . . . . 374.0 3790.5 2001 . . . . . . . . . 4.8 4162.8
2002p . . . . . . . . . 0.0 4523.3 TT
1996a 0.05 0.02 0.07
Data Sources
Evaluation

CHAPTER 10– AIR - 255 -
The CARICOM Environment in Figures 2004
Addendum
Air emissions predominantly arise from the combustion of fossil fuels, mainly from transport activities, power plants, refineries and other kinds of fuel combustion activities. These activities generate a large variety of air pollutants of which carbon dioxide (CO2), sulphur dioxide (SO2), nitrogen oxides (NOx) and non-methane volatile organic compounds (NM-VOCs) are among the most significant ones. Industrial processes and agriculture also contribute to the emissions of the above-mentioned pollutants as well as to emissions of other greenhouse gases such as nitrous oxide (N2O) and methane (CH4). Transport and the metal industry are the main sources of lead (Pb) emissions. Transport and energy production facilities are furthermore the main factors affecting ambient air quality in cities.
DEFINITIONS
Total emissions refer to Emissions from human activities in the country. Please note that emissions from international aviation and maritime transport are excluded.
Energy activities [Production and Use] comprise all emissions related to the production and use of energy in any sectors of the economy and households. It includes emissions from fuel combustion as well as fugitive fuels.This variable corresponds to IPCC category 1. Fuel combustion: Emissions caused by the burning of fossil fuels in any process. It comprises the combustion of fuels in the energy industries, all other industries and transport; it includes small combustion activities such as in commercial, institutional or residential buildings, fuel combustion in agriculture and in all other activities. CO2 emission from the combustion of biomass is excluded.This variable corresponds to IPCC category 1A. Energy industries: Emissions from fuel combustion in public electricity and heat production, in petroleum refining, manufacturing of solid fuels and other energy industries. For the purposes of this questionnaire, fugitive emissions from fuels (coal mining, oil and gas fields, venting and flaring etc.) are not allocated to this category. Please note that evaporative emissions from vehicles are included under Transport. This variable corresponds to IPCC category 1A1. Manufacturing industries and construction: Emissions from fuel combustion in manufacturing industries (except coke ovens that are allocated under Energy industries) and construction. If more disaggregated data by industrial activities according to International Standard Industrial Classification of All Economic Activities (ISIC)/Revision 3 are available, please provide them in the Supplementary Information Sheet. This variable corresponds to IPCC category 1A2.

CHAPTER 10– AIR - 256 -
The CARICOM Environment in Figures 2004
Transport: Emissions from fuel combustion in transport activities such as domestic air transport, road transport, railways, navigation and other transport. Evaporative emissions from vehicles are also included in this category. Please note that emissions from international aviation and marine transport are excluded. If separate data on emissions from road transport are available, please provide them in the Supplementary Information Sheet. This variable corresponds to IPCC category 1A3.
Other fuel combustion: Emissions from fuel combustion in commercial, institutional and residential buildings, agriculture, forestry, fishing and other non-specified fuel combustion (e.g. military). The fishing sector includes domestic inland, coastal and deep-sea fishing. This variable corresponds to the sum of the IPCC categories 1A4 and 1A5.
Fugitive emissions from fuels: Intentional or unintentional releases of gases from anthropogenic activities. In particular, they may arise from the production, processing, transmission, storage and use of fuels, and include emissions from combustion only where it does not support a productive activity (e.g., flaring of natural gases at oil and gas production facilities. The variable corresponds to the sum of the IPCC categories 1B1 and 1B2. Industrial processes: Emissions from processes such as chemical industry, metal industry, production and use of mineral products and other industries. If more disaggregated data according to ISIC/Rev.3 are available, please provide them in the Supplementary Information Sheet. This variable corresponds to IPCC category 2. Solvent use: Emissions from paint application, degreasing and dry cleaning, manufacturing and processing of chemical products, and other processes using solvents and other solvent based products. This variable corresponds to IPCC category 3. Agriculture: Emissions from the breeding of livestock, rice cultivation, field burning of agricultural residues, prescribed burning of savannas and other agricultural activities. This variable corresponds to IPCC category 4. Other sources of Emissions: Emissions from waste water treatment, waste disposal on land, waste incineration, land-use changes, forestry and other activities which have not been covered above. This variable corresponds to the sum of the IPCC categories 5, 6 and 7. Non-methane volatile organic compounds (NM-VOCs): A group of solvent-like organic compounds that easily evaporate at normal temperatures. They are produced mainly in fuel combustion and in processes that use solvents or solvent-based products such as painting, metal degreasing etc. Several of these chemicals are harmful to human health if inhaled, ingested, drunk or get in contact with skin. NM-VOCs are significant precursors to ground level ozone formation. NM-VOCs are the sum of all hydrocarbon air pollutants except methane.
CHAPTER 10– AIR - 257 -
The CARICOM Environment in Figures 2004
Appendix 1.10
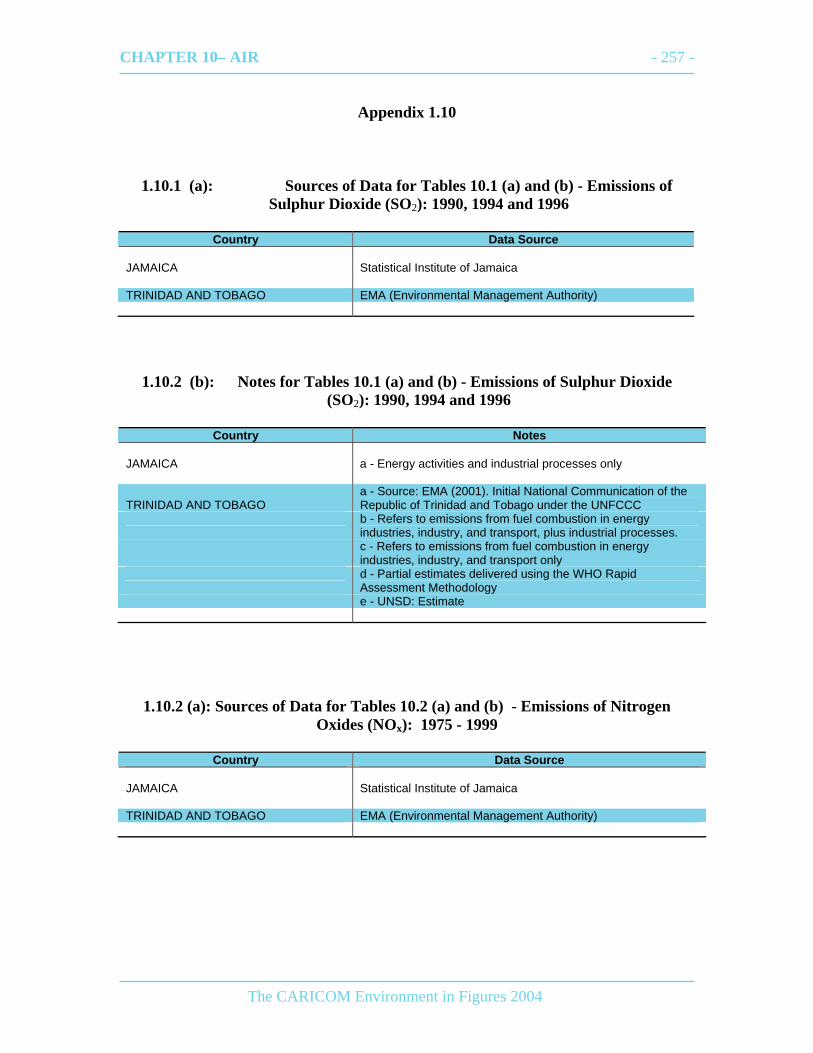
1.10.1 (a): Sources of Data for Tables 10.1 (a) and (b) - Emissions of Sulphur Dioxide (SO2): 1990, 1994 and 1996
Country Data Source
JAMAICA Statistical Institute of Jamaica TRINIDAD AND TOBAGO EMA (Environmental Management Authority)
1.10.2 (b): Notes for Tables 10.1 (a) and (b) - Emissions of Sulphur Dioxide (SO2): 1990, 1994 and 1996
Country Notes
JAMAICA a - Energy activities and industrial processes only
TRINIDAD AND TOBAGO a - Source: EMA (2001). Initial National Communication of the Republic of Trinidad and Tobago under the UNFCCC
b - Refers to emissions from fuel combustion in energy industries, industry, and transport, plus industrial processes.
c - Refers to emissions from fuel combustion in energy industries, industry, and transport only
d - Partial estimates delivered using the WHO Rapid Assessment Methodology
e - UNSD: Estimate
1.10.2 (a): Sources of Data for Tables 10.2 (a) and (b) - Emissions of Nitrogen Oxides (NOx): 1975 - 1999
Country Data Source
JAMAICA Statistical Institute of Jamaica TRINIDAD AND TOBAGO EMA (Environmental Management Authority)

CHAPTER 10– AIR - 258 -
The CARICOM Environment in Figures 2004
1.10.2 (b): Notes for Tables 10.2 (a) and (b) - Emissions of Nitrogen Oxides (NOx): 1975 - 1999
Country Notes
JAMAICA a - Energy activities only
TRINIDAD AND TOBAGO
Estimates derived from applying the waste load factor from the WHO manual. Municipal waste figures are the annual estimated figures for the three waste sites managed by SWMCOL.
1.10.3 (a): Sources of Data for Tables 10.3 (a) and (b) - Emissions of Non-Methane Volatile Organic Compounds (NM-VOCs): 1990 and 1994
Country Data Source
JAMAICA Statistical Institute of Jamaica TRINIDAD AND TOBAGO EMA (Environmental Management Authority)
1.10.3 (b): Notes for Tables 10.3 (a) and (b) - Emissions of Non-Methane Volatile Organic Compounds (NM-VOCs): 1990 and 1994
Country Notes
JAMAICA a - Energy activities and industrial processes only
TRINIDAD AND TOBAGO Source: EMA (2001). Initial National Communication of the Republic of Trinidad and Tobago under the UNFCCC
1.10.4 (a): Sources of Data for Tables 10.4 (a) and (b) - Emissions of Carbon Dioxide (CO2): 1981-2000, various years
Country Data Source
JAMAICA Statistical Institute of Jamaica TRINIDAD AND TOBAGO EMA (Environmental Management Authority)

CHAPTER 10– AIR - 259 -
The CARICOM Environment in Figures 2004
1.10.4 (b): Notes for Tables 10.4 (a) and (b) - Emissions of Carbon Dioxide (CO2): 1981-2000, various years
Country Notes
TRINIDAD AND TOBAGO a - Source: EMA (2001). Initial National Communication of the Republic of Trinidad and Tobago under the UNFCCC
b - Partial estimate delivered using the WHO Rapid Assessment Methodology - Source: UNDP/EMA (1998) Pollutant Inventory Study for Trinidad & Tobago
c - Source: 2003 Edition CO2 Emissions From Fuel Combustion 1971-2001, IEA Statistics
d - Emissions from fuel combustion only
1.10.5 (a): Sources of Data for Tables 10.5 (a) and (b) - Emissions of Methane (CH4): 1990 and 1994
Country Data Source
JAMAICA Statistical Institute of Jamaica TRINIDAD AND TOBAGO EMA (Environmental Management Authority)
1.10.5 (b): Notes for Tables 10.5 (a) and (b) - Emissions of Methane (CH4): 1990
and 1994
Country Notes
TRINIDAD AND TOBAGO a - Source: EMA (2001). Initial National Communication of the Republic of Trinidad and Tobago under the UNFCCC
1.10.6 (a): Sources of Data for Tables 10.6 (a) and (b) - Emissions of Nitrous Oxide (N2O): 1990 and 1994
Country Data Source JAMAICA Statistical Institute of Jamaica TRINIDAD AND TOBAGO EMA (Environmental Management Authority)

CHAPTER 10– AIR - 260 -
The CARICOM Environment in Figures 2004
1.10.6 (b): Notes for Tables 10.6 (a) and (b) - Emissions of Nitrous Oxide (N2O): 1990 and 1994
Country Notes JAMAICA p - preliminary data
TRINIDAD AND TOBAGO Source: EMA (2001). Initial National Communication of the Republic of Trinidad and Tobago under the UNFCCC
1.10.7 (a): Sources of Data for Table 10.7 - Emissions of Lead (Pb) and Consumption of Leaded Petrol: 1995 - 2002
Country Data Source
JAMAICA Statistical Institute of Jamaica TRINIDAD AND TOBAGO EMA (Environmental Management Authority)
1.10.7 (b): Notes for Table 10.7 - Emissions of Lead (Pb) and Consumption of Leaded Petrol: 1995 - 2002
Country Notes
JAMAICA p - preliminary data
TRINIDAD AND TOBAGO
a - Partial estimates delivered using the WHO Rapid Assessment Methodology - Source: UNDP/EMA (1998) Pollutant Inventory Study for Trinidad and Tobago