Embed Size (px)
Citation preview

1
RAeS Conference “Aerospace 2008, The Way Forward”, London, 22-24 April 2008
Highly Efficient and Greener Civil Aviation - Organising a Step Jump towards ACARE Goals
An Opportunity for the Present & a Vision for Future
Dr. R. K. Nangia BSc, PhD, CEng, AFAIAA, FRAeS
Consulting Engineer, Nangia Aero Research Associates WestPoint, 78-Queens Road, BRISTOL, BS8 1QX, UK.
Over the last 70 years, the civil aviation industry has dominated world transport. Growth has been
upwards - bigger, farther and faster on an economic productivity basis. With awareness of environmental issues, noise, emissions and energy / fossil fuel reserves, changes will happen and possibly in an accelerating fashion to improve the carbon balances.
The NASA and ACARE (Europe) objectives are to reduce Aviation’s environmental impact by 50% or more. This paper reviews the current work towards meeting such challenging objectives. A new set of Efficiency metrics of Civil Aviation allow development of a “unified” consistent efficiency theme, relating Payload, Range, Fuel consumed and a measure of Unit Costs. The “value” (cost) and noise effective efficiencies decrease dramatically with increasing Range. An operational strategy leads to a way forward for Fuel-efficient Commercial Aviation using smaller aircraft, adopting Air-to-Air Refuelling (AAR) and Close Formation Flying (CFF). For longer ranges, AAR and CFF, in concert, go most of the way toward satisfying NASA / ACARE objectives. Several avenues of further work arise.
1. INTRODUCTION The last three generations have witnessed the
civil aviation industry dominating world transport. Growth has been upwards - bigger, farther and faster on an economic productivity basis, Figs. 1 - 2 from Refs.1-2. We note that in Fig.2, the fuel load is included as part of the �useful� load. The future, over the next quarter century at least, will be with subsonic aircraft (Mach 0.8-0.85 cruise). We may assume, that the trends in Fig.2 are levelling out.
Range and Payload are highly inter-related. The general trend for increasing seating capacity with increasing range is shown in Fig. 3 (Ref.3). The question is whether this trend continues. We have seen ever-larger or longer-range aircraft and consequently ever-larger propulsion systems. MTOW of 1.2m lb is exceeded by the current A380. Another current philosophy is that smaller, long-range aircraft enable more convenient high frequency point-to-point services.
However, flying variants with large passenger payloads (e.g.350+ pax) designed for short or medium ranges are �rare�. Fielding (Ref.3) mentions an A-90 aircraft study: 500-seater (double-decker) for 2000 nm range.
There is increasing awareness of environmental issues, noise, emissions and energy / fossil fuel reserves (Refs.4-5). The ACARE (Advisory Council for Aeronautics Research in Europe) objectives are to reduce Aviation�s environmental impact (fuel consumption, CO2 , noise by 50% and NOx by 80%, relative to 2000). NASA has similar objectives. This should encourage future changes!
We review the current work towards meeting such challenging objectives. The efficiency metrics
(based on Ref.6) allow a �unified� consistent efficiency theme, relating Payload, Range, Fuel consumed and a measure of Unit Costs. We then derive Nangia �value� (cost) and noise effective efficiencies. These decrease dramatically as the aircraft design range increases. Current technology is showing evolutionary improvements at a slow rate. A strategy for a way forward towards highly fuel-efficient Commercial Aviation using smaller aircraft, and adopting Air-to-Air Refuelling (AAR) and Close Formation Flying (CFF) is outlined. Both AAR and CFF have been continuously developed in Military circles and we can envisage exploitation in the civil context. For the longer ranges, AAR and CFF, in concert, can go most of the way towards NASA and ACARE objectives.
2. EFFICIENCY ISSUES AND METRICS
Payload Range Efficiency A measure of aircraft efficiency is Payload
Range Efficiency (PRE): PRE = WP . R / WFB (i.e. Payload x Range / Block Fuel).
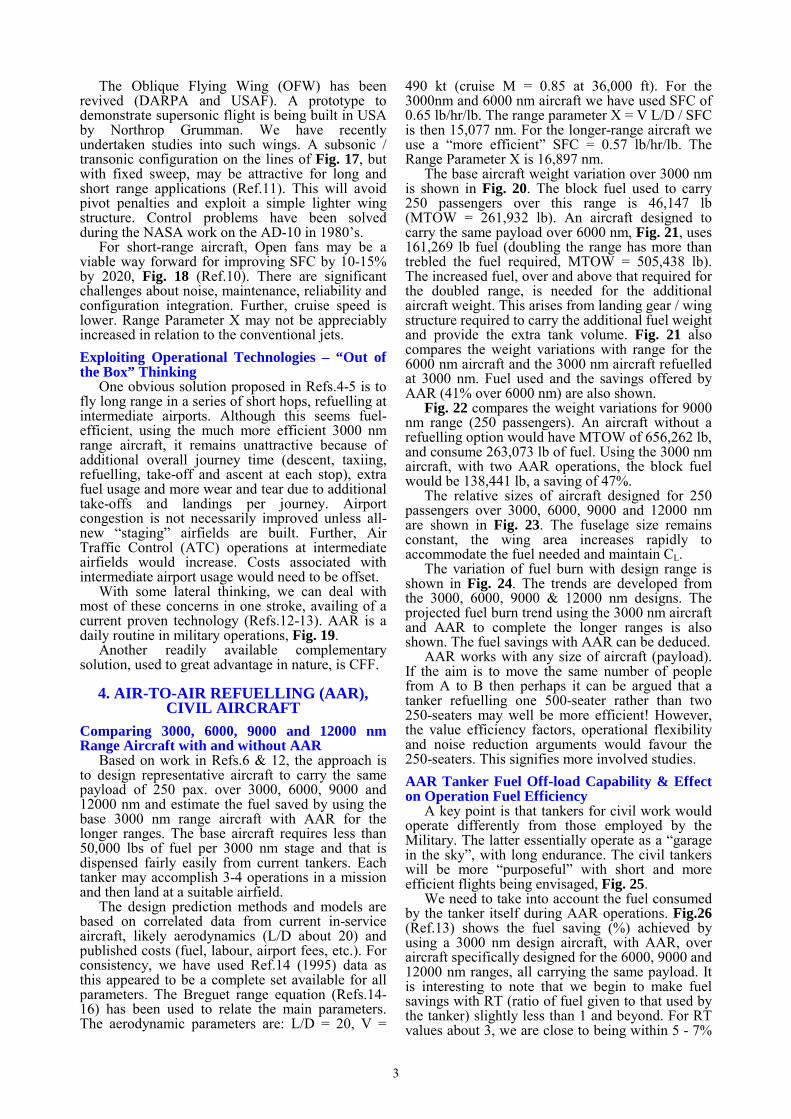
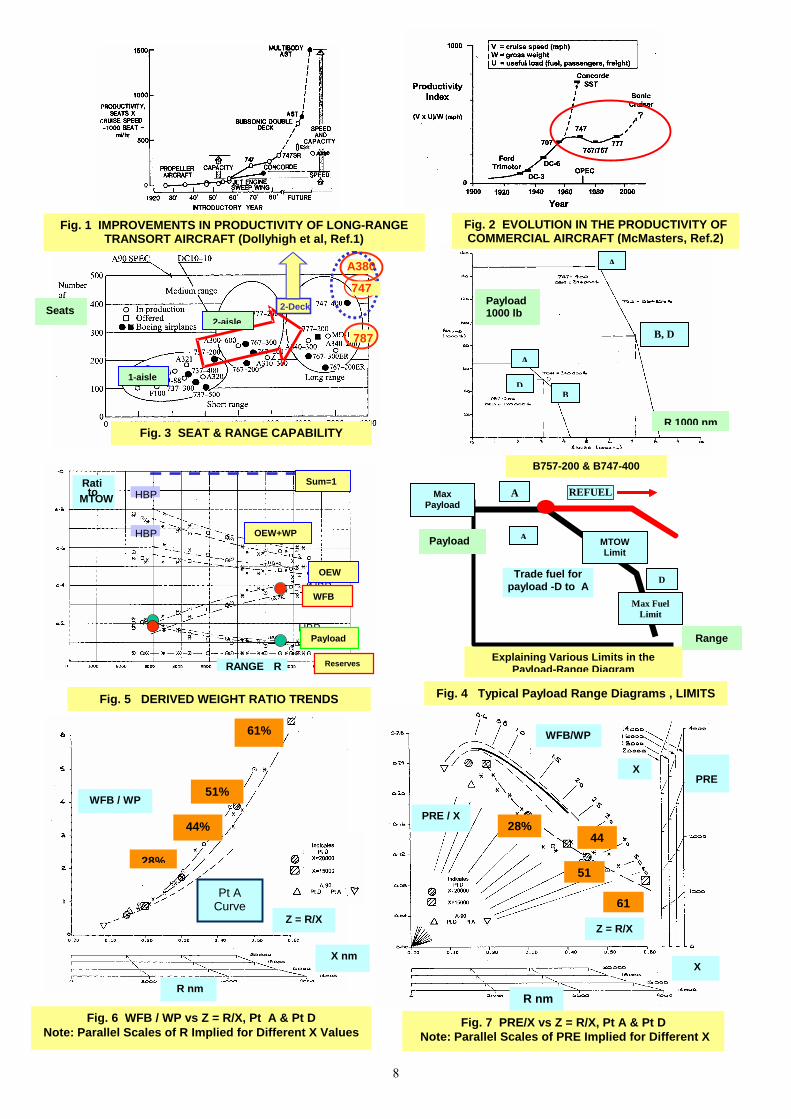
Green (Refs.4-5) presented graphs of PRE as a function of design range at maximum payload (Combi or freighter). However, reserve fuel was not accounted for and the results were erroneous. Nangia (Ref.6) conducted an independent detailed data exercise on modern commercial (jet) aircraft, taking into account the distinction between maximum payload and maximum passenger payload (Points A and D, Fig.4) as well as including fuel reserves. The data has been analysed in several ways and a whole host of cross-plots helped in understanding and establishing credibility.

2
The ratios, with respect to Maximum Take-Off Weight (MTOW), of the main weight variables (OEW, WFB and WP) are plotted against Range R in Fig.5 for Pt D. For a given aircraft, Pt A range will be shorter than that for Pt D. These results have been correlated into reliable �first-order� non-dimensional trends in terms of PRE/X and Z. X = V L/D / SFC, Z = R / X Z = R/X = loge [W1 / (W2] where W1 and W2 signify the weights at start and end of cruise. W2 = W1 - WFBC where WFBC is weight of the Fuel burnt during cruise. W1 = MTOW - WFBS where WFBS refers to the Fuel used for take-off, manoeuvring additional to the cruise. This is of the order of 2.2% (Ref.5). Total Block fuel is then WFB = WFBC + WFBS.
Figs. 6-7 summarise the WFB/WP and PRE/X trends, distinguishing clearly between A and D point operation. Green (Ref.7) supports the work. Radial lines of constant WFB/WP are shown. In fuel efficiency terms, aircraft perform better at Pt. A and the optimum design range is about 2500 - 3500nm, depending on the aircraft range parameter X. Note that from practical size and range considerations, Pt A curves extend to Z near 0.4. “Nangia Value Efficiency Parameters” – Cost, Noise and Emissions
The PRE/X graphs do not directly give information about aircraft structure and size (hence cost and noise). To include these we need to look at the Value-Efficiency trends using OEW and MTOW. We define �Nangia Value Efficiency� parameters VEO and VEM and their non-D correlation forms, VEOPX, VEMPX, by relating to Payload: VEO = PRE/OEW (nm/lb of aircraft) and VEM = PRE/MTOW (nm/lb of aircraft). VEOPX = (PRE/X) / (OEW/WP) = (PRE/X) x (WP/OEW). VEMPX = (PRE/X) / (MTOW/WP) = (PRE/X) x (WP/MTOW).
VEOPX denotes the Payload Range and Fuel efficiency per structure weight per unit payload. It can be related to the purchase cost per unit payload. It also serves as a measure of approach and landing noise. Higher values are better for lower structure weight, costs (acquisition and operating) and landing noise. VEMPX denotes the Payload Range and fuel efficiency per total weight per unit payload. It serves as a measure of take-off noise, emissions and hence, airport and environmental fees that may be incurred. Higher values are better for lower noise emissions and operating costs. Fig. 8 shows VEOPX and VEMPX correlations with Z using point D values. Note that the short-range aircraft are strongly favoured.
Often, aircraft do not fly at full capacity (passengers and/or cargo) and the implications need to be understood. How can we Improve Fuel Efficiency?
To improve PRE, VEM and VEO, we need to: - Increase V and / or L/D. Reduce SFC
- Reduce drag. Drag comprises several components. Peak L/D occurs when lift-induced drag is half of the total drag.
- Reduce OEW, allowing increased payload fraction. Flying wings may have a lower figure.
- Reducing SFC implies: Flying near optimum propulsive conditions e.g. Mach 0.85 for Jets with optimum bypass. Prop-fans give a lower SFC, but at expense of higher weight / reduced cruise speeds.
- Increasing VEMPX and VEOPX: reduce the overall weight and structure per unit payload. - Operate at or near Point A (maximum Payload)
- Modify airline operating procedures.
3. TECHNOLOGY TRENDS, FUEL COSTS, CONFIGURATIONS
Current Technology Trends in Relation to ACARE Objectives
Fig.9 (Refs.8-9) shows the reducing fuel burn trend based on the 1960s Comet up to the present day. It has reached 67% currently but the rate of improvement is beginning to level off as technologies mature. It needs to reach 80% reduction by 2020 and that implies an improvement rate last seen in 1970�s! Similarly, the noise reduction trend (Fig.10, Ref.9) shows 75% in the last 50 years and reflects �maturity�.
Fig. 11 refers to distribution of stage length, fuel burn and NOX emissions (Ref.8). The cumulative fuel burn is shown in Fig.12 (Ref.9). Majority of flight ranges are below 6200nm. Currently 35% of air transport fuel is spent on flights above ranges of 2700nm. In future, budget airlines will fly long ranges and this may shift the balance to 50% with a 7.5% swing! The industry continues to offer aircraft capable of 9000nm+ ranges. Impact of Fuel Costs
Fig. 13 (Ref. 10) shows the volatile nature of the fuel prices since 2001. The trend continues upwards in a non-linear fashion. The cost/barrel was about $30 in 2004. In March 2008, it reached $110. The corresponding costs for aviation fuel rose from 75c per USGallon in 2004 to $2.60 now.
In Aircraft Cash Operating Costs terms, Fig. 14 (Ref.10) illustrates the impact of doubling the fuel cost from $1.74 to $3.48 / US gallon. Short and long -range aircraft (B737-800, B777-200ER) are considered. With doubling of fuel costs, for the short ranges, the fuel cost proportion increases from 36% to 46%. For the longer ranges, the comparable figures are 55% to 63%. Proposed Carbon Emission trading will involve such distinctions. Possible Future Configuration Technology
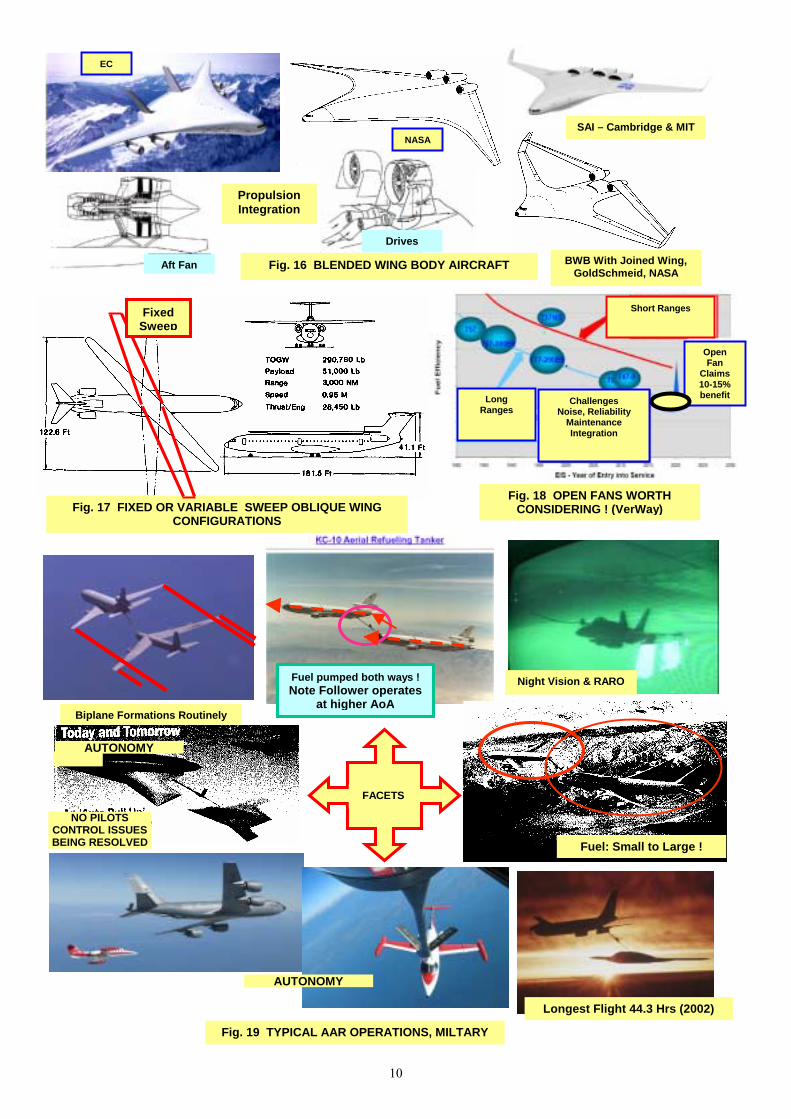
Exploiting natural or hybrid flow (to reduce skin friction drag) has been studied and demonstrated over many years. Several configurations, (Fig.15) have been proposed. Perceived integration and practical difficulties have prevented application.
Advanced configurations employing Blended Wings (BWB) have been proposed, Fig. 16. These could offer lower empty weight for large aircraft. Propulsion integration remains challenging.
3
The Oblique Flying Wing (OFW) has been revived (DARPA and USAF). A prototype to demonstrate supersonic flight is being built in USA by Northrop Grumman. We have recently undertaken studies into such wings. A subsonic / transonic configuration on the lines of Fig. 17, but with fixed sweep, may be attractive for long and short range applications (Ref.11). This will avoid pivot penalties and exploit a simple lighter wing structure. Control problems have been solved during the NASA work on the AD-10 in 1980�s.
For short-range aircraft, Open fans may be a viable way forward for improving SFC by 10-15% by 2020, Fig. 18 (Ref.10). There are significant challenges about noise, maintenance, reliability and configuration integration. Further, cruise speed is lower. Range Parameter X may not be appreciably increased in relation to the conventional jets. Exploiting Operational Technologies – “Out of the Box” Thinking
One obvious solution proposed in Refs.4-5 is to fly long range in a series of short hops, refuelling at intermediate airports. Although this seems fuel-efficient, using the much more efficient 3000 nm range aircraft, it remains unattractive because of additional overall journey time (descent, taxiing, refuelling, take-off and ascent at each stop), extra fuel usage and more wear and tear due to additional take-offs and landings per journey. Airport congestion is not necessarily improved unless all-new �staging� airfields are built. Further, Air Traffic Control (ATC) operations at intermediate airfields would increase. Costs associated with intermediate airport usage would need to be offset.
With some lateral thinking, we can deal with most of these concerns in one stroke, availing of a current proven technology (Refs.12-13). AAR is a daily routine in military operations, Fig. 19.
Another readily available complementary solution, used to great advantage in nature, is CFF.
4. AIR-TO-AIR REFUELLING (AAR),
CIVIL AIRCRAFT Comparing 3000, 6000, 9000 and 12000 nm Range Aircraft with and without AAR
Based on work in Refs.6 & 12, the approach is to design representative aircraft to carry the same payload of 250 pax. over 3000, 6000, 9000 and 12000 nm and estimate the fuel saved by using the base 3000 nm range aircraft with AAR for the longer ranges. The base aircraft requires less than 50,000 lbs of fuel per 3000 nm stage and that is dispensed fairly easily from current tankers. Each tanker may accomplish 3-4 operations in a mission and then land at a suitable airfield.
The design prediction methods and models are based on correlated data from current in-service aircraft, likely aerodynamics (L/D about 20) and published costs (fuel, labour, airport fees, etc.). For consistency, we have used Ref.14 (1995) data as this appeared to be a complete set available for all parameters. The Breguet range equation (Refs.14-16) has been used to relate the main parameters. The aerodynamic parameters are: L/D = 20, V =
490 kt (cruise M = 0.85 at 36,000 ft). For the 3000nm and 6000 nm aircraft we have used SFC of 0.65 lb/hr/lb. The range parameter X = V L/D / SFC is then 15,077 nm. For the longer-range aircraft we use a �more efficient� SFC = 0.57 lb/hr/lb. The Range Parameter X is 16,897 nm.
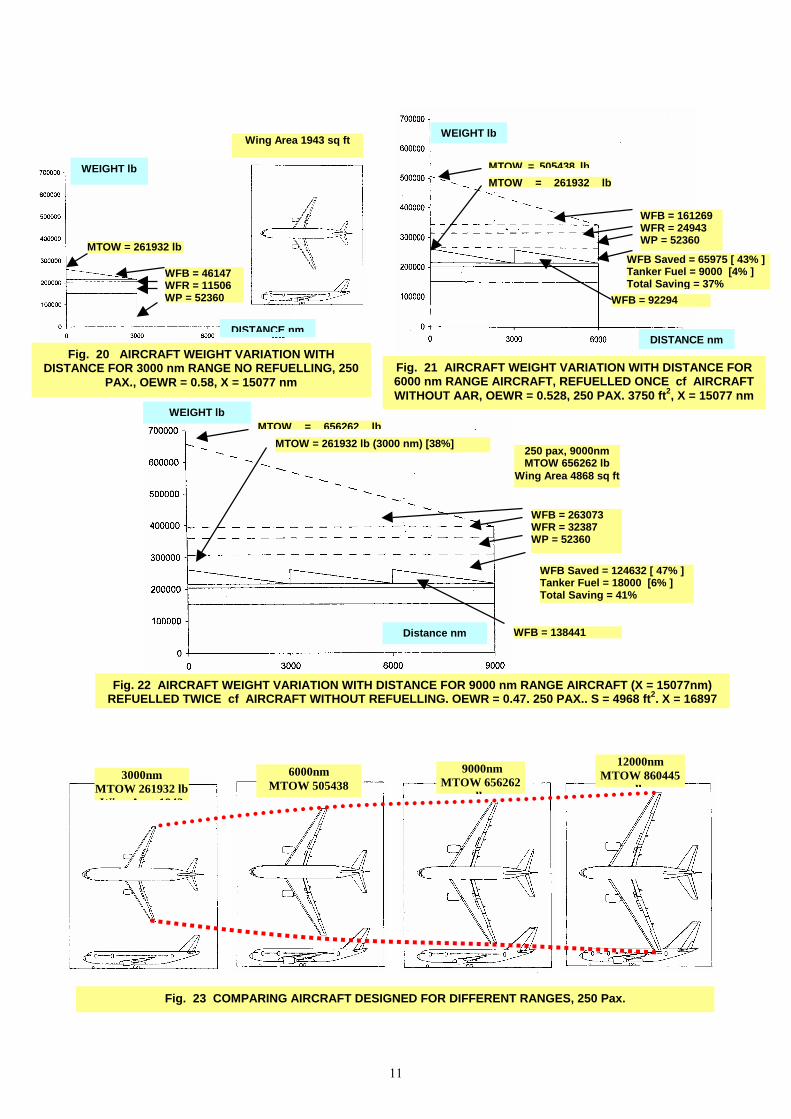
The base aircraft weight variation over 3000 nm is shown in Fig. 20. The block fuel used to carry 250 passengers over this range is 46,147 lb (MTOW = 261,932 lb). An aircraft designed to carry the same payload over 6000 nm, Fig. 21, uses 161,269 lb fuel (doubling the range has more than trebled the fuel required, MTOW = 505,438 lb). The increased fuel, over and above that required for the doubled range, is needed for the additional aircraft weight. This arises from landing gear / wing structure required to carry the additional fuel weight and provide the extra tank volume. Fig. 21 also compares the weight variations with range for the 6000 nm aircraft and the 3000 nm aircraft refuelled at 3000 nm. Fuel used and the savings offered by AAR (41% over 6000 nm) are also shown.
Fig. 22 compares the weight variations for 9000 nm range (250 passengers). An aircraft without a refuelling option would have MTOW of 656,262 lb, and consume 263,073 lb of fuel. Using the 3000 nm aircraft, with two AAR operations, the block fuel would be 138,441 lb, a saving of 47%.
The relative sizes of aircraft designed for 250 passengers over 3000, 6000, 9000 and 12000 nm are shown in Fig. 23. The fuselage size remains constant, the wing area increases rapidly to accommodate the fuel needed and maintain CL.
The variation of fuel burn with design range is shown in Fig. 24. The trends are developed from the 3000, 6000, 9000 & 12000 nm designs. The projected fuel burn trend using the 3000 nm aircraft and AAR to complete the longer ranges is also shown. The fuel savings with AAR can be deduced.
AAR works with any size of aircraft (payload). If the aim is to move the same number of people from A to B then perhaps it can be argued that a tanker refuelling one 500-seater rather than two 250-seaters may well be more efficient! However, the value efficiency factors, operational flexibility and noise reduction arguments would favour the 250-seaters. This signifies more involved studies. AAR Tanker Fuel Off-load Capability & Effect on Operation Fuel Efficiency
A key point is that tankers for civil work would operate differently from those employed by the Military. The latter essentially operate as a �garage in the sky�, with long endurance. The civil tankers will be more �purposeful� with short and more efficient flights being envisaged, Fig. 25.
We need to take into account the fuel consumed by the tanker itself during AAR operations. Fig.26 (Ref.13) shows the fuel saving (%) achieved by using a 3000 nm design aircraft, with AAR, over aircraft specifically designed for the 6000, 9000 and 12000 nm ranges, all carrying the same payload. It is interesting to note that we begin to make fuel savings with RT (ratio of fuel given to that used by the tanker) slightly less than 1 and beyond. For RT values about 3, we are close to being within 5 - 7%

4
of the maximum benefit obtainable. We need to explore design ranges between 3000 and 6000 nm.
All this implies that reasonably efficient tanking, with RT near 4, should be adequate. Although more efficient tanking will help in terms of costs and operations, the incentives in the short term are less for extensive advances in tanker design. Tankers currently available will allow significant fuel savings to be made for refuelling over long ranges.
It is interesting to note from Fig. 27, the increase in PRE/X achieved by the refuelled 3000 nm design aircraft over the PRE/X achieved by the aircraft designed for that range. This is expressed as a percentage of the PRE/X achieved by the aircraft designed for that range. The improvements are large and higher for the longer range situations. For a �reasonable� RT value of 4, we are touching gains in PRE/X of 60% for 6000nm and 80% for 9000nm ranges, compared with the datum 3000 nm aircraft. Part Range Refuels and Maximum Pt A Payload
We have taken as examples the B757-300 (MTOW 270,000 lb) and the A330-200 (MTOW 507,065 lb) to assess the effect of part-range refuelling, flying with maximum Point A payload, maximum efficiency.
The B757-300 could transport its maximum payload of 68,200 lb over a range of 2388 nm (Point A operation) without refuelling. A typical weight breakdown is shown in Fig. 28(a). Fig. 28(b, c & d) shows the weight breakdown starting off with different take-off weights (Light, Intermediate and MTOW) and a single refuel of 47,850 lb (WFREF) at the respective ranges completed. After AAR the aircraft are at MTOW and can complete a further 2388 nm as shown. Fig. 28(e & f) shows the weight breakdown starting off at MTOW and then refuelling after 2388 nm with either 10% or 50% WFREF.
The A330-200 could transport its maximum payload of 106,800 lb over a range of 4200 nm (Point A operation) without refuelling. Fig. 29(a) shows typical weight breakdown. The above exercise is repeated for the A330-200 in Fig. 29(b-f). WFREF is 113,730 lb.
Fig. 30 shows the PRE / X - Z relationships for both the A330-200 and the B757-200 with AAR. For each aircraft, the lower line results from taking off at less than MTOW and then refuelling with 100% WFREF. The upper line results from take-off at MTOW and then refuelling with various fractions of WFREF. Note the improvements are very substantial compared with the current PRE/X trends for Pt A and Pt D. Further work is needed. Associated Benefits
Operational issues will, no doubt, need to be solved. AAR has been well utilised by the military and a stage of autonomous refuelling is possible with current research in controls and differential GPS. The adoption of AAR leads to several other possible benefits using smaller aircraft: - Smaller propulsion requirement - Reduced noise at Take-Off / Approach / Landing - More efficient use of Regional airports (smaller
aircraft)
- Less congestion (air and land) at Hub airports - Smaller aircraft imply reduced wake problems and
increased aircraft flow rate - Current increasing demands on ATC can be
�diluted� away from Hubs to Regionals. - Enabler: Some technologies, marginal currently,
e.g. Laminar flow, become feasible.
5. CLOSE FORMATION FLYING (CFF) The possibility of using CFF to reduce fuel
usage or to extend range is well known. It has become important to assess its implementation in view of environmental aspects. Aircraft formations typified by Fig. 31 occur for several reasons e.g. during displays or in air-to-air refuelling but they are not maintained for any great length of time from the fuel efficiency perspective. Recently NASA has conducted tests on two F/A-18 aircraft formations (Refs.17-20 & Fig. 32). It was shown that benefits occur at certain geometry relationships in the formation e.g. the trail aircraft overlaps the wake of the lead aircraft by 10-15% semi-span. Some of the NASA work was partly inspired by the sizeable German work programme including flight-tests (Hummel et al, See Nangia paper, Ref.21).
For civil aircraft, Jenkinson, in 1995 (Ref.22), proposed a CFF of several large aircraft as being more efficient, in comparison with flying a very large aircraft. The aircraft could take off from different airports and then fly in formation over large distances before peeling away for landing at the required destinations.
For Cargo aircraft formations (2-5 aircraft), Brachet et al (Ref.23) present an architecture and an evaluation including financial considerations. With fuel costs based on $1/US gallon, substantial benefits occur for long-range aircraft. For medium-ranges, the benefits were �uncertain� and not much for short-ranges. With sharp rises in fuel costs, medium-range aircraft may now benefit more!
For CFF, theoretical results are available using idealized approaches (vortex lattice formulations) (Ref.24). This also contains a sizeable bibliography. Refs.17-20 & 25 refer to NASA and USAF work.
Aircraft formations can comprise large and small aircraft, Fig.33. Each aircraft will experience off-design forces and moments. It is a pre-requisite that these are adequately modelled and efficiently controlled. Simply using aileron may trim out induced roll but at the expense of drag. This may compromise any advantages due to CFF.
In the modern context, efficient flight control implies morphing, exploiting variable camber, winglets, span extension or other ideas. We have developed an �inverse� design method (Refs.26-27) applicable to wings with or without winglets. This approach, starting with a wake shape and spanwise loading constraints, produces wing camber and twist shapes. Any solver, e.g. panel, Euler or Navier-Stoke types, can be implemented. The technique has been adapted to CFF and we can predict the geometry changes required, not only for safe CFF, but also for minimising drag. Overall the
5
fidelity levels of modelling are raised. We begin with the design of a conventional, isolated wing. Designed Aircraft Wing
Referring to Ref.21, the conventional wing (A340 planform type with simple aerofoil sections at this stage) is initially assessed in its planar, no camber, condition. The wing is then designed for a known CL and Mach no. The design process being staged, gives a feel for camber development, pressure distributions and Centre of Pressure location. Initial designs can be developed rapidly using Linear Theory and Panel methods. Designs can then be further evaluated using higher order methods, e.g. Euler codes. In general, we may choose to design for minimum drag (elliptic loading), a pre-determined level of stability or a compromise between the two, or indeed a Root Bending Moment constraint (on Fuselage side).
Fig. 34(a-d) refers to a �conventional� wing layout, designed for CL=0.45 at Mach 0.8. Here the target was simple spanwise loading with CLL constraint over the outer wing (low bending moment) from the Trefftz-plane basis. Note from the spanwise loadings (a) and the chordwise pressures (b) that the target distribution has been achieved within five design cycles. The spanwise loadings show the small region of suction force (negative CDi) at the tip. The resultant camber distribution (d) is smooth and consistent. At the root, the camber profile is �S� shaped with 3.9o of twist. At the tip the section is twisted by 1.1o. As envisaged, the Cp�s compare well with contours from Euler calculations.
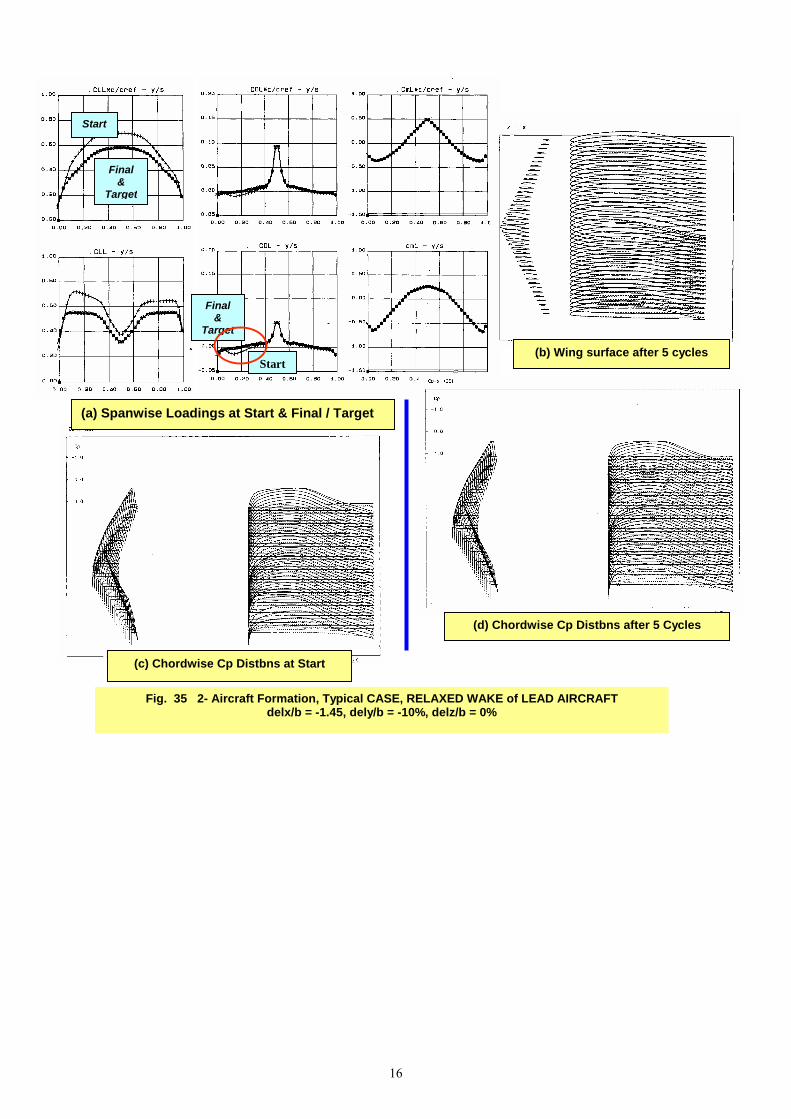
We look next at selected cases of CFF. We refer to the aircraft in CFF as Lead and Trail. In each CFF case, the Trail wing is re-designed to cancel out the induced effects arising in formation flight. The spanwise and chordwise loadings (induced rolling and pitching moments) are trimmed out. Two Equal Sized Aircraft in CFF
We consider the CFF configuration in which streamwise displacement is 1.45b (1.45 x span), spanwise over lap (dy/b) is 10% and vertical displacement (dz/b) is 0%. Fig. 35 shows results for the Trail wing in the presence of a Lead wing relaxed wake. Spanwise loadings (Lift and Rolling and Pitching Moments) are shown in (a). The re-designed cambered and twisted surfaces are compared with the original isolated datum wing in (b). Cp distributions are in (c-d) at the start and after five redesign iterations. Increased loading on the left wing is evident in both spanwise and chordwise distributions before re-designing. Unequal Sized Aircraft, Lead :Trail = 2.5 :1.0.
Based on Ref.28, the relative sizes are noted from Fig.36. For dx/b=1.45, dy/b=5%, dz/b=-5%, Figs. 36 & 37 show Euler results before and after camber control, respectively. The Mach and Cp contours, in Fig. 36, show the more significant spanwise extent of the differential loading on the Trail wing. In Fig. 37, after re-designing, the loading is evidently more symmetrical.
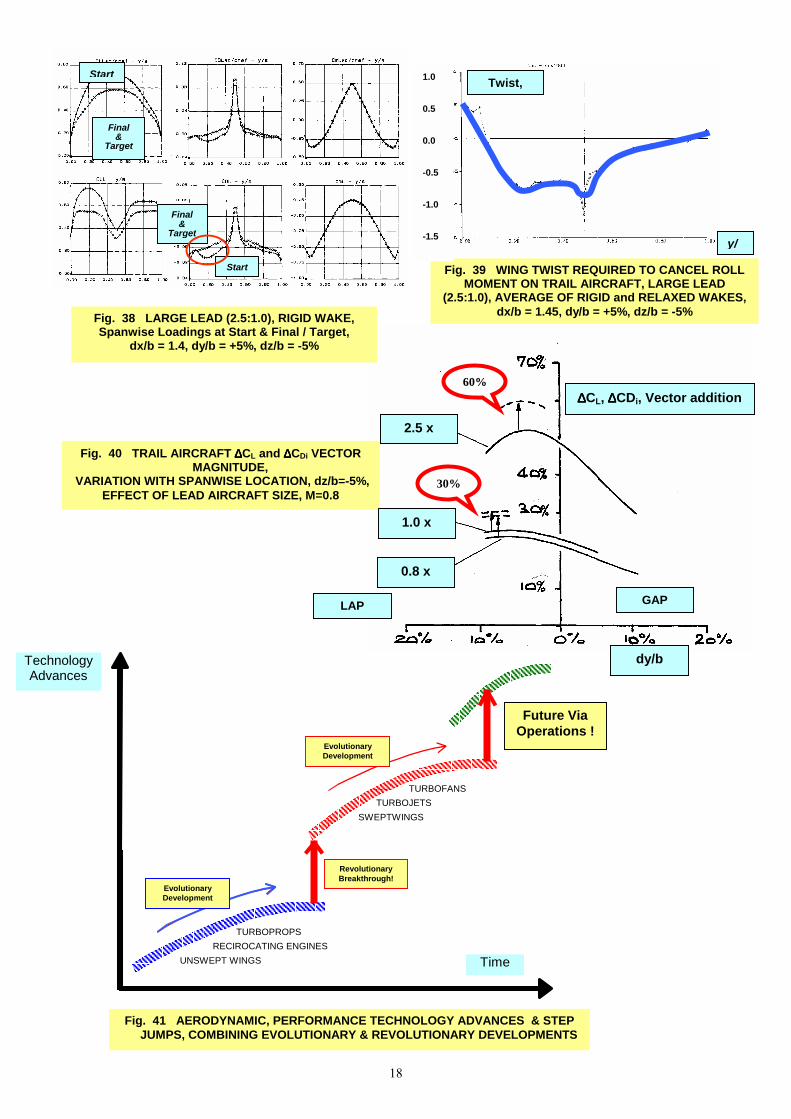
Fig. 38 shows the spanwise loadings at the start and after five re-design iterations, on the Trail wing in the presence of relaxed Lead wing wake. The Trail wing is re-designed to cancel out the induced effects in formation flight. The resulting Trail wing twist changes for these cases are shown in Fig. 39. Re-designing in the presence of a relaxed Lead aircraft wake has resulted in a slightly smoother twist variation across the Trail wing. This indicates the changes needed on the trail aircraft geometry to cancel the induced effects due to formation flight. First-Order Relative Size Ratio Effects
We have considered: Lead : Trail linear ratios of 0.8:1.0, 1.0:1.0 and 2.5:1.0.
For dz/b = -5% (vertical position), the variation of ∆CVM (vector addition of ∆CL% and ∆CDi%, solid line) is plotted against location across the Lead aircraft span in Fig. 40 for three Lead wing size ratios. The benefits of formation flying, in terms of Trail wing ∆CVM, increases as the Lead aircraft dimensions increase. From the limited results so far, we infer that a wing overlap between 5% and 10% of the Lead aircraft span is desired.
It is emphasized that this is very much a first order assessment and further analysis will be required for complete aircraft configurations. Suitable candidates for Trail wing redesign with reference to Lead wing sizing and y-z plane location are selected. After re-designing, to determine Trail wing geometry changes required for corrected flight, ∆CL levels are less than 1%. The resulting ∆CDi % are plotted as dashed lines in Fig. 40. These represent the pure ∆CDi % benefits achieved on a trimmed Trail wing in formation (CL now equal to datum, isolated wing with zero rolling moment). As anticipated, Trail wing benefits increase with increasing Lead wing size.
A number of flight formations with aircraft of varying size have been studied. Predictions show 30% or more benefits in lift-induced drag on the trail aircraft. In turn this should lead to 10-15% improvement in range. There are obviously many operational considerations concerning control, positioning, scheduling etc that need to be brought into focus. The size of likely benefits should provide impetus. Multi-aircraft formations will multiply the benefits and such aspects are worthy of further detailed consideration.
6. CONCLUDING REMARKS AND
GENERAL INFERENCES Over the last 70 years, civil aviation has
dominated world transport. Since the advent of the jet engine and swept wing aircraft, the trends have naturally been towards greater economic productivity � based on �bigger, farther and faster�. Several significant efficiency improvements (materials, wing sweep, high by-pass ratio engines, etc.) have arisen. The trends have �levelled�. Efficiency improvements now, are of the order of a few percent and require high technology levels and great expense (carbon-fibre, laminar flow, winglets, etc.). �Step jumps� in Technology and efficiency are needed (Fig. 41, based on Ref.29). These are

6
more likely to come via operational means. The environmental issues will force aviation to cut emissions, either by further technological advances or through reduced operations.
Work towards improving air transport efficiency has led to a set of �robust� efficiency metrics including �Nangia Value Efficiency� parameters. These confirm that smaller aircraft designed to operate over ranges close to 3000nm are most efficient. This leads naturally to the proposal for AAR within civil aviation. This in turn re-introduces the topic of CFF.
Using 3000nm range aircraft and AAR for longer ranges, savings of 30-50% fuel are predicted.
Using smaller aircraft reduces wake problems and increases airport movement rates.
Reduced noise at Take-Off,/Approach/ Landing Smaller engines required Greater use of Regional airports reduces
congestion on the ground and in the air Currently increasing demands on ATC can be
diluted away from Hub airports Operating at maximum payload, varying first
stage fuel weight and range, AAR offers benefits of 80-120 % PRE.
Large benefits occur for increased payloads over smaller ranges, taking-off light and early AAR.
Technologies, beneficial but �impractical� e.g. Laminar flow, are enabled by AAR.
The benefits of CFF vary with size and type. Trail aircraft in CFF can experience reductions
in lift-induced drag of up to 30%. The ideas extend to multi-aircraft formations
and link naturally with AAR. We need to take a new, objective and unbiased
viewpoint. The studies and conclusions discussed show possible lines to follow. It is clear that these ideas cut across conventional thinking and the objectives of many different sectors in civil aviation. Such global ideas are not likely to be taken up by just one sector. Integration is the key. Therefore the ideas need a much wider acceptance by a whole host of organisations. This is where the knowledge transfer aspect comes in, to ensure an informed decision process. In parallel, there is need for continued development of analyses.
With CFF and AAR, no amount of predictive work is capable of giving a complete insight into possible implementation. The Military has gathered a vast amount of experience on AAR and close proximity flying. There are significant advances in differential GPS, navigation, ATC, autonomous flying that could ease CFF and AAR into the civil world. We need to commence with flight simulations in the imminent future to highlight any problem areas. Further research into fuel transfer aspects is required. Similarly the advantages of specific tanker / receiver formation relationships need to be assessed and balanced against possible operational and technical difficulties. For longer ranges, AAR and CFF in concert, go most of the way toward satisfying ACARE objectives.
Several avenues for future work have arisen. We need to include, in the analysis, all sorts of aircraft in service now and what may be offered in the
future. The typical airline / aircraft cycle is of the order of 30-40 years. The design cycle of aircraft is 10-15 years. New concepts are effectively under consideration now e.g. prop-fans that will come into service before 2020. Far into the future are possibly, BWB, Oblique Flying Wing (OFW) etc. The question of how these new designs line up on the efficiency metrics basis becomes important. Are the metrics adequate? All this provides the motivation for continued work programme.
ACKNOWLEDGEMENTS The author has pleasure in acknowledging
helpful technical discussions with Prof. J.A. Jupp, Mr. Les Hyde, Dr. Ray Kingcombe, Mr. I. Wilson, and Prof. D.I.A. Poll. The technical assistance of Dr. M.E. Palmer is appreciated. Currently, these studies remain unfunded and are part of in-house R & D. This has been a major undertaking, all in the quest for knowledge and wider understanding. Some of the inferences and conclusions may be a surprise and be controversial. We hope for a healthy debate in view of the environmental pressures on the aviation scene. Co-operation and sponsorship on the work programmes is warmly invited. Any opinions expressed are due to the author.
REFERENCES
1. DOLLYHIGH, S.M. & COEN, P.G., �Advanced Technology and Unconventional Aircraft Concepts,� Unconventional Aircraft, Delft University, 1987.
2. McMASTERS, J.H. & CUMMINGS, R.M., Article in AIAA Journal of Aircraft, Jan. 2002.
3. FIELDING, J.P., �Introduction to Aircraft Design�, Cambridge University Press, 1999.
4. GREEN, J.E., �Greener by Design � the Technology Challenge�, The RAeS Aero. Jo., Vol.106, No.1056, February 2002, Erratum, Vol 109, no 1092. 2005.
5. GREEN, J.E., �Air Travel � Greener by Design. Mitigating the Environmental Impact of Aviation: Opportunities & Priorities�, The RAeS Aero Jo., Vol.109, No. 1099, Sept 2005.
6. NANGIA, R.K., �Efficiency Parameters for Modern Commercial Aircraft�, RAeS Aeronautical Journal, Volume 110, no 1110, pp 495-510, August 2006.
7. GREEN, J.E., �Kuchemann�s weight model as applied in the first Greener by Design Technology Sub Group Report: A Correction, Adaptation and Commentary�, The RAeS Aero Jo., Vol.110, No. 1110, August 2006.
8. GREEN, J.E., �Aviation & Environment�, The 95th Wilbur & Orville Wright Lecture Lecture, RAeS. London, 14th December 2006.
9. JUPP. J.A., �Mitigating the Environmental Impact of Aviation�, Presentation, AeIGT, 2006.
10. VerWey, J., �Discovering the Right Balance � Perspectives on Next-Generation Commercial Jet Engines�, Boeing Presentation, September 2007.
11. NANGIA, R.K., �Oblique Wings for Transonic Configurations�, Paper to be published.
12. NANGIA, R.K., �Operations and Aircraft Design Towards �Greener� Civil aviation Using Air-to-Air Refuelling�, The RAeS Aeronautical Journal, November 2006.
13. NANGIA, R.K., � �Greener" Civil Aviation Using Air � to - Air Refuelling - Relating Aircraft Design Efficiency & Tanker Offload Efficiency�, The RAeS Aeronautical Journal, September 2007
7
14. JENKINSON, L. R., SIMPKIN, P. & RHODES, D., �Civil Jet Aircraft Design�, Arnold, 1999.
15. WHITFORD, R. �Fundamentals of Airliner Design�, Air International, July 2003
16.KUCHEMANN, D. "The Aerodynamic Design of Aircraft", Pergamon, 1978.
17. HAGENAUER, B. "NASA Studies Wingtip Vortices", Aerospace Engineering Online: Technology Update, Jan/Feb 2002, http://www.sae.org/aeromag/techupdate/02-002/page5.htm.
18. IANNOTTA, B. "Vortex Draws Flight Research Forward", Aerospace America, March 02, pp 26-30.
19. RAY, R. J., et al. "Flight Test Techniques Used to Evaluate Performance Benefits During Formation Flight", AIAA paper 2002-4492, August 2002.
20. WAGNER, G., et al. "Flight Test Results of Close Formation Flight for Fuel Savings", AIAA paper 2002-4490, August 2002.
21. NANGIA, R.K., PALMER, M.E., �Formation Flying of Commercial Aircraft � Assessment using a New Approach - Wing Span Load & Camber Control�, AIAA-2007-0250, January 2007.
22. JENKINSON, L.R., CAVES, R.E & RHODES, D.R., �A Preliminary Investigation into the Application of Formation flying to civil operation, AIAA Paper �95-3898, 1995.
23. BRACHET et al, �Architecture and Evaluation of a Formation Flight System for Existing Cargo Aircraft�, MIT, AIAA, 2004.
24. IGLESIAS, S., �Optimum Span-loads Incorporating Wing Structural Considerations & Formation Flying�, Virginia Polytechnic, 2000 Thesis.
25. BLAKE, W. & MULTHOPP, D, �Design, performance and modelling considerations for close formation flight�,. AIAA Paper 98-4343 (1998).
26. NANGIA, R.K., PALMER, M.E. & DOE, R.H., � Aerodynamic Design Studies of Conventional & Unconventional Wings with winglets�, AIAA-2006-3460. June 2006.
27. NANGIA, R.K., PALMER, M.E., �Morphing UCAV wings, Incorporating in-Plane & Fold-Tip Types � Aerodynamic Design Studies�, AIAA-2006-2835.
28. NANGIA, R.K., PALMER, M.E., �Formation Flying of Commercial Aircraft � Variations in Relative Size / Spacing � Induced Effects & Control�, AIAA Paper 2007-4163, June 2007.
29. KULFAN, B., Presentation to NRC, USA, 2001. Related recent Lectures & Papers:
1. NANGIA, R.K., �A Vision for Highly Fuel-Efficient Commercial Aviation�, EUCASS 2007, Brussels, July 2007.
2. NANGIA, R.K., �Highly Fuel-Efficient Civil Aviation � An Opportunity for Present & Vision for Future�, CEAS 2007-264, Berlin, September 2007.
3. NANGIA, R.K., �Commercial Aircraft Efficiency Considerations & Meeting Environmental Challenges using Air-to-Air Refuelling & Close Formation Flying�, AIAA, ATIO meeting, AIAA-2007-7720.
4. NANGIA, R.K., �Highly Fuel-Efficient & Greener Aviation � A Step Jump, Why & How�, Presentation to RAeS, Bristol, 15th October 2007.
5. NANGIA, R.K., �Highly Efficient and Greener Civil Aviation - Step Jump, Why & How, An Opportunity for Present & A Vision for Future�, COIAE - AIAE, Madrid, 21st November 2007.
6. NANGIA, R.K., �Highly Efficient and Greener Civil Aviation - Step Jump, Why & How, An Opportunity for Present & A Vision for Future�, IAR, Cambridge University, 4th February 2008.
NOMENCLATURE
AR Aspect Ratio ATC Air Traffic Control b = 2 s, Wing span c Local Wing Chord cav = cref = S/b, Mean Geometric Chord CA = Axial force/(qS), Axial Force Coefficient CAL Local Axial Force Coefficient CD = D /(q S), Drag Coefficient CDi Lift Induced Drag Coefficient CDL Local Drag Coefficient CL = L/(q S), Lift Coefficient CLL Local Lift Coefficient Cm =m/(qS cav), Pitching Moment Coeff. CmL Local Pitching Moment Coefficient CP Coefficient of Pressure ∆CL Difference in CL ∆CDi Difference in CDi ∆CD Difference in CD ∆CVM Magnitude of vectors (∆CL , ∆CDi ) dx, dy, dz - specifying formation relative distances D Drag force DOC Direct Operating Cost GPS Global Positioning System kt Knots, nm/hr L Lift Force L/D Lift to Drag Ratio m Pitching moment M Mach Number MTOW Maximum Take-Off Weight (=TOW) OEW Operating Weight Empty (also WOE) OEWR = OEW / MTOW Pax Passengers PRE Payload Range Efficiency WP*R/WFB q = 0.5 ρ V2, Dynamic Pressure R Range s semi-span S Reference Area (SL Lead Wing, ST Trail) SFC Specific Fuel Consumption, lb (of fuel)/hr / lb
(thrust) = 1/hr T/W Thrust to Weight Ratio V Airstream Velocity (kt) WP Payload (WP) WF Fuel Load (Block + Reserves = Total) WFB Block Fuel WFREF Maximum Refuel Load WFT Tanker Fuel x,y,z Orthogonal Co-ordinates, x along body X = V L/D / SFC, Range Parameter Z = R / X, Non-Dimensional Range α AoA, Angle of Attack ß √ (1-M2) λ Taper Ratio, ct/cr Λ LE Sweep Angle η = y/s, Non-dimensional spanwise distance ρ Air Density
© Copyright, Dr. R.K. Nangia 2008. All Rights reserved.Published by RAeS with Permission
8
RANGE R
Z = R/X
Pt A Curve
X nm
R nm
28%
51%
44%
61%
WFB / WP
Fig. 6 WFB / WP vs Z = R/X, Pt A & Pt D Note: Parallel Scales of R Implied for Different X Values
Trade fuel for payload -D to A
REFUEL
B757-200 & B747-400
B, D
Payload1000 lb
Fig. 4 T
MTOW Limit
Max Payload
Payload
PRE / X
Fig. Note: Parall
787
A380
-2-Deck
-
Ratito MTOW
RANGE R
HBP
HBP
HBP
HB
Fig. 3 SEAT & RANGE CAPABILITY
Fig. 5 DERIVED WEIGHT RATIO TRENDS
Seats
747
Reserves
Fig. 1 IMPROVEMENTS IN PRODUCTIVITY OF LONG-RANGE TRANSORT AIRCRAFT (Dollyhigh et al, Ref.1)
Explaining Various Limits in the Payload-Range Diagram
ypica
7 PRel Sc
A
l Payload Range Diagram
R nm
E/X v tales o D
Z = R/X
WFB/WP
D
B
A
D
s
Di
R 1000 nm
Max Fuel Limit
, LIM
fferen
Range
Fig. 2 EVOLUTION IN THE PRODUCTIVITY OF COMMERCIAL AIRCRAFT (McMasters, Ref.2)
A
ITS
P
t X
s Z = R/X, Pt A & Pf PRE Implied forX
X
RE28%
51
44
61
A
- 1-aisle
2-aisle
Sum=1
OEW+WP
OEW
WFB
PPayload

9
doubling
Fig. 8 CIVIL AIRCRAFT, NON-DIMENSIONAL EFFICENCY PARAMETERS VEMPX & VEOPX
VEMPX
VEOPX=PRE/X*WP/OEW
VEOPX
VEMPX= PRE/X*WP/MTOW
Z = R/X
Consum
Fig. 9 REDUCING FUEL BURN TREND, 1960 TO 2000
Fuel Burn / seat
Fig. 10 ENGINE NOISE REDUCTION, 1960 to PRESENT
F
Fuel Consumption
55%Fuel65%Fuel
45%Fuel 36%Fuel
New Designs
B777 B747 B787 A380
A350XWB
Fig. 11 DISTRIBUTION OF STAGE LENGTH, FUEL BURN & NOX EMISSION
i
New Designs
B777 B747 B787 A380
A350XWB
Fig. 12 CUMULTIVE WORLD FUEL BURN vs STAGE LENGTH
g. 15 EXPLOITING LAMINAR FLOW - P
Stage Length
7.5% shift Future 50% !
Current65%
Fig. 13 FUEL COST ESCALATION from 2001 (Moody, IATA & Ref.10)
ROPOSALS
FIG. 14 IMPACT OF FUEL COSTS ON AIRCRAFT CASHOPERATING COSTS, 737 & 777 SERIES (Ref.10)
67%
80%
Handley-Page 1961
Airbu
Strut-Braced, USA
B737-800B777-300ER
$110
$30
$2.6 $/USG
$0.75 $/USG
Biplane Formations Routinely
NO PILOTS CONTROL ISSUES BEING RESOLVED
Fig. 19 TYP
Night Vision & RARO
AUTONOMY
AU
Fig. 17 FIXED OR VARIABLE SWEEP OBLIQUE WING CONFIGURATIONS
Fig. 16 BLENDED WING BODY AIRCRAFT
Propulsion Integration
BWB With Joined Wing, GoldSchmeid, NASA
Drives
Short Ranges
Long Ranges
Challenges Noise, Reliability
Maintenance Integration
SAI – Cambridge & MIT
Fuel pumped both ways !Note Follower operates
at higher AoA
10
ICAL AAR OPERATIONS, MILTARY
TONOMY
FACETS
Fuel: Small to Large !
Longest Flight 44.3 Hrs (2002)
Aft Fan
Fig. 18 OPEN FANS WORTHCONSIDERING ! (VerWay)
Fixed Sweep
EC
NASA
Open Fan
Claims10-15%benefit
11
Fig. 216000 nmWITHO
WFB = 46147 WFR = 11506 WP = 52360
MTOW = 261932 lb
WEIGHT lb
Fig. 20 AIRCRAFT WEIGHT VARIATION WITH DISTANCE FOR 3000 nm RANGE NO REFUELLING, 250
PAX., OEWR = 0.58, X = 15077 nm
Wing Area 1943 sq ft
Fig. 22 AIRCRAFT WEIGHT VARIATION WITH DISTANCEREFUELLED TWICE cf AIRCRAFT WITHOUT REFUELLIN
MTOW = 656262 lbMTOW = 261932 lb (3000 nm) [3
WEIGHT lb
Distan
3000nm MTOW 261932 lb Wi A 1943
6000nm MTOW 505438
Fig. 23 COMPARING AIRCRAFT DESIGNED FO
WEIGHT lb
AIRCRAFT WEIGHT VARIATION WIT RANGE AIRCRAFT, REFUELLED ON
UT AAR, OEWR = 0.528, 250 PAX. 375
WFB = 161269WFR = 24943 WP = 52360
MTOW = 505438 lb
WFB = 92294
WFB Saved = 65975 [ 43% ]Tanker Fuel = 9000 [4% ] Total Saving = 37%
MTOW = 261932 lb
FOR 9000 nm RANGE AIRCRAFT (X =G, OEWR = 0.47, 250 PAX., S = 4968 f
WFB = 263073 WFR = 32387 WP = 52360
WFB = 138441
WFB Saved = 124632Tanker Fuel = 18000 Total Saving = 41%
8%] 250 pax, 9000nm MTOW 656262 lb
Wing Area 4868 sq ft
ce nm
9000nm MTOW 656262
lb
12000MTOW 8
lb
R DIFFERENT RANGES, 250 Pax.
DISTANCE nm
DISTANCE nmH DISTANCE FOR CE cf AIRCRAFT
0 ft2, X = 15077 nm
15077nm) t2, X = 16897
[ 47% ][6% ]
nm 60445

Total Fuel(including reserves)
Without AAR
AARBlock Fuel
500000
400000
300000
200000
100000
0
FUEL (lb)
Fig. 24 FUEL SAVED FOR FLYING 6000 nm, using AAR on 3000nm Aircraft, INCLUDING TANKER CHARACTERISTICS, 250 Pax
-60
-40
-20
0
20
40
60
0 2
RT
% Savin
3000 6000 9000 12000Range (nm)
4 6 8 10
-60
-40
-20
0
20
40
60
80
100
120
140
160
0 2 4 6 8 10
RT = Fuel Given / Tanker Fuel used
= Fuel Given / Tanker Fuel used
% GAIN IN PRE / Xg in Fuel
Fig. 25 TYPICAL CIVIL AAR TANKER OPERATING SCENARIO
Refuel Operations 3-4, 5-6, 7-8
Fig. 26 SAVING IN TOTAL FUEL CONSUMED
12000 9000 6000 nm
12
Fig. 27 % IMPROVEMENT IN PRE / X USING a 3000 nm AIRCRAFT WITH AAR,
VARIATION WITH TANKER FUEL OFF-LOAD
12000
9000
6000 nm
Using a 3000nm Aircraft

400,000 507,065 lb
507,065 507,065 lb507,065 507,065
lb
(a) (b)
(c)(b) (a) (d) (e) (f)
Pt A Curve
PRE/X
MTOW
35%
VARIATI
)
MTOW = 270,000 lb
MTOW = 507,065 lb
450,000
lb
Fig. 28 VARIATION OF WEIGHT WITH DIFFERENT REFUELLING OPTIONS ON B757-300, One Refuel, 47850 lb
250,000
230,00013
(c)
Pt D C
Ligh
B
With AAR
85%
270,000
270,000(d) (e)
urve
Z= R/ X
ter
A330-200 757-200
125% benefit
270,000
270,000(f)
Fig. 30 PRE/X – Z, CURRENT A & D POINT TRENDS (Fig.5) AND ON WITH DIFFERENT REFUELLING OPTIONS FOR A330-200 and B757-300
Note the Benefits with respect to PT A & Pt D Curves
Fig. 29 VARIATION OF WEIGHT WITH DIFFERENT REFUELLING OPTIONS ON A330-200, One Refuel, 113,730 lbRanges (1000nm)
Ranges (1000nm
TOW lb
TOW lb

14
Fig. 32 F/A-18 FORMATIONS, NASA
Fig. 31 DISPLAY FORMATION IN-FLIGHT REFUELLING
Lead Aircraft
Fig. 33 FORMATION,3 UNEQUAL SIZE AIRCRAFT
Second
FIRST TIME AROUND – WINGS ONLY
Third
SecondThird
dx
x
z y
dz
dy
GEOMETRY DEFINITIONS

(b) Cp Distributions, Euler & Panel Method
(c) 3-D Surfaces
(d) Mean Camber & Wing Surfaces
y
z
x
(a) Spanwise Distbns, Cm about xac
Fig. 34 CONVENTIONAL WING, DESIGNED, Mach 0.8, CL = 0.45
15
α = 1.0o CL = 0.58
α = 0.0o CL = 0.46
(c) Chordwise Cp Distbns at Start
(d) Chordwise Cp Distbns after 5 Cycles
Start
(b) Wing surface after 5 cycles
(a) Spanwise Loadings at Start & Final / Target
Fig. 35 2- Aircraft Formation, Typical CASE, RELAXED WAKE of LEAD AIRCRAFT delx/b = -1.45, dely/b = -10%, delz/b = 0%
Final &
Target
Start
Final &
Target
16

17
Mach Contours Cp Contours
Cp Contours Mach Contours
Fig. 36 3-AIRCRAFT V-FORMATION MACH & Cp CONTOURS ON UPPER
SURFACES, AT START
Fig. 37 3-AIRCRAFT V-FORMATION MACH & CP CONTOURS ON UPPER
SURFACES, AFTER CAMBER CONTROL
Technology Advances
UN
EvolutiDevelop
Fig. 39 WING TWIST REQUIRED TO CANCEL ROLL MOMENT ON TRAIL AIRCRAFT, LARGE LEAD
(2.5:1.0), AVERAGE OF RIGID and RELAXED WAKES, dx/b = 1.45, dy/b = +5%, dz/b = -5%
Final &
Target
Fig. 40 TRAIL AIR
VARIATION WITH SPEFFECT OF LEA
1.0 0.5 0.0 -0.5 -1.0 -1.5
Fig. 41 AEJUMPS, C
LEg
dy
Start
RESWEP
onary ment
CRAFMAGANWD AI
RODYOMB
Start
Final &
Target
18
Time
TURBOFANSTURBOJETS
SWEPTWINGS
TURBOPROPS CIROCATING ENGINES
T WINGS
Future Via Operations !
Revolutionary Breakthrough!
Evolutionary Development
T ∆∆∆∆CL and ∆∆∆∆CDi VECTOR NITUDE, ISE LOCATION, dz/b=-5%,RCRAFT SIZE, M=0.8
dy/b
GAP LAP
2.5 x
1.0 x
0.8 x
∆∆∆∆CL, ∆∆∆∆CDi, Vector addit60%
30%
NAMIC, PERFORMANCE TECHNOLOGY ADVANCES & STEP INING EVOLUTIONARY & REVOLUTIONARY DEVELOPMENTS
y/
Twist,
Fig. 38 LARGE AD (2.5:1.0), RIGID WAKE,Spanwise Loadin s at Start & Final / Target,
dx/b = 1.4, /b = +5%, dz/b = -5%
ion