Embed Size (px)
Citation preview

August 2012 1
Technical Report
Air Quality
1.0 Introduction
Motorized vehicles affect air quality by emitting airborne pollutants. Changes in traffic volumes, travel
patterns, and roadway locations affect air quality by changing the number of vehicles and the
congestion levels in a given area. The air quality impacts from the project are analyzed by addressing
criteria pollutants, a group of common air pollutants regulated by the U.S. Environmental Protection
Agency (EPA) on the basis of criteria (information on health and/or environmental effects of
pollution). A qualitative evaluation of Mobile Source Air Toxics (MSATs) has also been performed for
this project. The scope and methods of these analyses were developed in collaboration with the
Minnesota Pollution Control Agency (MPCA), Hennepin County, the Metropolitan Council, the
Minnesota Department of Transportation (MnDOT), and the Federal Highway Administration (FHWA).
1.1 Purpose of Report
This Air Quality Technical Report has been prepared in support of the Bottineau Transitway Project
Draft Environmental Impact Statement (Draft EIS). The objective of this report is to evaluate the
Project’s potential air quality impacts within the study area. This includes the following:
■ Evaluate the Project’s impact on regional air quality levels
■ Evaluate whether this Project would cause or contribute to a new localized exceedance of carbon
monoxide (CO) ambient air quality standards or increase the frequency or severity of any existing
exceedance
■ Evaluate the mobile source air toxic (MSAT) impacts of the Project
■ Evaluate the construction emissions of the Project
2.0 Technical Analysis
The nature of the air quality analysis is different from other types of environmental impacts. As such,
the organization of this report is slightly different from other technical reports. Section 2.4
Environmental Consequences addresses additional methodology for each criteria, where established.
It also outlines current status/condition for the criterion being evaluated.
2.1 Regulatory Context/Methodology
2.1.1 Legal and Regulatory Context
The air quality impacts from the project are analyzed by addressing criteria pollutants, a group of
common air pollutants regulated by the U.S. Environmental Protection Agency (EPA) on the basis of
criteria (information on health and/or environmental effects of pollution). The criteria pollutants
identified by the EPA are ozone, particulate matter, carbon monoxide, nitrogen dioxide, lead, and
sulfur dioxide. Potential impacts resulting from these pollutants are assessed by comparing projected
concentrations to National Ambient Air Quality Standards (NAAQS). In addition to the criteria air
pollutants, the EPA also regulates air toxics. There are seven compounds with significant

August 2012 2
contributions from mobile sources identified by the EPA: acrolein, benzene, 1,3-butadiene, diesel
particulate matter plus diesel exhaust organic gases (diesel PM), formaldehyde, naphthalene, and
polycyclic organic matter. The The Federal Transit Administration (FTA) does not provide guidance for
assessment of Mobile Source Air Toxics (MSAT) effects, but accepts the Federal Highway
Administration (FHWA) guidance for the assessment of MSAT effects for transportation projects in the
National Environmental Policy Act (NEPA) process.
2.1.2 Study Area
All roadway segments adjacent to and crossing the transitway alignments currently under
consideration were included in the evaluation of air quality impacts.
2.2 Affected Environment
Air quality is evaluated based on impacts to humans in theimpacted environment. Humans
experience air quality impacts by breathing unsafe concentrations of airborne pollutants. Exposure to
air pollutants emitted from motor vehicles can occur in homes, businesses, and recreation facilities
located adjacent to affected roadway segments or on pedestrian facilities along project-area
roadways.
2.3 Environmental Consequences
2.3.1 Operating Phase Impacts
No-Build Alternative
The No-Build alternative is not expected to result in any effects related to motor vehicle emissions.
Changes in air quality effects result from changes in traffic patterns and congestion levels on project
area roadways. As no changes to project area roadways are being considered under the No-Build
alternative, no meaningful air quality effects are expected. As discussed in the Build Alternatives
section, the Metropolitan Council has demonstrated regional conformity for carbon monoxide
emissions in the 2030 Transportation Policy Plan, and the EPA predicts that emissions of MSATs
would decrease dramatically by the design year of the Project. Therefore no adverse air quality
impacts are expected under the No-Build alternative.
Transportation System Management Alternative
The Transportation System Management (TSM) alternative does involve any change to the roadway
network compared to the No-Build alternative. Changes in air quality effects result from changes in
traffic patterns and congestion levels on project area roadways. As no changes to project area
roadways are being considered under the TSM alternative, no meaningful air quality effects are
expected. The TSM alternative is expected to result in increased transit ridership in the project area,
and no negative air quality effects are expected compared to the No-Build alternative.
Build Alternatives
NAAQS Criteria Pollutants
Ozone
Ground-level ozone is a primary constituent of smog and is a pollution problem throughout many
areas of the United States. Exposures to ozone can make people more susceptible to respiratory
infection, result in lung inflammation, and aggravate preexisting respiratory diseases such as asthma.
Ozone is not emitted directly from vehicles, but is formed as volatile organic compounds (VOCs) and
nitrogen oxides (NOx) react in the presence of sunlight. Transportation sources emit NOx and VOCs

August 2012 3
and can therefore affect ozone concentrations. However, due to the phenomenon of atmospheric
formation of ozone from chemical precursors, concentrations are not expected to be elevated near a
particular roadway.
The MPCA, in cooperation with various other agencies, industries, and groups, has encouraged
voluntary control measures for ozone and has begun developing a regional ozone modeling effort.
Ozone concentrations in the lower atmosphere are influenced by a complex relationship of precursor
concentrations, meteorological conditions, and regional influences on background concentrations.
MPCA staff has begun development of ozone modeling for the Twin Cities metropolitan area. The
MPCA has recently indicated that the ozone models currently use federal default traffic data and a
relatively coarse modeling grid. As such, ozone modeling in Minnesota is in its developmental stage,
and there is therefore no available method of determining the contribution of a single roadway to
regional ozone concentrations. Ozone levels in the Twin Cities metropolitan area currently meet state
and federal standards, and reductions in ozone levels have been observed between 2007 and 2010.
Additionally, the State of Minnesota is classified by the EPA as an "ozone attainment area," which
means that Minnesota has been identified as a geographic area that meets the national health-based
standards for ozone levels. Because of these factors, a quantitative ozone analysis was not
conducted for this project.
Particulate Matter
Particulate matter (PM) is the term for particles and liquid droplets suspended in the air. Particles
come in a wide variety of sizes and have been historically assessed based on size, typically measured
by the diameter of the particle in micrometers. PM2.5 or fine particulate matter refers to particles that
are 2.5 micrometers or less in diameter. PM10 refers to particulate matter that is 10 micrometers or
less in diameter.
Motor vehicles (i.e., cars, trucks, and buses) emit direct PM from their tailpipes, as well as from
normal brake and tire wear. Vehicle dust from paved and unpaved roads may be re-entrained, or re-
suspended, in the atmosphere. In addition, PM2.5 can be formed in the atmosphere from gases such
as sulfur dioxide, nitrogen oxides, and VOCs. PM2.5 can penetrate the human respiratory system's
natural defenses and damage the respiratory tract when inhaled. Numerous scientific studies have
linked particle pollution exposure to a variety of problems, including:
Increased respiratory symptoms (such as irritation of the airways, coughing, or difficulty
breathing)
Decreased lung function
Aggravated asthma
Development of chronic bronchitis
Irregular heartbeat
Nonfatal heart attacks
Premature death in people with heart or lung disease
Source: http://www.epa.gov/air/particlepollution/health.html
The EPA issued a final rule on October 17, 2006 that tightened the NAAQSs for PM2.5 to include a 24-
hour standard of 35 micrograms per cubic meter (µg/m3) and retained the 1997 annual PM2.5
standard of 15.0 µg/m3. The annual standard is based on a three-year average of annual mean PM2.5
concentrations; the 24-hour standard is based on a three-year average of the 98th percentile of 24-
hour concentrations. The NAAQS 24-hour standard for PM10 is 150 µg/m3, not to be exceeded more
August 2012 4
than once per year on average over three years. The following statement was published by the
Minnesota Pollution Control Agency in the Air Quality in Minnesota: 2011 Report to the Legislature:
EPA is reevaluating the particulate standards in response to scientists' better
understanding of the serious risks associated with breathing even low levels of fine
particles. In light of these potential health effects, EPA's new standards, expected in
2013, will likely be more stringent.
The Clean Air Act conformity requirements include the assessment of localized air quality impacts of
federally funded or federally approved transportation projects that are located withn PM2.5
nonattainment and maintenance areas and deemed to be projects of air quality concern. The entire
State of Minnesota has been designated as an unclassifiable/attainment area for PM. This means
that Minnesota has been identified as a geographic area that meets the national health-based
standards for PM levels, and therefore is exempt from performing PM qualitative hot-spot analyses.
Nitrogen Dioxide (Nitrogen Oxides)
Nitrogen oxides, or NOx, are the generic term for a group of highly reactive gases, all of which contain
nitrogen and oxygen in varying amounts. Nitrogen oxides form when fuel is burned at high
temperatures, as in a combustion process. The primary sources of NOx are motor vehicles, electric
utilities, and other industrial, commercial, and residential sources that burn fuels. The MPCA's Annual
Pollution Report to the Legislature: A Summary of Minnesota's Air Emissions and Water Discharges
(April 2011) indicates that:
On-road gasoline vehicles and diesel vehicles account for 40% of NOx emissions in
Minnesota. In addition to being a precursor to ozone, NOx can cause respiratory
irritation in sensitive individuals and can contribute to acid rain.
Nitrogen dioxide (NO2), which is a form of nitrogen oxide (NOx), is regularly monitored in the Twin
Cities metropolitan area. Currently, NO2 levels meet state and federal standards. Data presented in
the MPCA's 2010 Annual Air Monitoring Network Plan for the State of Minnesota, indicates that
The lowest annual average level of NO2 in the State of Minnesota for the study year
(2007) was 0.0054 ppm and the highest was 0.0093 ppm. These two
concentrations are approximately 10-20% of the National Ambient Air Quality
Standards' annual average standard for NO2 of 0.053 ppm. Therefore, Minnesota
currently meets applicable NAAQS for NO2; however, continued reductions are
sought, in light of the role of NO2 in forming other pollutants of concern.
The EPA's regulatory announcement, EPA420-F-99-051 (December 1999), describes the Tier 2
standards for tailpipe emissions, and states:
The new tailpipe standards are set at an average standard of 0.07 grams per mile
for nitrogen oxides for all classes of passenger vehicles beginning in 2004. This
includes all light-duty trucks, as well as the largest SUVs. Vehicles weighing less than
6000 pounds will be phased-in to this standard between 2004 and 2007.
As newer, cleaner cars enter the national fleet, the new tailpipe standards will
significantly reduce emissions of nitrogen oxides from vehicles by about 74 percent
by 2030. The standards also will reduce emissions by more than 2 million tons per
year by 2020 and nearly 3 million tons annually by 2030.

August 2012 5
Within the project area, it is unlikely that NO2 standards would be approached or exceeded based on
the relatively low ambient concentrations of NO2 in Minnesota and on the long-term trend toward
reduction of NOx emissions. Because of these factors, a specific analysis of NO2 was not conducted
for this project.
Sulfur Dioxide
Sulfur dioxide (S02) and other sulfur oxide gases (SOx) are formed when fuel containing sulfur, such
as coal, oil, and diesel fuel is burned. Sulfur dioxide is a heavy, pungent, colorless gas. Elevated levels
can impair breathing, lead to other respiratory symptoms, and at very high levels aggravate heart
disease. People with asthma are most at risk when SO2 levels increase. Once emitted into the
atmosphere, SO2 can be further oxidized to sulfuric acid, a component of acid rain.
The MPCA's Annual Pollution Report to the Legislature: A Summary of Minnesota's Air Emissions and
Water Discharges (April 2011) indicates that on-road mobile sources account for just 14 percent of
SO2 emissions in Minnesota. Over 53 percent of SO2 released into the air comes from electric
utilities, especially those that burn coal. MPCA monitoring shows that ambient SO2 concentrations are
consistently below federal standards. The MPCA has concluded that long-term trends in both ambient
air concentrations and total SO2 emissions in Minnesota indicate steady improvement.
Emissions of sulfur oxides from transportation sources are a small component of overall emissions
and continue to decline due to the desulphurization of fuels. Additionally, the State of Minnesota is
classified by the EPA as a "sulfur dioxide attainment area," which means that Minnesota has been
identified as a geographic area that meets the national health-based standards for sulfur dioxide
levels. Because of these factors, a quantitative analysis for sulfur dioxide was not conducted for this
project.
Lead
Due to the phase out of leaded gasoline, lead is no longer a pollutant associated with vehicular
emissions, and no analysis is warranted. No localized emissions of lead are associated with light rail
transit operations.
Carbon Monoxide
Carbon monoxide (CO) is a traffic-related pollutant that has been of concern in the Twin Cities
Metropolitan area. In 1999, the EPA redesignated all of Hennepin, Ramsey, Anoka, and portions of
Carver, Scott, Dakota, Washington, and Wright counties as a maintenance area for CO. This means
the area was previously classified as a nonattainment, area but was found to be in attainment, and is
now classified as a maintenance area. Maintenance areas are required to undertake actions to
demonstrate continuing compliance with CO standards. Since the Bottineau Transitway is located in
Heepin County, evaluation of CO for assessment of air quality impacts is required for environmental
approval in NEPA documents.
Air Quality Conformity
The 1990 Clean Air Act Amendments (CAAA) require that State Implementation Plans (SIPs) must
demonstrate how states with nonattainment and maintenance areas will meet federal air quality
standards.
The EPA issued final rules on transportation conformity (40 CFR 93, Subpart A), which describe the
methods required to demonstrate SIP compliance for transportation projects. It requires that
transportation projects must be part of a conforming Long Range Transportation Policy Plan (LRTPP)
and four-year Transportation Improvement Program (TIP). The Bottineau Transitway is part of the
2030 Transitway System shown in Metropolitan Council’s 2030 Transportation Policy Plan (TPP)

August 2012 6
(Figure 7-43, November 10, 2010). The proposed project is not included in the 2012-2015
Transportation Improvement Program (September 28, 2011) because it is not scheduled to be
constructed until after year 2015. The TPP was found to be in conformity by FHWA on February 23,
2011. (The FHWA acts as the executive agent for the Federal Transit Administration (FTA) for
purposes of determining conformity of metropolitan transportation plans.)
In addition to conformity analysis performed as part of the 2030 Transportation Policy Plan,
expansion of transit services is also discussed as a means of improving regional air quality. Chapter
7: Transit references changing Federal policies that lead to coordinated investments in housing and
transit service that can improve air quality through fewer vehicle miles traveled in private cars.
Appendix F: Clean Air Act Conformance includes “Public Transit Strategies” in the list of “Timely
Implementation of Transportation Control Measures.” In sum, the proposed transitway improvements
are consistent with the Metropolitan Council’s goal of improving regional air quality.
On November 8, 2010, the EPA approved arequest for a limited maintenance plan for the Twin Cities
maintenance area. Under a limited maintenance plan, the EPA has determined that there is no
requirement to estimate projected emissions over the maintenance period and that "an emission
budget may be treated as essentially not constraining for the length of the maintenance period. The
reason is that it is unreasonable to expect that the maintenance area will experience so much growth
within this period that a violation of CO National Ambient Air Quality Standard (NAAQS) would result."
(US EPA Limited Maintenance Plan Option for Nonclassifiable CO Nonattainment Areas, October 6,
1995) Therefore, no regional modeling analysis for the LRTPP and TIP is required; however federally
funded and state funded projects are still subject to "hot spot" analysis requirements. The limited
maintenance plan adopted in 2010 determines that the level of CO emissions and resulting ambient
concentrations will continue to demonstrate attainment of the CO NAAQS. In concordance, no
regional emissions modeling was completed as part of the evaluation of the current project; however
hot spot analysis has been completed, as required.
Conformity Analysis
The effects of the proposed project on air quality were examined through analysis of the predicted
impacts on CO concentrations. The following section discusses the CO analysis modeling methods
and results.
To assess CO concentration changes, background concentrations were measured and adjusted for
future background traffic growth and changes in vehicle emissions. Potential CO impacts on air
quality were analyzed with respect to intersection conditions for the proposed project. Forecast year
2030 traffic was used to model future CO concentrations as the worst-case conditions. The analysis
methods and procedures and the scope of this analysis were developed in collaboration with MPCA.
Air quality modeling was performed using current versions of EPA CO emission (MOBILE 6.2) and
dispersion modeling (CAL3QHC) software. All methods and procedures used in the air quality
analyses are generally accepted by the EPA and MPCA as approved for industry-standard analytical
methods. The modeling assumptions used in this analysis included the following:
Speed Class: Arterial, posted speed limits
Traffic Mix: National Default
Traffic Age Distribution: MPCA Data
Wind Speed: 1 meter/second
Temperature: -8.8 degrees Celsius
Wind Direction: 36 directions at 10 degree increments
August 2012 7
Surface Roughness: 108 centimeters
Atmospheric Stability Class: D
8-Hour Persistence Factor: 0.7
Fuel Program: Conventional Gasoline East
Fuel Reid Vapor Pressure: 9.0 lbs/square inch
Oxygenated Fuels: Ethanol with 2.7 percent oxygen content
The CO emissions factors were produced by the MOBILE6.2 emission model at varying speeds for
year 2030 conditions (see Appendix A).
Intersection Carbon Monoxide Analysis
Carbon monoxide concentrations were calculated for five intersections in the project area: one
representing the worst-case condition along each of the alignments under consideration. These
locations were identified from the Bottineau Transitway Traffic Evaluation Technical Report (Kimley-
Horn and Associates, 2012) as the intersections with the highest traffic volumes and poorest levels of
service and are expected to result in the worst-case CO concentrations. The rationale for this
approach is to evaluate whether any of the proposed alignments might be expected to result in
Carbon Monoxide concentrations exceeding NAAQS allowable limits. This methodology was
developed based on input from MPCA and Hennepin County. The intersections selected for
evaluation include:
Alignment A: CSAH 81 & CSAH 130 (Brooklyn Boulevard)
Alignment B: CSAH 103 (Broadway Avenue) & CSAH 130 (Brooklyn Boulevard)
Alignment C: CSAH 81 & CSAH 10 (Bass Lake Road)
Alignment D1: TH 55 & CSAH 2 (Penn Ave)
Alignment D2: CSAH 81 & CSAH 2 (Penn Ave)
Carbon monoxide concentrations near the intersections were estimated using forecast traffic
volumes, proposed intersection geometrics, optimized signal timing, emission levels from the EPA
MOBILE 6.2 model, and dispersion modeling using the EPA model CAL3QHC. Schematics and peak-
hour turning movements for each of the intersection models are provided in Appendix B.
Background Carbon Monoxide Concentrations
Background CO concentrations are needed for air quality analysis purposes to represent conditions
without the influence of nearby vehicles. By definition, the background CO concentration in any
particular area is that concentration which exists independently of direct contributions from nearby
traffic. The background concentrations are added to intersection-scale modeled results to yield
predicted CO levels.
Background CO concentrations for the analysis documented in this study were obtained from CO
monitoring conducted by MnDOT near Grove Academy in St. Louis Park from February 17 to March 4,
2011 (approximately three miles from the project area). The maximum one-hour and eight-hour
concentrations are given in Table 1. The maximum one-hour concentration during this period was
0.56 ppm and the maximum eight-hour concentration was 0.49 ppm, both observed on March 3,
2011. Since March is the beginning of meteorological spring, the Holzworth Correction Factor was
applied to estimate the worst-case (winter) concentration. Background concentrations were also
adjusted for future year 2030 conditions to account for background traffic growth. The traffic growth
at each of the selected intersections was computed. The highest growth factor between 2011 and
2030 is expected at the intersection of CSAH 81 & CSAH 130 (Brooklyn Boulevard), and is 1.3. To

August 2012 8
represent worst-case conditions, no background reduction factor to account for future emissions-
control improvements was used, which likely results in overestimations of ambient background CO
concentrations. Results of background CO monitoring and the adjustment calculations are presented
in Table 1.
Table 1. Background Carbon Monoxide Concentrations
Grove Academy, St. Louis Park, MN 1-Hour 8-Hour
March 2011 maximum concentrations1 0.56 0.49
Holzworth Correction Factor (Spring) 1.53 1.53
2011 background CO concentration (ppm) 0.86 0.75
Background traffic growth – 2011 to 2030 1.3 1.3
Adjusted background CO concentration (ppm) - 2030 1.12 0.98
Evaluation Results
The intersection CO modeling results are shown in Table 2. These results are the worst-case results
from the CAL3QHC dispersion model, showing the location of the highest expected concentration, the
value of the highest one-hour and eight-hour concentrations, and the wind angle that produced these
concentrations. The CO results provided represent background CO concentrations plus modeled
intersection CO concentrations. The worst-case was identified at the intersection of CSAH 81 and
CSAH 130 (Brooklyn Boulevard).
Table 2. Carbon Monoxide Modeling Results (Listed in parts-per-million (ppm))
Highest CO
Receptor Location
1-Hour Average
Concentration
8-Hour Average
Concentration Wind Direction
Alignment A: CSAH 81 & CSAH 130 (Brooklyn Boulevard)
SE Quadrant 2.52 1.96 310° Alignment B: CSAH 103 (Broadway Avenue) & CSAH 130 (Brooklyn Boulevard)
SW Quadrant 2.12 1.68 300° Alignment C: CSAH 81 & CSAH 10 (Bass Lake Road)
NW Quadrant 2.22 1.75 110° Alignment D1: TH 55 & CSAH 2 (Penn Ave)
SW Quadrant 2.42 1.89 70° Alignment D2: CSAH 81 & CSAH 2 (Penn Ave)
NW Quadrant 1.52 1.26 170°
Discussion and Conclusions
Intersection-level CO modeling was performed for the worst operating intersection under worst-case
conditions. The highest predicted concentrations are expected to occur near the intersection of CSAH
81 & CSAH 130 (Brooklyn Boulevard), with one-hour and eight-hour of concentrations of 2.52 and
1.96 ppm, respectively. Based on these results, concentrations of CO in the project areas would not
exceed the federal one-hour standard of 35 ppm, the Minnesota one-hour standard of 30 ppm, and
the federal eight-hour standard of 9 ppm.
1 Source: MnDOT Background Carbon Monoxide Monitoring Report, February 17 through March 4, 2011
August 2012 9
These CO modeling results show that the Bottienau Trnasitway Project is not expected to cause CO
concentrations exceeding state or federal standards. Based on the qualitative assessment presented
at the beginning of this section, the Project would not cause exceedances of the other criteria
pollutants.
Mobile Source Air Toxics
FHWA provides guidance on evaluation of MSATs for highway projects as part of the NEPA process.
This guidance was used to complete this evaluation. The following section summarizes the key
elements of the FHWA guidance, the entirety of which is available online at: http://www.fhwa.dot.gov/environment/air_quality/air_toxics/policy_and_guidance/100109guidmem.cfm According to the FHWA guidance, a qualitative evaluation of MSAT impacts has been completed for
the Bottineau Transitway Project.
Summary of MSAT Information
Controlling air toxic emissions became a national priority with the passage of the Clean Air Act
Amendments (CAAA) of 1990, whereby Congress mandated that the EPA regulate 188 air toxics, also
known as hazardous air pollutants. The EPA has assessed this list in their latest rule on the Control of
Hazardous Air Pollutants from Mobile Sources (Federal Register, Vol. 72, No. 37, page 8430,
February 26, 2007) and identified a group of 93 compounds emitted from mobile sources that are
listed in their Integrated Risk Information System (IRIS) (http://www.epa.gov/ncea/iris/index.html).
In addition, EPA identified seven compounds with significant contributions from mobile sources that
are among the national and regional-scale cancer risk drivers from their 1999 National Air Toxics
Assessment (NATA) (http://www.epa.gov/ttn/atw/nata1999). These are acrolein, benzene, 1,3-
butadiene, diesel particulate matter plus diesel exhaust organic gases (diesel PM), formaldehyde,
naphthalene, and polycyclic organic matter. While FHWA considers these the priority mobile source
air toxics, the list is subject to change and may be adjusted in consideration of future EPA rules.
The 2007 EPA rule further requires controls that would dramatically decrease Mobile Source Air
Toxics (MSAT) emissions through cleaner fuels and cleaner engines. According to an FHWA analysis
using EPA's MOBILE6.2 model, even if vehicle activity (vehicle-miles traveled, VMT) increases by 145
percent as assumed, a combined reduction of 72 percent in the total annual emission rate for the
priority MSATs is projected from 1999 to 2050, as shown in Figure 1.

August 2012 10
Figure 1: National MSAT Emission Trends 1999 - 2050 for Vehicles Operating On Roadways Using
EPA's MOBILE 6.2 Model
Notes:
(1) Annual emissions of polycyclic organic matter are projected to be 561 tons/yr for 1999, decreasing to 373 tons/yr
for 2050.
(2) Trends for specific locations may be different, depending on locally derived information on vehicle-miles travelled,
vehicle speeds, vehicle mix, fuels, emission control programs, meteorology, and other factors.
Source: U.S. Environmental Protection Agency. MOBILE6.2 model run 20 August 2009.
Air toxics analysis is a continuing area of research. While much work has been done to assess the
overall health risk of air toxics, many questions remain unanswered. In particular, the tools and
techniques for assessing project-specific health outcomes as a result of lifetime MSAT exposure
remain limited. These limitations impede the ability to evaluate how the potential health risks posed
by MSAT exposure should be factored into project-level decision-making within the context of NEPA.
Information is incomplete or unavailable to credibly predict project-specific health impacts due to
changes in MSAT emissions associated with a proposed set of transportation alternatives. The
FHWA, EPA, the Health Effects Institute, and others have funded and conducted research studies to
try to more clearly define potential risks from MSAT emissions associated with transportation
projects. However, available technical tools do not enable us to predict the project-specific health
impacts of MSAT emissions.
The methodologies for forecasting health impacts include emissions modeling, dispersion modeling,
exposure modeling, and then final determination of health impacts – with each step in the process
building on the model predictions obtained in the previous step. All are encumbered by technical
shortcomings or uncertain science that prevent a more complete differentiation of the MSAT health
impacts among a set of project alternatives. These difficulties are magnified for lifetime (i.e., 70 year)
assessments, particularly because unsupportable assumptions would have to be made regarding
changes in travel patterns and vehicle technology (which affects emissions rates) over that time
frame, since such information is unavailable.

August 2012 11
There is also a lack of a national consensus on an acceptable level of risk. The process used by the
EPA as provided by the Clean Air Act is to determine whether more stringent controls are required to
1) provide an ample margin of safety to protect public health, or, 2) prevent an adverse
environmental effect.
Because of the limitations in the methodologies for forecasting health impacts described, any
predicted difference in health impacts between alternatives is likely to be much smaller than the
uncertainties associated with predicting the impacts. Consequently, the results of such assessments
would not be useful to decision makers, who would need to weigh this information against project
benefits, such as reducing traffic congestion, accident rates, and fatalities plus improved access for
emergency response, that are better suited for quantitative analysis.
Qualitative MSAT Analysis
For each alternative in this technical report, the amount of MSAT emitted would be proportional to the
average daily traffic (ADT), assuming that other variables, such as fleet mix, are the same for each
alternative. All of the Build alternatives are expected to serve approximately 26,000 transit trips by
year 2030. Current air quality levels are considered acceptable and are expected to remain at
acceptable levels under the Build alternatives. Changes in ADT between alternatives differ among
the various alignments. Each alignment is evaluated individually and discussed below.
Alignment A
The proposed operations of the Bottineau Transitway along Alignment A is not expected to have a
significant impact on vehicular traffic. The transitway would be largely separated from the adjacent
roadways of CSAH 81 and CSAH 130 (Elm Creek Boulevard). As a result, the ADT estimated for the A-
C-D1 and A-C-D2 Build Alternatives does not differ from that for the No Build Alternative. Since ADT
does not differ, no changes in MSAT emissions for the Build Alternatives along the corridor are
expected.
The realigned travel lanes contemplated as part of Alignment A would have the effect of moving some
traffic closer to nearby homes, schools, and businesses; therefore, under the Build Alternative there
may be localized areas where ambient concentrations of MSAT could be higher under the Build
Alternative than the No Build Alternative. The localized increases in MSAT concentrations would likely
be most pronounced along the expanded roadway sections that would be built along CSAH 130 (Elm
Creek Boulevard) between Northland Drive and CSAH 81. However, the magnitude and the duration
of these potential increases compared to the No-Build alternative cannot be reliably quantified due to
incomplete or unavailable information in forecasting project-specific MSAT health impacts.
Alignment B
The ADT estimated for the B-C-D1 and B-C-D2 Build Alternative along Alignment B is not expected to
change compared to the No Build Alternative. It is possible that the presence of the transitway along
CSAH 103 (Broadway Avenue) would be expected to impact the efficiency of the roadway and result in
longer queues at intersections and more idling vehicles. This would lead to higher MSAT emissions
for the Build Alternatives along Alignment B because lower speeds are associated with higher MSAT
emission rates; according to EPA's MOBILE6.2 model, emissions of all of the priority MSAT except for
diesel particulate matter increase as speed decreases. The extent of these speed-related emissions
increases cannot be reliably projected due to the inherent deficiencies of technical models.
The realigned travel lanes contemplated as part of Alignment B would have the effect of moving some
traffic closer to nearby homes, schools, and businesses; therefore, under the Build Alternatives with a
B-Alignment there may be localized areas where ambient concentrations of MSAT could be higher
under the Build Alternative than the No Build Alternative. The localized increases in MSAT

August 2012 12
concentrations would likely be most pronounced along the expanded roadway sections that would be
built along CSAH 103 (Broadway Avenue) between Oak Grove Parkway and 75th Avenue. However,
the magnitude and the duration of these potential increases compared to the No-Build alternative
cannot be reliably quantified due to incomplete or unavailable information in forecasting project-
specific MSAT health impacts.
Alignment C
The ADT estimated along Alignment C (all Build alternatives) is not expected to change compared to
the No Build Alternative. It is possible that the presence of the transitway along CSAH 81 would be
expected to impact the efficiency of the roadway and result in longer queues at intersections and
more idling vehicles. This would lead to higher MSAT emissions for the Build Alternatives along
Alignment C because lower speeds are associated with higher MSAT emission rates; according to
EPA's MOBILE6.2 model, emissions of all of the priority MSAT except for diesel particulate matter
increase as speed decreases. The extent of these speed-related emissions increases cannot be
reliably projected due to the inherent deficiencies of technical models.
Alignment D
Changes in ADT are not a relevant measure for the segments of Alignment D1 passing near Theodore
Wirth Park. This is because the Bottineau Transitway would operate on exclusive right of way with
little or no impact to vehicular traffic. As a result, no changes in MSAT emissions would be expected
for the Build Alternative with a D1 alignment (A or B – C- D1) compared to the No Build Alternative.
Alignment D2
The ADT estimated for the Build Alternatives along Alignment D2 is not expected to change compared
to the No Build Alternative. It is possible that the presence of the transitway along 34th Avenue, CSAH
81, and CSAH 2 (Penn Ave) would be expected to impact the efficiency of the roadway and result in
longer queues at intersections and more idling vehicles. This would lead to higher MSAT emissions
for the Build Alternative along Alignment D2 because lower speeds are associated with higher MSAT
emission rates; according to EPA's MOBILE6.2 model, emissions of all of the priority MSAT except for
diesel particulate matter increase as speed decreases. The extent of these speed-related emissions
increases cannot be reliably projected due to the inherent deficiencies of technical models.
The realigned travel lanes contemplated as part of the project alternatives would have the effect of
moving some traffic closer to nearby homes, schools, and businesses; therefore, under the Build
Alternative utilizing Alignment D2 there may be localized areas where ambient concentrations of
MSAT could be higher than the No Build Alternative. The localized increases in MSAT concentrations
would likely be most pronounced along the expanded roadway sections that would be built along
34th Avenue, CSAH 81, and CSAH 2 (Penn Ave) between the 34th Avenue railroad crossing and TH
55 (Olson Memorial Highway). However, the magnitude and the duration of these potential increases
compared to the No-Build alternative cannot be reliably quantified due to incomplete or unavailable
information in forecasting project-specific MSAT health impacts. Also, MSAT would be lower in other
locations when traffic shifts away from them.
Alignment D Common Section
The ADT estimated for the Build Alternatives along the alignment D common section is not expected
to change compared to the No Build Alternative. It is possible that the presence of the transitway
along TH 55 would be expected to impact the efficiency of the roadway and result in longer queues at
intersections and more idling vehicles. This would lead to higher MSAT emissions for the Build
Alternative along the Alignment D Common Section because lower speeds are associated with higher
MSAT emission rates; according to EPA's MOBILE6.2 model, emissions of all of the priority MSAT

August 2012 13
except for diesel particulate matter increase as speed decreases. The extent of these speed-related
emissions increases cannot be reliably projected due to the inherent deficiencies of technical models.
All Alternatives
Under each of the proposed alternatives (No-Build, TSM and Build alternatives) emissions would likely
be lower than present levels in the design year as a result of EPA's national control programs that are
projected to reduce annual MSAT emissions by 72 percent between 1999 and 2050. On a regional
basis, EPA's vehicle and fuel regulations, coupled with fleet turnover, will over time cause substantial
reductions that, in almost all cases, will cause region-wide MSAT levels to be significantly lower than
today. The magnitude of the EPA-projected reductions is so great (even after accounting for traffic
growth) that MSAT emissions in the study area are likely to be lower in the under a wide variety of
future conditions.
2.3.2 Construction Phase Impacts
No-Build Alternative
No air quality impacts are associated with construction under the No-Build alternative.
Transportation System Management Alternative
Construction activities under the Transportation System Management Alternative are limited to the
development of a transit center at 97th Avenue. Construction activities under the TSM alternative
could result in higher concentrations of air pollutants. Construction equipment powered by fossil fuels
emit the same air pollutants as highway vehicles. Exposed earthen materials can also produce
increased particulate matter when they are moved or disturbed by wind. It is not expected that
concentrations of these air pollutants would exceed any state or Federal standards.
Build Alternatives
The construction of each of the alignments under consideration would affect traffic volumes and
operations along roadways in and around the project area. During construction, some intersections
may need to temporarily operate with reduced capacities, or be be temporarily closed. Under these
conditions, traffic would be expected to detour to parallel roadway facilities near the project area.
This increased traffic may result in increased emissions and higher concentrations of air pollutants
near homes and businesses. These emissions levels would not be expected to result in localized
concentrations that would exceed any state or Federal air quality standards.
In addition to traffic-related emissions increases, construction activities can also result in higher
concentrations of air pollutants. Construction equipment powered by fossil fuels emit the same air
pollutants as highway vehicles. Exposed earthen materials can also produce increased particulate
matter when they are moved or disturbed by wind. It is not expected that concentrations of these air
pollutants would exceed any state or Federal standards, in part due to the Best Management
Practices described in Section 2.5.
2.3.3 Indirect/Secondary Impacts
No indirect or secondary impacts are associated with air quality for the proposed project.
2.4 Avoidance, Minimization, and/or Mitigation Measures
The analysis presented in this document demonstrates there will be no anticipated exceedances of
air pollutant concentrations either during the operating phase of the proposed project; therefore, no
mitigation measures are necessary. The State of Minnesota does not require permits related to air
quality for projects of this type.

August 2012 14
This analysis also demonstrates that there will be no anticipated exceedances under the construction
phase. However, a series of Best Management Practices (BMPs) would be implemented during
construction to control dust. This may include the following preventive and mitigative measures:
■ Minimization of land disturbance during site preparation
■ Use of watering trucks to minimize dust
■ Covering of trucks while hauling soil/debris off-site or transferring materials
■ Stabilization of dirt piles if they are not removed immediately
■ Use of dust suppressants on unpaved areas
■ Minimization of unnecessary vehicle and machinery idling
■ Revegetation of any disturbed land post-construction
Traffic control measures would be developed in subsequent stages of the project to address detours
and flow of traffic.
3.0 Summary
The following table summarizes the general air quality impacts of the Build alternatives proposed for
the Bottineau Transitway project. This table is meant to give a snapshot of the types of impacts that
may be anticipated, and will be combined with other impact categories and provided as a full table in
the Draft Environmental Impact Statement (Draft EIS). Full analysis by alternative is provided in the
body of this report. It is not anticipated that adverse air quality impacts would result from the No-
Build or Transportation System Management (TSM) alternatives.
Table S-1. Summary of Impacts and Mitigation Measures
Impact Category Impacts of Build Alternatives Avoidance, Minimization, and/or
Mitigation Measures
Operating Phase
Air Quality – Carbon
Monoxide (CO) Hot Spot
Analysis
None of the alternatives under
consideration would be expected to
result in carbon monoxide
concentrations exceeding state or
Federal Standards.
None required.
Operating Phase
Air Quality – Mobile
Source Air Toxics (MSAT)
Analysis
While there may be localized areas
where MSAT emissions would
increase, Environmental Protection
Agency (EPA) vehicle and fuel
regulations, coupled with fleet
turnover, would result in substantial
reductions that, over time,would
result in significantly lower region-
wide MSAT than those found today.
None required.

August 2012 15
Impact Category Impacts of Build Alternatives Avoidance, Minimization, and/or
Mitigation Measures
Construction Impacts of
Build Alternatives on Air
Quality
Construction of the proposed
Bottineau Transitway may also
cause increased concentrations of
dust and air pollutants. When roads
are closed or operating with
reduced capacity, detoured traffic
would result in increased traffic on
parallel roadways near the project
area. Increased emissions would
also be produced by construction
equipment and particulate matter
can enter the air from exposed
earthen materials. However, it is
expected that ambient
concentrations of increased air
pollutants would remain below state
and Federal standards.
Best Management Practices (BMPs)
would be implemented during
construction to control dust and
manage equipment. Traffic control
measures would be developed in
subsequent stages of the project to
address detours and flow of traffic.
August 2012 16
APPENDIX A CO Emissions Factors

August 2012 17
TABLE A-1: MOBILE6.2 Year 2030 Carbon Monoxide Emissions Factors
Speed Emissions (g/mi)
Idle 80.8
2.5 32.3
3 28.7
4 24.2
5 21.5
10 16.0
15 14.2
20 13.3
25 12.8
30 12.5
35 12.6
40 12.9
45 13.3
50 13.8
55 14.2
60 14.6
65 15.1

August 2012 18
APPENDIX B CAL3QHC Schematics and Traffic Inputs
August 2012 19
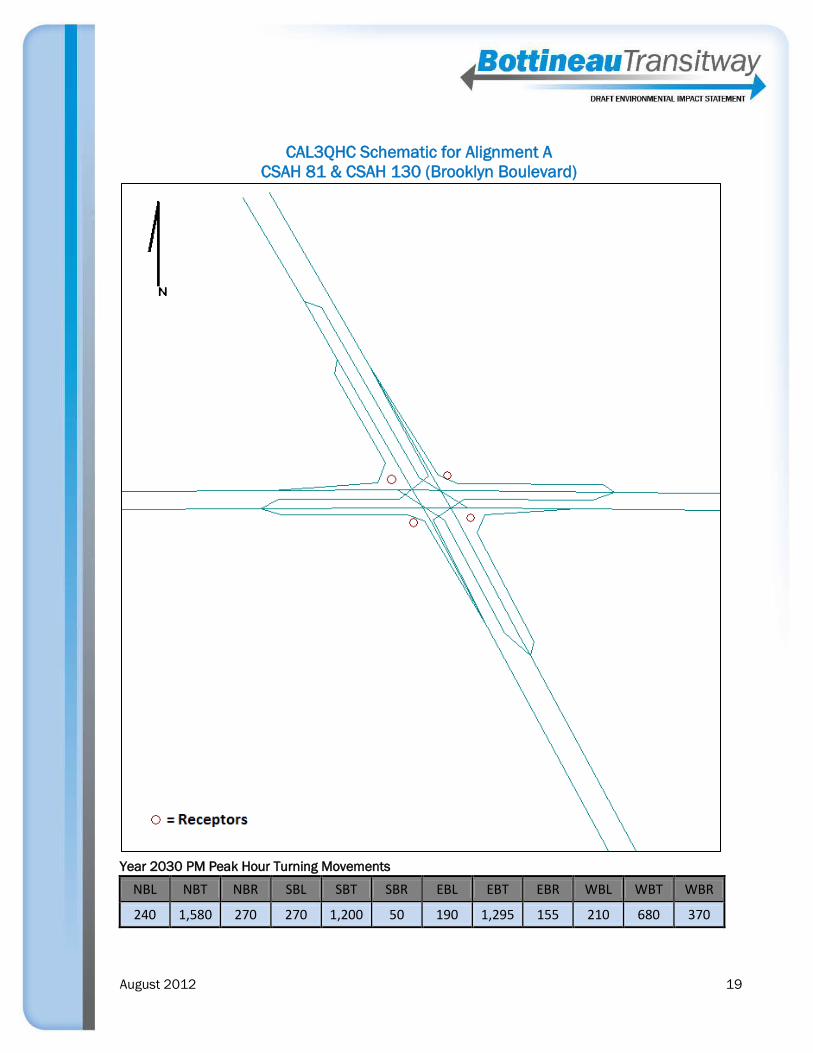
CAL3QHC Schematic for Alignment A
CSAH 81 & CSAH 130 (Brooklyn Boulevard)
Year 2030 PM Peak Hour Turning Movements
NBL NBT NBR SBL SBT SBR EBL EBT EBR WBL WBT WBR
240 1,580 270 270 1,200 50 190 1,295 155 210 680 370
August 2012 20
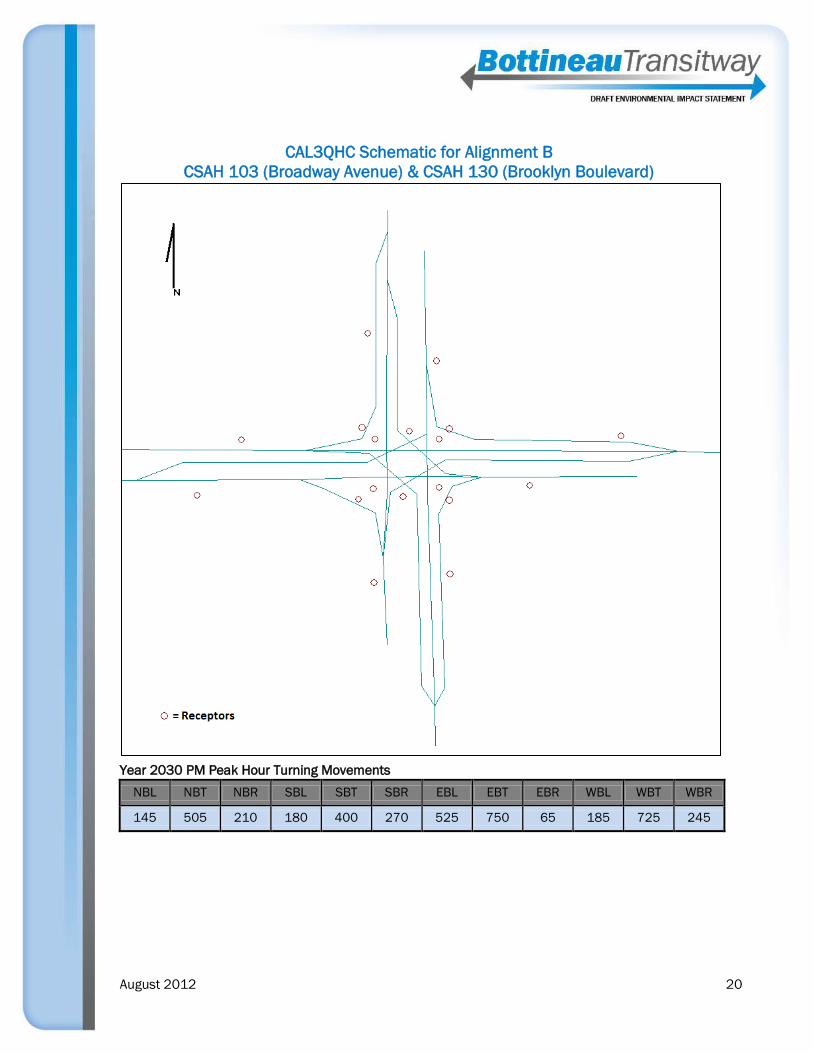
CAL3QHC Schematic for Alignment B
CSAH 103 (Broadway Avenue) & CSAH 130 (Brooklyn Boulevard)
Year 2030 PM Peak Hour Turning Movements
NBL NBT NBR SBL SBT SBR EBL EBT EBR WBL WBT WBR
145 505 210 180 400 270 525 750 65 185 725 245

August 2012 21
CAL3QHC Schematic for Alignment C
CSAH 81 & CSAH 10 (Bass Lake Road)
Year 2030 PM Peak Hour Turning Movements
NBL NBT NBR SBL SBT SBR EBL EBT EBR WBL WBT WBR
351 1146 178 145 661 298 581 981 319 115 789 169

August 2012 22
CAL3QHC Schematic for Alignment D1
TH 55 & CSAH 2 (Penn Avenue)
Year 2030 PM Peak Hour Turning Movements
NBL NBT NBR SBL SBT SBR EBL EBT EBR WBL WBT WBR
32 409 57 92 216 139 212 1462 71 245 1614 121

August 2012 23
CAL3QHC Schematic for Alignment D2
CSAH 81 & CSAH 2 (Penn Ave)
Year 2030 PM Peak Hour Turning Movements
NBL NBT NBR SBL SBT SBR EBL EBT EBR WBL WBT WBR
118 420 54 117 272 17 0 390 113 110 552 133