Embed Size (px)
Citation preview
Air quality at Heathrow Airport
Q2 2013
Headlines Key information for air quality monitoring data is:
• Annual average NO2 concentrations in 2012 were below the EU limit value except for Oxford Avenue and the Hillingdon M4 sites (see Fig. 1).
• Running annual mean for NO2 fell at most monitoring sites in Q2 2013 (see Fig. 2).
• Annual average PM10 and PM2.5 concentrations were below the EU limit and target values respectively in 2012.
• There were three breaches of the daily average PM10 limit value in Q1 and Q2 2013 (see Fig 3). 35 exceedances are allowed per year before the limit value is breached.
• Highest ever number aircraft movements were made by more modern CAEP4 or CAEP6 models to Q2 2012 - over 91% (see Fig. 5).
• Heathrow finalising plans to replace all of its air quality monitors in 2013.
• Heathrow finalising its update of the AirWatch website in 2013.
Background Heathrow Airport Ltd (HAL) has monitored air quality since the 1990s at its site located near the northern runway (LHR2). It now monitors air quality at three other sites around the airport – Harlington, Green Gates and Oaks Road (see Fig. 4 for locations of these and other air quality monitoring sites within 2km of Heathrow Airport). We are aiming to replace all thirteen air quality monitors in 2013.
Large areas of London exceed the health-based air quality limit values set by the EU, due primarily to emissions from road traffic and from buildings. Every London borough has declared at least one Air Quality Management Area (AQMA).
Air quality management is a key priority for HAL and we will continue to work in partnership with our key stakeholders – especially local authorities and national government - to reduce emissions from all sources in the area in order to meet the EU limit values. The main pollutants of concern at Heathrow are measured at all these sites – oxides of nitrogen (NOX – made up of nitrogen dioxide and nitrous oxide) and particles (measured as PM10 and PM2.5). In addition, ozone (O3) is measured at Harlington.
Measured concentrations
Local air quality
Located on the western edge of London and close to two busy motorways, the Great Western mainline and local industries, Heathrow Airport is within an area of high air pollution.
Of the two pollutants of concern - nitrogen dioxide (NO2) and particles (measured as PM10 and PM2.5) - NO2 has the greatest extent of exceedence and large areas of London (and the rest of the UK) exceed the annual average EU limit value, due mainly to emissions
Page 2 of 9
from road traffic and from buildings. This pattern is repeated locally, where the activities that take place at Heathrow Airport are just one source of air emissions in the local area.
Nitrogen dioxide (NO2 - annual average limit value 40µg/m3 by 2010)
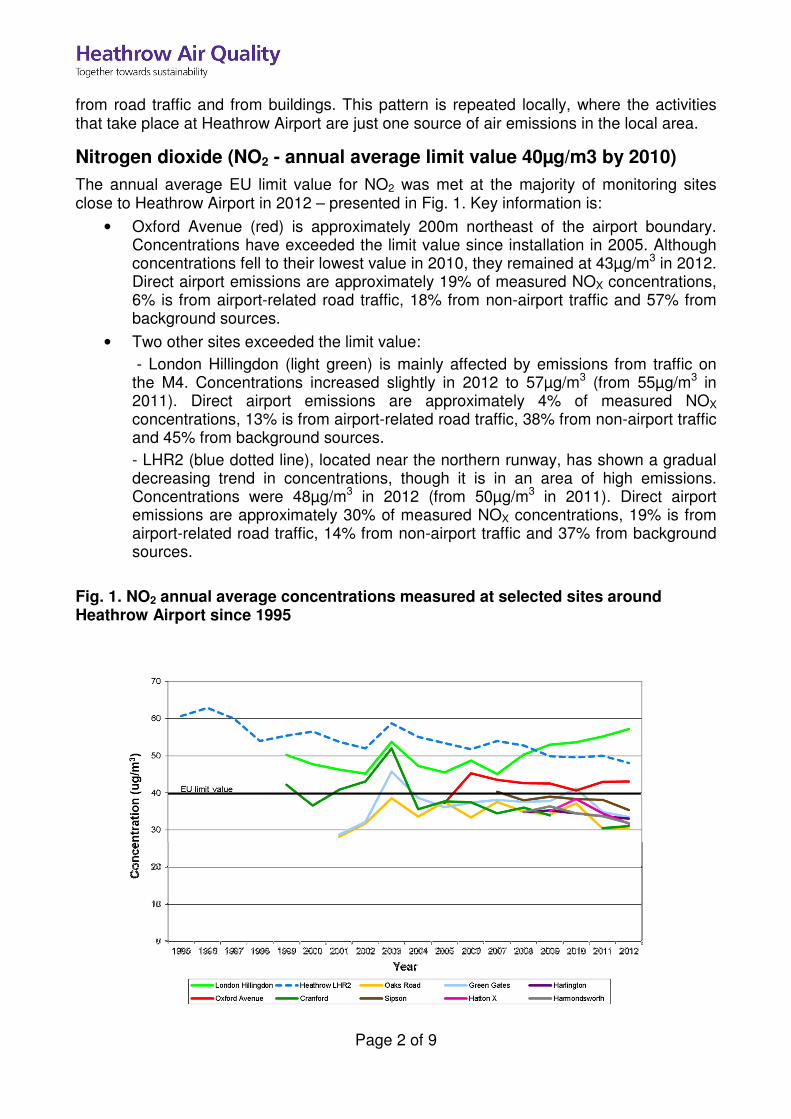
The annual average EU limit value for NO2 was met at the majority of monitoring sites close to Heathrow Airport in 2012 – presented in Fig. 1. Key information is:
• Oxford Avenue (red) is approximately 200m northeast of the airport boundary. Concentrations have exceeded the limit value since installation in 2005. Although concentrations fell to their lowest value in 2010, they remained at 43µg/m3 in 2012. Direct airport emissions are approximately 19% of measured NOX concentrations, 6% is from airport-related road traffic, 18% from non-airport traffic and 57% from background sources.
• Two other sites exceeded the limit value:
- London Hillingdon (light green) is mainly affected by emissions from traffic on the M4. Concentrations increased slightly in 2012 to 57µg/m3 (from 55µg/m3 in 2011). Direct airport emissions are approximately 4% of measured NOX concentrations, 13% is from airport-related road traffic, 38% from non-airport traffic and 45% from background sources.
- LHR2 (blue dotted line), located near the northern runway, has shown a gradual decreasing trend in concentrations, though it is in an area of high emissions. Concentrations were 48µg/m3 in 2012 (from 50µg/m3 in 2011). Direct airport emissions are approximately 30% of measured NOX concentrations, 19% is from airport-related road traffic, 14% from non-airport traffic and 37% from background sources.
Fig. 1. NO2 annual average concentrations measured at selected sites around Heathrow Airport since 1995
Page 3 of 9
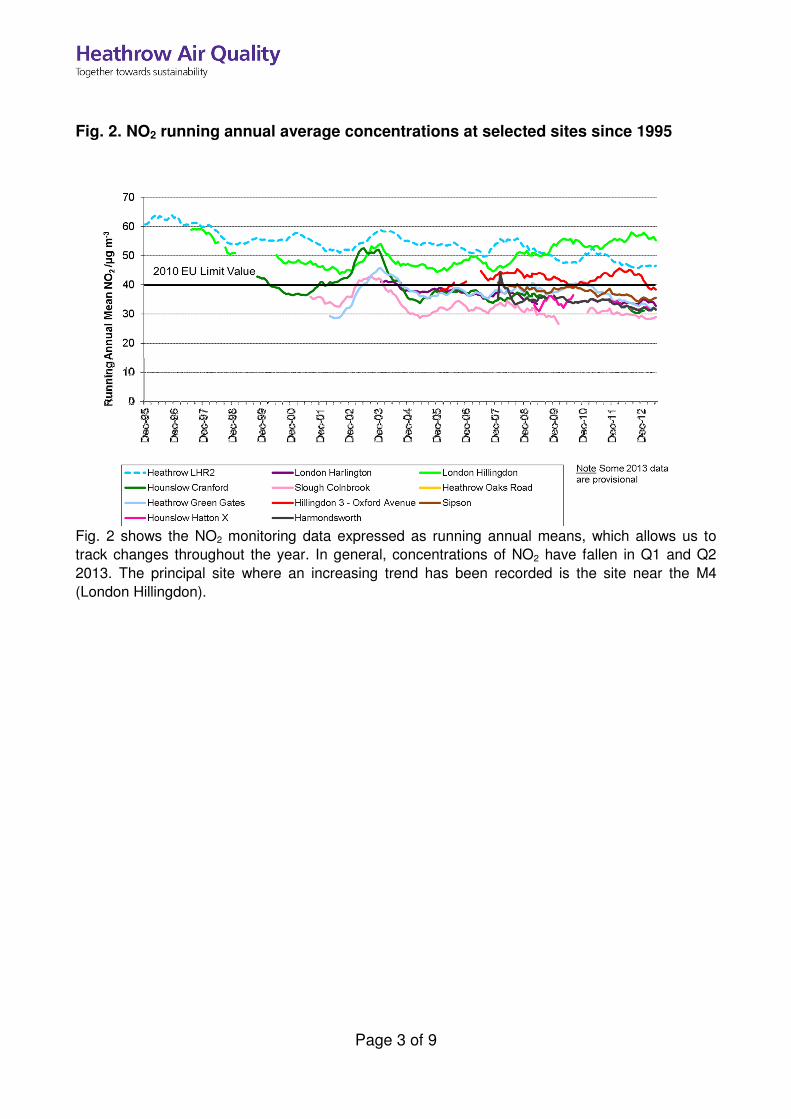
Fig. 2. NO2 running annual average concentrations at selected sites since 1995
Fig. 2 shows the NO2 monitoring data expressed as running annual means, which allows us to
track changes throughout the year. In general, concentrations of NO2 have fallen in Q1 and Q2
2013. The principal site where an increasing trend has been recorded is the site near the M4
(London Hillingdon).
Page 4 of 9
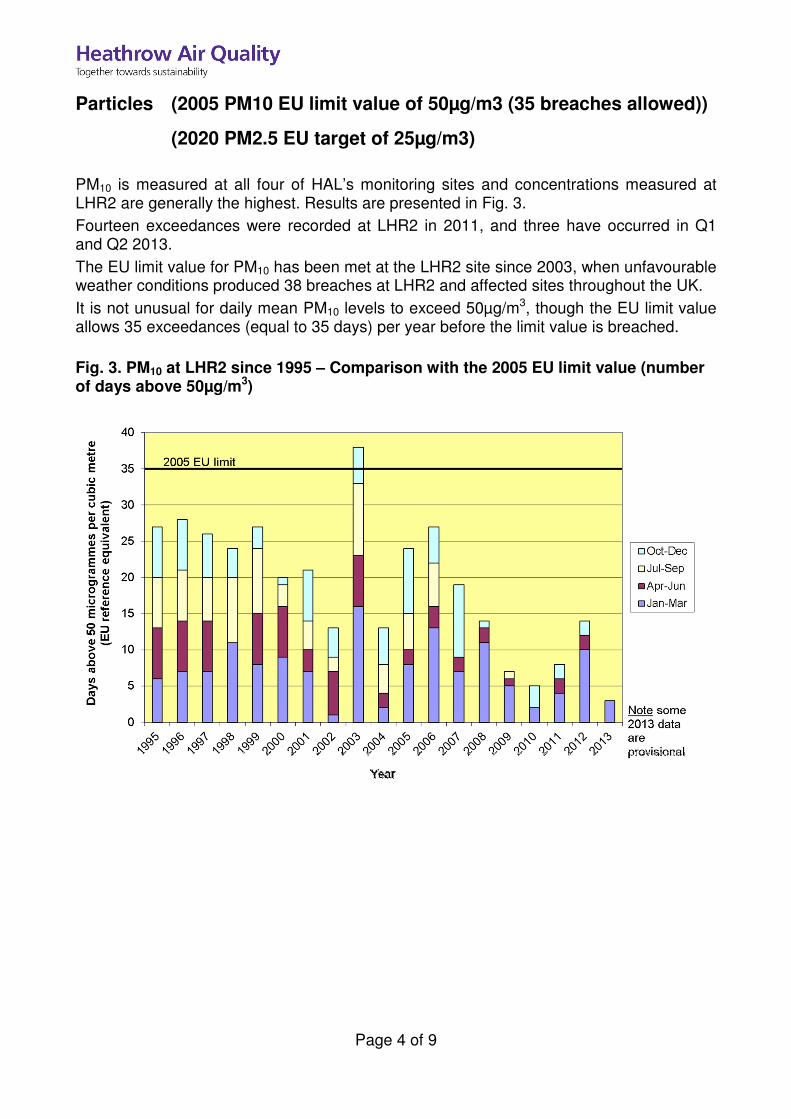
Particles (2005 PM10 EU limit value of 50µg/m3 (35 breaches allowed))
(2020 PM2.5 EU target of 25µg/m3)
PM10 is measured at all four of HAL’s monitoring sites and concentrations measured at LHR2 are generally the highest. Results are presented in Fig. 3.
Fourteen exceedances were recorded at LHR2 in 2011, and three have occurred in Q1 and Q2 2013.
The EU limit value for PM10 has been met at the LHR2 site since 2003, when unfavourable weather conditions produced 38 breaches at LHR2 and affected sites throughout the UK.
It is not unusual for daily mean PM10 levels to exceed 50µg/m3, though the EU limit value allows 35 exceedances (equal to 35 days) per year before the limit value is breached.
Fig. 3. PM10 at LHR2 since 1995 – Comparison with the 2005 EU limit value (number of days above 50µg/m3)
Page 5 of 9
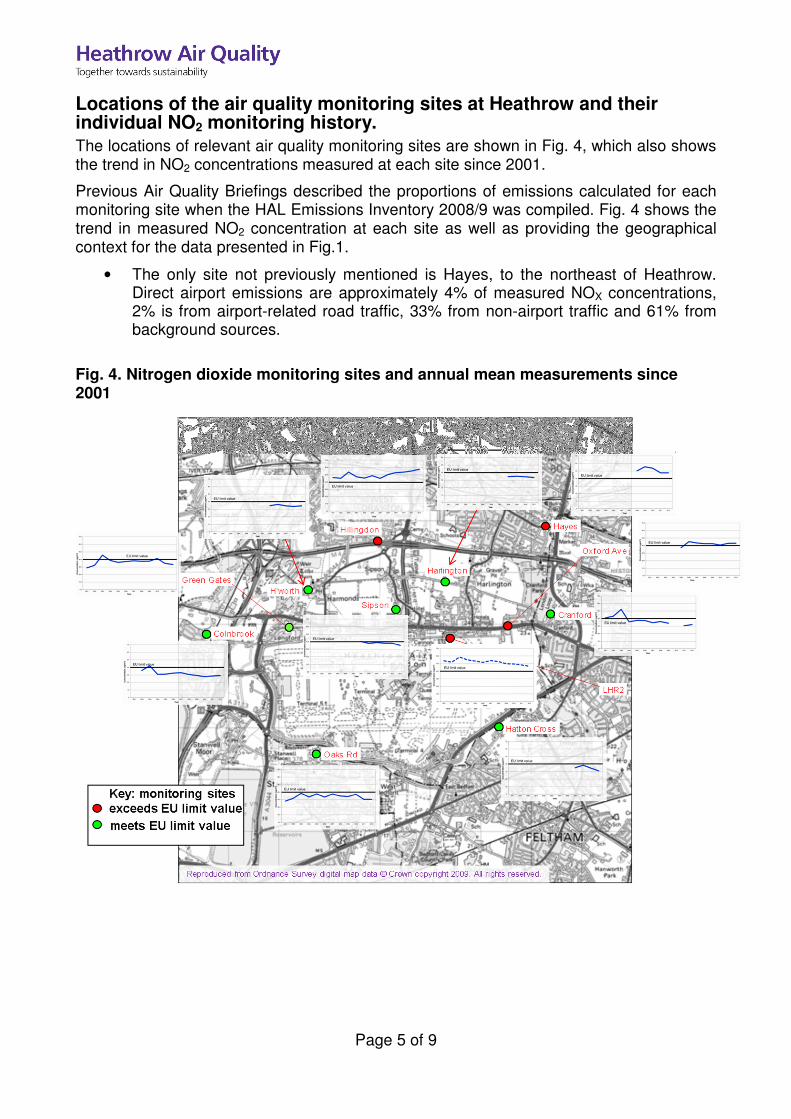
Locations of the air quality monitoring sites at Heathrow and their individual NO2 monitoring history.
The locations of relevant air quality monitoring sites are shown in Fig. 4, which also shows the trend in NO2 concentrations measured at each site since 2001.
Previous Air Quality Briefings described the proportions of emissions calculated for each monitoring site when the HAL Emissions Inventory 2008/9 was compiled. Fig. 4 shows the trend in measured NO2 concentration at each site as well as providing the geographical context for the data presented in Fig.1.
• The only site not previously mentioned is Hayes, to the northeast of Heathrow. Direct airport emissions are approximately 4% of measured NOX concentrations, 2% is from airport-related road traffic, 33% from non-airport traffic and 61% from background sources.
Fig. 4. Nitrogen dioxide monitoring sites and annual mean measurements since 2001
Page 6 of 9
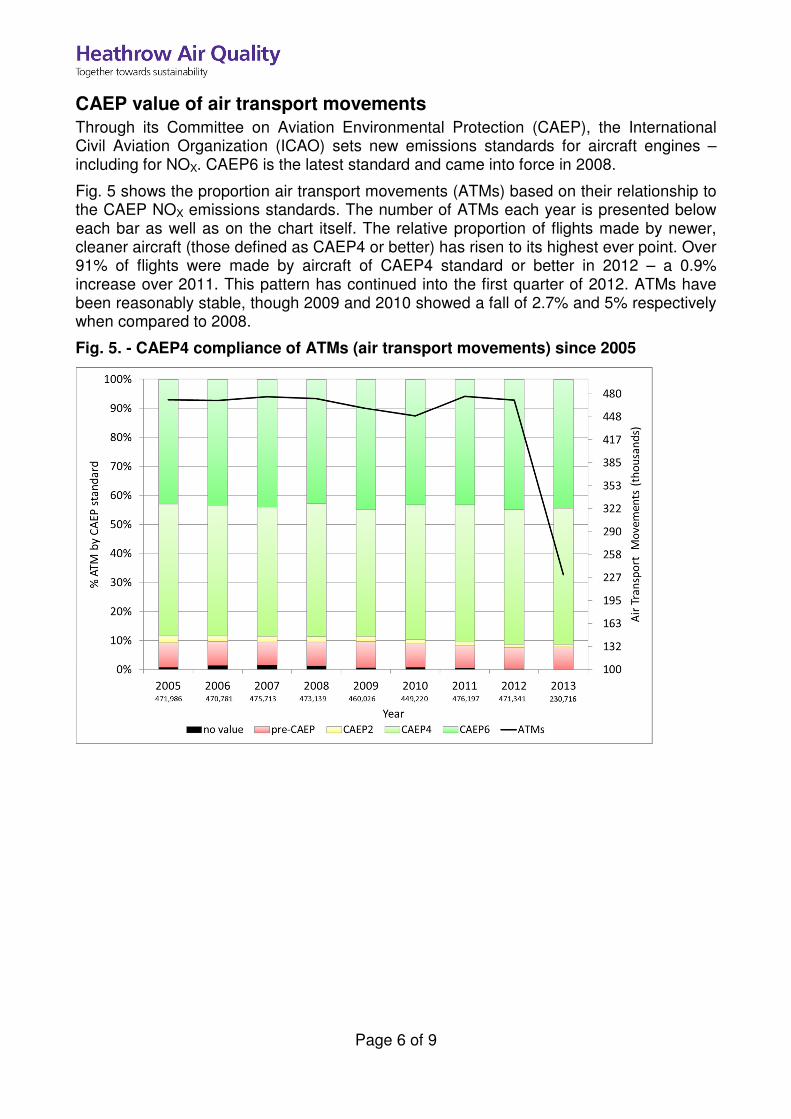
CAEP value of air transport movements
Through its Committee on Aviation Environmental Protection (CAEP), the International Civil Aviation Organization (ICAO) sets new emissions standards for aircraft engines – including for NOX. CAEP6 is the latest standard and came into force in 2008.
Fig. 5 shows the proportion air transport movements (ATMs) based on their relationship to the CAEP NOX emissions standards. The number of ATMs each year is presented below each bar as well as on the chart itself. The relative proportion of flights made by newer, cleaner aircraft (those defined as CAEP4 or better) has risen to its highest ever point. Over 91% of flights were made by aircraft of CAEP4 standard or better in 2012 – a 0.9% increase over 2011. This pattern has continued into the first quarter of 2012. ATMs have been reasonably stable, though 2009 and 2010 showed a fall of 2.7% and 5% respectively when compared to 2008.
Fig. 5. - CAEP4 compliance of ATMs (air transport movements) since 2005
Page 7 of 9
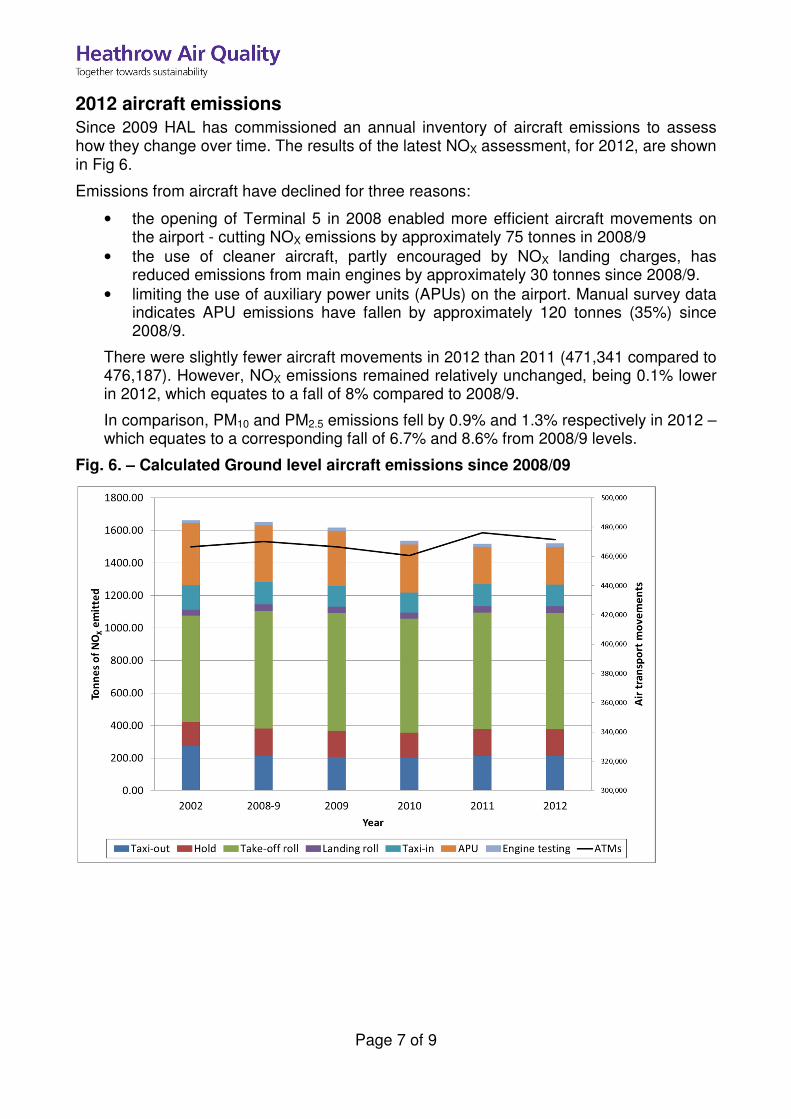
2012 aircraft emissions
Since 2009 HAL has commissioned an annual inventory of aircraft emissions to assess how they change over time. The results of the latest NOX assessment, for 2012, are shown in Fig 6.
Emissions from aircraft have declined for three reasons:
• the opening of Terminal 5 in 2008 enabled more efficient aircraft movements on the airport - cutting NOX emissions by approximately 75 tonnes in 2008/9
• the use of cleaner aircraft, partly encouraged by NOX landing charges, has reduced emissions from main engines by approximately 30 tonnes since 2008/9.
• limiting the use of auxiliary power units (APUs) on the airport. Manual survey data indicates APU emissions have fallen by approximately 120 tonnes (35%) since 2008/9.
There were slightly fewer aircraft movements in 2012 than 2011 (471,341 compared to 476,187). However, NOX emissions remained relatively unchanged, being 0.1% lower in 2012, which equates to a fall of 8% compared to 2008/9.
In comparison, PM10 and PM2.5 emissions fell by 0.9% and 1.3% respectively in 2012 – which equates to a corresponding fall of 6.7% and 8.6% from 2008/9 levels.
Fig. 6. – Calculated Ground level aircraft emissions since 2008/09
Page 8 of 9
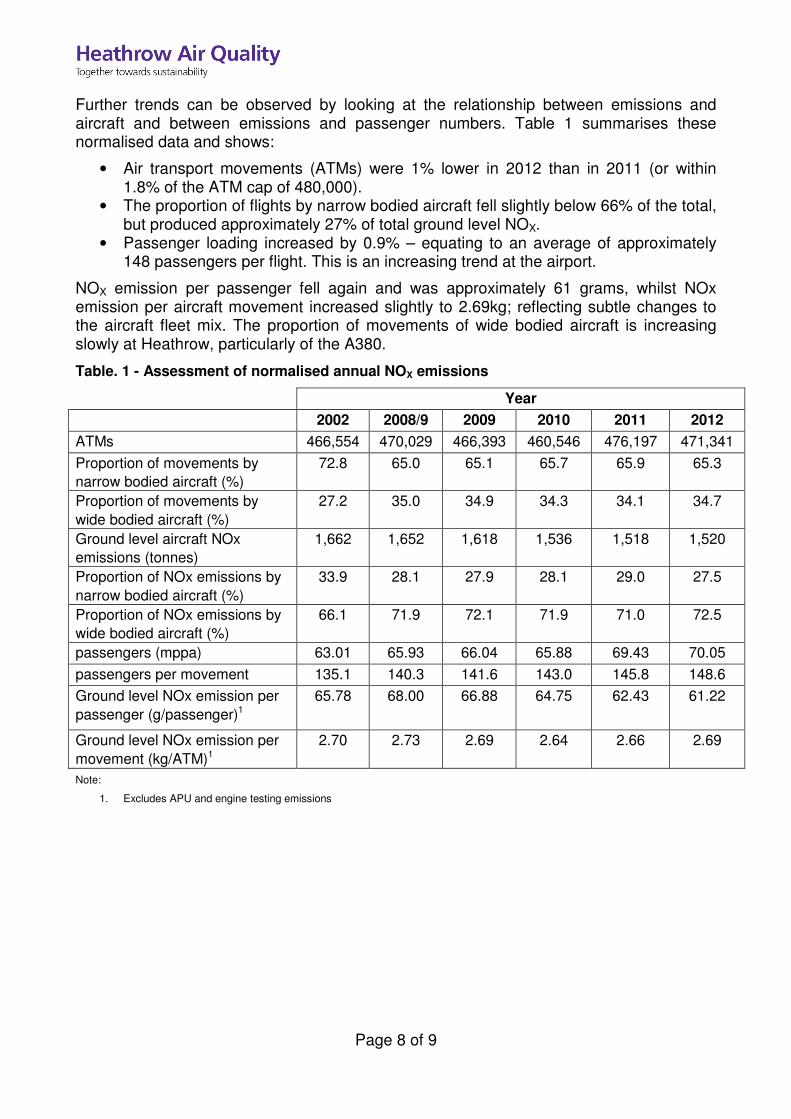
Further trends can be observed by looking at the relationship between emissions and aircraft and between emissions and passenger numbers. Table 1 summarises these normalised data and shows:
• Air transport movements (ATMs) were 1% lower in 2012 than in 2011 (or within 1.8% of the ATM cap of 480,000).
• The proportion of flights by narrow bodied aircraft fell slightly below 66% of the total, but produced approximately 27% of total ground level NOX.
• Passenger loading increased by 0.9% – equating to an average of approximately 148 passengers per flight. This is an increasing trend at the airport.
NOX emission per passenger fell again and was approximately 61 grams, whilst NOx emission per aircraft movement increased slightly to 2.69kg; reflecting subtle changes to the aircraft fleet mix. The proportion of movements of wide bodied aircraft is increasing slowly at Heathrow, particularly of the A380.
Table. 1 - Assessment of normalised annual NOX emissions
Year
2002 2008/9 2009 2010 2011 2012
ATMs 466,554 470,029 466,393 460,546 476,197 471,341
Proportion of movements by
narrow bodied aircraft (%)
72.8 65.0 65.1 65.7 65.9 65.3
Proportion of movements by
wide bodied aircraft (%)
27.2 35.0 34.9 34.3 34.1 34.7
Ground level aircraft NOx
emissions (tonnes)
1,662 1,652 1,618 1,536 1,518 1,520
Proportion of NOx emissions by
narrow bodied aircraft (%)
33.9 28.1 27.9 28.1 29.0 27.5
Proportion of NOx emissions by
wide bodied aircraft (%)
66.1 71.9 72.1 71.9 71.0 72.5
passengers (mppa) 63.01 65.93 66.04 65.88 69.43 70.05
passengers per movement 135.1 140.3 141.6 143.0 145.8 148.6
Ground level NOx emission per
passenger (g/passenger)1
65.78 68.00 66.88 64.75 62.43 61.22
Ground level NOx emission per
movement (kg/ATM)1
2.70 2.73 2.69 2.64 2.66 2.69
Note:
1. Excludes APU and engine testing emissions

Page 9 of 9
AirWatch website
We have contracted Ricardo-AEA to give the website a new fresh, modern graphical design. It will be built using the most modern techniques; ensuring best practice is adhered to at all times for accessibility and usability. The current website can be viewed at: www.heathrowairwatch.org.uk
In addition, its design will meet all modern web standards and will be tested in all major browsers during the development period – by comparison, the current site comes across as clunky.
As the gateway to the website that most visitors will see, the homepage will continue to provide introduction information as currently used on the website, and will also show a summary of the latest levels to help make the latest automatic data more visible, and engaging to more visitors.
All the partners involved in Heathrow Airwatch (LB Hillingdon, LB Hounslow, Slough BC, Spelthorne BC, BA and the Environment Agency) will also be visible, each with clickable links to their respective websites.
We are in the final stages of the website update, and expect the changes to be finished in summer 2013.