Embed Size (px)
Citation preview

Air Passenger Forecasts Example report: numbers are for illustration purposes only
www.iata.org/pax-forecast
Global reportPage
Table of Contents 1
Top Markets 2
Top Domestic Markets 3
Top International Country Pairs 4
Largest Gaining Country Pairs 5
Annual Outlook (%) 6
Annual Outlook (Passenger Numbers) 7
Scenario 1 Outlook (%) 8
Scenario 1 Outlook (Passenger Numbers) 9
Scenario 2 Outlook (%) 10
Scenario 2 Outlook (Passenger Numbers) 11
Glossary 12
Disclaimer:
Although every effort has been made to ensure accuracy, neither the International Air Transport Association, nor Tourism Economics, shall not be held responsible for loss or damage caused by errors, omissions, misprints or misinterpretation of the contents hereof. Furthermore, both the International Air Transport Association and Tourism Economics expressly disclaim all and any liability to any person, whether a purchaser of this product or not, in respect of anything done or omitted, and the consequences of anything done or omitted, by any such person in reliance on the contents of this product. No part of this product may be reproduced, recast, reformatted or transmitted in any form by any means, electronic or mechanical, including photocopying, recording or any other information storage and retrieval system.

Air Passenger Forecasts
Global - Top Markets
Top markets, ranked by passenger numbers, 2014-20345 year 10 year 20 year
2014 2019 2024 2034 2014-2019 2014-2024 2014-2034
Rank Country
1 Canada 1,281 1,519 1,802 2,533 3.5% 3.5% 3.5%
2 US 1,277 1,553 1,890 2,797 4.0% 4.0% 4.0%
3 Brazil 1,242 1,471 1,742 2,443 3.4% 3.4% 3.4%
4 Indonesia 1,179 1,434 1,744 2,582 4.0% 4.0% 4.0%
5 Philippines 1,155 1,391 1,675 2,428 3.8% 3.8% 3.8%
6 China 1,151 1,401 1,704 2,523 4.0% 4.0% 4.0%
7 Saudi Arabia 1,093 1,330 1,617 2,394 4.0% 4.0% 4.0%
8 India 1,032 1,218 1,437 2,000 3.4% 3.4% 3.4%
9 Korea 1,002 1,194 1,423 2,021 3.6% 3.6% 3.6%
10 Malaysia 981 1,183 1,426 2,074 3.8% 3.8% 3.8%
11 France 949 1,048 1,157 1,410 2.0% 2.0% 2.0%
12 Russia 930 1,107 1,319 1,870 3.6% 3.6% 3.6%
13 Italy 905 1,101 1,340 1,983 4.0% 4.0% 4.0%
14 Spain 863 1,047 1,270 1,870 3.9% 3.9% 3.9%
15 UK 819 861 905 1,000 1.0% 1.0% 1.0%
16 Germany 805 952 1,127 1,577 3.4% 3.4% 3.4%
17 Turkey 788 940 1,122 1,599 3.6% 3.6% 3.6%
18 Singapore 785 949 1,148 1,681 3.9% 3.9% 3.9%
19 Hong Kong 780 920 1,085 1,511 3.4% 3.4% 3.4%
20 Mexico 766 917 1,099 1,577 3.7% 3.7% 3.7%
Whilst the biggest faller in the period 2014-2034 is forecast to be France falling 9 places to be ranked 20th largest market in 2034.
Scenario 1 presents a more optimistic outlook for air passenger growth over the next 20 years. This scenario, which considers a relaxing of regulations, particularly in the emerging markets, could
add 0 billion passengers on top of our baseline by 2034. This would see an average annual growth rate of 5.6% between 2014-2034.
We have also considered a second scenario based on a pick-up in protectionism. On this basis, we forecast a withdrawal of 0 billion passengers from our baseline by 2034, leaving growth at
1.4% per year over the 20 year period.
Passenger numbers ('000s) CAGR %
The World air passenger market is forecast to grow by 3.9% per annum, the equivalent of 0 billion additional passengers over the 20 year period,
The biggest three markets in 2014 are Canada, the US and Brazil, while in 2034 they are forecast to become the US, Indonesia and Canada respectively.
The largest riser in the 20 year period is forecast to be Australia rising 4 places to be ranked 19th largest market in 2034.
This is a publication of IATA and is intended solely for use by paid subscribers. Reproduction or distribution of this forecast, in whole or part, without permission of IATA is prohibited and subject to legal action. Ownership, distribution and use of this forecast and its contents are subject to the terms of the contract you have entered into with IATA. Source: IATA
1
2
3
4
5
6
7
8
9
10
11
12
13
14
15
16
17
18
19
20
2014 2015 2016 2017 2018 2019 2020 2021 2022 2023 2024 2025 2026 2027 2028 2029 2030 2031 2032 2033 2034
Canada
US
Brazil
Indonesia
Philippines
China
Saudi Arabia
India
Korea
Malaysia
France
Russia
Italy
Spain
UK
Germany
Turkey
Singapore
Hong Kong
Mexico
US
Indonesia
Canada
China
Brazil
Philippines
Saudi Arabia
Malaysia
Korea
India
Italy
Spain
Russia
Singapore
Turkey
Mexico
Germany
Hong Kong
Australia
France

Air Passenger Forecasts
Global - Top Domestic Markets
Top domestic markets, ranked by passenger numbers, 2014-20345 year 10 year 20 year
2014 2019 2024 2034 2014-2019 2014-2024 2014-2034
Rank Country
1 Within US 292 345 409 574 3.4% 3.4% 3.4%
2 Within Guatemala 137 163 195 279 3.6% 3.6% 3.6%
3 Within Hungary 135 159 188 261 3.4% 3.4% 3.4%
4 Within Morocco 133 162 196 289 3.9% 3.9% 3.9%
5 Within Guadeloupe 132 156 185 260 3.5% 3.5% 3.5%
6 Within Uganda 131 156 186 263 3.5% 3.5% 3.5%
7 Within Senegal 131 158 190 275 3.8% 3.8% 3.8%
8 Within Congo 131 158 191 278 3.9% 3.9% 3.9%
9 Within Zimbabwe 131 154 182 253 3.4% 3.4% 3.4%
10 Within Yemen 130 157 188 270 3.7% 3.7% 3.7%
11 Within Argentina 129 151 177 243 3.2% 3.2% 3.2%
12 Within Pakistan 127 151 180 254 3.5% 3.5% 3.5%
13 Within Oman 127 147 170 229 3.0% 3.0% 3.0%
14 Within Georgia 125 152 185 272 4.0% 4.0% 4.0%
15 Within Korea 125 145 168 227 3.1% 3.1% 3.1%
16 Within France 124 149 180 260 3.8% 3.8% 3.8%
17 Within Norway 124 146 173 240 3.4% 3.4% 3.4%
18 Within Colombia 123 148 179 260 3.8% 3.8% 3.8%
19 Within Ukraine 122 145 172 242 3.5% 3.5% 3.5%
20 Within Azerbaijan 122 147 179 262 3.9% 3.9% 3.9%
Towards the lower end of the table (ranks 11th-20th), a lot more volatility can be observed. Our forecast indicates that 3 of the markets appearing in the top 20 in 2014 will fall out of this table
completely (Ukraine, Korea and Oman) to be replaced by new markets (Latvia, Switzerland and Singapore).
Passenger numbers ('000s) CAGR %
The biggest three domestic markets in 2014 are the US, Guatemala and Hungary, while in 2034 they are forecast to become the US, Morocco and Guatemala respectively.
The largest riser in the 20 year period is forecast to be Singapore rising 12 places to be ranked 17th largest market in 2034.
Whilst the biggest faller in the period 2014-2034 is forecast to be Hungary falling 7 places to be ranked 10th largest market in 2034.
Amongst the top 10 domestic markets, the largest change can be observed in Congo which moves up 4 places from 8th to 4th place.
This is a publication of IATA and is intended solely for use by paid subscribers. Reproduction or distribution of this forecast, in whole or part, without permission of IATA is prohibited and subject to legal action. Ownership, distribution and use of this forecast and its contents are subject to the terms of the contract you have entered into with IATA. Source: IATA
1
2
3
4
5
6
7
8
9
10
11
12
13
14
15
16
17
18
19
20
2014 2015 2016 2017 2018 2019 2020 2021 2022 2023 2024 2025 2026 2027 2028 2029 2030 2031 2032 2033 2034
US
Guatemala
Hungary
Morocco
Guadeloupe
Uganda
Senegal
Congo
Zimbabwe
Yemen
Argentina
Pakistan
Oman
Georgia
Korea
France
Norway
Colombia
Ukraine
Azerbaijan
05
10152025
1
US
Morocco
Guatemala
Congo
Senegal
Georgia
Yemen
Uganda
Azerbaijan
Hungary
France
Guadeloupe
Colombia
Pakistan
Zimbabwe
Switzerland
Singapore
Argentina
Latvia
Togo

Global - Top International Markets
Top international markets, ranked by passenger numbers, 2014-20345 year 10 year 20 year
2014 2019 2024 2034 2014-2019 2014-2024 2014-2034
Rank Country
1 US - Canada 673 806 965 1,385 3.7% 3.7% 3.7%
2 US - Kazakhstan 672 801 955 1,359 3.6% 3.6% 3.6%
3 US - Italy 655 769 902 1,243 3.3% 3.3% 3.3%
4 US - Chinese Taipei 643 766 914 1,300 3.6% 3.6% 3.6%
5 US - Spain 632 769 935 1,385 4.0% 4.0% 4.0%
6 US - Sweden 626 728 847 1,145 3.1% 3.1% 3.1%
7 US - Norway 619 738 879 1,247 3.6% 3.6% 3.6%
8 US - Pakistan 585 697 831 1,180 3.6% 3.6% 3.6%
9 US - Poland 548 645 760 1,055 3.3% 3.3% 3.3%
10 US - Korea 545 649 772 1,093 3.5% 3.5% 3.5%
11 US - UK 538 641 764 1,083 3.6% 3.6% 3.6%
12 US - New Zealand 523 635 770 1,132 3.9% 3.9% 3.9%
13 US - Colombia 511 606 719 1,011 3.5% 3.5% 3.5%
14 US - Thailand 484 570 670 928 3.3% 3.3% 3.3%
15 US - Philippines 469 545 632 852 3.0% 3.0% 3.0%
16 US - Japan 463 545 642 890 3.3% 3.3% 3.3%
17 US - Iran 449 530 625 871 3.4% 3.4% 3.4%
18 US - South Africa 444 515 597 803 3.0% 3.0% 3.0%
19 US - Ireland 435 526 637 934 3.9% 3.9% 3.9%
20 US - France 427 499 583 798 3.2% 3.2% 3.2%
The biggest three country pairs in 2014 are the US - Canada, the US - Kazakhstan and the US - Italy, while in 2034 they are forecast to become the US - Canada, the US - Spain and the US -
Kazakhstan respectively.
The largest riser in the 20 year period is forecast to be US - Laos rising 5 places to be ranked 20th largest market in 2034.
Whilst the biggest faller in the period 2014-2034 is forecast to be US - Philippines falling 6 places to be ranked 21st largest market in 2034.
Strong growth is expected in Europe over the next 20 years, mostly coming from German routes. In particular, the largest risers in ranking terms globally are forecast to be Germany - Ireland,
Germany - France and Germany - Italy, which are forecast to rise by 34, 11 and 9 places over the 20 year period respecitvely.
Air Passenger Forecasts
The largest country pair in 2014 is US - Canada, with 0.6 million passengers travelling between these markets in 2014. This country pair is forecast to retain the top spot throughout the forecast
period, and by 2034 an estimated 1.4 million passengers are forecast to travel between these markets.
Passenger numbers ('000s) CAGR %
This is a publication of IATA and is intended solely for use by paid subscribers. Reproduction or distribution of this forecast, in whole or part, without permission of IATA is prohibited and subject to legal action. Ownership, distribution and use of this forecast and its contents are subject to the terms of the contract you have entered into with IATA. Source: IATA
1
2
3
4
5
6
7
8
9
10
11
12
13
14
15
16
17
18
19
20
2014 2015 2016 2017 2018 2019 2020 2021 2022 2023 2024 2025 2026 2027 2028 2029 2030 2031 2032 2033 2034
US - Canada
US - Kazakhstan
US - Italy
US - Chinese Taipei
US - Spain
US - Sweden
US - Norway
US - Pakistan
US - Poland
US - Korea
US - UK
US - New Zealand
US - Colombia
US - Thailand
US - Philippines
US - Japan
US - Iran
US - South Africa
US - Ireland
US - France
0510152025
1
US - Canada
US - Spain
US - Kazakhstan
US - Chinese Taipei
US - Norway
US - Italy
US - Pakistan
US - Sweden
US - New Zealand
US - Korea
US - UK
US - Poland
US - Colombia
US - Ireland
US - Thailand
US - Japan
US - Iran
US - Egypt
US - Brazil
US - Laos
Rank Domestic markets
Additional
passengers per
year by 2034
('000s)CAGR %
Rank Country pair
Additional
passengers per
year by 2034
('000s)CAGR %
Rank Country pairCAGR %
Additional
passengers per year
by 2034 ('000s)
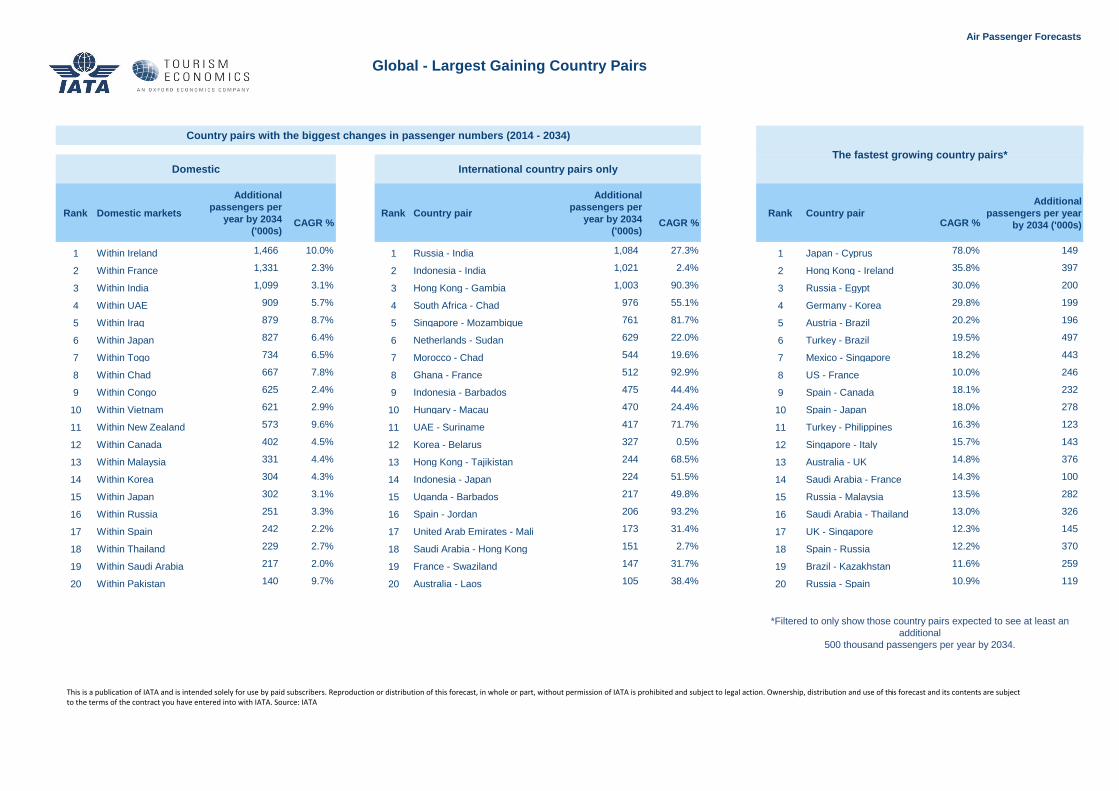
1 Within Ireland 1,466 10.0% 1 Russia - India 1,084 27.3% 1 Japan - Cyprus 78.0% 149
2 Within France 1,331 2.3% 2 Indonesia - India 1,021 2.4% 2 Hong Kong - Ireland 35.8% 397
3 Within India 1,099 3.1% 3 Hong Kong - Gambia 1,003 90.3% 3 Russia - Egypt 30.0% 200
4 Within UAE 909 5.7% 4 South Africa - Chad 976 55.1% 4 Germany - Korea 29.8% 199
5 Within Iraq 879 8.7% 5 Singapore - Mozambique 761 81.7% 5 Austria - Brazil 20.2% 196
6 Within Japan 827 6.4% 6 Netherlands - Sudan 629 22.0% 6 Turkey - Brazil 19.5% 497
7 Within Togo 734 6.5% 7 Morocco - Chad 544 19.6% 7 Mexico - Singapore 18.2% 443
8 Within Chad 667 7.8% 8 Ghana - France 512 92.9% 8 US - France 10.0% 246
9 Within Congo 625 2.4% 9 Indonesia - Barbados 475 44.4% 9 Spain - Canada 18.1% 232
10 Within Vietnam 621 2.9% 10 Hungary - Macau 470 24.4% 10 Spain - Japan 18.0% 278
11 Within New Zealand 573 9.6% 11 UAE - Suriname 417 71.7% 11 Turkey - Philippines 16.3% 123
12 Within Canada 402 4.5% 12 Korea - Belarus 327 0.5% 12 Singapore - Italy 15.7% 143
13 Within Malaysia 331 4.4% 13 Hong Kong - Tajikistan 244 68.5% 13 Australia - UK 14.8% 376
14 Within Korea 304 4.3% 14 Indonesia - Japan 224 51.5% 14 Saudi Arabia - France 14.3% 100
15 Within Japan 302 3.1% 15 Uganda - Barbados 217 49.8% 15 Russia - Malaysia 13.5% 282
16 Within Russia 251 3.3% 16 Spain - Jordan 206 93.2% 16 Saudi Arabia - Thailand 13.0% 326
17 Within Spain 242 2.2% 17 United Arab Emirates - Mali 173 31.4% 17 UK - Singapore 12.3% 145
18 Within Thailand 229 2.7% 18 Saudi Arabia - Hong Kong 151 2.7% 18 Spain - Russia 12.2% 370
19 Within Saudi Arabia 217 2.0% 19 France - Swaziland 147 31.7% 19 Brazil - Kazakhstan 11.6% 259
20 Within Pakistan 140 9.7% 20 Australia - Laos 105 38.4% 20 Russia - Spain 10.9% 119
Air Passenger Forecasts
*Filtered to only show those country pairs expected to see at least an
additional
500 thousand passengers per year by 2034.
Global - Largest Gaining Country Pairs
Country pairs with the biggest changes in passenger numbers (2014 - 2034)
The fastest growing country pairs*
Domestic International country pairs only
This is a publication of IATA and is intended solely for use by paid subscribers. Reproduction or distribution of this forecast, in whole or part, without permission of IATA is prohibited and subject to legal action. Ownership, distribution and use of this forecast and its contents are subject to the terms of the contract you have entered into with IATA. Source: IATA

To/from the World Note: full access to our forecast database is available through our online webtool. Please contact us for more details (contact details can be found on the Glossary tab).
Annual % change 2013 2014 2015 2016 2017 2018 2019 2020 2021 2022 2023 2024 2025 2026 2027 2028 2029 2030 2031 2032 2033 2034
Actual
Total 3.9% 3.9% 3.9% 3.9% 3.9% 3.9% 3.9% 3.9% 3.9% 3.9% 3.9% 3.9% 3.9% 3.9% 3.9% 3.9% 3.9% 3.9% 3.9% 3.9% 3.9% 3.9%
North America 3.9% 3.9% 3.9% 3.9% 3.9% 3.9% 3.9% 3.9% 3.9% 3.9% 3.9% 3.9% 3.9% 3.9% 3.9% 3.9% 3.9% 3.9% 3.9% 3.9% 3.9% 3.9%
Canada 3.5% 3.5% 3.5% 3.5% 3.5% 3.5% 3.5% 3.5% 3.5% 3.5% 3.5% 3.5% 3.5% 3.5% 3.5% 3.5% 3.5% 3.5% 3.5% 3.5% 3.5% 3.5%
United States 4.0% 4.0% 4.0% 4.0% 4.0% 4.0% 4.0% 4.0% 4.0% 4.0% 4.0% 4.0% 4.0% 4.0% 4.0% 4.0% 4.0% 4.0% 4.0% 4.0% 4.0% 4.0%
Europe 3.4% 3.4% 3.4% 3.4% 3.4% 3.4% 3.4% 3.4% 3.4% 3.4% 3.4% 3.4% 3.4% 3.4% 3.4% 3.4% 3.4% 3.4% 3.4% 3.4% 3.4% 3.4%
Germany 3.4% 3.4% 3.4% 3.4% 3.4% 3.4% 3.4% 3.4% 3.4% 3.4% 3.4% 3.4% 3.4% 3.4% 3.4% 3.4% 3.4% 3.4% 3.4% 3.4% 3.4% 3.4%
France 2.0% 2.0% 2.0% 2.0% 2.0% 2.0% 2.0% 2.0% 2.0% 2.0% 2.0% 2.0% 2.0% 2.0% 2.0% 2.0% 2.0% 2.0% 2.0% 2.0% 2.0% 2.0%
Italy 4.0% 4.0% 4.0% 4.0% 4.0% 4.0% 4.0% 4.0% 4.0% 4.0% 4.0% 4.0% 4.0% 4.0% 4.0% 4.0% 4.0% 4.0% 4.0% 4.0% 4.0% 4.0%
UK 1.0% 1.0% 1.0% 1.0% 1.0% 1.0% 1.0% 1.0% 1.0% 1.0% 1.0% 1.0% 1.0% 1.0% 1.0% 1.0% 1.0% 1.0% 1.0% 1.0% 1.0% 1.0%
Russia 3.6% 3.6% 3.6% 3.6% 3.6% 3.6% 3.6% 3.6% 3.6% 3.6% 3.6% 3.6% 3.6% 3.6% 3.6% 3.6% 3.6% 3.6% 3.6% 3.6% 3.6% 3.6%
Asia 3.8% 3.8% 3.8% 3.8% 3.8% 3.8% 3.8% 3.8% 3.8% 3.8% 3.8% 3.8% 3.8% 3.8% 3.8% 3.8% 3.8% 3.8% 3.8% 3.8% 3.8% 3.8%
Japan 1.0% 1.0% 1.0% 1.0% 1.0% 1.0% 1.0% 1.0% 1.0% 1.0% 1.0% 1.0% 1.0% 1.0% 1.0% 1.0% 1.0% 1.0% 1.0% 1.0% 1.0% 1.0%
China 4.0% 4.0% 4.0% 4.0% 4.0% 4.0% 4.0% 4.0% 4.0% 4.0% 4.0% 4.0% 4.0% 4.0% 4.0% 4.0% 4.0% 4.0% 4.0% 4.0% 4.0% 4.0%
India 3.4% 3.4% 3.4% 3.4% 3.4% 3.4% 3.4% 3.4% 3.4% 3.4% 3.4% 3.4% 3.4% 3.4% 3.4% 3.4% 3.4% 3.4% 3.4% 3.4% 3.4% 3.4%
Indonesia 4.0% 4.0% 4.0% 4.0% 4.0% 4.0% 4.0% 4.0% 4.0% 4.0% 4.0% 4.0% 4.0% 4.0% 4.0% 4.0% 4.0% 4.0% 4.0% 4.0% 4.0% 4.0%
Latin America 3.6% 3.6% 3.6% 3.6% 3.6% 3.6% 3.6% 3.6% 3.6% 3.6% 3.6% 3.6% 3.6% 3.6% 3.6% 3.6% 3.6% 3.6% 3.6% 3.6% 3.6% 3.6%
Brazil 3.4% 3.4% 3.4% 3.4% 3.4% 3.4% 3.4% 3.4% 3.4% 3.4% 3.4% 3.4% 3.4% 3.4% 3.4% 3.4% 3.4% 3.4% 3.4% 3.4% 3.4% 3.4%
Mexico 3.7% 3.7% 3.7% 3.7% 3.7% 3.7% 3.7% 3.7% 3.7% 3.7% 3.7% 3.7% 3.7% 3.7% 3.7% 3.7% 3.7% 3.7% 3.7% 3.7% 3.7% 3.7%
Middle East 3.7% 3.7% 3.7% 3.7% 3.7% 3.7% 3.7% 3.7% 3.7% 3.7% 3.7% 3.7% 3.7% 3.7% 3.7% 3.7% 3.7% 3.7% 3.7% 3.7% 3.7% 3.7%
Saudi Arabia 4.0% 4.0% 4.0% 4.0% 4.0% 4.0% 4.0% 4.0% 4.0% 4.0% 4.0% 4.0% 4.0% 4.0% 4.0% 4.0% 4.0% 4.0% 4.0% 4.0% 4.0% 4.0%
UAE 3.0% 3.0% 3.0% 3.0% 3.0% 3.0% 3.0% 3.0% 3.0% 3.0% 3.0% 3.0% 3.0% 3.0% 3.0% 3.0% 3.0% 3.0% 3.0% 3.0% 3.0% 3.0%
Africa 3.6% 3.6% 3.6% 3.6% 3.6% 3.6% 3.6% 3.6% 3.6% 3.6% 3.6% 3.6% 3.6% 3.6% 3.6% 3.6% 3.6% 3.6% 3.6% 3.6% 3.6% 3.6%
Nigeria 3.4% 3.4% 3.4% 3.4% 3.4% 3.4% 3.4% 3.4% 3.4% 3.4% 3.4% 3.4% 3.4% 3.4% 3.4% 3.4% 3.4% 3.4% 3.4% 3.4% 3.4% 3.4%
South Africa 4.0% 4.0% 4.0% 4.0% 4.0% 4.0% 4.0% 4.0% 4.0% 4.0% 4.0% 4.0% 4.0% 4.0% 4.0% 4.0% 4.0% 4.0% 4.0% 4.0% 4.0% 4.0%
Forecast
Air Passenger Forecasts
Global - Annual Outlook (%)
This is a publication of IATA and is intended solely for use by paid subscribers. Reproduction or distribution of this forecast, in whole or part, without permission of IATA is prohibited and subject to legal action. Ownership, distribution and use of this forecast and its contents are subject to the terms of the contract you have entered into with IATA. Source: IATA

To/from the World Note: full access to our forecast database is available through our online webtool. Please contact us for more details (contact details can be found on the Glossary tab).
Passenger
numbers ('000s)2013 2014 2015 2016 2017 2018 2019 2020 2021 2022 2023 2024 2025 2026 2027 2028 2029 2030 2031 2032 2033 2034
Actual
Total 12,252 12,727 13,221 13,733 14,266 14,819 15,393 15,990 16,610 17,254 17,923 18,617 19,339 20,089 20,868 21,677 22,517 23,390 24,297 25,239 26,217 27,233
North America 1,600 1,663 1,727 1,795 1,864 1,937 2,012 2,091 2,172 2,257 2,344 2,436 2,531 2,629 2,731 2,838 2,948 3,063 3,182 3,306 3,435 3,569
Canada 1,238 1,281 1,326 1,372 1,419 1,469 1,519 1,572 1,627 1,683 1,741 1,802 1,864 1,929 1,995 2,065 2,136 2,210 2,287 2,366 2,448 2,533
United States 1,228 1,277 1,328 1,381 1,436 1,494 1,553 1,615 1,680 1,747 1,817 1,890 1,965 2,044 2,126 2,211 2,299 2,391 2,487 2,586 2,690 2,797
Europe 1,322 1,367 1,414 1,462 1,512 1,563 1,616 1,671 1,728 1,787 1,848 1,910 1,975 2,042 2,112 2,184 2,258 2,335 2,414 2,496 2,581 2,669
Germany 778 805 833 861 890 921 952 985 1,019 1,053 1,089 1,127 1,165 1,205 1,246 1,289 1,333 1,378 1,425 1,474 1,524 1,577
France 930 949 968 987 1,007 1,027 1,048 1,069 1,090 1,112 1,134 1,157 1,180 1,203 1,228 1,252 1,277 1,303 1,329 1,355 1,382 1,410
Italy 870 905 941 979 1,018 1,059 1,101 1,145 1,191 1,239 1,288 1,340 1,394 1,449 1,507 1,568 1,630 1,695 1,763 1,834 1,907 1,983
UK 811 819 827 836 844 852 861 870 878 887 896 905 914 923 932 942 951 961 970 980 990 1,000
Russia 898 930 963 997 1,033 1,069 1,107 1,147 1,187 1,230 1,273 1,319 1,366 1,414 1,464 1,516 1,570 1,626 1,684 1,744 1,806 1,870
Asia 1,504 1,561 1,619 1,681 1,744 1,810 1,878 1,949 2,023 2,099 2,178 2,260 2,346 2,434 2,526 2,621 2,720 2,823 2,930 3,040 3,155 3,274
Japan 755 762 770 778 785 793 801 809 817 825 834 842 850 859 868 876 885 894 903 912 921 930
China 1,107 1,151 1,198 1,245 1,295 1,347 1,401 1,457 1,515 1,576 1,639 1,704 1,773 1,844 1,917 1,994 2,074 2,157 2,243 2,333 2,426 2,523
India 998 1,032 1,067 1,102 1,140 1,178 1,218 1,259 1,301 1,345 1,390 1,437 1,485 1,535 1,587 1,640 1,695 1,752 1,811 1,872 1,935 2,000
Indonesia 1,133 1,179 1,226 1,275 1,326 1,379 1,434 1,491 1,551 1,613 1,677 1,744 1,814 1,887 1,962 2,041 2,122 2,207 2,296 2,387 2,483 2,582
Latin America 1,927 1,997 2,069 2,145 2,223 2,304 2,388 2,475 2,565 2,658 2,755 2,856 2,960 3,067 3,179 3,295 3,415 3,539 3,668 3,802 3,940 4,084
Brazil 1,201 1,242 1,285 1,329 1,375 1,422 1,471 1,521 1,574 1,628 1,684 1,742 1,802 1,864 1,928 1,994 2,063 2,134 2,207 2,283 2,362 2,443
Mexico 738 766 794 823 853 885 917 951 986 1,022 1,060 1,099 1,139 1,181 1,224 1,270 1,316 1,365 1,415 1,467 1,521 1,577
Middle East 1,769 1,834 1,902 1,971 2,044 2,119 2,197 2,277 2,361 2,448 2,537 2,631 2,727 2,827 2,931 3,039 3,150 3,266 3,386 3,510 3,639 3,773
Saudi Arabia 1,051 1,093 1,137 1,182 1,229 1,278 1,330 1,383 1,438 1,495 1,555 1,617 1,682 1,749 1,819 1,892 1,968 2,046 2,128 2,213 2,302 2,394
UAE 713 734 756 779 803 827 853 878 905 933 961 990 1,020 1,051 1,083 1,116 1,150 1,185 1,221 1,258 1,296 1,335
Africa 1,818 1,883 1,950 2,020 2,092 2,167 2,244 2,324 2,407 2,493 2,581 2,673 2,769 2,867 2,970 3,076 3,185 3,299 3,416 3,538 3,664 3,795
Nigeria 89 92 95 98 101 105 108 112 116 120 124 128 132 137 141 146 151 156 162 167 173 179
South Africa 20 21 22 23 24 25 26 27 28 29 30 31 33 34 35 37 38 40 41 43 44 46
Forecast
Air Passenger Forecasts
Global - Annual Outlook (Passenger numbers)
This is a publication of IATA and is intended solely for use by paid subscribers. Reproduction or distribution of this foreca st, in whole or part, without permission of IATA is prohibited and subject to legal action. Ownership, distribution and use of this forecast and its contents are subject to the terms of the contract you have entered into with IATA. Source: IATA

To/from the World Note: full access to our forecast database is available through our online webtool. Please contact us for more details (contact details can be found on the Glossary tab).
Annual % change 2013 2014 2015 2016 2017 2018 2019 2020 2021 2022 2023 2024 2025 2026 2027 2028 2029 2030 2031 2032 2033 2034
Actual
Total 3.9% 5.6% 5.6% 5.6% 5.6% 5.6% 5.6% 5.6% 5.6% 5.6% 5.6% 5.6% 5.6% 5.6% 5.6% 5.6% 5.6% 5.6% 5.6% 5.6% 5.6% 5.6%
North America 5.1% 5.1% 5.1% 5.1% 5.1% 5.1% 5.1% 5.1% 5.1% 5.1% 5.1% 5.1% 5.1% 5.1% 5.1% 5.1% 5.1% 5.1% 5.1% 5.1% 5.1% 5.1%
Canada 5.3% 5.3% 5.3% 5.3% 5.3% 5.3% 5.3% 5.3% 5.3% 5.3% 5.3% 5.3% 5.3% 5.3% 5.3% 5.3% 5.3% 5.3% 5.3% 5.3% 5.3% 5.3%
United States 5.4% 5.4% 5.4% 5.4% 5.4% 5.4% 5.4% 5.4% 5.4% 5.4% 5.4% 5.4% 5.4% 5.4% 5.4% 5.4% 5.4% 5.4% 5.4% 5.4% 5.4% 5.4%
Europe 5.9% 5.9% 5.9% 5.9% 5.9% 5.9% 5.9% 5.9% 5.9% 5.9% 5.9% 5.9% 5.9% 5.9% 5.9% 5.9% 5.9% 5.9% 5.9% 5.9% 5.9% 5.9%
Germany 5.6% 5.6% 5.6% 5.6% 5.6% 5.6% 5.6% 5.6% 5.6% 5.6% 5.6% 5.6% 5.6% 5.6% 5.6% 5.6% 5.6% 5.6% 5.6% 5.6% 5.6% 5.6%
France 5.1% 5.1% 5.1% 5.1% 5.1% 5.1% 5.1% 5.1% 5.1% 5.1% 5.1% 5.1% 5.1% 5.1% 5.1% 5.1% 5.1% 5.1% 5.1% 5.1% 5.1% 5.1%
Italy 5.1% 5.1% 5.1% 5.1% 5.1% 5.1% 5.1% 5.1% 5.1% 5.1% 5.1% 5.1% 5.1% 5.1% 5.1% 5.1% 5.1% 5.1% 5.1% 5.1% 5.1% 5.1%
UK 5.6% 5.6% 5.6% 5.6% 5.6% 5.6% 5.6% 5.6% 5.6% 5.6% 5.6% 5.6% 5.6% 5.6% 5.6% 5.6% 5.6% 5.6% 5.6% 5.6% 5.6% 5.6%
Russia 5.2% 5.2% 5.2% 5.2% 5.2% 5.2% 5.2% 5.2% 5.2% 5.2% 5.2% 5.2% 5.2% 5.2% 5.2% 5.2% 5.2% 5.2% 5.2% 5.2% 5.2% 5.2%
Asia 5.9% 5.9% 5.9% 5.9% 5.9% 5.9% 5.9% 5.9% 5.9% 5.9% 5.9% 5.9% 5.9% 5.9% 5.9% 5.9% 5.9% 5.9% 5.9% 5.9% 5.9% 5.9%
Japan 5.8% 5.8% 5.8% 5.8% 5.8% 5.8% 5.8% 5.8% 5.8% 5.8% 5.8% 5.8% 5.8% 5.8% 5.8% 5.8% 5.8% 5.8% 5.8% 5.8% 5.8% 5.8%
China 5.5% 5.5% 5.5% 5.5% 5.5% 5.5% 5.5% 5.5% 5.5% 5.5% 5.5% 5.5% 5.5% 5.5% 5.5% 5.5% 5.5% 5.5% 5.5% 5.5% 5.5% 5.5%
India 5.5% 5.5% 5.5% 5.5% 5.5% 5.5% 5.5% 5.5% 5.5% 5.5% 5.5% 5.5% 5.5% 5.5% 5.5% 5.5% 5.5% 5.5% 5.5% 5.5% 5.5% 5.5%
Indonesia 5.6% 5.6% 5.6% 5.6% 5.6% 5.6% 5.6% 5.6% 5.6% 5.6% 5.6% 5.6% 5.6% 5.6% 5.6% 5.6% 5.6% 5.6% 5.6% 5.6% 5.6% 5.6%
Latin America 5.7% 5.7% 5.7% 5.7% 5.7% 5.7% 5.7% 5.7% 5.7% 5.7% 5.7% 5.7% 5.7% 5.7% 5.7% 5.7% 5.7% 5.7% 5.7% 5.7% 5.7% 5.7%
Brazil 5.5% 5.5% 5.5% 5.5% 5.5% 5.5% 5.5% 5.5% 5.5% 5.5% 5.5% 5.5% 5.5% 5.5% 5.5% 5.5% 5.5% 5.5% 5.5% 5.5% 5.5% 5.5%
Mexico 5.8% 5.8% 5.8% 5.8% 5.8% 5.8% 5.8% 5.8% 5.8% 5.8% 5.8% 5.8% 5.8% 5.8% 5.8% 5.8% 5.8% 5.8% 5.8% 5.8% 5.8% 5.8%
Middle East 5.2% 5.2% 5.2% 5.2% 5.2% 5.2% 5.2% 5.2% 5.2% 5.2% 5.2% 5.2% 5.2% 5.2% 5.2% 5.2% 5.2% 5.2% 5.2% 5.2% 5.2% 5.2%
Saudi Arabia 5.7% 5.7% 5.7% 5.7% 5.7% 5.7% 5.7% 5.7% 5.7% 5.7% 5.7% 5.7% 5.7% 5.7% 5.7% 5.7% 5.7% 5.7% 5.7% 5.7% 5.7% 5.7%
UAE 5.9% 5.9% 5.9% 5.9% 5.9% 5.9% 5.9% 5.9% 5.9% 5.9% 5.9% 5.9% 5.9% 5.9% 5.9% 5.9% 5.9% 5.9% 5.9% 5.9% 5.9% 5.9%
Africa 5.8% 5.8% 5.8% 5.8% 5.8% 5.8% 5.8% 5.8% 5.8% 5.8% 5.8% 5.8% 5.8% 5.8% 5.8% 5.8% 5.8% 5.8% 5.8% 5.8% 5.8% 5.8%
Nigeria 6.0% 6.0% 6.0% 6.0% 6.0% 6.0% 6.0% 6.0% 6.0% 6.0% 6.0% 6.0% 6.0% 6.0% 6.0% 6.0% 6.0% 6.0% 6.0% 6.0% 6.0% 6.0%
South Africa 5.6% 5.6% 5.6% 5.6% 5.6% 5.6% 5.6% 5.6% 5.6% 5.6% 5.6% 5.6% 5.6% 5.6% 5.6% 5.6% 5.6% 5.6% 5.6% 5.6% 5.6% 5.6%
Air Passenger Forecasts
Forecast
Global - Annual Scenario 1 Outlook (%)
This is a publication of IATA and is intended solely for use by paid subscribers. Reproduction or distribution of this forecast, in whole or part, without permission of IATA is prohibited and subject to legal action. Ownership, distribution and use of this forecast and its contents are subject to the terms of the contract you have entered into with IATA. Source: IATA
A Relaxing of Regulations; The fractious political landscapes in the developed world slowly begin to improve paving the way for faster adoption of required structural reforms while the brighter economic backdrop spreads to the emerging markets bringing the issue of air market liberalisation higher up the domestic agendas.
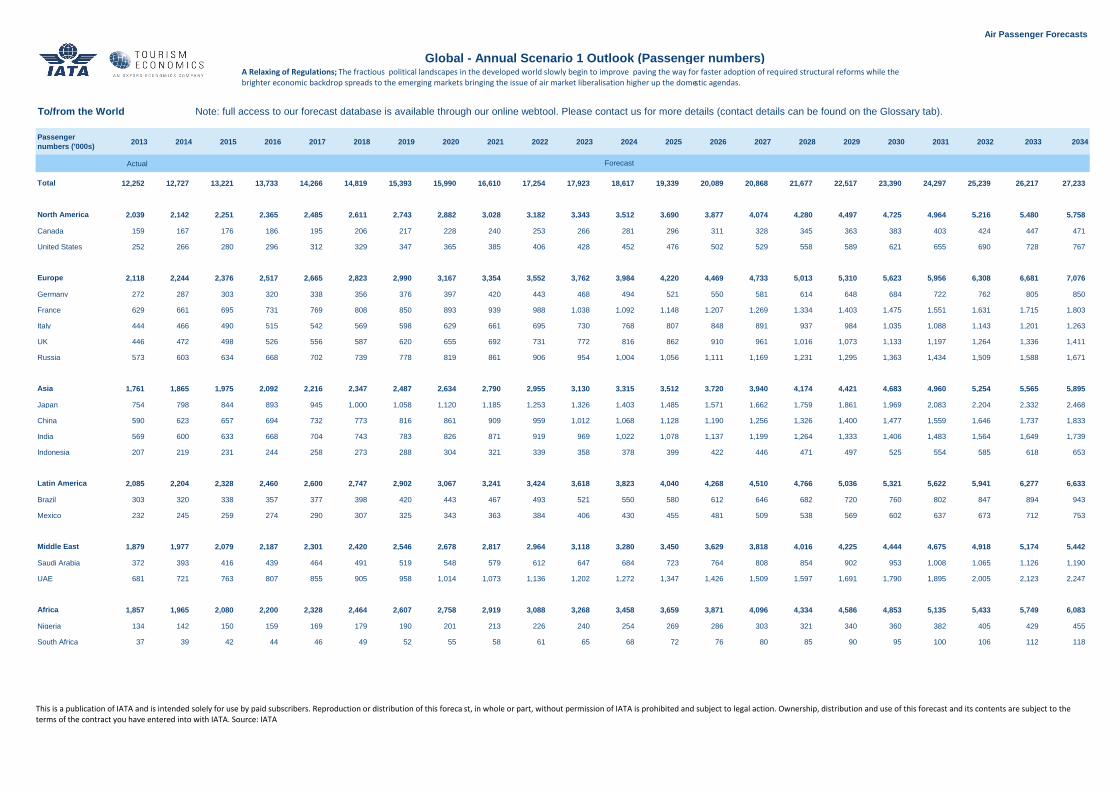
To/from the World Note: full access to our forecast database is available through our online webtool. Please contact us for more details (contact details can be found on the Glossary tab).
Passenger
numbers ('000s)2013 2014 2015 2016 2017 2018 2019 2020 2021 2022 2023 2024 2025 2026 2027 2028 2029 2030 2031 2032 2033 2034
Actual
Total 12,252 12,727 13,221 13,733 14,266 14,819 15,393 15,990 16,610 17,254 17,923 18,617 19,339 20,089 20,868 21,677 22,517 23,390 24,297 25,239 26,217 27,233
North America 2,039 2,142 2,251 2,365 2,485 2,611 2,743 2,882 3,028 3,182 3,343 3,512 3,690 3,877 4,074 4,280 4,497 4,725 4,964 5,216 5,480 5,758
Canada 159 167 176 186 195 206 217 228 240 253 266 281 296 311 328 345 363 383 403 424 447 471
United States 252 266 280 296 312 329 347 365 385 406 428 452 476 502 529 558 589 621 655 690 728 767
Europe 2,118 2,244 2,376 2,517 2,665 2,823 2,990 3,167 3,354 3,552 3,762 3,984 4,220 4,469 4,733 5,013 5,310 5,623 5,956 6,308 6,681 7,076
Germany 272 287 303 320 338 356 376 397 420 443 468 494 521 550 581 614 648 684 722 762 805 850
France 629 661 695 731 769 808 850 893 939 988 1,038 1,092 1,148 1,207 1,269 1,334 1,403 1,475 1,551 1,631 1,715 1,803
Italy 444 466 490 515 542 569 598 629 661 695 730 768 807 848 891 937 984 1,035 1,088 1,143 1,201 1,263
UK 446 472 498 526 556 587 620 655 692 731 772 816 862 910 961 1,016 1,073 1,133 1,197 1,264 1,336 1,411
Russia 573 603 634 668 702 739 778 819 861 906 954 1,004 1,056 1,111 1,169 1,231 1,295 1,363 1,434 1,509 1,588 1,671
Asia 1,761 1,865 1,975 2,092 2,216 2,347 2,487 2,634 2,790 2,955 3,130 3,315 3,512 3,720 3,940 4,174 4,421 4,683 4,960 5,254 5,565 5,895
Japan 754 798 844 893 945 1,000 1,058 1,120 1,185 1,253 1,326 1,403 1,485 1,571 1,662 1,759 1,861 1,969 2,083 2,204 2,332 2,468
China 590 623 657 694 732 773 816 861 909 959 1,012 1,068 1,128 1,190 1,256 1,326 1,400 1,477 1,559 1,646 1,737 1,833
India 569 600 633 668 704 743 783 826 871 919 969 1,022 1,078 1,137 1,199 1,264 1,333 1,406 1,483 1,564 1,649 1,739
Indonesia 207 219 231 244 258 273 288 304 321 339 358 378 399 422 446 471 497 525 554 585 618 653
Latin America 2,085 2,204 2,328 2,460 2,600 2,747 2,902 3,067 3,241 3,424 3,618 3,823 4,040 4,268 4,510 4,766 5,036 5,321 5,622 5,941 6,277 6,633
Brazil 303 320 338 357 377 398 420 443 467 493 521 550 580 612 646 682 720 760 802 847 894 943
Mexico 232 245 259 274 290 307 325 343 363 384 406 430 455 481 509 538 569 602 637 673 712 753
Middle East 1,879 1,977 2,079 2,187 2,301 2,420 2,546 2,678 2,817 2,964 3,118 3,280 3,450 3,629 3,818 4,016 4,225 4,444 4,675 4,918 5,174 5,442
Saudi Arabia 372 393 416 439 464 491 519 548 579 612 647 684 723 764 808 854 902 953 1,008 1,065 1,126 1,190
UAE 681 721 763 807 855 905 958 1,014 1,073 1,136 1,202 1,272 1,347 1,426 1,509 1,597 1,691 1,790 1,895 2,005 2,123 2,247
Africa 1,857 1,965 2,080 2,200 2,328 2,464 2,607 2,758 2,919 3,088 3,268 3,458 3,659 3,871 4,096 4,334 4,586 4,853 5,135 5,433 5,749 6,083
Nigeria 134 142 150 159 169 179 190 201 213 226 240 254 269 286 303 321 340 360 382 405 429 455
South Africa 37 39 42 44 46 49 52 55 58 61 65 68 72 76 80 85 90 95 100 106 112 118
Air Passenger Forecasts
Forecast
Global - Annual Scenario 1 Outlook (Passenger numbers)
This is a publication of IATA and is intended solely for use by paid subscribers. Reproduction or distribution of this foreca st, in whole or part, without permission of IATA is prohibited and subject to legal action. Ownership, distribution and use of this forecast and its contents are subject to the terms of the contract you have entered into with IATA. Source: IATA
A Relaxing of Regulations; The fractious political landscapes in the developed world slowly begin to improve paving the way for faster adoption of required structural reforms while the brighter economic backdrop spreads to the emerging markets bringing the issue of air market liberalisation higher up the domestic agendas.
To/from the World Note: full access to our forecast database is available through our online webtool. Please contact us for more details (contact details can be found on the Glossary tab).
Annual % change 2013 2014 2015 2016 2017 2018 2019 2020 2021 2022 2023 2024 2025 2026 2027 2028 2029 2030 2031 2032 2033 2034
Actual
Total 3.9% 1.0% 1.0% 1.0% 1.0% 1.0% 1.0% 1.0% 1.0% 1.0% 1.0% 1.0% 1.0% 1.0% 1.0% 1.0% 1.0% 1.0% 1.0% 1.0% 1.0% 1.0%
North America 1.4% 1.4% 1.4% 1.4% 1.4% 1.4% 1.4% 1.4% 1.4% 1.4% 1.4% 1.4% 1.4% 1.4% 1.4% 1.4% 1.4% 1.4% 1.4% 1.4% 1.4% 1.4%
Canada 1.3% 1.3% 1.3% 1.3% 1.3% 1.3% 1.3% 1.3% 1.3% 1.3% 1.3% 1.3% 1.3% 1.3% 1.3% 1.3% 1.3% 1.3% 1.3% 1.3% 1.3% 1.3%
United States 1.6% 1.6% 1.6% 1.6% 1.6% 1.6% 1.6% 1.6% 1.6% 1.6% 1.6% 1.6% 1.6% 1.6% 1.6% 1.6% 1.6% 1.6% 1.6% 1.6% 1.6% 1.6%
Europe 1.4% 1.4% 1.4% 1.4% 1.4% 1.4% 1.4% 1.4% 1.4% 1.4% 1.4% 1.4% 1.4% 1.4% 1.4% 1.4% 1.4% 1.4% 1.4% 1.4% 1.4% 1.4%
Germany 1.5% 1.5% 1.5% 1.5% 1.5% 1.5% 1.5% 1.5% 1.5% 1.5% 1.5% 1.5% 1.5% 1.5% 1.5% 1.5% 1.5% 1.5% 1.5% 1.5% 1.5% 1.5%
France 1.1% 1.1% 1.1% 1.1% 1.1% 1.1% 1.1% 1.1% 1.1% 1.1% 1.1% 1.1% 1.1% 1.1% 1.1% 1.1% 1.1% 1.1% 1.1% 1.1% 1.1% 1.1%
Italy 1.9% 1.9% 1.9% 1.9% 1.9% 1.9% 1.9% 1.9% 1.9% 1.9% 1.9% 1.9% 1.9% 1.9% 1.9% 1.9% 1.9% 1.9% 1.9% 1.9% 1.9% 1.9%
UK 1.9% 1.9% 1.9% 1.9% 1.9% 1.9% 1.9% 1.9% 1.9% 1.9% 1.9% 1.9% 1.9% 1.9% 1.9% 1.9% 1.9% 1.9% 1.9% 1.9% 1.9% 1.9%
Russia 1.8% 1.8% 1.8% 1.8% 1.8% 1.8% 1.8% 1.8% 1.8% 1.8% 1.8% 1.8% 1.8% 1.8% 1.8% 1.8% 1.8% 1.8% 1.8% 1.8% 1.8% 1.8%
Asia 1.4% 1.4% 1.4% 1.4% 1.4% 1.4% 1.4% 1.4% 1.4% 1.4% 1.4% 1.4% 1.4% 1.4% 1.4% 1.4% 1.4% 1.4% 1.4% 1.4% 1.4% 1.4%
Japan 1.5% 1.5% 1.5% 1.5% 1.5% 1.5% 1.5% 1.5% 1.5% 1.5% 1.5% 1.5% 1.5% 1.5% 1.5% 1.5% 1.5% 1.5% 1.5% 1.5% 1.5% 1.5%
China 2.0% 2.0% 2.0% 2.0% 2.0% 2.0% 2.0% 2.0% 2.0% 2.0% 2.0% 2.0% 2.0% 2.0% 2.0% 2.0% 2.0% 2.0% 2.0% 2.0% 2.0% 2.0%
India 1.9% 1.9% 1.9% 1.9% 1.9% 1.9% 1.9% 1.9% 1.9% 1.9% 1.9% 1.9% 1.9% 1.9% 1.9% 1.9% 1.9% 1.9% 1.9% 1.9% 1.9% 1.9%
Indonesia 2.0% 2.0% 2.0% 2.0% 2.0% 2.0% 2.0% 2.0% 2.0% 2.0% 2.0% 2.0% 2.0% 2.0% 2.0% 2.0% 2.0% 2.0% 2.0% 2.0% 2.0% 2.0%
Latin America 1.3% 1.3% 1.3% 1.3% 1.3% 1.3% 1.3% 1.3% 1.3% 1.3% 1.3% 1.3% 1.3% 1.3% 1.3% 1.3% 1.3% 1.3% 1.3% 1.3% 1.3% 1.3%
Brazil 1.2% 1.2% 1.2% 1.2% 1.2% 1.2% 1.2% 1.2% 1.2% 1.2% 1.2% 1.2% 1.2% 1.2% 1.2% 1.2% 1.2% 1.2% 1.2% 1.2% 1.2% 1.2%
Mexico 1.6% 1.6% 1.6% 1.6% 1.6% 1.6% 1.6% 1.6% 1.6% 1.6% 1.6% 1.6% 1.6% 1.6% 1.6% 1.6% 1.6% 1.6% 1.6% 1.6% 1.6% 1.6%
Middle East 1.8% 1.8% 1.8% 1.8% 1.8% 1.8% 1.8% 1.8% 1.8% 1.8% 1.8% 1.8% 1.8% 1.8% 1.8% 1.8% 1.8% 1.8% 1.8% 1.8% 1.8% 1.8%
Saudi Arabia 1.5% 1.5% 1.5% 1.5% 1.5% 1.5% 1.5% 1.5% 1.5% 1.5% 1.5% 1.5% 1.5% 1.5% 1.5% 1.5% 1.5% 1.5% 1.5% 1.5% 1.5% 1.5%
UAE 1.7% 1.7% 1.7% 1.7% 1.7% 1.7% 1.7% 1.7% 1.7% 1.7% 1.7% 1.7% 1.7% 1.7% 1.7% 1.7% 1.7% 1.7% 1.7% 1.7% 1.7% 1.7%
Africa 1.6% 1.6% 1.6% 1.6% 1.6% 1.6% 1.6% 1.6% 1.6% 1.6% 1.6% 1.6% 1.6% 1.6% 1.6% 1.6% 1.6% 1.6% 1.6% 1.6% 1.6% 1.6%
Nigeria 1.8% 1.8% 1.8% 1.8% 1.8% 1.8% 1.8% 1.8% 1.8% 1.8% 1.8% 1.8% 1.8% 1.8% 1.8% 1.8% 1.8% 1.8% 1.8% 1.8% 1.8% 1.8%
South Africa 1.6% 1.6% 1.6% 1.6% 1.6% 1.6% 1.6% 1.6% 1.6% 1.6% 1.6% 1.6% 1.6% 1.6% 1.6% 1.6% 1.6% 1.6% 1.6% 1.6% 1.6% 1.6%
Air Passenger Forecasts
Forecast
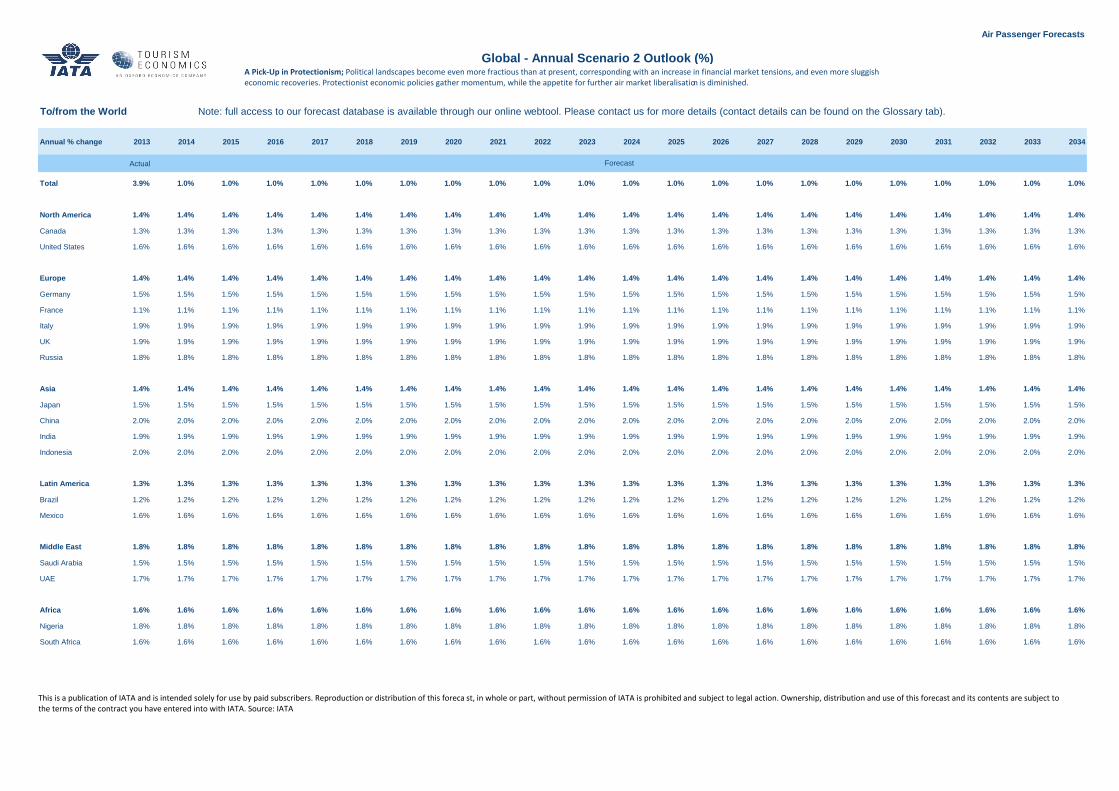
Global - Annual Scenario 2 Outlook (%)
This is a publication of IATA and is intended solely for use by paid subscribers. Reproduction or distribution of this foreca st, in whole or part, without permission of IATA is prohibited and subject to legal action. Ownership, distribution and use of this forecast and its contents are subject to the terms of the contract you have entered into with IATA. Source: IATA
A Pick-Up in Protectionism; Political landscapes become even more fractious than at present, corresponding with an increase in financial market tensions, and even more sluggish economic recoveries. Protectionist economic policies gather momentum, while the appetite for further air market liberalisation is diminished.

To/from the World Note: full access to our forecast database is available through our online webtool. Please contact us for more details (contact details can be found on the Glossary tab).
Passenger
numbers ('000s)2013 2014 2015 2016 2017 2018 2019 2020 2021 2022 2023 2024 2025 2026 2027 2028 2029 2030 2031 2032 2033 2034
Actual
Total 12,252 12,375 12,499 12,624 12,750 12,877 13,006 13,136 13,268 13,400 13,534 13,670 13,806 13,944 14,084 14,225 14,367 14,510 14,656 14,802 14,950 15,100
North America 1,384 1,404 1,424 1,444 1,464 1,485 1,506 1,527 1,548 1,570 1,592 1,615 1,637 1,660 1,684 1,707 1,731 1,756 1,781 1,806 1,831 1,857
Canada 116 118 119 121 123 124 126 127 129 131 132 134 136 138 139 141 143 145 147 149 151 153
United States 187 190 193 196 199 202 206 209 212 216 219 223 226 230 233 237 241 245 248 252 256 260
Europe 1,231 1,248 1,266 1,284 1,302 1,321 1,339 1,358 1,378 1,397 1,417 1,437 1,457 1,478 1,499 1,520 1,542 1,563 1,586 1,608 1,631 1,654
Germany 198 201 203 206 209 212 216 219 222 225 228 232 235 239 242 246 249 253 257 260 264 268
France 460 466 471 476 481 487 492 498 503 509 515 521 526 532 538 544 550 557 563 569 576 582
Italy 347 354 361 368 375 382 389 397 404 412 420 428 436 445 453 462 471 480 489 499 508 518
UK 334 340 347 353 360 366 373 380 387 395 402 410 417 425 433 441 449 458 466 475 484 493
Russia 441 449 457 466 474 483 492 501 510 520 529 539 549 559 570 580 591 602 613 624 636 647
Asia 1,491 1,513 1,534 1,556 1,578 1,600 1,623 1,646 1,670 1,693 1,718 1,742 1,767 1,792 1,817 1,843 1,869 1,896 1,923 1,950 1,978 2,006
Japan 539 547 555 564 572 580 589 597 606 615 624 633 643 652 662 671 681 691 701 712 722 733
China 447 456 465 474 484 493 503 513 523 533 543 554 565 576 587 599 611 622 635 647 660 673
India 433 441 450 458 467 476 485 494 504 513 523 533 543 554 564 575 586 597 609 620 632 644
Indonesia 156 160 163 166 169 172 176 179 183 186 190 194 197 201 205 209 213 217 222 226 230 235
Latin America 1,647 1,669 1,691 1,713 1,736 1,759 1,782 1,806 1,830 1,854 1,879 1,904 1,929 1,955 1,981 2,007 2,034 2,061 2,088 2,116 2,144 2,172
Brazil 217 220 222 225 228 230 233 236 239 242 245 248 251 254 257 260 263 266 269 273 276 279
Mexico 168 171 173 176 179 182 185 188 191 194 197 200 203 207 210 213 217 220 224 227 231 234
Middle East 1,255 1,277 1,300 1,323 1,347 1,371 1,396 1,421 1,447 1,473 1,499 1,526 1,553 1,581 1,610 1,639 1,668 1,698 1,729 1,760 1,791 1,823
Saudi Arabia 270 274 278 282 287 291 295 300 304 309 314 319 323 328 333 339 344 349 354 360 365 371
UAE 492 501 509 517 526 534 543 552 561 571 580 590 599 609 619 630 640 651 661 672 683 695
Africa 1,351 1,373 1,395 1,418 1,441 1,464 1,488 1,512 1,537 1,562 1,587 1,613 1,639 1,666 1,693 1,721 1,749 1,777 1,806 1,835 1,865 1,896
Nigeria 97 98 100 102 104 105 107 109 111 113 115 117 119 121 123 126 128 130 132 135 137 139
South Africa 27 28 28 29 29 29 30 30 31 31 32 32 33 33 34 34 35 36 36 37 37 38
Air Passenger Forecasts
Forecast
Global - Annual Scenario 2 Outlook (Passenger numbers)
This is a publication of IATA and is intended solely for use by paid subscribers. Reproduction or distribution of this forecast, in whole or part, without permission of IATA is prohibited and subject to legal action. Ownership, distribution and use of this forecast and its contents are subject to the terms of the contract you have entered into with IATA. Source: IATA
A Pick-Up in Protectionism; Political landscapes become even more fractious than at present, corresponding with an increase in financial market tensions, and even more sluggish economic recoveries. Protectionist economic policies gather momentum, while the appetite for further air market liberalisation is diminished.

About UsIATA
Contacts
David Oxley ([email protected])
Tourism Economics
Contacts
Dave Goodger ([email protected])
Glossary Country pair
Annual percentage change
Passenger market
Scenario 1
Scenario 2
Market
Compound Annual Growth Rate (CAGR)
Definition of passengers
Market and regional definitions
Air Passenger Forecasts
The International Air Transport Association (IATA) represents some 240 airlines comprising 84% of global air traffic. IATA's Economics team enjoys a strong reputation for delivering insightful analysis into aviation market and industry developments. IATA's comprehensive suite of
statistical services also offers timely access to high-quality intelligence into global air markets.
Tourism Economics is an Oxford Economics company with a singular focus on quantitative analysis of the travel industry. By combining rigorous modeling with industry knowledge, Tourism Economics develops custom market strategies, industry forecasts, policy analysis and economic
impact studies. Our parent company, Oxford Economics, is one of the world's leading providers of economic analysis, forecasts and consulting advice. Founded in 1981 as a joint venture with Oxford University's business college, Oxford Economics enjoys a reputation for high quality,
quatitative analysis and evidence-based advice.
The passenger numbers in our service are taken from IATA’s Passenger Intelligence Service (better known as PaxIS: www.pax-is.com) and are derived from ticket sales settled through IATA’s Billing and Settlement Plan offices around the world. The PaxIS data directly cover 80% of the
world ticket sales, but include accurate estimates of other sales channels such as direct sales by airlines and by low cost carriers, to capture 100% of traffic. The data cover scheduled flights only and measure the annual flow of air passengers between two countries on a bi-directional
basis (eg, the country pair ‘United States - United Kingdom’ includes passenger flows from the US to the UK as well as from the UK to the US). The country pairs are also reported on an origin-destination basis. For example, if a passenger flies from an origin in the UK to a destination in
the US via a connection in another country, the trip will be recorded as a passenger traveling from the UK to the US.
Note that the market totals are calculated from our underlying bi-directional country-pair forecasts. The individual markets therefore represent the total number of passenger journeys to, from and within a given market. As with the individual market totals, the regional numbers
represent the total number of passenger journeys to, from and within a given region. Note that for conceptual reasons, and to avoid double counting, regional totals do not equal the sum of their respective individual markets.
Market totals measure the annual flow of passenger to, from and within the country or region in question.
The smoothed annualized growth rate over a given time period. Calculated as (Ending Value / Beginning Value) ^ (1 / Number of Years) - 1.
Annual flow of air passengers between two countries on a bi-directional basis (eg, the country pair 'United States - United Kingdom' includes passenger flows from the US to the UK as well as from the UK to the US). The country pairs are reported on an origin-destination basis. For
example, if a passenger flies from an origin in the UK to a destination in the US via a connection in another country, the trip will be recorded as a passenger traveling from the UK to the US.
Amount of growth or decline from the same period last year. Calculated as ((This year - Last year) / Last Year) * 100.
The annual flow of air passengers to, from and within the market in question. Equals the sum of the country-pair flows for that country.
The fractious political landscapes in the developed world slowly begin to improve paving the way for faster adoption of required structural reforms while the brighter economic backdrop spreads to the emerging markets bringing the issue of air market liberalisation higher up the
domestic agendas.
Political landscapes become even more fractious than at present, corresponding with an increase in financial market tensions, and even more sluggish economic recoveries. Protectionist economic policies gather momentum, while the appetite for further air market liberalisation is
diminished.