Embed Size (px)
Citation preview

AIDA64 Engineer User manual
v 1.2
30. 07. 2014.

AIDA64 Engineer is developed by FinalWire Ltd.
Copyright © 1995 - 2014 FinalWire Kft.
This document was created by ABSEIRA Ltd. All rights reserved.
Copyright © 2010 - 2014 ABSEIRA Kft.
The names of actual companies and products mentioned herein may be the trademarks of their respective
owners.

AIDA64 Engineer Contents
2
CONTENTS
1 Introduction ....................................................................................................................................... 5
System requirements ..................................................................................................................... 5
User interface ................................................................................................................................. 6
2 Preferences ........................................................................................................................................ 7
Language ....................................................................................................................................... 7
General ........................................................................................................................................... 8
2.2.1 General ..................................................................................................................................... 8
2.2.2 NetUpdate ................................................................................................................................. 9
Layout ........................................................................................................................................... 10
Stability ......................................................................................................................................... 12
Report ........................................................................................................................................... 15
2.5.1 Report file ................................................................................................................................ 17
2.5.2 Report look .............................................................................................................................. 18
2.5.3 Remarks .................................................................................................................................. 18
E-mail ........................................................................................................................................... 19
2.6.1 SMTP ...................................................................................................................................... 19
Summary ...................................................................................................................................... 20
Content Filtering ........................................................................................................................... 20
Custom Components ................................................................................................................... 21
Hardware monitoring .................................................................................................................... 22
2.10.1 Update frequency .................................................................................................................... 23
2.10.2 Sensor icons ........................................................................................................................... 23
2.10.3 OSD ........................................................................................................................................ 24
2.10.4 Desktop gadgets ..................................................................................................................... 25
2.10.5 LCD ......................................................................................................................................... 26
2.10.6 SensorPanel ............................................................................................................................ 28
2.10.7 Logging ................................................................................................................................... 29

AIDA64 Engineer Contents
3
2.10.8 External applications ............................................................................................................... 30
2.10.9 Alerting .................................................................................................................................... 33
2.10.10 Correction ................................................................................................................................ 34
3 View .................................................................................................................................................. 35
4 Report ............................................................................................................................................... 36
Report Wizard .............................................................................................................................. 36
4.1.1 Report profiles ......................................................................................................................... 37
4.1.2 Report format .......................................................................................................................... 38
Quick report .................................................................................................................................. 38
Submit report to FinalWire ........................................................................................................... 39
Report review ............................................................................................................................... 39
5 Favorites .......................................................................................................................................... 40
6 Tools ................................................................................................................................................. 41
Disk benchmark............................................................................................................................ 41
Cache and memory benchmark ................................................................................................... 42
GPGPU Benchmark ..................................................................................................................... 43
6.3.1 The GPGPU Benchmark Panel's user interface ..................................................................... 45
ACPI Browser ............................................................................................................................... 45
DRAM Timings ............................................................................................................................. 46
Monitor Diagnostics ...................................................................................................................... 47
System Stability Test .................................................................................................................... 49
AIDA64 CPUID ............................................................................................................................. 49
7 Help ................................................................................................................................................... 50
AIDA64 Help................................................................................................................................. 50
AIDA64 Online.............................................................................................................................. 50
AIDA64 forum ............................................................................................................................... 51
Contact ......................................................................................................................................... 51
License ......................................................................................................................................... 52
Command-line options ................................................................................................................. 52
AIDA64 Engineer Contents
4
7.6.1 Report ..................................................................................................................................... 53
7.6.2 Report profile ........................................................................................................................... 53
7.6.3 Report format .......................................................................................................................... 53
7.6.4 Language ................................................................................................................................ 54
7.6.5 Troubleshooting ...................................................................................................................... 54
7.6.6 Miscellaneous ......................................................................................................................... 54
7.6.7 Variables ................................................................................................................................. 55
Entering Product Key, License Information .................................................................................. 55
7.7.1 Lost product registration key ................................................................................................... 55
Check for updates ........................................................................................................................ 56
About ............................................................................................................................................ 56
8 Page menu ....................................................................................................................................... 57
Computer ...................................................................................................................................... 57
Motherboard ................................................................................................................................. 58
Operating system ......................................................................................................................... 60
Server ........................................................................................................................................... 61
Display .......................................................................................................................................... 62
Multimedia .................................................................................................................................... 63
Storage ......................................................................................................................................... 64
Network ........................................................................................................................................ 66
DirectX .......................................................................................................................................... 67
Devices ......................................................................................................................................... 68
Software ....................................................................................................................................... 69
Security ........................................................................................................................................ 70
Config ........................................................................................................................................... 71
Database ...................................................................................................................................... 72
Benchmark ................................................................................................................................... 72
9 Contact ............................................................................................................................................. 74

AIDA64 Engineer Introduction
5
1 INTRODUCTION
AIDA64 Engineer is an industry-leading system information, diagnostic and benchmarking solution for
corporate IT technicians and engineers. It offers exhaustive computer analysis, benchmarks optimized for the
latest technologies, advanced hardware monitoring and diagnostics, and support for command-line options.
The software can be easily deployed in a corporate environment following the instructions in the Setup Guide
downloadable from our website.
SYSTEM REQUIREMENTS
Operating systems:
Windows 95 / 98 / Me
Windows NT4 / 2000
Windows XP
Windows PE
Windows Server 2003
Windows Vista
Windows Server 2008
Windows 7
Windows Server 2008 R2
Windows 8
Windows 8.1
Windows Server 2012
Windows Server 2012 R2
Processor: Intel Pentium or newer
Memory: 32 MB or more (or 128 MB or more for running the benchmarks)
Available hard drive space: 40 MB
AIDA64 is completely vendor-independent and is compatible with all PCs running 32-bit and 64-bit Microsoft
Windows operating systems. As far as the available functions are concerned, it is irrelevant if we run AIDA64
on a server or client operating system.

AIDA64 Engineer Introduction
6
USER INTERFACE
The main functions of AIDA64 are accessible from the Menu bar. Below the Menu bar, we can find the Toolbar,
with which we can navigate through the pages. Located in the left column below the Toolbar, the Page menu
displays a list of hardware and software categories, details of which open in the information windows on the
right.
The Page menu list is grouped into the following categories:
Computer
Motherboard
Operating System
Server
Display
Multimedia
Storage
Network
DirectX
Devices
Software
Security
Config
Database
Benchmark
The information window displays specific information pertaining to each category from the page menu. A right-
click on any single item will copy the related page information to the clipboard.
AIDA64 Engineer Preferences
7
2 PREFERENCES
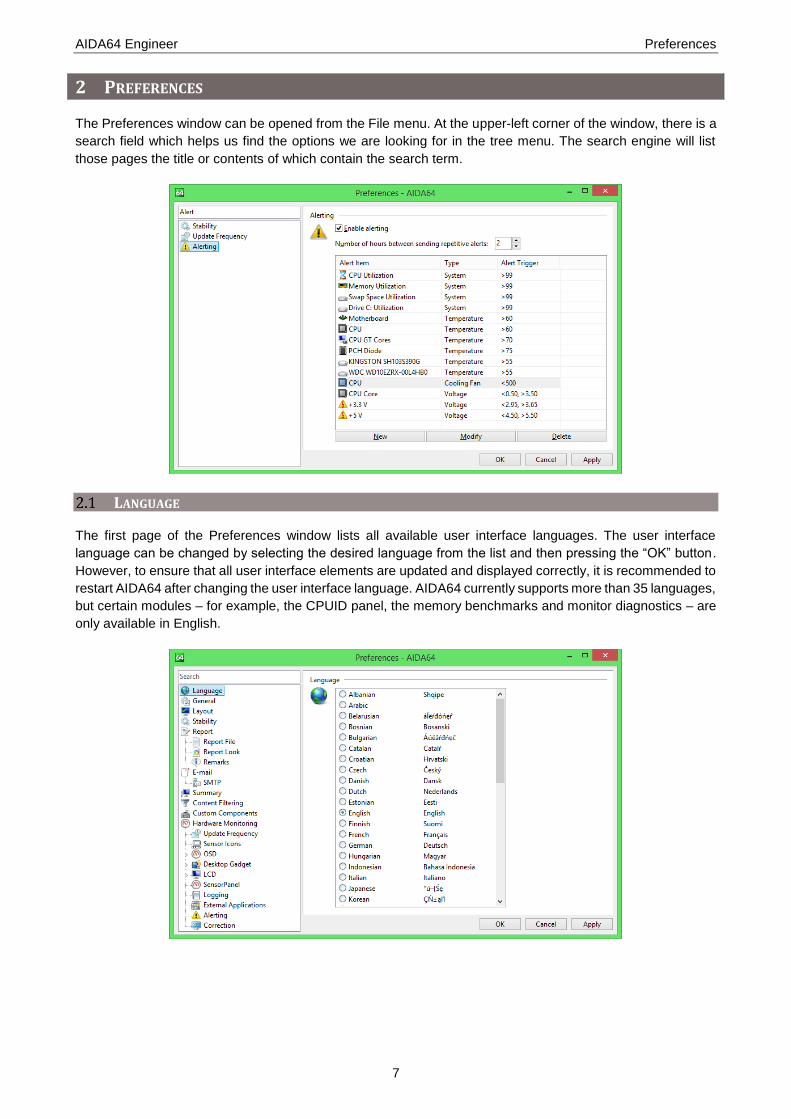
The Preferences window can be opened from the File menu. At the upper-left corner of the window, there is a
search field which helps us find the options we are looking for in the tree menu. The search engine will list
those pages the title or contents of which contain the search term.
LANGUAGE
The first page of the Preferences window lists all available user interface languages. The user interface
language can be changed by selecting the desired language from the list and then pressing the “OK” button.
However, to ensure that all user interface elements are updated and displayed correctly, it is recommended to
restart AIDA64 after changing the user interface language. AIDA64 currently supports more than 35 languages,
but certain modules – for example, the CPUID panel, the memory benchmarks and monitor diagnostics – are
only available in English.

AIDA64 Engineer Preferences
8
GENERAL
On the General tab, we can find the general AIDA64 settings, for example, we can define how the software
starts or how often it looks for software updates.
2.2.1 GENERAL
Display AIDA64 in the Control Panel
With this option, we can display the AIDA64 icon in the Windows Control Panel so that we can launch AIDA64
directly from the Control Panel.
Load AIDA64 at Windows startup
With this option enabled, AIDA64 will load automatically when Windows starts.
Display AIDA64 splash screen at startup
With this option enabled, AIDA64 will display the AIDA64 splash screen when the software starts.
“Minimize” button minimizes main window to System Tray
This option changes the default behavior of the Minimize button to close the AIDA64 main window to the
System Tray (instead of the Taskbar).
“Close” button minimizes main window to System Tray
This option changes the default behavior of the Close button to close the AIDA64 main window to the System
Tray.
Icon style
When this option is set to Windows XP or Windows 7, the relevant 32-bit alpha channel icons (in the style of
Windows XP or Windows 7) are displayed under Windows XP and later operating systems. This feature is
available only when the AIDA_ICONSXP.DLL or AIDA_ICONS7.DLL file presents.
AIDA64 Engineer Preferences
9
When AIDA64 starts
With this option, we can configure the behavior of the AIDA64 main window after startup.
2.2.2 NETUPDATE
Check for updates
Here we can set how often we want AIDA64 to look for updates. A fully automated online update is only
available when AIDA64 is activated with a valid product key and only until the expiry of the support period.
During the 30-day trial period – or when AIDA64 is activated with a non-genuine product key – only a
notification is sent about new product updates, and a manual software update is required.
Available options are:
Never
Once a day
Once a week
Once a month
Update type
This option can be used to select which updates to use. It is not recommended to use beta updates for AIDA64
Engineer. AIDA64 stable updates are released about 5 times a year.
Available options are:
Stable updates only
Stable and beta updates
Save update packages to local folder
This option can be used to backup AIDA64 update packages to a local folder. Besides the ZIP format update
package, a text file holding changelog information is also saved to the specified folder after a successful
software update.

AIDA64 Engineer Preferences
10
LAYOUT
With the options available on the Layout tab on the Preferences window, we can configure the user interface
and the layout of AIDA64.
Enable “ASPI” page
This option displays or hides the Storage / ASPI page which shows information about ASPI devices. In some
very rare scenarios, AIDA64 may lock up or cause an application fault when the ASPI page is opened. In such
cases disabling the ASPI page can resolve the problem.
Enable “Audio Codecs” page
This option displays or hides the Multimedia / Audio Codecs page which shows information about the available
audio codecs. This page may not be necessary when doing network audit or remote control, and in such
scenarios, disabling it can save up to 10 MB of system memory.
Enable “DMI” page
This option displays or hides the Computer / DMI page which displays information about the BIOS, the
motherboard, the chassis, the controllers as well as the slots, connectors and sockets integrated on the
motherboard. The reliability and accuracy of DMI information depends on the motherboard or computer
manufacturer responsible for providing this data. It is recommended that this page is disabled if DMI data seem
inaccurate.
Enable “OpenAL” page
This option displays or hides the Multimedia / OpenAL page which displays information about the Open AL
interface. OpenAL API calls may cause application or operating system faults when the audio driver does not
fully conform to industry-accepted standards.
Enable “OpenGL” page
This option displays or hides the Display / OpenGL page which displays information about the OpenGL
interface. OpenGL API calls may cause application or operating system faults when the video driver does not
fully conform to industry-accepted standards.
AIDA64 Engineer Preferences
11
Enable “DirectX” menu
This option displays or hides all pages under the DirectX menu.
Enable “Config” menu
This option displays or hides all pages under Config menu which displays certain Windows-related information.
Enable “Database” menu
This option displays or hides all pages under the Database menu which displays information about the installed
database management software, drivers and data sources.
Enable “Benchmark” menu
This option displays or hides all pages under the Benchmark category.
Sort menu and submenu items alphabetically
This option sorts the Page menu captions alphabetically. This option may simplify navigation in the Page menu
when a lot of pages are enabled.
Hide icon and bubble in Notification Area
This option displays or hides the AIDA64 icon on the System Tray (also known as the Notification Area). This
includes the bubble shown for specific events under Windows 2000 and later operating systems.
Remember main window position
AIDA64 saves and restores the main window position when this option is enabled. The AIDA64 main window
will always be displayed on the desktop centre when this setting is disabled.
Remember main window size
AIDA64 saves and restores the main window size (both width and height) when this option is enabled. The
AIDA64 main window will be displayed using the default 800x600 window size when this setting is disabled.
Remember page menu state
AIDA64 saves and restores the page menu state when this option is enabled. Page menu state means the
expanded or collapsed state of each menu item in the page menu.
Remember last selected page
AIDA64 displays the last selected page when this option is enabled.
Hide the best benchmark reference results
With this option, we can hide the top half of the scores in the benchmark reference results list, which may be
useful on older computers.

AIDA64 Engineer Preferences
12
STABILITY
In this menu, we can enable or disable the low-level hardware detection modules of AIDA64 – some of which
can cause system hang-ups in rare scenarios. When experiencing stability issues, these options can be used
to make AIDA64 work properly.
These low-level modules can be disabled from the command line, too. If we launch AIDA64 using the /SAFE
or /SAFEST command line options we can disable some critical low-level hardware detection functions to
ensure system stability.
Load kernel driver
In most cases, stability issues can be avoided by preventing the AIDA64 kernel driver from loading.
Low-level MSR operations
Here we can disable MSR instructions (RDMSR and WRMSR). When this option is disabled, CPU FSB and
CPU multiplier detection will not be provided.
Low-level PCI bus operations
With this option, we can control whether AIDA64 uses low-level PCI bus scanning that may cause system
lockup in outdated systems, typically equipped with S3 or Trident PCI video cards. When this option is disabled,
motherboard chipset, motherboard bus, GPU, SPD and sensor information will not be available.
Low-level SMBus operations
With this option, we can control whether AIDA64 uses low-level SMBus scanning that may cause system
lockup in rare cases. When this option is disabled, SPD and sensor information will not be available.
AIDA64 Engineer Preferences
13
Low-level sensor operations
With this option, we can control whether AIDA64 uses low-level sensor scanning that may lead to system
lockups or warnings, or cause the CPU fan to stop in rare cases. When this option is disabled, no sensor
information will be provided.
Fan divisor reconfiguration
With this option, we can control whether AIDA64 uses the fan divisor reconfiguration feature of the hardware
monitoring module. Fan divisor reconfiguration ensures that the status of all fans (including low-RPM fans) can
be detected properly. However, the applications MSI Core Cell and PC Alert collide with software that
reconfigure fan divisors, so AIDA64 can be used simultaneously with these only if this option is disabled.
Low-level SMART operations
With this option, we can control whether AIDA64 uses low-level SMART disk calls that may cause system
lockup in rare cases. When this option is disabled, no hard disk temperature and SMART disk health status
information will be provided.
RAID member enumeration
With this option, we can enable or disable low-level RAID member enumeration calls for RAID arrays that may
cause system lockup in rare cases. When this option is disabled, no ATA autodetect information or SMART
disk health status information can be provided for RAID arrays.
RAID SMART support
With this option, we can control whether AIDA64 uses low-level SMART disk calls for RAID arrays that may
cause system lockup in rare cases. When this option is disabled, no hard disk temperature and SMART disk
health status information will be provided for RAID arrays.
nVIDIA GPU SMBus access through NVGPIO
This option can be used to improve the stability of GPU sensor readout on Asus graphics cards with Asus
SmartDoctor installed and running.
Change to 3D profile on nVIDIA video adapters
When this option is enabled, the GPU detection module of AIDA64 will switch to 3D profile. This way, the
software can measure the maximum clock speed of the GPU. However, when the video adapter switches to
3D profile the GPU fan speed may also increase.
SMBus access through ACPI
This option can be used on Asus motherboards to avoid collisions between the AIDA64 hardware monitoring
module and Asus' own hardware monitoring and overclocking applications (e.g. Asus AI Booster, Asus AI
Suite, Asus PC Probe II, Asus SixEngine, etc). This option must not be enabled on PCs with non-Asus
motherboards.
Apple SMC sensor support
With this option, we can control whether AIDA64 uses low-level features to measure temperatures and cooling
fan speeds via Apple SMC sensors. In rare cases, polling the Apple SMC sensor device may cause system
instability.

AIDA64 Engineer Preferences
14
Asus ATKEX sensor support (Asus ROG)
With this option, we can control whether AIDA64 uses low-level features to measure temperatures and cooling
fan speeds via Asus ATKEX driver calls on Asus ROG motherboards. This option can only be used when the
Asus AI Suite is installed.
Dell SMI sensor support
With this option, we can control whether AIDA64 uses low-level features to measure temperatures and cooling
fan speeds via Dell SMI sensors. In rare cases, polling the Dell SMI sensor device may cause system
slowdowns or lockup.
HID UPS sensor support
With this option, we can control whether AIDA64 uses low-level features to monitor battery power and voltages
via HID UPS sensors. In rare cases, polling HID UPS sensors may cause system slowdown.
Koolance TMS-200 sensor support
With this option, we can control whether AIDA64 uses low-level features to measure temperatures and cooling
fan speeds via Koolance TMS-200 family sensor devices. To avoid potential incompatibility issues this option
is disabled by default, and has only to be enabled when a Koolance TMS-200 device is connected to the
system.
T-Balancer sensor support
With this option, we can control whether AIDA64 uses low-level features to measure temperatures via T-
Balancer sensor devices.
DIMM thermal sensor support
With this option, we can control whether AIDA64 uses low-level features to measure temperatures of DIMM
memory modules using SMBus operations. To avoid potential incompatibility issues this option is disabled by
default, and has only to be enabled when a thermal sensor capable memory module is installed.
Toshiba TVALZ sensor support
With this option, we can control whether AIDA64 uses low-level features to measure cooling fan speeds via
Toshiba TVALZ sensors. In rare cases polling the Toshiba TVALZ sensor device may cause system instability.
Volterra VT11xx sensor support
With this option, we can control whether AIDA64 uses low-level features to measure temperature, voltage and
power draw via Volterra VT11xx GPU sensor chips. In rare cases polling a Volterra VT11xx sensor chip may
cause system instability while running 3D games.
GPU sensor support
With this option, we can control whether AIDA64 uses low-level features to measure temperature, voltage and
cooling fan speeds on AMD and NVIDIA graphics cards. In rare cases, polling GPU sensors may cause system
slowdowns or lockup.

AIDA64 Engineer Preferences
15
GPU fan speed measurement
With this option, we can control whether AIDA64 uses low-level features to measure cooling fan speeds for
AMD and NVIDIA video cards. In rare cases polling GPU fans may cause system instability or automatic fan
speed control issues.
Multi-GPU support
With this option, we can control whether AIDA64 uses multi-GPU features. On AMD CrossFireX configurations
(including multi-GPU AMD video cards like Radeon HD 5970) the ULPS power-saving feature of the AMD
Catalyst video driver may cause various issues while running AIDA64. In such cases, multi-GPU support has
to be disabled to restore system stability.
Wake up GPUs at AIDA64 startup
When we have more than one graphics processors in our computer, AIDA64 may not be able to detect those
devices that are deactivated by default (for example, on notebooks equipped with NVIDIA Optimus
technology). If we want the software to list all available GPUs we have to enable this option.
REPORT
This page lists several options to customize the report creation process.
Report title
This option specifies the first line of the reports.
Enable report header
When this option is enabled, several important information about the report creation (including AIDA64 version,
report type, computer name, user name, operating system type & version, creation date & time) is displayed
on the top of the reports. It is recommended that this option is enabled during network audit. When HTML and
MHTML reports are created for printing purposes, we may choose to disable both report header and report
footer to save paper space.
Enable report footer
When this option is enabled, a short disclaimer message appears at the end of HTML and MHTML report files.

AIDA64 Engineer Preferences
16
Enable HTML report menu
The HTML report menu is a drop-down list of quick links to individual categories and subcategories which
makes locating information easier in HTML reports. This option is enabled by default.
Include debug information in the report
When this option is enabled, a dump of PCI registers and video BIOS appears at the end of TXT, HTML,
MHTML reports. Debug information is important when contacting AIDA64 Technical Support with hardware
detection issues, so please make sure to enable this option before submitting any reports to AIDA64 Technical
support.
Show computer name in caption of the first report page
When this option is enabled, the computer name is displayed in the caption of the Computer / Summary page
in the reports. This option is useful when HTML or MHTML reports are printed or filed and the report header is
disabled.
Compress reports before saving to file
When this option is enabled, reports are compressed (using ZIP) before they are saved to file.
Compress reports before sending in e-mail
When this option is enabled, reports are compressed before they are attached to the e-mail.
Full name
This option specifies the name that appears in the “From” field of outgoing e-mail messages.
E-mail address
This option specifies the e-mail address that appears in the “From” field of outgoing e-mail messages.

AIDA64 Engineer Preferences
17
2.5.1 REPORT FILE
Output folder
This page lists several options to configure report file creation. Among other things, we can specify the default
output folder for saving reports: this is where reports will be saved if we do not define a path in the command-
line. During network report, this folder should be a UNC path (for example: \\computer\share\folder), and all
users should only have write permission to this folder. We can use the following variables in both the output
folder name and the file name:
$HOSTNAME – Inserts host name
$USERNAME – Inserts current user name
$DOMAIN – Inserts current logon domain
$IPADDR – Inserts primary network adapter IP address (aaa-bbb-ccc-ddd)
$MACADDQ – Inserts primary network adapter MAC address (AABBCCDDEEFF)
$MACADDR – Inserts primary network adapter MAC address separated by hyphens
(AA-BB-CC-DD-EE-FF)
$UUIDMAC – Inserts DMI System UUID. When this is not available, it inserts MAC address
(00000000-00000000-0000AABB-CCDDEEFF)
$MONTH – Inserts current month (MM)
$DATE – Inserts current date (YYYY-MM-DD)
$TIME – Inserts current time (HH-MM-SS)
File name
This option specifies the file name to be used when the reports are saved to file. For network audits, either in
the output folder name or the file name one of the variables (listed above) has to be used to prevent computers
from overwriting the report files.
File extension
This option specifies the file name extension to be appended to the report file name. It is recommended that
we keep the default “automatic” option. This option does not modify the report format, it specifies the file name
extension only.

AIDA64 Engineer Preferences
18
2.5.2 REPORT LOOK
This page allows us to customize the look of the reports. We can select fonts, font size and color, we can apply
styles (bold, italic) and change the background color of the reports. These settings are applicable for HTML
and MHTML reports only.
2.5.3 REMARKS
We can add remarks to the reports. These remarks will appear on the top of the reports.
If we write “ALL” in the computer name field or press the “All” button, the remarks will appear in the reports of
every computer. If we add computers individually only the reports of the listed computers will contain the
remarks.
For example, we can indicate in the reports why we needed to create them.

AIDA64 Engineer Preferences
19
If we want to receive e-mail notifications of any alert events we need to configure the e-mail settings. Here we
can specify the e-mail address to which we would like AIDA64 to send the reports (To:, Cc: and Bcc:
addresses). If we save our reports to a TXT file and we enable the option “Embed TXT reports to e-mail body”,
the report content will be part of the message body (and will not be attached). The “Test” button can be used
to send a test alert message.
SMTP is the recommended protocol for network audit. SMTP can be configured in the following submenu.
2.6.1 SMTP
Here we need to add a display name of our choice, our e-mail address and the address of the SMTP server
we use. If we use an SMTP port other than the default (port 25) we have to specify it here. If we use SMTP
authentication we can add the user name and password here.
To use TLS for Gmail, choose “smtp.gmail.com” as the server with the SMTP port set to 25 or 587.

AIDA64 Engineer Preferences
20
SUMMARY
Each line of the Computer /
Summary page can be either shown
or hidden by checking or unchecking
the check boxes in this list. The
software uses these settings for
creating reports too, so here we can
select the components we would like
to see in the reports, when we create
reports using the “System summary
only” option in Report Wizard or the
/SUM command-line switch. This
works in the same way as creating
reports of selected pages that can be
loaded later from a file, the
difference being that Summary
settings are stored together with all
other settings in the aida64.ini file
(under the INI group heading “[Sum]”).
CONTENT FILTERING
AIDA64 also has access to Windows event logs, IE Cookies and browser history. Various settings are available
to filter these on the Content Filtering page in the Preferences menu. These can come in very handy as usually
we do not want to thumb through entire event logs containing lots of irrelevant information- rather, we are
typically interested in errors and warnings only.
We can configure AIDA64 to list all events or events from the last few days only. (If we create reports on a
daily basis it is recommended to select 1 day here.) We can also select the kind of events we want to see in
the list. If we want to get rid of several pages of potentially irrelevant information, we need to uncheck the “List
Information events” and “List Warning event” options.
Under the heading “IE Cookies and Browser History Filtering” we can also select a time period for which we
want to see information. We can also select to get file:// and http:// entries listed.

AIDA64 Engineer Preferences
21
CUSTOM COMPONENTS
Custom Components can be used to specify such hardware components that cannot be detected using
conventional hardware auditing methods. The information about pre-configured Custom Components will
appear on the Computer / Summary page. We can add custom components to individual computers or – if we
write “ALL” in the computer name field or press the “All” button – to all computers in the network at once.

AIDA64 Engineer Preferences
22
HARDWARE MONITORING
In this window, we can configure the hardware monitoring services.
Display temperatures in Fahrenheit
In the sensor icons, the OSD panel, the Desktop Gadget and the SensorPanel, temperature values are
displayed in Fahrenheit (rather than Celsius) when this option is enabled.
Enable CPU throttling measurement
This option can be used to enable CPU throttling measurement on Intel processors. Measuring throttling may
cause system instability. Throttling is a self-protection mechanism in Intel processors to prevent physical
damage due to overheating.
Enable disk temperature measurement
Here we can enable or disable disk temperature monitoring.
Disk temperature polling frequency
With this option, we can configure the interval between disk temperature measurements. Setting this option to
less than 20 seconds may result in data corruption on older hard disk drives. For modern HDDs and SSDs, it
is safe to enter any value of our choice.
Decimal digits for voltage values
With this option, we can set the number of decimal digits to be displayed for voltage readings. For modern
computers, selecting at least 3 digits is recommended.
Decimal digits for clock speeds
With this option, we can set the number of decimal digits to be displayed for clock speeds, e.g. CPU core clock,
FSB clock and memory clock.

AIDA64 Engineer Preferences
23
Tjmax temperature
With this option, we can set the Tjmax temperature that is used to calculate core temperature readings for Intel
processors. When “Automatic” is selected, AIDA64 will use the default values as defined in the Intel Digital
Thermal Sensors (DTS) specifications.
Degree symbol
With this option, we can configure the character to be used as a degree symbol for temperature readings.
2.10.1 UPDATE FREQUENCY
Here we can set the update frequency for the Computer / Sensor page, the Display / GPU page, the Sensor
Icons, the OSD panel, the Desktop Gadget, the Logitech LCD, the SensorPanel and the external applications
function, and configure the logging interval for the hardware monitoring logs and the alerting function.
When using T-Balancer miniNG or bigNG devices, it is strongly recommended to choose an update frequency
of at least 2 seconds.
2.10.2 SENSOR ICONS
Here we can activate and customize the AIDA64 sensor icons displayed on the System Tray in Windows. If
we enable this function the sensor icon items selected here will be displayed on the taskbar. We can also
customize the background and text color for each icon. When sensor icons are enabled a different AIDA64
icon is visible in the System Tray.

AIDA64 Engineer Preferences
24
2.10.3 OSD
Here we can customize the AIDA64 OSD panel, which
displays the user-selected sensor items in a window on
the Windows desktop.
Show OSD panel
Here we can enable or disable the OSD panel.
Display icons on OSD panel
Both text and icons are displayed in the OSD panel when
this option is enabled. Otherwise, only the text displaying
the sensor readings is visible.
Display labels on OSD panel
Labels are displayed on the OSD panel when this option is enabled.
Align items to the right
Items are aligned to the right on the OSD panel when this option is enabled. Otherwise, the items are aligned
to the left.
Keep OSD the topmost window
When this option is enabled, the OSD panel is always visible on top of all other windows. This feature is also
called “always on top”.
OSD panel background color
Here we can customize the background color for the OSD panel. Background color should be selected to
ensure proper text readability.
OSD panel transparency
Here we can set the transparency level of the OSD panel. Window transparency level adjustment is not
supported under Windows 95, 98, Me and NT 4.0.

AIDA64 Engineer Preferences
25
2.10.3.1 OSD items
Here we can select the items we want to display on the OSD panel. Double-clicking or selecting an item will
display the settings window for the item, where we can customize its layout. Here we can modify the default
label (or restore it), select the font and configure the font size, font color and font property for the displayed
text.
2.10.4 DESKTOP GADGETS
Here we can choose to display sensor values on a Desktop gadget. Desktop gadgets are natively supported
in Windows Vista, Windows Server 2008 and Windows 7, while an extension pack needs to be installed in
Windows XP and Windows 8 to enable them (“Vista 5744 Sidebar for XP” and „8GadgetPack - Gadgets for
Windows 8”, respectively).
When the option “Use HKLM in Registry” is enabled, AIDA64 stores
measured temperature, voltage and fan speed values in the root key
HKEY_LOCAL_MACHINE in the Registry. Otherwise, the values are stored
in the root key HKEY_CURRENT_USER.
We can customize the layout of the desktop gadget by clicking the wrench
icon that appears when we hover the mouse over the gadget itself. It will
display the options window where we can configure how we want to align the
text and we can choose to break up long texts into multiple lines. If the latter
option is disabled, long lines may not be fully visible in the gadget. We can
also enable/disable the “AIDA64 Engineer” header and the labels.
We can customize the gadget colors either by selecting a predefined color
theme or by defining the background top, background bottom, header text
and border colors manually.
AIDA64 Engineer Preferences
26
2.10.4.1 Desktop gadget items
Here we can select the items we want to display on the Desktop gadget. Double-clicking or selecting an item
will display the settings window for the item, where we can customize its layout. Here we can modify the default
label (or restore it), select the font and configure the font size, font color and font property for the displayed
text.
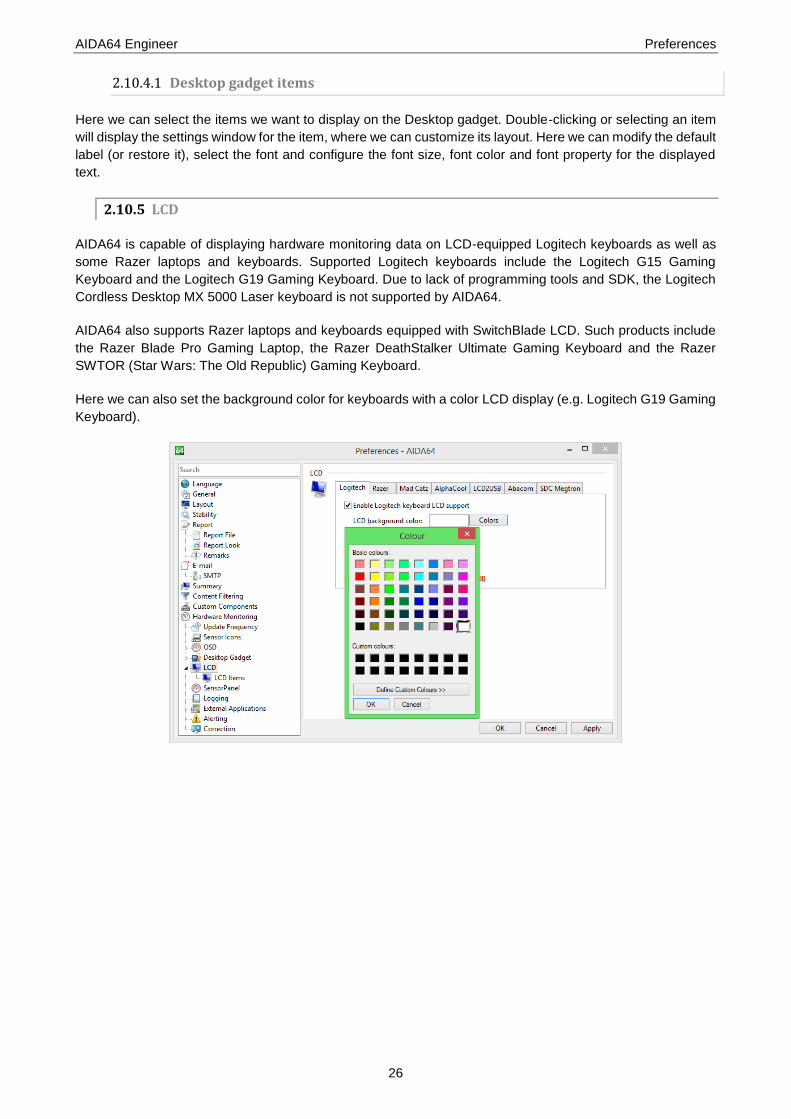
2.10.5 LCD
AIDA64 is capable of displaying hardware monitoring data on LCD-equipped Logitech keyboards as well as
some Razer laptops and keyboards. Supported Logitech keyboards include the Logitech G15 Gaming
Keyboard and the Logitech G19 Gaming Keyboard. Due to lack of programming tools and SDK, the Logitech
Cordless Desktop MX 5000 Laser keyboard is not supported by AIDA64.
AIDA64 also supports Razer laptops and keyboards equipped with SwitchBlade LCD. Such products include
the Razer Blade Pro Gaming Laptop, the Razer DeathStalker Ultimate Gaming Keyboard and the Razer
SWTOR (Star Wars: The Old Republic) Gaming Keyboard.
Here we can also set the background color for keyboards with a color LCD display (e.g. Logitech G19 Gaming
Keyboard).

AIDA64 Engineer Preferences
27
2.10.5.1 LCD- items
Here we can select the sensor items we want to see on the LCD display as well as their layout. We can add
the items we would like to display to a list, and modify, hide, copy or delete existing ones.
Using the arrows on the right, we can move and position items on the LCD display one pixel at a time. A
preview of the LCD screen is shown in the upper left corner of the window. When we press the “Apply” button,
the items will instantly appear on the LCD display.
AIDA64 is capable of displaying multiple – a maximum of 4 – pages of sensor items on the LCD. Individual
pages are accessible by clicking on the page tabs at the top of the sensor item list.
We can also customize the sensor item layout, among other things we can set the font and the font size and
add a shadow effect. As very small fonts are not readable on the LCD, the recommended smallest font size is
8 pixels.
We can modify the default item label and customize the label layout (color, font style, shadow). Naturally, we
can only choose colors for color LCD equipped devices such as the Logitech G19 Gaming Keyboard. Other
configuration options include setting the text alignment (LCD items are aligned to the left by default) and
enabling/disabling the display of measurement units next to the value.

AIDA64 Engineer Preferences
28
2.10.6 SENSORPANEL
AIDA64 can display sensor information on a fully customizable panel, called the SensorPanel, which can be
configured here.
Show SensorPanel
Here we can enable/disable the SensorPanel.
Keep SensorPanel the topmost window
When this option is enabled, the SensorPanel is always visible on top of all other windows. This feature is also
called “always on top”. The panel will not be visible during full-screen 3D gameplay or video playback even if
this option is checked.
Lock panel position
With this option, we can lock the position of the SensorPanel on the Windows Desktop.
Lock panel size
With this option, we can lock the dimensions of the SensorPanel. When enabled, the panel cannot be resized
with the mouse pointer.
Enable context menu
With this option, we can activate the right-click context menu on the SensorPanel. SensorPanel Manager,
which provides further customization options, can be launched from the context menu.
SensorPanel background color
Here we can set the SensorPanel background color. If we choose a background image that fills the entire
panel the selected background color will not be visible.
SensorPanel transparency
Here we can set the panel transparency level. Window transparency level adjustment is not supported under
Windows 95, 98, Me and NT 4.0.
SensorPanel size
Here we can specify the dimensions of the SensorPanel in pixels. The first value defines the width of the
SensorPanel, while the second value defines its height.

AIDA64 Engineer Preferences
29
2.10.6.1 SensorPanel- Manager
Right-clicking the SensorPanel will display the
context menu from where we can open the
SensorPanel Manager. This allows us to add new
items to the panel, and modify, hide, duplicate or
delete existing ones.
We can move items up or down in the list. Items
are displayed as layers on the SensorPanel, and
this list determines the order of the layers: the
topmost item in the list will be the background
layer, the next one the first layer and so on. By
default, an item listed under another will cover at
least parts of those listed above it if they overlap
each other on the panel. Because of that, we
always have to make sure to make the
background image the topmost item.
By clicking “Export”, we can save our customized SensorPanel to a file with the extension .SENSORPANEL.
This file contains all graphics and settings used in the panel, so we can use it to share our SensorPanel with
friends who can start using it by pressing the “Import” button.
2.10.7 LOGGING
With AIDA64, we can save sensor readings to a log file. Sensor values are saved either to an HTML or CSV
file, and logging intervals can be set on the Preferences / Hardware Monitoring / Update frequency page in
seconds.
We can choose to log when processes start or stop, and specify the number of hours (between 1 and 72 hours)
after which we want to open a new log file.
The items we want to include in the log can be selected using the checkboxes in the list.
AIDA64 Engineer Preferences
30
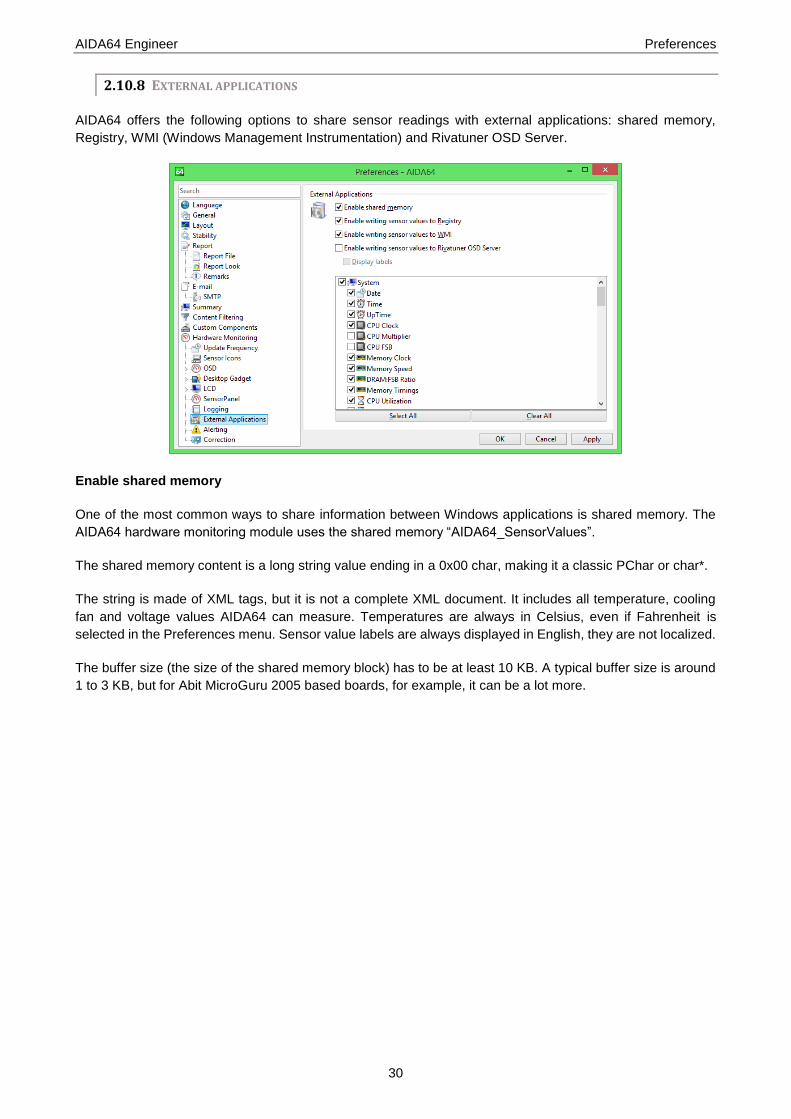
2.10.8 EXTERNAL APPLICATIONS
AIDA64 offers the following options to share sensor readings with external applications: shared memory,
Registry, WMI (Windows Management Instrumentation) and Rivatuner OSD Server.
Enable shared memory
One of the most common ways to share information between Windows applications is shared memory. The
AIDA64 hardware monitoring module uses the shared memory “AIDA64_SensorValues”.
The shared memory content is a long string value ending in a 0x00 char, making it a classic PChar or char*.
The string is made of XML tags, but it is not a complete XML document. It includes all temperature, cooling
fan and voltage values AIDA64 can measure. Temperatures are always in Celsius, even if Fahrenheit is
selected in the Preferences menu. Sensor value labels are always displayed in English, they are not localized.
The buffer size (the size of the shared memory block) has to be at least 10 KB. A typical buffer size is around
1 to 3 KB, but for Abit MicroGuru 2005 based boards, for example, it can be a lot more.

AIDA64 Engineer Preferences
31
For reading the contents of the shared memory, a code similar to the following Delphi procedure can be used:
Const
sharedmem_name = 'AIDA64_SensorValues';
Function ExtApp_SharedMem_ReadBuffer(bu:PChar;bu_size:DWord):Boolean;
Var
mappedData : PChar;
th : THandle;
Begin
Result:=False;
th:=OpenFileMapping(FILE_MAP_READ,False,sharedmem_name);
If th<>INVALID_HANDLE_VALUE Then
Begin
mappedData:=MapViewOfFile(th,FILE_MAP_READ,0,0,0);
If mappedData<>Nil Then
Begin
StrLCopy(bu,mappedData,bu_size);
If UnmapViewOfFile(mappedData) Then Result:=True;
End;
CloseHandle(th);
End;
End;
Here is a shared memory output example:
AIDA64 Engineer Preferences
32
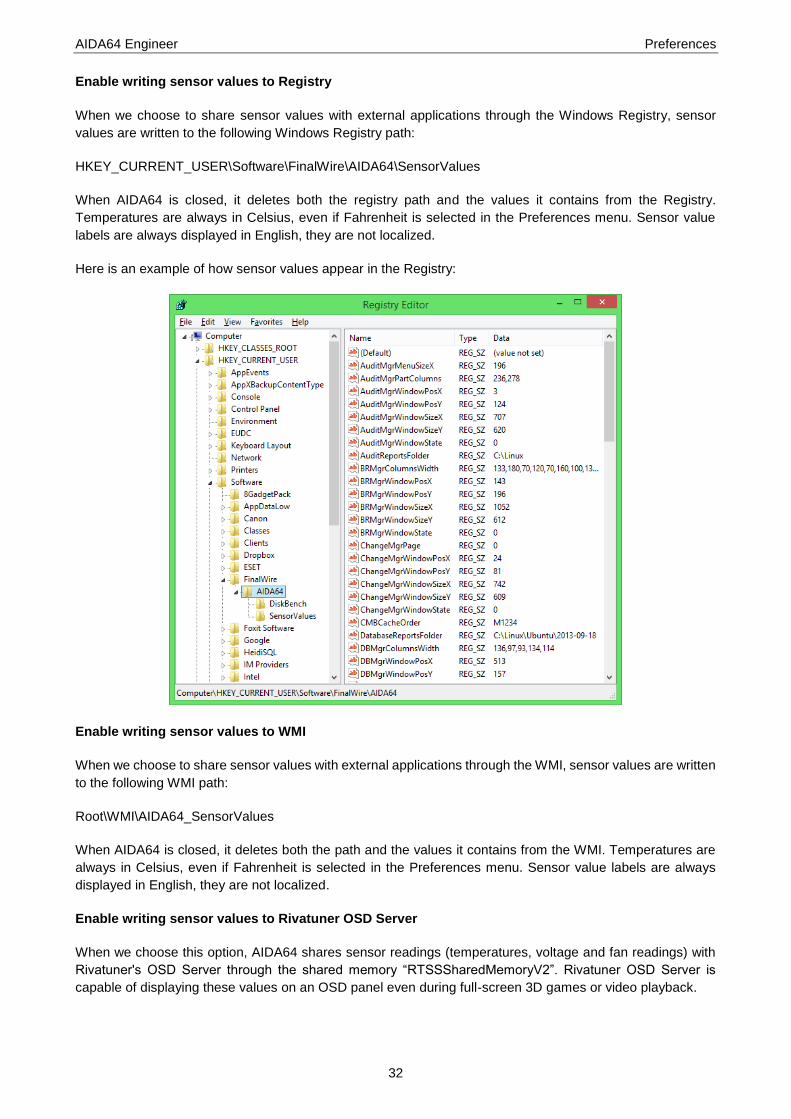
Enable writing sensor values to Registry
When we choose to share sensor values with external applications through the Windows Registry, sensor
values are written to the following Windows Registry path:
HKEY_CURRENT_USER\Software\FinalWire\AIDA64\SensorValues
When AIDA64 is closed, it deletes both the registry path and the values it contains from the Registry.
Temperatures are always in Celsius, even if Fahrenheit is selected in the Preferences menu. Sensor value
labels are always displayed in English, they are not localized.
Here is an example of how sensor values appear in the Registry:
Enable writing sensor values to WMI
When we choose to share sensor values with external applications through the WMI, sensor values are written
to the following WMI path:
Root\WMI\AIDA64_SensorValues
When AIDA64 is closed, it deletes both the path and the values it contains from the WMI. Temperatures are
always in Celsius, even if Fahrenheit is selected in the Preferences menu. Sensor value labels are always
displayed in English, they are not localized.
Enable writing sensor values to Rivatuner OSD Server
When we choose this option, AIDA64 shares sensor readings (temperatures, voltage and fan readings) with
Rivatuner's OSD Server through the shared memory “RTSSSharedMemoryV2”. Rivatuner OSD Server is
capable of displaying these values on an OSD panel even during full-screen 3D games or video playback.

AIDA64 Engineer Preferences
33
2.10.9 ALERTING
AIDA64 can send alert notifications of several hardware-related issues. Here we can enable alerting and
specify how often we would like to receive alerts of the same issue. The latter option is useful for events that
persist, for example, when a cooling fan comes to a halt and does not restart.
We can add new alert triggers by clicking “New”, and edit existing triggers by clicking “Modify”. We can define
individual labels for each alert trigger, and we need to set the threshold values for each by filling in the “value
is below” and/or “value is above” fields.
We can select the alert method on the “Actions” tab. Available options are displaying an alert window, shutting
down the computer, playing a user-selected WAV file, running a user-selected program or command and
sending a notification e-mail (the subject field of which is customizable). If we choose to send e-mail
notifications we need to configure the e-mail sending options in Preferences / E-mail.

AIDA64 Engineer Preferences
34
2.10.10 CORRECTION
Here we can correct the displayed sensor readings.
Configuration
We can add new items by clicking “New”, edit existing items by pressing the “Modify” button or by double-
clicking items, and delete items by clicking “Delete”.
Ratio
This option configures the ratio to be applied on the selected item. A ratio of 0.5 means effectively halving the
input value. A ratio of 2.0 means effectively doubling the input value.
Offset
This option configures the offset to be applied on the selected item. An offset of -10 means lowering the input
value by 10. An offset of +20 means adding 20 to the input value.
AIDA64 Engineer View
35
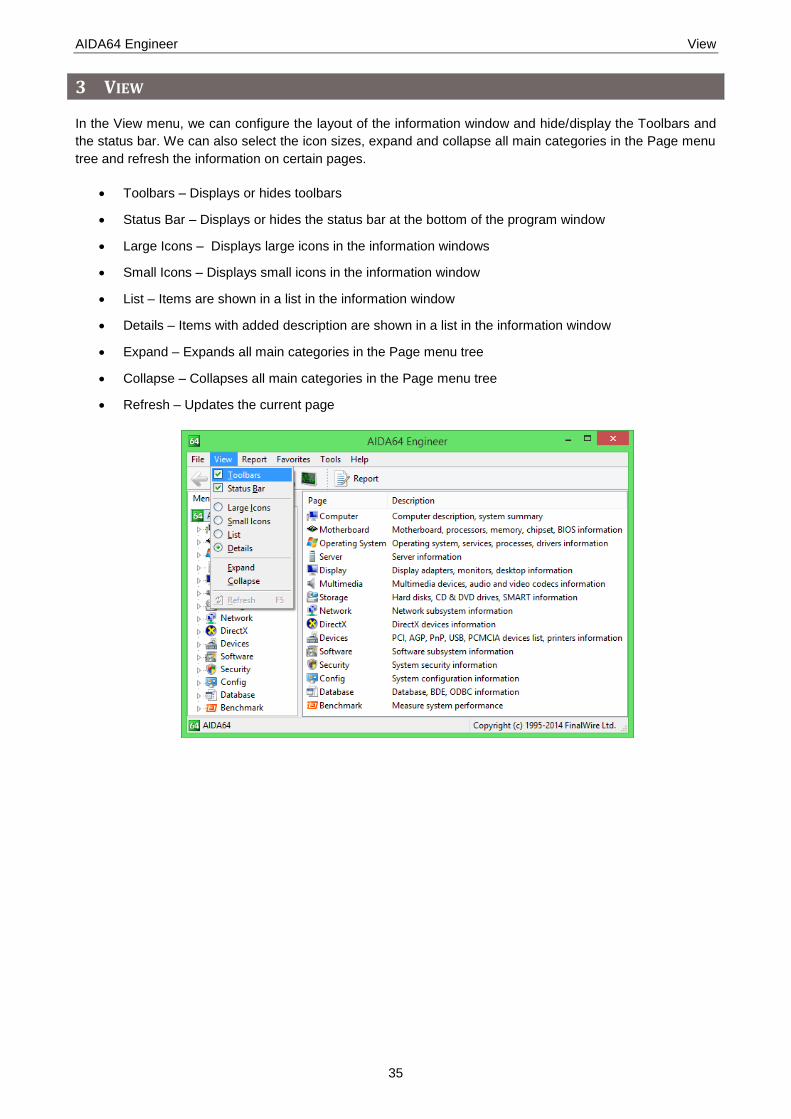
3 VIEW
In the View menu, we can configure the layout of the information window and hide/display the Toolbars and
the status bar. We can also select the icon sizes, expand and collapse all main categories in the Page menu
tree and refresh the information on certain pages.
Toolbars – Displays or hides toolbars
Status Bar – Displays or hides the status bar at the bottom of the program window
Large Icons – Displays large icons in the information windows
Small Icons – Displays small icons in the information window
List – Items are shown in a list in the information window
Details – Items with added description are shown in a list in the information window
Expand – Expands all main categories in the Page menu tree
Collapse – Collapses all main categories in the Page menu tree
Refresh – Updates the current page

AIDA64 Engineer Report
36
4 REPORT
AIDA64 is capable of providing exhaustive details about the hardware components and the software
environment as well as testing the performance of the system, and it can also make reports of all this
information.
REPORT WIZARD
With Report Wizard, we can easily create
reports in AIDA64. Report Wizard can be
started by clicking on the Report button on
the toolbar or by selecting Report Wizard in
the Report menu. Report Wizard follows
the standard Windows wizard layout. The
first page is a welcome page, then on the
second page we can select the report
profile we want to use. A report profile is no
more than a list of those pages from the
Page menu which will be included in the
report. AIDA64 offers some predefined
report profiles to let users quickly create
standard report files, but it also allows us to
create a custom report profile by selecting
the pages we want to see in the report or
loading a previously created custom profile.
These settings can be automated using command-line options. Using the switches /R, /E or /FTP, we can
create full reports. We can also use custom reports if we add any of the following options after /R, /E or /FTP:
/SUM, /HW, /SW, /BENCH or /CUSTOM <path>.

AIDA64 Engineer Report
37
4.1.1 REPORT PROFILES
All pages
This report profile includes all available
pages from the Page menu, from Computer
/ Summary to Database / ODBC Data
Sources. Although this profile offers the
most information, it should be used with
care as the resulting report file will be very
large, typically over 2 MB in size. It is
recommended to compress the report files
in the long run to save storage space –
especially if we use AIDA64 in a network of
several hundred PCs.
System Summary only
This profile includes only the Computer / Summary page in the report. It is useful if we want a quick summary
of the hardware and the operating system and we do not need any further software information. It is possible
to select the items we would like to see on the Summary page in Preferences / Summary.
Hardware-related pages
This profile includes all pages containing hardware configuration information. Hardware reports typically do
not include any confidential information, except for motherboard and system serial number, IP and MAC
addresses.
Software-related pages
This profile includes all pages containing software configuration information. Software reports typically include
a great deal of confidential information and should be treated accordingly. We can exclude all software license
information from the reports by using the /NOLICENSE command-line switch.
Benchmark pages
This profile includes all benchmark pages under the Benchmark category, that is the results of all memory and
CPU benchmarks. If we select any of the subcategories in the Benchmark menu, we can hide reference results
and/or user results by clicking the Results button on the toolbar.
Custom selection
This option offers us a flexible way to compile a custom report profile, using the Custom report profile page of
Report Wizard. Custom report profiles can be saved to a report profile file (with .RPF file extension) which can
be used for automatic, command-line based report creation with the command-line option /R /CUSTOM <RPF
file path>.
Load from file
This option offers us a quick way to load a previously created custom report profile (with .RPF file extension).
The browse button can be used to select the file in Windows Explorer.
AIDA64 Engineer Report
38
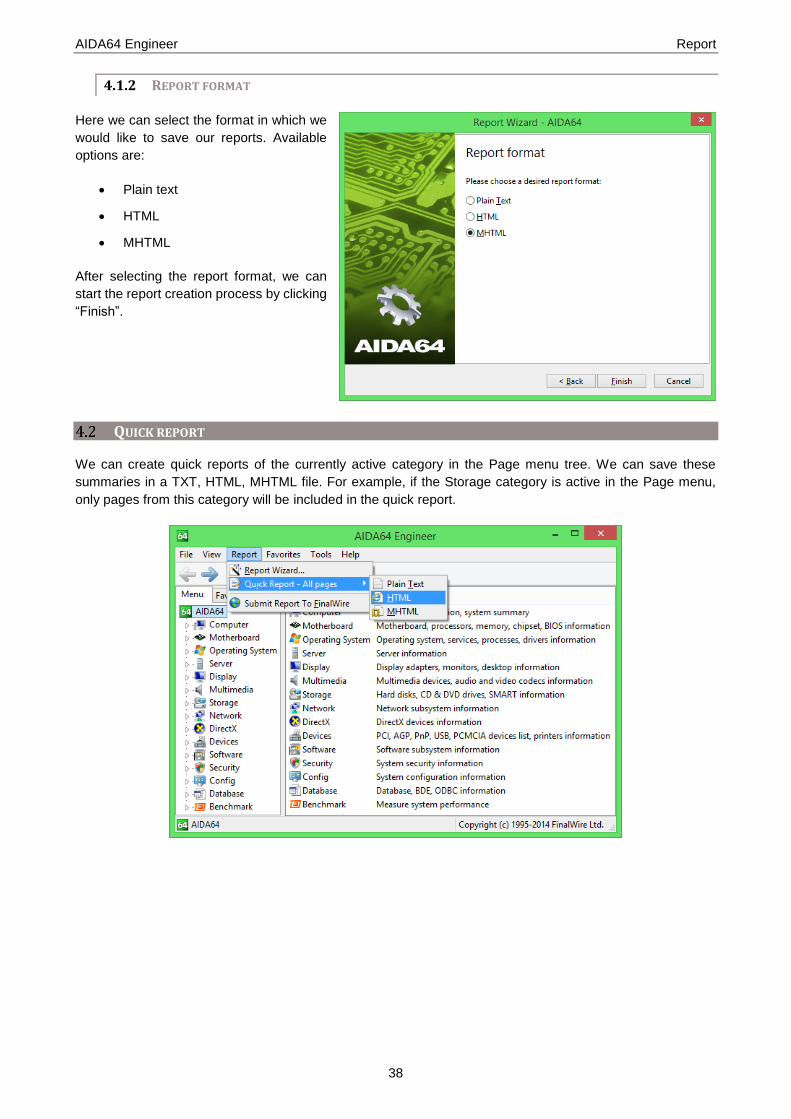
4.1.2 REPORT FORMAT
Here we can select the format in which we
would like to save our reports. Available
options are:
Plain text
HTML
MHTML
After selecting the report format, we can
start the report creation process by clicking
“Finish”.
QUICK REPORT
We can create quick reports of the currently active category in the Page menu tree. We can save these
summaries in a TXT, HTML, MHTML file. For example, if the Storage category is active in the Page menu,
only pages from this category will be included in the quick report.
AIDA64 Engineer Report
39
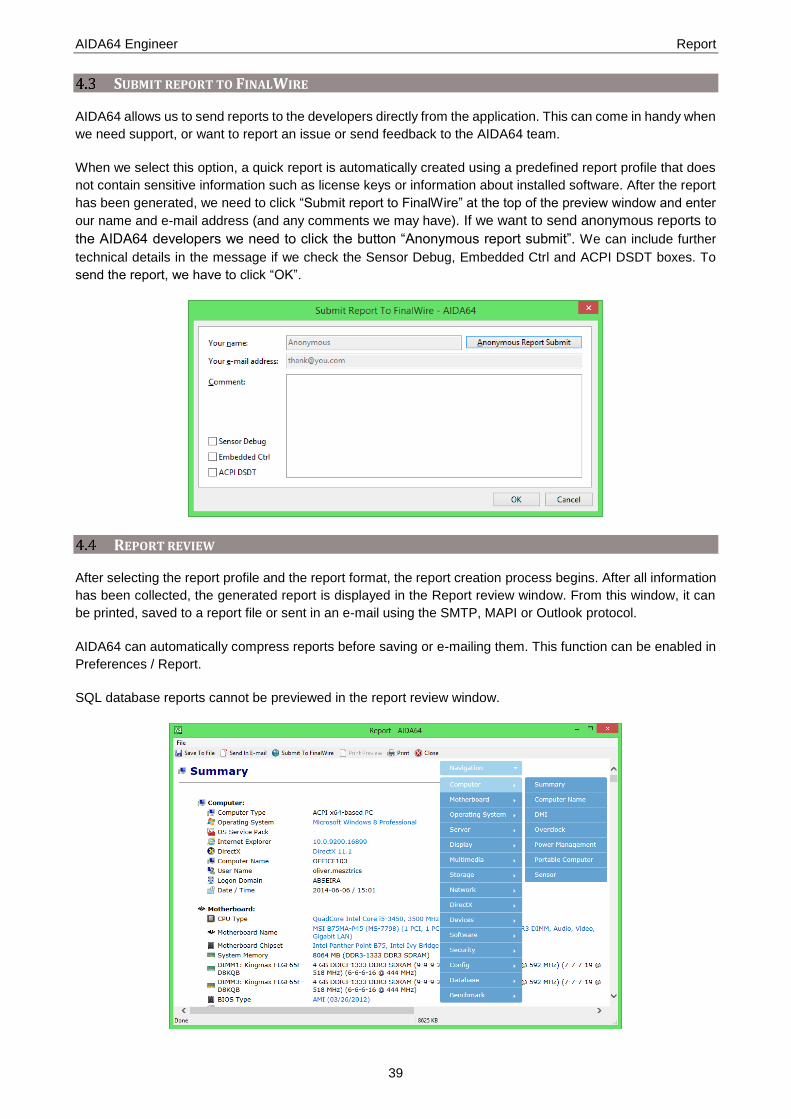
SUBMIT REPORT TO FINALWIRE
AIDA64 allows us to send reports to the developers directly from the application. This can come in handy when
we need support, or want to report an issue or send feedback to the AIDA64 team.
When we select this option, a quick report is automatically created using a predefined report profile that does
not contain sensitive information such as license keys or information about installed software. After the report
has been generated, we need to click “Submit report to FinalWire” at the top of the preview window and enter
our name and e-mail address (and any comments we may have). If we want to send anonymous reports to
the AIDA64 developers we need to click the button “Anonymous report submit”. We can include further
technical details in the message if we check the Sensor Debug, Embedded Ctrl and ACPI DSDT boxes. To
send the report, we have to click “OK”.
REPORT REVIEW
After selecting the report profile and the report format, the report creation process begins. After all information
has been collected, the generated report is displayed in the Report review window. From this window, it can
be printed, saved to a report file or sent in an e-mail using the SMTP, MAPI or Outlook protocol.
AIDA64 can automatically compress reports before saving or e-mailing them. This function can be enabled in
Preferences / Report.
SQL database reports cannot be previewed in the report review window.

AIDA64 Engineer Favorites
40
5 FAVORITES
In AIDA64, we can collect those Page menu items that we use the most often under the Favorite tab so that
they can be easily accessed. We can create reports of our favorite items by selecting Report / Quick report
on the main menu bar. This menu item includes links to some useful web sites, including IT news websites,
hardware review sites as well as BIOS and driver update solutions.

AIDA64 Engineer Tools
41
6 TOOLS
In this menu, we can access the AIDA64 diagnostics modules.
DISK BENCHMARK
With this module, we can measure the performance of the PC's storage devices, including (S)ATA or SCSI
hard disk drives, RAID arrays, optical drives, solid-state drives (SSD), USB drives and memory cards. It also
allows us to perform write tests, which helps us detect fake products and errors on the devices. In order to
attain reliable benchmark results we have to make sure to close all background applications.
Clicking “Save”, we can save the results as a PNG image, while by pressing the “Clear” button, we clear the
results and restore the window to its default state.
In the Options menu, the following settings are available:
Block size
Here we can select the block size the benchmark engine uses to test the storage device. The smaller the block
size, the more time it takes to complete the test.
Loop mode
In loop mode, the benchmark will restart every time it has been completed.
Display performance in KB/s
We can change the data throughput measurement unit from MB/s (default) to KB/s.

AIDA64 Engineer Tools
42
Write tests
If we enable write tests, the following additional 6 testing modes become available: Linear Write, Random
Write, Buffered Write, Avarage Write Access, Linear Write + Verify and Random Write + Verify.
When performing write tests, all data will be lost on the storage device, and AIDA64 warns us three times of
this when launching the process.
Performance monitor
To the right of the charts, we can find the performance monitoring table where we can follow in real time the
current, minimum, maximum and average read speeds as well as the current, minimum, maximum and
average CPU usage in percent, as well as the block size used in the test.
CACHE AND MEMORY BENCHMARK
This benchmark measures the bandwidth and latency of the CPU caches and the system memory. By double-
clicking any rectangle, column or row in the window, we can launch benchmarks or benchmark types
individually. For example, if we double-click “Memory”, only system memory read, write, copy and latency
benchmarks will be run, that is, only the operations in the given row are executed. Similarly, if we double-click
“Read”, only read benchmarks will be run on all memory types, that is, only the operations in the given column
are executed. If we double-click any rectangle, only the selected single benchmark will be run.
Right-clicking the “Start Benchmark” button will open a context menu in which we can choose to run all
benchmarks or just the memory or cache benchmarks.

AIDA64 Engineer Tools
43
GPGPU BENCHMARK
This benchmark panel, which can be launched from Tools | GPGPU Benchmark, offers a set of OpenCL
GPGPU benchmarks. These are designed to measure GPGPU computing performance using various OpenCL
workloads. Each individual benchmark can be run on up to 16 GPUs, including AMD, Intel and NVIDIA GPUs,
or the combination of these. Of course, CrossFire and SLI configurations as well as both dGPUs and APUs
are fully supported. Currently, there is only preliminary support for HSA configurations. Basically, any
computing device that is listed as a GPU among the OpenCL devices will be benchmarked.
Current OpenCL benchmarks are not optimized for
any GPU architecture. Instead, the AIDA64 OpenCL
module relies on the OpenCL compiler which
optimizes the OpenCL kernel to run best on the
underlying hardware. The OpenCL kernels used for
these benchmarks are compiled in real-time, using
the GPU's OpenCL driver. Because of this, it is
always recommended to have all video drivers
(Catalyst, ForceWare, HD Graphics, etc.) updated
to their latest version. For the compilation, the
following OpenCL compiler options are passed: -cl-
fast-relaxed-math -cl-mad-enable.
For comparison purposes, the GPGPU Benchmark
Panel offers CPU measurements as well. However,
the CPU benchmarks do not use OpenCL, but are
written in native x86/x64 machine code, utilizing
available instruction set extensions such as SSE,
AVX, AVX2, FMA and XOP. These CPU
benchmarks are very similar to the old AIDA64 CPU
and FPU benchmarks, but this time they measure
maximum computing performance (FLOPS, IOPS).
The CPU benchmarks are heavily multi-threaded,
and are optimized for each CPU architecture
introduced since the first Pentium.
Currently, the following benchmark tests are available:
1. Memory Read: Measures the bandwidth between the GPU device and the CPU, effectively measuring
the performance the GPU can copy data from its own device memory into the system memory. It is also
called Device-to-Host Bandwidth. The CPU benchmark measures memory read bandwidth, that is, how
fast the CPU can read data from the system memory.
2. Memory Write: Measures the bandwidth between the CPU and the GPU device, effectively measuring
the performance the GPU can copy data from the system memory into its own device memory. It is also
called Host-to-Device Bandwidth. The CPU benchmark measures memory write bandwidth, that is, how
fast the CPU can write data into the system memory.
3. Memory Copy: Measures the performance of the GPU's own device memory, effectively measuring the
performance the GPU can copy data from its own device memory to another place in the same device
memory. It is also called Device-to-Device Bandwidth. The CPU benchmark measures memory copy
bandwidth, that is, how fast the CPU can move data in the system memory from one place to another.
4. Single-Precision FLOPS: Measures the MAD (Multiply-Addition) performance of the GPU, otherwise
known as FLOPS (Floating-Point Operations Per Second), with single-precision (32-bit, "float") floating-
point data.

AIDA64 Engineer Tools
44
5. Double-Precision FLOPS: Measures the MAD (Multiply-Addition) performance of the GPU, otherwise
known as FLOPS (Floating-Point Operations Per Second), with double-precision (64-bit, "double")
floating-point data. Not all GPUs support double-precision floating-point operations. For example, current
Intel desktop and mobile graphics devices only support single-precision floating-point operations.
6. 24-bit Integer IOPS: Measures the MAD (Multiply-Addition) performance of the GPU, otherwise known
as IOPS (Integer Operations Per Second), with 24-bit integer ("int24") data. This special data type is
defined in OpenCL, given that many GPUs are capable of executing int24 operations in their floating-point
units, effectively increasing integer performance by a factor of 3 to 5 when compared to 32-bit integer
operations.
7. 32-bit Integer IOPS: Measures the MAD (Multiply-Addition) performance of the GPU, otherwise known
as IOPS (Integer Operations Per Second), with 32-bit integer ("int") data.
8. 64-bit Integer IOPS: Measures the MAD (Multiply-Addition) performance of the GPU, otherwise known
as IOPS (Integer Operations Per Second), with 64-bit integer ("long") data. Most GPUs do not have
dedicated execution resources for 64-bit integer operations. Such devices emulate 64-bit integer
operations on their 32-bit integer execution units. In such cases, 64-bit integer performance can be very
low.
9. AES-256: we can use this OpenCL-based GPGPU benchmark to measure the AES-256 encryption
performance of modern graphics processors and APUs.
10. SHA-1: we can use this OpenCL-based GPGPU benchmark to measure the SHA-1 hashing performance
of modern graphics processors and APUs.
11. Single-Precision Julia: Measures single-precision (32-bit, “float”) floating-point performance through the
computation of several frames of the popular “Julia” fractal.
12. Double-Precision Mandel: Measures double-precision (64-bit, “double”) floating-point performance
through the computation of several frames of the popular “Mandelbrot” fractal. Not all GPUs support
double-precision floating-point operations. For example, current Intel desktop and mobile graphics
devices only support single-precision floating-point operations.

AIDA64 Engineer Tools
45
6.3.1 THE GPGPU BENCHMARK PANEL'S USER INTERFACE
You can use the checkboxes to select a GPU device or the CPU for the benchmarks. The state of the CPU
checkbox will be stored after closing the panel.
You can launch the benchmarks for the selected devices by clicking the “Start Benchmark” button. If you want
to run all benchmarks, but only on the GPU(s), you need to double-click the GPU column label. If you only
want to run the Memory Read benchmarks on both the GPU(s) and the CPU, you need to double-click the
Memory Read label. If you only want to run the Memory Read benchmark on only the GPU(s), you need to
double-click the cell where the requested benchmark result will appear when the benchmark is completed.
The benchmarks are executed
simultaneously on all selected GPUs, using
multiple threads and multiple OpenCL
context, each with a single command
queue. CPU benchmarks, however, are
only launched when the GPU benchmarks
are completed. It is currently not possible to
run the GPU and CPU benchmarks
simultaneously.
If there are multiple GPUs in the system,
the first result column will display an
aggregated score for all GPUs. Individual
GPU results are combined (added up), and
the column label will look like e.g. “4
GPUs”. If you want to check individual
results, you can either check only one GPU
or click the Results button to open the
results window.
If you happen to have two GPU devices, and you disable the CPU test by unchecking its checkbox, the panel
will switch to dual-GPU mode where the first column is used for displaying results for GPU1, and the second
for GPU2. If you want to see the combined performance of both GPUs, just check the CPU checkbox again
after the benchmark has been completed, and the interface will switch back to the default layout.
ACPI BROWSER
The Advanced Configuration and
Power Interface (ACPI) specification
provides an open standard for
device configuration and power
management by the operating
system.
We can save either the tree, or the
DSDT (Differentiated S ystem
Description Table), or the entire
table to a text file, while double-
clicking any item will display the
code.
We can search in the item tree and
perform custom queries.

AIDA64 Engineer Tools
46
DRAM TIMINGS
This window provides extremely detailed DRAM timing information, much more than what is available on the
Motherboard / SPD page.

AIDA64 Engineer Tools
47
MONITOR DIAGNOSTICS
This menu item launches Monitor Diagnostics, which can be used to check the capabilities and display
performance of LCD and CRT displays. This module uses 45 different test screens to help us detect possible
issues.
The tests are grouped under four main categories:
Calibration tests
Grid tests
Color tests
Reading tests
By hovering the mouse pointer over any individual
test, we will be given hints as to the goal of the
test as well as what we need to pay attention to.
We can select which test or test groups we want
to run, this way we can focus on specific issues
instead of running all the tests.
AIDA64 Engineer Tools
48
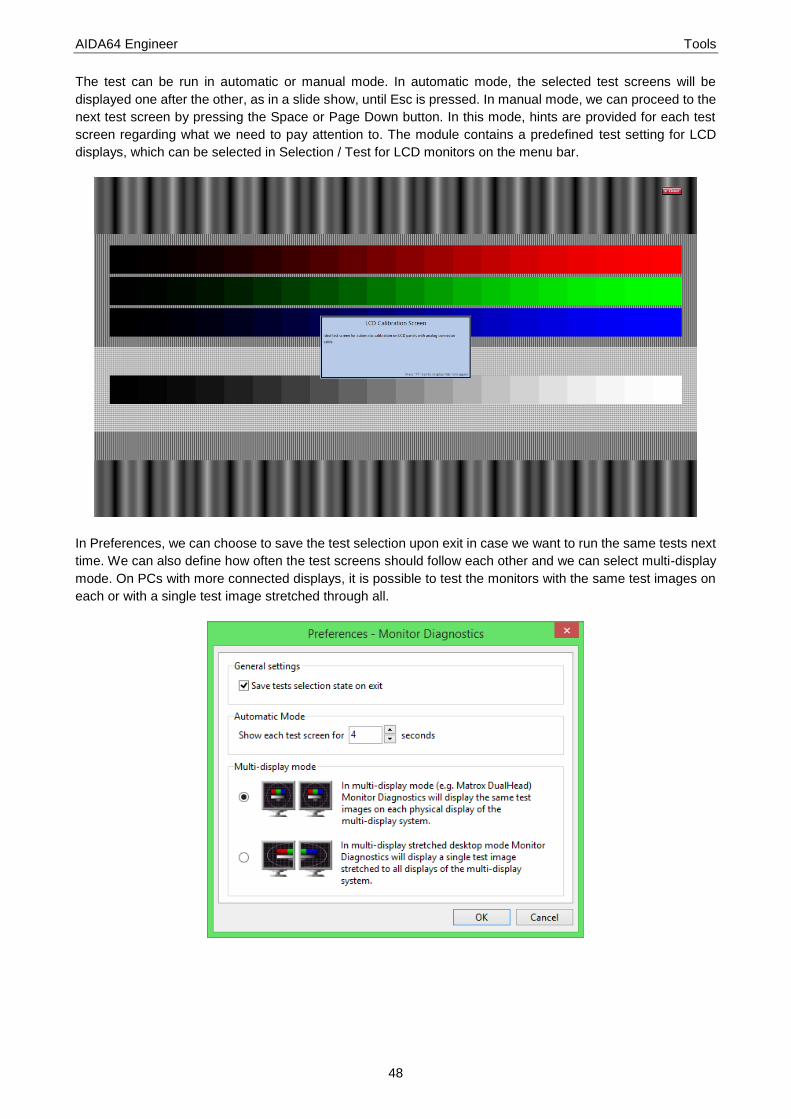
The test can be run in automatic or manual mode. In automatic mode, the selected test screens will be
displayed one after the other, as in a slide show, until Esc is pressed. In manual mode, we can proceed to the
next test screen by pressing the Space or Page Down button. In this mode, hints are provided for each test
screen regarding what we need to pay attention to. The module contains a predefined test setting for LCD
displays, which can be selected in Selection / Test for LCD monitors on the menu bar.
In Preferences, we can choose to save the test selection upon exit in case we want to run the same tests next
time. We can also define how often the test screens should follow each other and we can select multi-display
mode. On PCs with more connected displays, it is possible to test the monitors with the same test images on
each or with a single test image stretched through all.

AIDA64 Engineer Tools
49
SYSTEM STABILITY TEST
System Stability Test can be used to stress
all major system components (CPU,
caches, memory, hard disk drives) at once,
and find any possible stability or cooling
issues. Individual stress testing processes
can be launched one by one or
simultaneously, and can be
enabled/disabled any time during the test.
In the log window, we can see when
selected tests were started and stopped.
On the graphs, we can monitor CPU usage
and the temperature of selected hardware
components. We can select various
parameters we would like to monitor using
the available tabs (Temperatures, Cooling
fans, Voltages, Power). On the Statistics
tab, a summary is shown with the minimum,
maximum and average values indicated for all monitored parameters. The module also shows battery status
(if applicable) as well as the date and time when the test was started and the time elapsed since.
The stress test can be started and stopped using the “Start” and “Stop” buttons at the bottom of the windows.
By pressing the “Clear” button we can clear the graphs, while the “Save” button can be used to take screen
shots of the window. It is possible to launch the CPUID panel from here and open the Preferences menu.
AIDA64 CPUID
The AIDA64 CPUID panel provides detailed, real-time information about the processors. When more
processors or processor cores are available we can select the one the details of which we want to see. By
clicking “Save”, we can take a screenshot of the window.

AIDA64 Engineer Help
50
7 HELP
In this menu, beside the Help file we find links to online support resources, the end-user license agreement,
product information and we can also choose to enter the product key here.
AIDA64 HELP
“AIDA64 Help F1” opens the main page of the AIDA64 help file/user manual. You can select topics in the
contents page or search for any term.
AIDA64 ONLINE
Clicking on AIDA64 Online in the Help menu will open the local AIDA64 website corresponding to the selected
UI language. If there is no AIDA64 website available in the GUI language, the English-language website will
load by default.
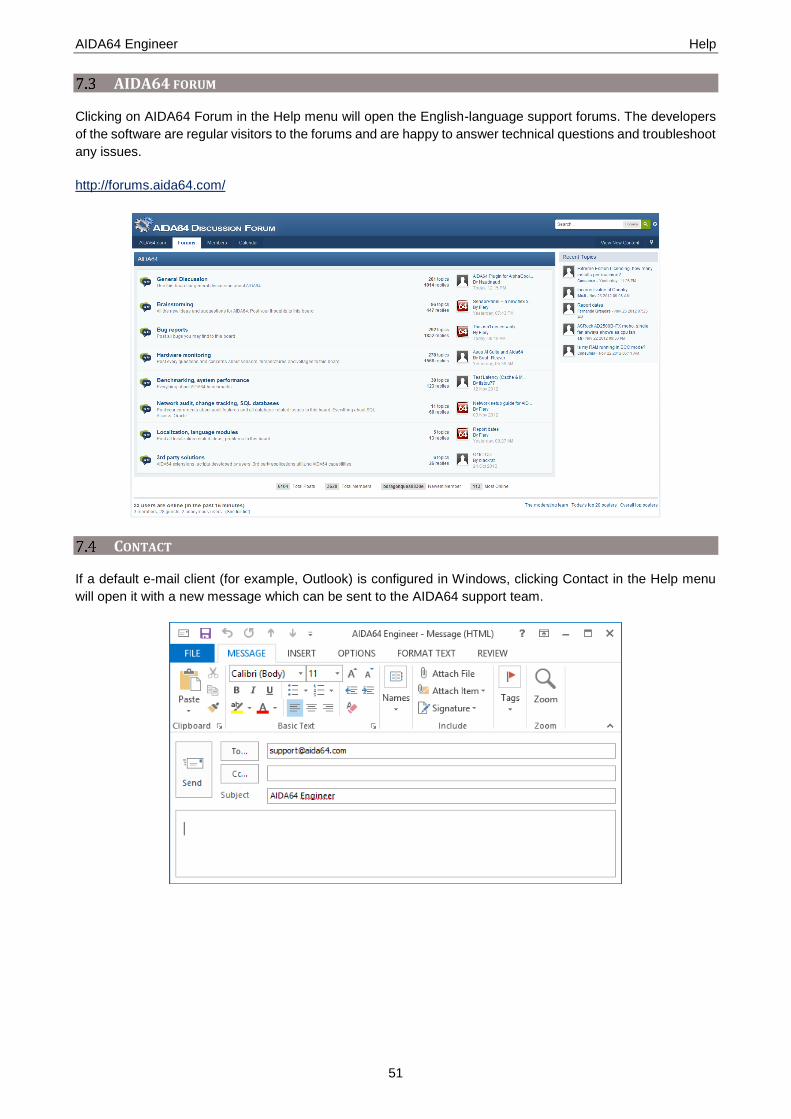
AIDA64 Engineer Help
51
AIDA64 FORUM
Clicking on AIDA64 Forum in the Help menu will open the English-language support forums. The developers
of the software are regular visitors to the forums and are happy to answer technical questions and troubleshoot
any issues.
http://forums.aida64.com/
CONTACT
If a default e-mail client (for example, Outlook) is configured in Windows, clicking Contact in the Help menu
will open it with a new message which can be sent to the AIDA64 support team.

AIDA64 Engineer Help
52
LICENSE
This menu item will display the end-user license agreement in a pop-up window. If we use the AIDA64 ZIP
package we automatically accept the terms of the license agreement.
COMMAND-LINE OPTIONS
AIDA64 Engineer offers several command-line options with which we can customize network audit, automated
report creation, remote connections and some security features.
From Version 2.20, it is possible to use Report and Remote Connection options simultaneously in a single
command-line. In such cases, the report creation process will be launched first, and after it is finished AIDA64
stays in the background waiting for incoming remote connections.

AIDA64 Engineer Help
53
Precautions:
1. Only one of the following options can be used in a single command-line: /ALL, /SUM, /HW, /SW,
/BENCH, /AUDIT, /CUSTOM. Using more of these options simultaneously could cause unexpected
issues.
2. Only one of the following options can be used in a single command-line: /TEXT, /HTML, /MHTML.
Using more of these options simultaneously could cause unexpected issues.
7.6.1 REPORT
/R [reportfile] – this option can be used to create a report and save it to file
When no file name is specified, the report will be written to the file specified in Preferences / Report /
Report File. It is recommended to specify a full path name for the report file in the command-line. For
a network audit, we should use UNC paths in folder names instead of using a mapped network drive.
Reports are automatically compressed if this option is enabled in Preferences / Report. In the report
file names we can use control strings (see section 10.6.10).
Example: AIDA64 /R \\server\share\folder\$HOSTNAME /HTML /AUDIT /SILENT /SAFE
7.6.2 REPORT PROFILE
/ALL – the reports created will include all pages from the page menu.
/SUM – the reports created will include only the Computer / Summary page
/HW – the reports created will include only the pages listing hardware-related information
/SW – the reports created will include only the pages listing software-related information
/BENCH – the reports created will include the benchmark pages only.
/CUSTOM [\\Server_IP_address\AIDA64\profile.rpf] – this option loads a customized report profile
7.6.3 REPORT FORMAT
/TEXT – reports will be created in plain text format
/HTML – reports will be created in HTML (HyperText Markup Language) format
HTML report layout can be customized in Preferences / Report / Report Look. Although HTML reports
are ideal if we want to print reports.
/MHTML – reports will be created in MHTML format (with HTML images)
MHTML reports are basically HTML reports with small icons included. MHTML report layout can be
customized in Preferences / Report / Report Look. Although MHTML reports are ideal if we want to
print reports.

AIDA64 Engineer Help
54
7.6.4 LANGUAGE
/LANGxx – where “xx” should be replaced with a 2-letter language code. The following languages are currently
supported:
AA = Arabic
AL = Albanian
BG = Bulgarian
BS = Bosnian
BY = Belarusian
CA = Catalan
CN = Chinese (Simplified)
CZ = Czech
DE = German
DK = Danish
EN = English
ES = Spanish
FI = Finnish
FR = French
HR = Croatian
HU = Hungarian
ID = Indonesian
IT = Italian
JP = Japanese
KR = Korean
LT = Lithuanian
LV = Latvian
MK = Macedonian
NL = Dutch
NO = Norwegian
PL = Polish
PT = Portuguese
RO = Romanian
RU = Russian
SE = Swedish
SI = Slovenian
SK = Slovak
SR = Serbian
TR = Turkish
TW = Chinese (Traditional)
UA = Ukrainian
7.6.5 TROUBLESHOOTING
/SAFE – This option activates safe mode, in which low-level PCI, SMBus and sensor scanning are
disabled. For network audits, it is recommended to use this option to make sure AIDA64 does not
cause system stability issues.
/SAFEST – This option activates the safest mode in which kernel drivers are not loaded either.
/NT4ZIPFIX – Using this option, an Iomega Zip drive related issue can be avoided on Windows NT
4.0 systems.
7.6.6 MISCELLANEOUS
/SILENT – This option can be used to hide the AIDA64 icon on the System Tray (also known as
Notification Area) and the bubble notifications.
/SHOWED – Using this option displays a dialog box before the report is sent in e-mail. This can be
useful in help desk scenarios as the dialog box lets the user enter special comments about his/her
issue. This option must be used with the /E command-line option.
/SHOWP – Using this option, the report creation progress can be tracked on screen, but no user
intervention is allowed (can be used with the options /R, /E or /FTPUPLOAD).
/SHOWPCANCEL – Using this option, the report creation progress can be tracked, and user
intervention is allowed (can be used with the options /R, /E or /FTPUPLOAD).
/SHOWS – Using this option, the startup process of AIDA64 can be tracked on screen.
/NOICONS – AIDA64 will not display icons on its user interface. This option can be used to save
network bandwidth.
/INIFILE <\\Server_IP_address\AIDA64\aida64.ini> – This option can be used to tell AIDA64 where
to load the settings from.
/DELAY [seconds] – This option can be used to delay the startup of AIDA64 so that other programs
can load faster.
/IDLE – This option sets AIDA64 application process to idle (lowest) priority.

AIDA64 Engineer Help
55
/NOLICENSE – This option can be used to disable and hide all software license related information,
including the Software / Licenses page.
7.6.7 VARIABLES
With variables, we can use dynamic path and file names in command-line switches.
$HOSTNAME – Inserts host name
$USERNAME – Inserts current user name
$DOMAIN – Inserts current logon domain
$IPADDR – Inserts primary network adapter IP address (aaa-bbb-ccc-ddd)
$MACADDQ – Inserts primary network adapter MAC address (AABBCCDDEEFF)
$MACADDR – Inserts primary network adapter MAC address separated by hyphens
(AA-BB-CC-DD-EE-FF)
$UUIDMAC – Inserts DMI System UUID. When this is not available, it inserts MAC address
(00000000-00000000-0000AABB-CCDDEEFF)
$MONTH – Inserts current month (MM)
$DATE – Inserts current date (YYYY-MM-DD)
$TIME – Inserts current time (HH-MM-SS)
The default environment variables of Windows can also be used: these are listed in AIDA64 on the Config /
Environment page. If we want to use these we need to enclose them in percent signs, for example:
%LOGONSERVER%.
ENTERING PRODUCT KEY, LICENSE INFORMATION
When launched for the first time, AIDA64 offers a 30-day
trial period with limited functionality (which means that it
displays the words “TRIAL VERSION” in place of some
of the data/values). At this stage, you can also enter the
product key which is provided in an email after purchase.
The product key can also be entered at any time during
the trial period by selecting Help / Enter Product Key…
in the main menu.
The software can be activated without an internet connection.
7.7.1 LOST PRODUCT REGISTRATION KEY
If we cannot find our product registration key we need to send an e-mail to [email protected] and provide the
following information:
Company (if applicable)
Full name
E-mail address
Purchased product
Approx. date of purchase

AIDA64 Engineer Help
56
CHECK FOR UPDATES
By clicking on this menu item, we can start a check for updates at any time. Otherwise, AIDA64 can be
configured to automatically checks for updates on a regular basis.
ABOUT
The AIDA64 about page displays information about the purchase date, the license expiry date and the number
of engineers who are entitled to use the given AIDA64 Engineer license. A link to the official website where we
can renew the license is also available in the window.

AIDA64 Engineer Page menu
57
8 PAGE MENU
In the AIDA64 Page menu, individual hardware and software components as well as some other items are
listed in a user-friendly, simple tree structure. The main categories are expandable and collapsible.
COMPUTER
Summary
The Summary page lists the main hardware and software components of the given PC. We can select the
individual items we would like to see here and add custom variables to the page in Preferences / Summary.
We can also add custom components to the Summary page in Preferences / Custom components and
custom variables in Preferences / Summary.
Clicking on the items highlighted in blue on the page will open a context menu which provides links to the
manufacturer's product information page as well as to BIOS and driver download websites.
Computer name
The Windows host name, the NetBIOS name as well as the DNS host and domain names of the PC are listed
here.
DMI
Here AIDA64 displays the computer's DMI table in a human-readable format. DMI is a standard developed by
DMTF and stands for Desktop Management Interface. DMI information includes descriptions of hardware
components such as BIOS, motherboard, processor, memory controllers, port connectors, system slots etc.
DMI information should be provided by the component or PC manufacturers, and can often be incomplete and
inaccurate.
AIDA64 Engineer Page menu
58
IPMI
Here AIDA64 displays the Intelligent Platform Management Interface (IPMI) system log and sensor information.
Overclock
This page displays CPU properties, CPU speed and cache information as well as motherboard, chipset, BIOS
and graphics processor properties.
Power Management
This page displays information about the PC's power source and battery (if applicable). Temperature and
capacity monitoring, input voltage, output voltage, output current and energy consumption measurements are
also provided for HID-capable UPS devices.
Portable computer
This page displays mobile PC related physical information as well as Intel Centrino platform compliance
information.
Sensor
This page provides motherboard, CPU and HDD sensor information as well as cooling fan RPM, voltage and
power values in real time.
MOTHERBOARD
CPU
This page provides processor-related information, including CPU type, clock speed, multiplier, cache size and
packaging. For Intel processors, a link to a page on the manufacturer's website listing the specifications is also
provided. Available for each processor core, CPU utilization data is updated in real time.
CPUID
This page displays processor information using the CPUID instruction. Information about the availability of
instruction set extensions, security, power management and virtualization features is also provided.

AIDA64 Engineer Page menu
59
Motherboard
This page displays information about the motherboard, including name, front side bus properties, memory bus
properties, chipset bus properties and manufacturer information.
Memory
This page provides memory information, including physical and virtual memory, swap file size and Physical
Address Extension (PAE). The page is updated dynamically, which makes it possible for us to check memory
utilization and free memory in real time.
SPD
This page provides information about the installed memory modules, including clock speed, timings, voltages.
We can get detailed information about each installed module by selecting the appropriate DIMM slot. At the
bottom of the page, information about XMP, EPP and AMP memory profiles is also provided.
Chipset
This page provides information about the motherboard chipset (north and south bridge), including memory
timings, installed memory modules, supported memory types and integrated graphics and audio controllers.
BIOS
This page displays system and video BIOS information. Asus ATK and Intel XTU are used to provide current
BIOS settings.
ACPI
This page displays the Advanced Configuration and Power Interface (ACPI) table properties. On the SLIC
table, we can see information about the Windows license, while at the bottom of the DSDT table, we can check
NVIDIA SLI and Lucid Virtu certifications.

AIDA64 Engineer Page menu
60
OPERATING SYSTEM
Operating system
This page displays operating system information, including Windows version, license information, product key,
session statistics and operating system components and features.
Processes
This page lists all running processes together with their properties.
System drivers
This page lists all installed system drivers together with their properties and status.
Services
This page lists all running and terminated processes. A green icon at the beginning of each row indicates that
the process is running, while a red icon is displayed for processes that have (been) stopped. It is possible to
start or stop the selected process by clicking the Start/Stop button on the toolbar.
AX Files
This page lists all installed DirectShow filter plug-ins (codecs). To view file properties, double-click on the file
name.
DLL Files
This page lists all installed DLL files. To view file properties, double-click on the file name.
Uptime
This page provides Windows uptime information and “blue screen” statistics. Uptime statistics are based on
the Windows system event log. By increasing the maximum log size of the system event log, we can get
statistics covering a longer period of time.

AIDA64 Engineer Page menu
61
SERVER
Share
This page lists the shared resources on the network (folders, printers). We can open the shares or remove
those we do not need.
Opened files
This page lists files and folders opened locally or remotely on the computer together with the name of the user
who opened them.
Account security
This page displays information about the security settings and password policy used in the domain.
Logon
This page lists all the users who are currently logged on.
Users
This page lists the domain users. If we do not use a domain local users are listed here. By double-clicking the
information window at the top, we can modify user and group settings.
Local Groups
This page lists the local groups. By double-clicking the information window at the top, we can modify the group
settings.
Global Groups
This page lists the global groups. By double-clicking the information window at the top, we can modify the
group settings.

AIDA64 Engineer Page menu
62
DISPLAY
Windows Video
This page lists the available graphics adapters and information about the installed drivers. Double-clicking a
graphics adapter will load the Windows Display Properties/Screen Resolution window, where we can modify
our display settings.
PCI / AGP Video
This page lists the available PCI, AGP and PCI Express graphics adapters.
GPU
This page provides detailed GPU information, such as manufacturer, GPU version, GPU clock, number of
processing units, fill rate, memory and utilization. If we have more GPUs installed in our PC we can select the
one we are interested in. The page is updated dynamically in real time, which enables us to monitor actual
clock speeds and utilization. Links to driver download websites are provided at the bottom of the page.
Monitor
On this page, we can review the monitor properties, including physical information and supported video modes.
Links to driver download websites are provided at the bottom of the page.
Desktop
This page lists the desktop properties, including resolution, color depth, font resolution, refresh rate as well as
the individual desktop effects.
Multi-monitor
This page lists the connected monitors. If there are more monitors available the primary display is indicated.
Monitor resolution and monitor hierarchy are also displayed.

AIDA64 Engineer Page menu
63
Video Modes
This page lists all available video resolution, color depth and refresh rate options.
OpenGL
This page provides detailed information about supported OpenGL functionality.
GPGPU
This page provides information about the available GPGPU frameworks which enable general-purpose
computing on graphics processing units. The GPGPU module of AIDA64 supports the latest versions of AMD
Stream, Microsoft Direct3D Compute Shader, NVIDIA CUDA, OpenCL and S3GP. Links to driver download
websites are provided at the bottom of the page.
Mantle
Here we can find detailed information about GPUs supporting the AMD Mantle graphics API, such as GPU
clocks, TMU count, profiling information, API versions and video memory details. Queue, memory heap and
device extension enumeration is also available for both GCN and GCN2 family Radeon GPUs.
Fonts
This page enumerates all installed fonts.
MULTIMEDIA
Windows Audio
This page lists the audio devices available in Windows.
PCI / PnP Audio
This page lists the PCI / PnP audio devices.
HD Audio
This page provides details about available High Definition Audio controllers and HD Audio devices. Links to
driver download websites are provided at the bottom of the page.
OpenAL
This page displays OpenAL properties and provides information about OpenAL extension support. Note:
OpenAL API calls may cause application or operating system faults when the audio driver does not fully
conform to industry-accepted standards, therefore it is recommended to disable this page when completing a
network audit.

AIDA64 Engineer Page menu
64
Audio Codecs
This page provides information about the available audio codecs. Double-clicking on any item will open the
“Sound” window.
Video Codecs
This page provides information about the available video codecs. Double-clicking on any item will open the
“Sound” window.
MCI
This page lists the Media Control Interface devices.
SAPI
This page provides information about the speech synthesis and speech recognition properties of the installed
Microsoft Speech API (SAPI).
STORAGE
Windows Storage
This page lists the storage devices installed in the system, including SATA, IDE and SCSI controllers and the
attached disk drives. Physical information is provided for hard disks, optical drives and SSDs.
Logical Drives
This page lists the available local and network drives with information about the file system, total size, free
space and volume serial.
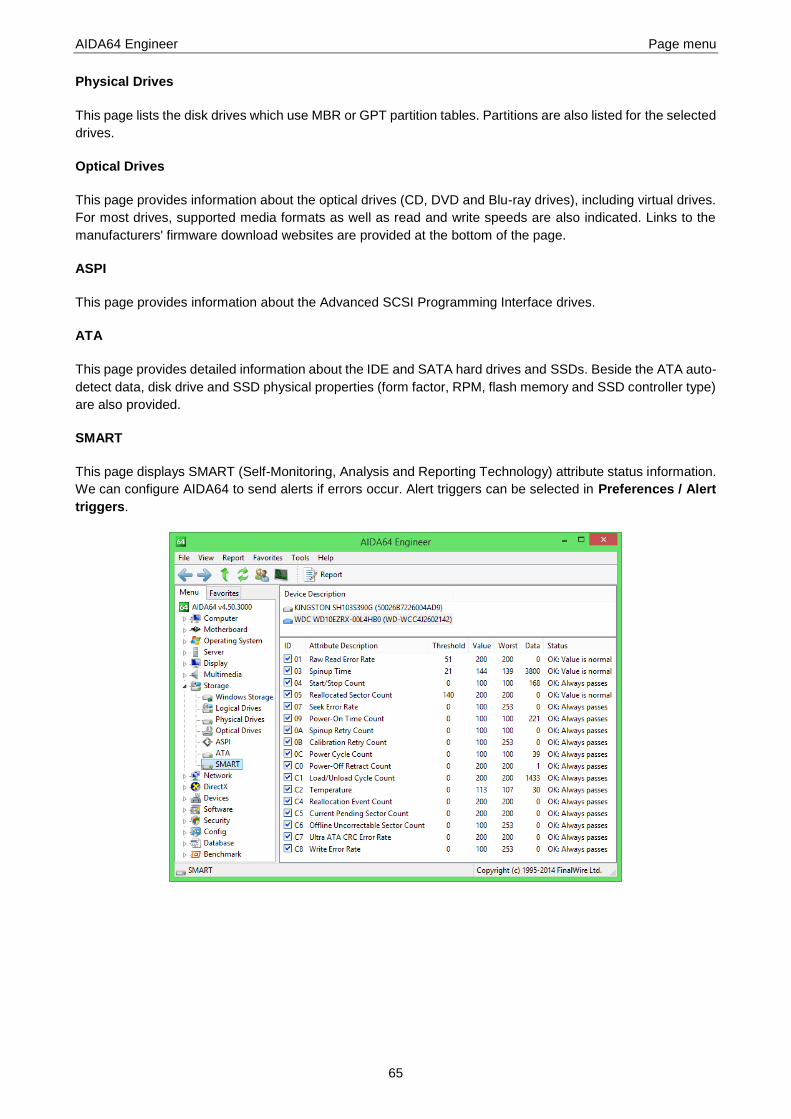
AIDA64 Engineer Page menu
65
Physical Drives
This page lists the disk drives which use MBR or GPT partition tables. Partitions are also listed for the selected
drives.
Optical Drives
This page provides information about the optical drives (CD, DVD and Blu-ray drives), including virtual drives.
For most drives, supported media formats as well as read and write speeds are also indicated. Links to the
manufacturers' firmware download websites are provided at the bottom of the page.
ASPI
This page provides information about the Advanced SCSI Programming Interface drives.
ATA
This page provides detailed information about the IDE and SATA hard drives and SSDs. Beside the ATA auto-
detect data, disk drive and SSD physical properties (form factor, RPM, flash memory and SSD controller type)
are also provided.
SMART
This page displays SMART (Self-Monitoring, Analysis and Reporting Technology) attribute status information.
We can configure AIDA64 to send alerts if errors occur. Alert triggers can be selected in Preferences / Alert
triggers.

AIDA64 Engineer Page menu
66
NETWORK
Windows Network
This page enumerates the wired and wireless network adapters installed, such as integrated WLAN controllers,
motherboard-integrated LAN controllers and Bluetooth controllers. The page provides network adapter
properties, including real-time traffic information. Links to the manufacturers' driver download websites are
provided at the bottom of the page.
PCI / PnP Network
This page enumerates the PCI, PCI Express and PnP network controllers.
RAS
This page provides information on Remote Access Services (RAS), such as dial-up, ISDN and DSL settings.
Net Resources
On this page we can have an overview of our entire network, including workgroups, domains, the workstations
and servers they include as well as shared folders and printers.
IAM
This page provides information about the e-mail accounts used in the installed e-mail clients (eg. Outlook,
Outlook express).
Internet
This page provides information about Internet Explorer and the proxy settings.

AIDA64 Engineer Page menu
67
Routes
This page lists the defined TCP/IP network routes.
IE Cookie
This page lists the Internet Explorer cookies stored on the computer. Double-clicking most cookies will open
the corresponding website in the default browser. By pressing the “Clear list” button on the taskbar, we can
delete all cookies stored on the computer at a single click.
Browser History
This page displays Internet Explorer browsing history. Double-clicking any item will open the corresponding
URL in the default browser.
DIRECTX
DirectX Files
This page lists all installed DirectX files. Double-clicking any item will open the file properties window.
DirectX Video
This page provides DirectDraw device information. Double-clicking the drivers will run the DirectX Diagnostics
tool. Links to the graphics card manufacturer's driver download website are provided at the bottom of the page.
DirectX Sound
This page provides DirectSound device information. Double-clicking any of the listed devices will run the
DirectX Diagnostics tool.
DirectX Input
This page provides DirectInput device information (such as mouse and keyboard properties).

AIDA64 Engineer Page menu
68
DEVICES
Windows Devices
This page displays the same information as the Device Manager in Windows. But AIDA64 is capable of
recognizing devices not identified by Windows (listed as Unknown devices) and providing information about
them, which helps us find the appropriate drivers.
Physical Devices
This pages lists the physical devices found in the PC. All PCI, PCI Express, AGP, PnP or USB devices are
listed here, including those integrated on the motherboard.
PCI Devices
This page lists the PCI, PCI Express and AGP devices and provides detailed information about the AGP,
HyperTransport, PCI Express and QPI controllers. Links to the manufacturers' driver download websites are
provided at the bottom of the page.
USB Devices
This page lists the available USB controllers and USB devices. The USB controller icons are color-coded: USB
2.0 controllers are displayed in violet, while USB 3.0 controllers in blue.
Device Resources
This page lists the resources (port, IRQ, DMA, memory) used by Windows devices.
Input
This page lists the input devices (keyboard, mouse, game controller) and their properties.
Printers
This page lists the installed local and network printers and faxes along with their properties. Links to the
manufacturers' driver download websites are provided at the bottom of the page.

AIDA64 Engineer Page menu
69
SOFTWARE
Auto Start
This page lists the programs which are launched at Windows startup. Double-clicking on any of these items
will open their file properties window, while clicking “Remove” on the toolbar will remove the items from the list
(and will not launch at Windows startup).
Scheduled
This page lists the scheduled tasks configured in the Windows Task Scheduler.
Installed Programs
This page lists the programs installed on the operating system. Programs can be uninstalled directly from
AIDA64 by double-clicking them.
Licenses
This page lists the product keys for certain installed software (including Microsoft Windows and Office).
File Types
This page lists the file types registered in Windows.
Desktop Gadget
This page provides information about any Windows desktop gadgets which have been installed.

AIDA64 Engineer Page menu
70
SECURITY
Windows Security
This page provides basic operating system properties as well as User Account Control (UAC) and System
Restore status information. Supported Data Execution Prevention (DEP) technologies are also listed.
Windows Update
This page enumerates the security updates and hotfixes installed on the operating system.
Anti-Virus
This page provides information about any installed anti-virus programs, such as version number and virus
database date.
Firewall
This page provides information about any installed firewall programs, such as version number and status.
Anti-Spyware
This page provides information about any installed anti-spyware programs.
Anti-Trojan
This page provides information about any installed anti-trojan programs.

AIDA64 Engineer Page menu
71
CONFIG
Regional
This page provides an overview of the regional settings in Windows (Date and time zone, Language, Region,
Date format etc.). Double-clicking on any item will open the “Region and language” settings window.
Environment
This page enumerates the environment variables available in Windows. These can be used between % signs
in scripts or command-line commands.
Control Panel
This page lists those programs and services which are represented with an icon in the Control Panel. Double-
clicking them will open their settings page.
Recycle Bin
This page lists the recycle bins for each partition. We can empty recycle bins directly by double-clicking them.
System Files
This page lists the system files and their content.
System Folders
This page lists those folders which are created during Windows installation (for example: Program Files, Users
or AppData). Double-clicking them will open the folders in a new window.
Event Logs
This page displays the Windows event log. Double-clicking on any item will open their event properties.

AIDA64 Engineer Page menu
72
DATABASE
These pages provide information about the installed database software, such as database servers and driver
versions. Further details about the drivers (specifically, ODBC and BDE drivers) are found in the corresponding
sub-pages, where we can also find information about the ODBC Data Sources.
BENCHMARK
Besides the comprehensive benchmarks described in section 6.1 and 6.2, AIDA64 offers dedicated
microbenchmarks, which are available under the Benchmark category in the Page menu. These are synthetic
benchmarks, which means that they can be used to measure the theoretical maximum performance of the
system. Memory bandwidth, CPU and FPU benchmarks are built on the multi-threaded AIDA64 benchmark
engine that – since AIDA64 Engineer v4.00 – supports up to 640 simultaneous processing threads and 10
processor groups.
Thanks to AIDA64's huge reference result database, benchmark results can be compared to those of other
configurations. By clicking the “Results” button on the toolbar, we can save and manage our benchmark
results, and we can also hide reference results and user results, which are listed on the results page by default.
AIDA64 Engineer Page menu
73
Memory read, write, copy and latency
Memory benchmarks measure the maximum bandwidth achievable when performing the selected operations
(read, write, copy). The memory latency benchmark measures the time it takes for data to arrive in the integer
registers of the CPU after the issue of the read command.
CPU Queen
This simple integer benchmark focuses on the CPU's branch prediction capabilities and branch misprediction
penalties. It calculates solutions for the classic “N queens puzzle” on a 10x10 chessboard.
CPU PhotoWorxx
This integer benchmark measure CPU performance with several 2D photo processing algorithms. The test
mainly stresses the SIMD integer arithmetic execution units of the CPU and the memory subsystem.
CPU ZLib
This integer benchmark measures combined CPU and memory subsystem performance using the public ZLib
compression library.
CPU AES
This integer benchmark measures CPU performance using AES (Advanced Encryption Standard) data
encryption.
CPU Hash
This integer benchmark measures CPU performance using the SHA1 hashing algorithm.
FPU VP8
This benchmark measures video compression performance using version 1.1.0 of the Google VP8 (WebM)
video codec.
FPU Julia
This benchmark measures the single precision (or 32-bit) floating-point performance through the computation
of several “Julia” fractal frames.
FPU Mandel
This benchmark measures the double precision (or 64-bit) floating-point performance through the computation
of several “Mandelbrot” fractal frames.
FPU SinJulia
This benchmark measures the extended precision (or 80-bit) floating-point performance through the
computation of a single frame of a modified “Julia” fractal.

AIDA64 Engineer Contact
74
9 CONTACT
Bee Online International Kft.
Tüzér utca 8. 6. em. 45.
1134 Budapest
Hungary
Registration number: 01-09-983858
VAT number: HU23913013
E-mail: [email protected]
Tel. (+39) 0574 22022
Bee Online International is the official distributor of the AIDA64 product family in Italy.
v 1.0 – First edition
v 1.1 – GPGPU Benchmark description added
v 1.2 – Description of new functions introduced in AIDA64 v4.60 added


![fb.dreampif.comfb.dreampif.com/06-16-rep.txt · 2017-06-16-----[ AIDA64 Extreme ]----- Version AIDA64 v5.20.3400 Benchmark Module](https://img.dokumen.tips/doc/110x75/5acfe04e7f8b9a4e7a8d37f0/fb-aida64-extreme-version-aida64-v5203400-benchmark-module-.jpg)


![forums.autodesk.com · -----[ AIDA64 Extreme ]----- Versão](https://img.dokumen.tips/doc/110x75/5c6538bc09d3f2b26e8c5f1b/-aida64-extreme-versao-.jpg)

