Embed Size (px)
Citation preview
1.0
1.5
2.0
2.5
3.0
Neocort
ical S
UV
Rcb
Time (years)
Mean SUVR AD+
(2.33)
19.2 yr (95%CI 17-23 yrs)
Mean SUVR HC-
(1.17) 12.0 yr
(95%CI 10-15 yrs)
2.9%/yr (95%CI 2.5-3.3%/yr)
HC-
MCI+
AD
MCI-
HC+
0 10 20 30 40
AIBL: Aβ deposition over time
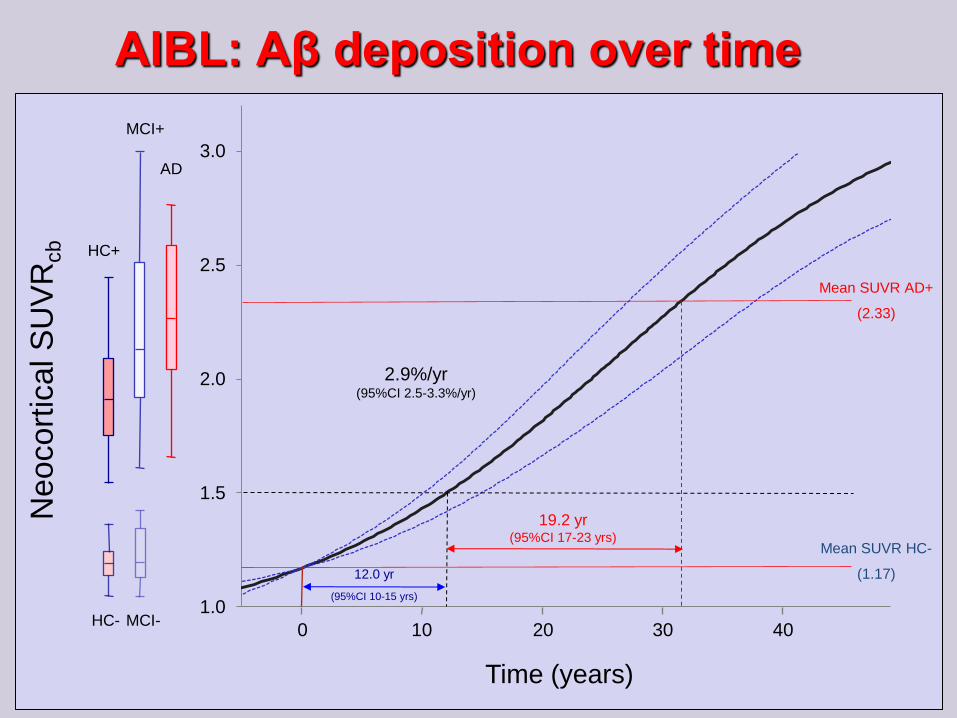
-30 -25 -20 -15 -10 -5 0
CDR 1.0
demented non-demented
Time (years)
cut-off
abnormal
normal
Relationship between “abnormality” and CDR of 1.0
Bio
ma
rke
r m
ag
nitu
de
Ab deposition (-17.0 yr)
Hippocampal volume (-4.2 yr)
Episodic memory (-3.3 yr)
Grey matter volume (-2.5 yr)
Non-memory (-1.3 yr)

Epis
odic
mem
ory
Ab burden
HC (n=193)
MCI (n=90)
AD (n=68)
R2 = 0.29 (p < 0.0001) R2 = 0.00 (n.s.)
High Ab Low Ab
R2 = 0.014 (p = 0.1)
Relationship between Ab burden
and episodic memory
High Ab Low Ab High Ab Low Ab
HC- HC+ MCI- MCI+ AD
Biomarker results

Translating dementia research into practice
Partner logo here
Reference: Biological Markers for Alzheimer’s Disease With Special Emphasis on Cerebrospinal Fluid b-Amyloid and Tau - TERO TAPIOLA
Research shows that measurement of pTau : Aβ1-42 Ratio in CSF is the best biomarker to date for Alzheimer’s Disease
Tau: Aβ1-42 Ratio - Sensitivity : 85.7% Specificity : 84.6%

13
13.5
14
14.5
15
15.5
16
MC NMC MCI AD
AP
OE
(m
g/d
l)
ANOVA , F = 14.105, P < 0.001
n = 391 n = 124 n = 199 n = 365
*
Tukey HSD, P < 0.001 vs. MC and NMC, P = 0.016 vs. MCI *
Full AIBL cohort (n=1079)
Mean of ApoE levels within clinical categories
(Gupta and Martins, 2010)

Proteomics: Data-mining McCUSKER
RESEARCH FOUNDATION
INC
ALZHEIMER’S
Biomarker panel
Two panels of biomarkers were selected from a dataset of 224 biomarkers
Set A – panel of 18 biomarkers
Set B – panel of 8 biomarkers
Set A performed with a Sens./Spec. of 85% in the AIBL cohort
Validation in ADNI at 77%
Set B performed with a Sens./Spec. of 83% in the AIBL cohort
Validation in ADNI at 80%

NUTRITION AND LIFESTYLE
FACTORS IN ALZHEIMER’S
DISEASE

High Education
Physical Activity
Healthy Diet
Mental Activity
Social
Engagement
Lifestyle factors in Alzheimer’s
Disease
HEALTHY
AGEING ALZHEIMER’S
DISEASE
Genetic Risk Factors
Socioeconomic
Factors
Hypertension
Depression
Head Trauma
Occupation
Bad Lifestyle Habits Modifiable in Mid-Late Life

AIBL Lifestyle Programme
Aim: Identification of lifestyle and
dietary modifications which prevent or
delay onset of AD

Dietary data

Data Collection
• Cancer Council of Victoria Food Frequency
Questionnaire (CCV FFQ)
• Quantify intake of 74 foods and beverages
• Examine dietary patterns
Baseline 36 month 54 month 72 month Follow-up: 18 month
Current Status
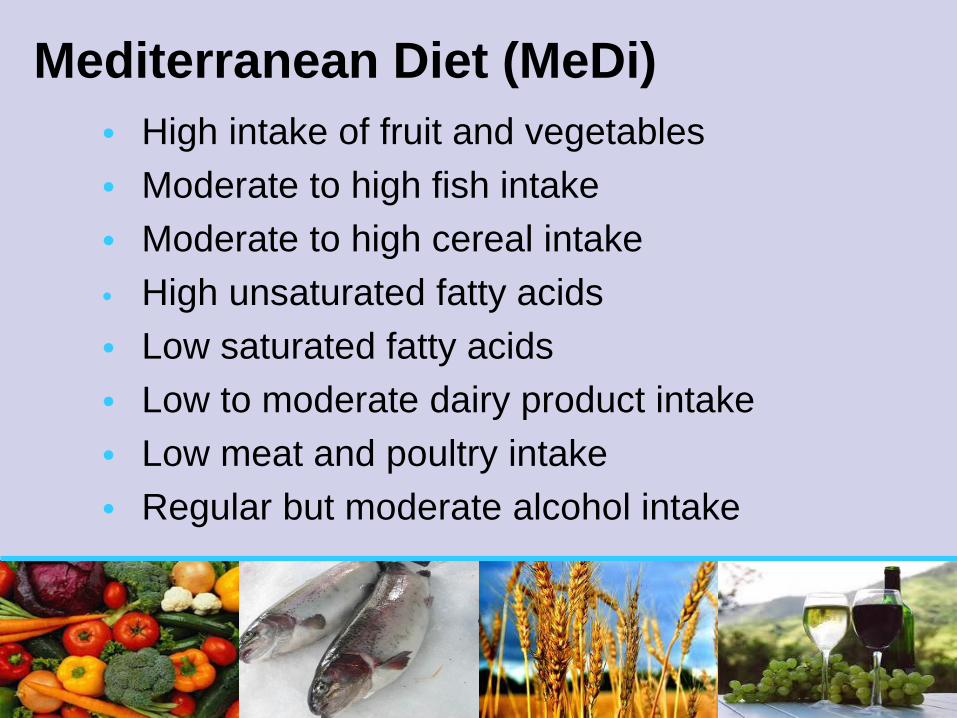
• High intake of fruit and vegetables
• Moderate to high fish intake
• Moderate to high cereal intake
• High unsaturated fatty acids
• Low saturated fatty acids
• Low to moderate dairy product intake
• Low meat and poultry intake
• Regular but moderate alcohol intake
Mediterranean Diet (MeDi)

• Higher MeDi adherence has been associated with lower risk of:
Obesity (Bullo et al., 2011)
Hypertension (Nunez-Cordoba et al., 2009)
Abnormal glucose metabolism (Gouveri et al., 2011)
Diabetes (Salas-Salvado et al., 2011)
Coronary heart disease (Kastorini et al., 2010)
Cognitive decline and AD (Feart et al., 2009)
Health Benefits and MeDi
Adherence

0
0.5
1
1.5
2
2.5
3
3.5
4
4.5
5
5.5
HC MCI AD
Me
an
Me
Di S
core
*** *
Mean ± SEM. *p<0.05; ***p<0.001; multinomial logistic
regression models. Controlling for age, gender, education,
APOE genotype, country of birth, BMI, total caloric intake,
smoking status, history of hypertension, angina, stroke,
diabetes and heart attack.
From: Gardener, Rainey-Smith et al., 2012. Translational
Psychiatry.
Higher Adherence to MeDi in Healthy
Controls compared to MCI and AD

MeDi Score
Pe
rce
nta
ge
of
He
alt
hy C
on
tro
ls
0
5
10
15
20
25
0 1 2 3 4 5 6 7 8 9
Percentage of Healthy Controls
with each MeDi Score

0
5
10
15
20
25
0 1 2 3 4 5 6 7 8
100%
100%
38%
50%
57%
70%
52%
67%
42%
55%
50%
66%
38%
62%
100%
50%
100%
100%
MeDi Score
Perc
en
tag
e o
f A
Ds
% past smokers % APOE ε4 positive
Percentage of ADs with each MeDi
Score

• Prudent diet - ‘healthy’
• Heavily loaded with vegetables, fruits and nuts
• Western diet - ‘unhealthy’
• Heavily loaded with red and processed meats,
high fat dairy products, chips, refined grains,
potatoes, sweets and condiments.
Additional Dietary Patterns Analysed

Prudent and Western Diet vs Cognition
over 36 months
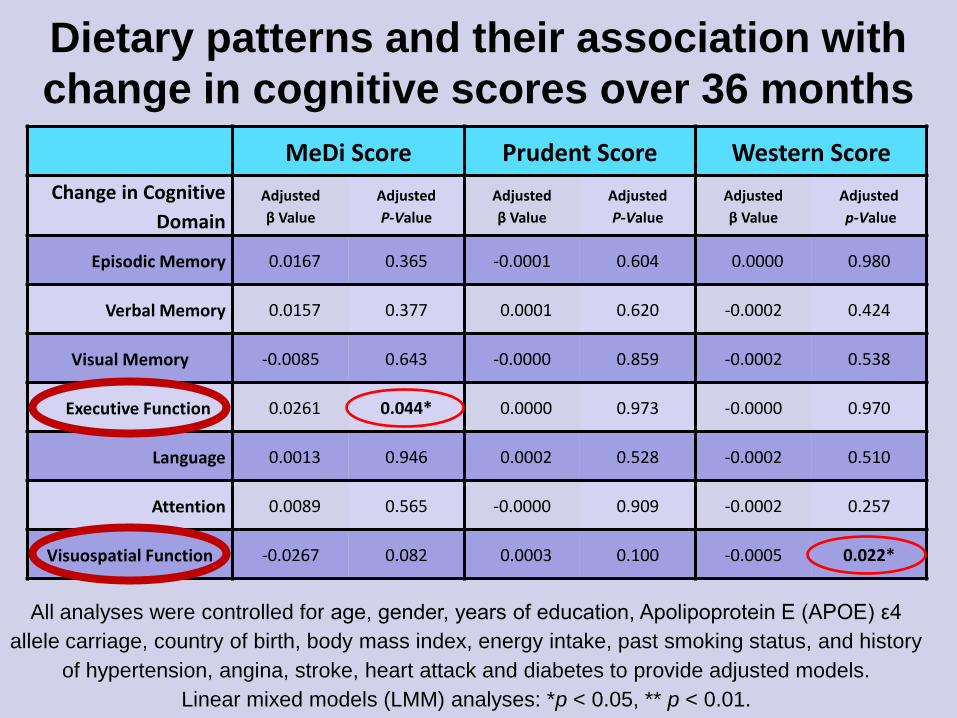
MeDi Score Prudent Score Western Score
Change in Cognitive
Domain
Adjusted
β Value
Adjusted
P-Value
Adjusted
β Value
Adjusted
P-Value
Adjusted
β Value
Adjusted
p-Value
Episodic Memory 0.0167 0.365 -0.0001 0.604 0.0000 0.980
Verbal Memory 0.0157 0.377 0.0001 0.620 -0.0002 0.424
Visual Memory -0.0085 0.643 -0.0000 0.859 -0.0002 0.538
Executive Function 0.0261 0.044* 0.0000 0.973 -0.0000 0.970
Language 0.0013 0.946 0.0002 0.528 -0.0002 0.510
Attention 0.0089 0.565 -0.0000 0.909 -0.0002 0.257
Visuospatial Function -0.0267 0.082 0.0003 0.100 -0.0005 0.022*
Dietary patterns and their association with
change in cognitive scores over 36 months
All analyses were controlled for age, gender, years of education, Apolipoprotein E (APOE) ε4
allele carriage, country of birth, body mass index, energy intake, past smoking status, and history
of hypertension, angina, stroke, heart attack and diabetes to provide adjusted models.
Linear mixed models (LMM) analyses: *p < 0.05, ** p < 0.01.

Physical activity data

Methods
• International physical activity questionnaire - Answers used to calculated metabolic equivalent score
(METs∙min/wk-1)
• Actigraph - Total counts (volume of activity)
- Peak counts (intensity of activity)
• To date all analyses have been on cognitively healthy controls only

0
1000
2000
3000
4000
5000
6000
7000
Acti
vit
y
TIME
Light
Moderate
Hard
Total Activity (Total
Counts)
Intensity
(Peak Counts)
Actigraph Output

Physical Activity and AD
• Physical activity has previously been associated with:
- Reduced cognitive decline and AD risk
- Enhanced cognitive functioning
• Most mechanistic studies have been animal studies
• AIBL array of biomarkers and comprehensive neuropsychological battery
- Potential to investigate association of physical activity with a number of AD-related factors in one cohort.

Cross-sectional analyses
Peak counts and cognitive
function
Raw and adjusted (for age, gender and YOE) of cognitive test score means (+
standard error) for each actigraphy intensity (peak count) tertile. 1RCFT, Rey figure
complex test.
Brown et al (2012), Translational Psychiatry.
Actigraphy Intensity Tertiles
Actigraphy Intensity Tertiles

Cross-sectional analyses
Physical activity (IPAQ) and PiB
SUVR
Adjusted means ± standard error (corrected for age, gender and years of education) of PiB
SUVR for each self-report IPAQ tertile; after stratification by APOE ε4 allele carriage.
From: Brown et al 2012, Molecular Psychiatry.
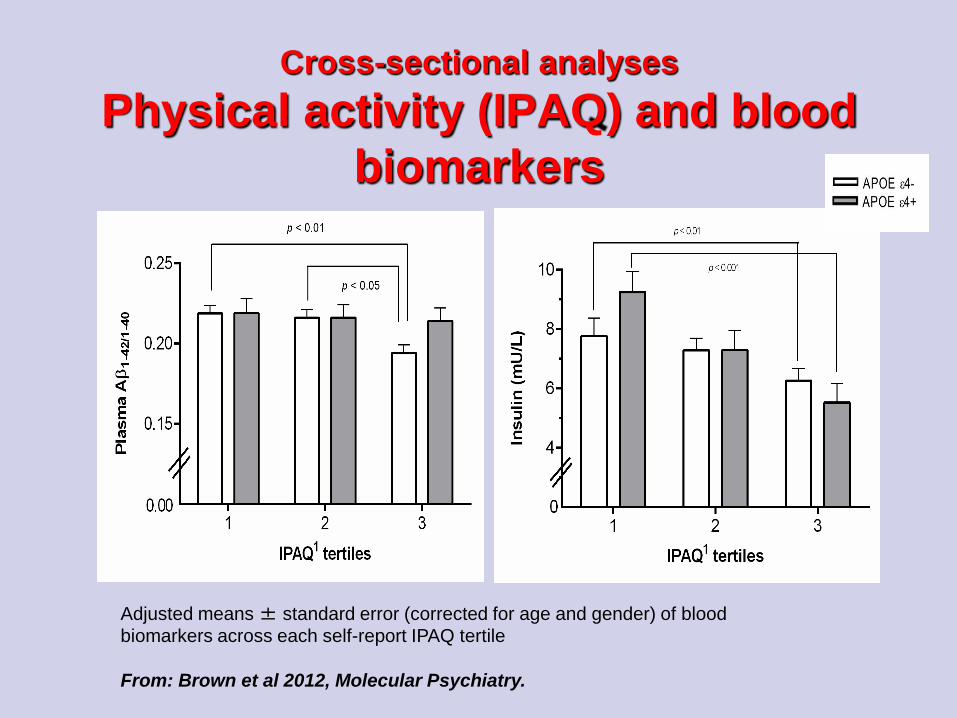
Cross-sectional analyses
Physical activity (IPAQ) and blood
biomarkers
Adjusted means ± standard error (corrected for age and gender) of blood
biomarkers across each self-report IPAQ tertile
From: Brown et al 2012, Molecular Psychiatry.

Hippocampal Volume and
Physical Activity
Those undertaking higher physical activity have larger
hippocampal volumes

Cognitive stream results

Anticholinergics
• Anticholinergic drugs associated with
modest cognitive difficulty – Sittirannorit et
al. 2011

Predictors of rapid decline in AD
• Alessandro Sona, Ping Zhang et al. (in press at Int Psychogeriatrics)
• 211 AD at baseline – 156 followed at 18 months
• 33% (51) rapid decliners (lost 6+ MMSE points in 18 months)
• Higher CDR and CDR box score plus baseline prescription of a CheI predicted faster decline (OR 3.4 univariate)

Subjective Memory Complaints –
Rachel Buckley
• AIM: Does affect, memory or AD
biomarkers predict subjective memory
complaints in healthy elderly controls or
patients with MCI?
• Dependent variable: Memory Assessment
Clinics Self-Rating Questionnaire (MAC-Q)

Predictors of memory complaint
severity
Significant predictor (p < 0.003)
Sub-threshold predictor (p > 0.05)

Impact of AIBL
• 130+ publications to date
• Enabled training of 18 PhD students and 13
postdoctoral fellows
• Furthered international research efforts in AD
through data being made accessible worldwide
via EOI and uploading a subset of AIBL data
(ADNI compatible data) onto LONI websites.
• AIBL data accessed over 429 times via LONI
website, facilitating international collaboration
and co-operation for understanding AD.
• Established an IP portfolio of 3 patents and
licensable software.
• If the initial investment is to be worthwhile
the cohort should be followed for 10-20
years
• Only over this kind of time period can the
predictors of decline in initially healthy
subjects be reliably determined

* AIBL management committee
Prof. David Ames
Prof. Lynne Cobiac
Prof. Ralph Martins
Prof. Colin Masters
Prof. Christopher Rowe
Dr. Lance Macauley
Dr Kevin Taddei
Dr Alan Rembach
Dr Stephanie Rainey-Smith
Dr Ian Cooke
Dr Larry Ward
* The AIBL study team comprises 80+ scientists (see www.aibl.csiro.au)
and over 1400 Australian research volunteers
The AIBL management team

• CSIRO (AUS)
• National Health and Medical Research Council (NHMRC) (AUS)
• Alzheimer’s Association (USA)
• Alzheimer’s Drug Discovery Foundation (USA)
• An Anonymous Foundation (USA)
• Pfizer
• GE Healthcare
• Astra Zeneca
• Science and Industry Endowment Fund
Financial Supporters

AIBL study participants, their families, and the AIBL study team
Acknowledgements and
thanks
Osca Acosta
David Ames
Jennifer Ames
Manoj Agarwal
David Baxendale
Justin Bedo
Carlita Bevage
Lindsay Bevege
Pierrick Bourgeat
Belinda Brown
Rachel Buckley
Samantha Burnham
Ashley Bush
Tiffany Cowie
Kathleen Crowley
Andrew Currie
David Darby
Daniela De Fazio
Kim Lucy Do
James Doecke
Harriet Downing
Denise El- Sheikh
Kathryn Ellis
Kerryn Dickinson
Noel Faux
Jonathan Foster
Jurgen Fripp
Christopher Fowler
Samantha Gardener
Veer Gupta
Gareth Jones
Adrian Kamer
Jane Khoo
Asawari Killedar
Neil Killeen
Tae Wan Kim
Adam Kowalczyk
Eleftheria Kotsopoulos
Gobhathai Kunarak
Rebecca Lachovitski
Simon Laws
Nat Lenzo
Qiao-Xin Li
Xiao Liang
Kathleen Lucas
James Lui
Georgia Martins
Ralph Martins
Paul Maruff
Colin Masters
Yumiko Matsumoto
Sabine Matthaes
Simon McBride
Andrew Milner
Claire Montague
Lynette Moore
Audrey Muir
Christopher O’Halloran
Graeme O'Keefe
Anita Panayiotou
Athena Paton
Jacqui Paton
Jeremiah Peiffer
Svetlana Pejoska
Kelly Pertile
Kerryn Pike
Lorien Porter
Roger Price
Parnesh Raniga
Alan Rembach
Carolina Restrepo
Miroslava Rimajova
Jo Robertson
Elizabeth Ronsisvalle
Rebecca Rumble
Mark Rodrigues
Christopher Rowe
Stephanie Rainey-Smith
Olivier Salvado
Jack Sach
Greg Savage
Cassandra Szoeke
Kevin Taddei
Tania Taddei
Brett Trounson
Marinos Tsikkos
Victor Villemagne
Stacey Walker
Vanessa Ward
Michael Weinborn
Andrea Wilson
Bill Wilson
Michael Woodward
Olga Yastrubetskaya
Ping Zhang
AIBL is a large collaborative study and a complete list of contributors can be
found at www.aibl.csiro.au AIBL is funded in part by a grant from the Science
and Industry Endowment Fund. We thank all who took part in the study.