Embed Size (px)
Citation preview
HAIsHealthcare-Associated Infections
PREVENT
CUSP
AHRQ Safety Program for Long-Term Care:Preventing CAUTI and Other HAIs
AHRQ Safety Program for Long-Term Care: Preventing CAUTI and Other HAIs Final Report Prepared for: Agency for Healthcare Research and Quality (AHRQ) U.S. Department of Health and Human Services Contract Number: HHSA 290201000025I Prepared by: Health Research & Educational Trust A project conducted by the Health Research & Educational Trust in partnership with: Abt Associates Association for Professionals in Infection Control and Epidemiology Baylor College of Medicine Qualidigm Society of Hospital Medicine University of Michigan AHRQ Publication No. 16(17)-0003-1-EF May 2017
This project was funded under contract number HHSA290201000025I from the Agency for Healthcare Research and Quality (AHRQ), U.S. Department of Health and Human Services. The opinions expressed in this document are those of the authors and do not reflect the official position of AHRQ or the U.S. Department of Health and Human Services. This document may be used and reprinted without permission except those copyrighted materials that are clearly noted in the document. Further reproduction of those copyrighted materials is prohibited without the express permission of copyright holders.
AHRQ Safety Program for Long-Term Care: HAIs/CAUTI Final Report 2
Contents Executive Summary ........................................................................................................................................................... 8
Purpose ............................................................................................................................................................................ 8
Background ..................................................................................................................................................................... 8
Objectives ....................................................................................................................................................................... 9
C.A.U.T.I. Intervention .......................................................................................................................................... 10
T.E.A.M.S. Intervention ......................................................................................................................................... 11
Program Spread ........................................................................................................................................................... 11
Impact ............................................................................................................................................................................ 12
Glossary of Terms and Abbreviations ........................................................................................................................ 17
Background ........................................................................................................................................................................ 18
Program Implementation ............................................................................................................................................... 20
Key People and Partnerships .................................................................................................................................... 20
Program Stakeholders ........................................................................................................................................... 20
National Project Team .......................................................................................................................................... 21
HRET Staff ................................................................................................................................................................ 22
Organizational Leads .............................................................................................................................................. 22
Faculty Coaches ...................................................................................................................................................... 22
Long-Term Care Facilities .................................................................................................................................... 23
Residents and Families ........................................................................................................................................... 23
Technical Expert Panel .......................................................................................................................................... 23
Other Relationships ............................................................................................................................................... 23
Project Components .................................................................................................................................................. 24
Recruitment Strategy ............................................................................................................................................. 24
Educational Events and Resources ..................................................................................................................... 24
Supplemental Material, Manuals, and National Project Web Site ............................................................... 29
Project Measures .................................................................................................................................................... 30
Stakeholder Feedback ............................................................................................................................................ 36
Project Results.................................................................................................................................................................. 38
Recruitment and Retention ...................................................................................................................................... 38
Statistical Analysis ....................................................................................................................................................... 39
Modeling Approaches ............................................................................................................................................ 39
Inclusion/Exclusion Criteria ................................................................................................................................. 40
Facility Characteristics ............................................................................................................................................... 40
AHRQ Safety Program for Long-Term Care: HAIs/CAUTI Final Report 3

Main Outcomes—Facilities From Cohorts 1–4................................................................................................... 41
Data Submission ...................................................................................................................................................... 41
Outcome Measures: Model-Based Results—Cohorts 1–4 .......................................................................... 42
Process Measures: Model-Based Results—Cohorts 1–4 .............................................................................. 48
Sensitivity Analyses ................................................................................................................................................. 54
Knowledge Questionnaire .................................................................................................................................... 54
Nursing Home Survey on Patient Safety Culture (Safety Culture Survey) ............................................... 57
Discussion .......................................................................................................................................................................... 61
Insights From Stakeholder Feedback ...................................................................................................................... 62
Lessons Learned: Challenges and Success Factors .............................................................................................. 63
Lessons Specific to Environment ........................................................................................................................ 63
Lessons Specific to Program Implementation .................................................................................................. 67
Sustainability ...................................................................................................................................................................... 72
Tools and Resources .................................................................................................................................................. 72
Manuscripts ................................................................................................................................................................... 72
Recommendations for Continued QI Work ........................................................................................................ 73
Appendix A. C.A.U.T.I. Infographic ............................................................................................................................. 75
Appendix B. T.E.A.M.S. Infographic ............................................................................................................................. 76
Appendix C. Exclusion Criteria .................................................................................................................................... 77
Appendix D. Cohort Results ........................................................................................................................................ 78
Appendix E. Cohort 5 Results ...................................................................................................................................... 80
Appendix F. Webinar and Module Topics ................................................................................................................. 83
Onboarding Webinars ............................................................................................................................................... 83
Training Modules ......................................................................................................................................................... 83
Long-Term Care Safety Toolkit ............................................................................................................................... 83
National Content Webinars ..................................................................................................................................... 84
Appendix G. Assessments ............................................................................................................................................. 86
Facility Demographics ................................................................................................................................................ 86
Nursing Home Survey on Patient Safety Culture (Safety Culture Survey) ................................................... 97
Knowledge Questionnaire—Licensed Staff ....................................................................................................... 104
Knowledge Questionnaire—Nonlicensed Staff ................................................................................................ 117
Appendix H. Contract Deliverables Table ............................................................................................................. 126
Appendix I. NHSN Long-Term Care Facility Component: Urinary Tract Infection .................................... 129
AHRQ Safety Program for Long-Term Care: HAIs/CAUTI Final Report 4

Appendix J. Lead Organizations by Cohort............................................................................................................ 141
AHRQ Safety Program for Long-Term Care: HAIs/CAUTI Final Report 5
Figures Figure 1. Map of Enrolled States/Facilities (n=652) ............................................................................................ 11 Figure 2. LTC NHSN CAUTI Rate (CAUTIs per 1,000 Catheter Days), Cohorts 1–4 ........................... 13 Figure 3. Population CAUTI Rate (CAUTIs per 10,000 Resident Days), Cohorts 1–4 ............................ 14 Figure 4. Catheter Utilization, Cohorts 1–4 ........................................................................................................ 15 Figure 5. Urine Culture Collection Rate, Cohorts 2–4 .................................................................................... 16 Figure 6. Operational Stakeholders for the AHRQ Safety Program for LTC: HAIs/CAUTI ................... 21 Figure 7. Cohort 1 Data Collection Schedule ..................................................................................................... 31 Figure 8. Cohorts 2–4 Data Collection Schedule .............................................................................................. 31 Figure 9. Cohort 5 Data Collection Schedule ..................................................................................................... 32 Figure 10. Percentage of Active Facilities Submitting Outcome Data by Program Month (n=505) ......... 42 Figure 11. NHSN CAUTI Rate (CAUTIs per 1,000 Catheter Days), Cohorts 1–4 ..................................... 43 Figure 12. Population CAUTI Rate (CAUTIs per 10,000 Resident Days), Cohorts 1–4 ............................ 44 Figure 13. NHSN CAUTI Rate (CAUTIs per 1,000 Catheter Days), Non-VA (Cohorts 1–4) vs. VA
(Cohort 3) .................................................................................................................................................. 46 Figure 14. Population CAUTI Rate (CAUTIs per 10,000 Resident Days), Non-VA (Cohorts 1–4) vs.
VA (Cohort 3) ........................................................................................................................................... 47 Figure 15. Catheter Utilization, Cohorts 1–4 ........................................................................................................ 49 Figure 16. Catheter Utilization, Non-VA (Cohorts 1–4) vs. VA (Cohort 3) ................................................. 50 Figure 17. Urine Culture Collection Rate, Cohorts 2–4 .................................................................................... 52 Figure 18. Urine Culture Collection Rate, Non-VA (Cohorts 2–4) vs. VA (Cohort 3) ............................. 53 Figure 19. Cohort 1–4 Knowledge Questionnaire Results—Licensed Staff .................................................. 56 Figure 20. Cohort 1–4 Knowledge Questionnaire Results—Nonlicensed Staff ........................................... 57 Figure 21. Safety Culture Survey Results—Cohorts 1–4 Aggregate ................................................................ 59 Figure 22. Safety Culture Survey Results—Cohorts 1–4 Aggregate Results for Facilities With at
Least 5 Reports at Baseline and Followup (n=202) .......................................................................... 60 Figure 23. NHSN CAUTI Rate (CAUTIs per 1,000 Catheter Days), by Cohort ......................................... 78 Figure 24. Population CAUTI Rate (CAUTIs per 10,000 Resident Days), by Cohort ................................ 78 Figure 25. Catheter Utilization, by Cohort ............................................................................................................ 79 Figure 26. Urine Culture Collection Rate, by Cohort ........................................................................................ 79 Figure 27. NHSN CAUTI Rate (CAUTIs per 1,000 Catheter Days), Cohort 5 ........................................... 80 Figure 28. Population CAUTI Rate (CAUTIs per 10,000 Resident Days), Cohort 5 .................................. 81 Figure 29. Catheter Utilization, Cohort 5 .............................................................................................................. 81 Figure 30. Urine Culture Order Rate, Cohort 5 .................................................................................................. 82
Tables Table 1. Number of CAUTIs, Catheter Days, and Facilities Reporting ....................................................... 13 Table 2. Number of CAUTIs, Resident Days, and Facilities Reporting ....................................................... 14 Table 3. Number of Catheter Days, Resident Days, and Facilities Reporting ........................................... 15 Table 4. Number of Urine Cultures, Resident Days, and Facilities Reporting ........................................... 16 Table 5. Webinars, Modules, Conference Calls, and Meetings ...................................................................... 26 Table 6. Measurement Components and Data Collection Schedule ............................................................ 30 Table 7. Cohort 1 and Cohorts 2–5 Initial Data Collection and Submission............................................. 32 Table 8. Recruitment and Retention by Cohort ............................................................................................... 38 Table 9. Stages of Withdrawals (n=147) ............................................................................................................. 39 Table 10. Participating vs. Nonparticipating Facility Characteristics ............................................................... 41
AHRQ Safety Program for Long-Term Care: HAIs/CAUTI Final Report 6

Table 11. Number of CAUTIs, Catheter Days, and Facilities Reporting ....................................................... 44 Table 12. Number of CAUTIs, Resident Days, and Facilities Reporting ....................................................... 45 Table 13. Number of CAUTIs, Catheter Days, and Facilities Reporting, Non-VA Facilities
(Cohorts 1–4) ............................................................................................................................................ 46 Table 14. Number of CAUTIs, Catheter Days, and Facilities Reporting, VA Facilities (Cohort 3) ........ 47 Table 15. Number of CAUTIs, Resident Days, and Facilities Reporting, Non-VA Facilities
(Cohorts 1–4) ............................................................................................................................................ 48 Table 16. Number of CAUTIs, Resident Days, and Facilities Reporting, VA Facilities (Cohort 3) ......... 48 Table 17. Number of Catheter Days, Resident Days, and Facilities Reporting ........................................... 50 Table 18. Number of Catheter Days, Resident Days, and Facilities Reporting, Non-VA Facilities
(Cohorts 1–4) ............................................................................................................................................ 51 Table 19. Number of Catheter Days, Resident Days, and Facilities Reporting, VA Facilities
(Cohort 3) .................................................................................................................................................. 51 Table 20. Number of Urine Cultures, Resident Days, and Facilities Reporting ........................................... 52 Table 21. Number of Urine Cultures, Resident Days, and Facilities Reporting, Non-VA Facilities
(Cohorts 2–4) ............................................................................................................................................ 53 Table 22. Number of Urine Cultures, Resident Days, and Facilities Reporting, VA Facilities
(Cohort 3) .................................................................................................................................................. 54 Table 23. Knowledge Questionnaire Submission Windows by Cohort ........................................................ 55 Table 24. Knowledge Questionnaire Submission Rates by Cohort—At Least One Submission ............ 55 Table 25. Knowledge Questionnaire Submission Rates by Cohort—At Least 10 Submissions .............. 55 Table 26. Safety Culture Survey Submission Windows by Cohort ................................................................. 57 Table 27. Safety Culture Survey Submission Rates—Any Staff Submitting ................................................... 58 Table 28. Safety Culture Survey Submission Rates—At Least 60% of Staff Submitting ............................. 58 Table 29. Onboarding Webinar Topics ................................................................................................................. 83 Table 30. Training Module Topics ........................................................................................................................... 83 Table 31. Long-Term Care Safety Toolkit Module Topics................................................................................ 84 Table 32. National Content Webinar Topics, by Month ................................................................................... 85
AHRQ Safety Program for Long-Term Care: HAIs/CAUTI Final Report 7

Executive Summary Purpose This report summarizes the Agency for Healthcare Research and Quality (AHRQ) Contract HHSA290201000025I, PRISM Order Number HHSA29032008T, Task Order #8, from September 19, 2013, through September 18, 2016, titled National Implementation of Comprehensive Unit-based Safety Program (CUSP) to Reduce Catheter-Associated Urinary Tract Infection (CAUTI) in Long-Term Care Facilities. In 2015, AHRQ renamed the program AHRQ Safety Program for Long-Term Care: HAIs/CAUTI. The purpose of the contract was to adapt CUSP, which was initially developed for the acute care setting, for use in long-term care (LTC) facilities. Additional tasks included developing State or regional consortia to recruit LTC facilities and implement this program to reduce healthcare-associated infections (HAIs), specifically CAUTI. This report provides results from the evaluation of the impact of this program; summarizes information about the quality improvement (QI) technical assistance provided to facilities, including educational activities such as learning sessions, onboarding Webinars, training modules, and coaching calls; and outlines program enhancements and lessons learned during the contract period as well as recommendations for future QI initiatives in this health care setting.
Background Healthcare-associated infections (HAIs) are especially significant in LTC settings, as they have been estimated to account for 1.6 million to 3.8 million infections and 388,000 deaths annually.1,2 Additionally, infections have very high costs for LTC facilities: $38 million to $137 million annually for antimicrobial therapy and $673 million to $2 billion for hospitalizations.3 CAUTI is a costly and potentially life-threatening HAI for LTC residents and was identified as one of five priority areas in Phase Three of the United States Department of Health and Human Services (HHS) National Action Plan to Prevent Health Care-Associated Infections.4 An estimated 7 percent to 10 percent of all LTC residents have urinary catheters, including 12 percent of all new admissions at the time of transfer from acute
1 Richards CL. Infections in residents of long-term care facilities: an agenda for research. Report of an expert panel. J Am Geriatr Soc 2002;50:570-6 PMID: 11943058.
2 Montoya A, Cassone M, Mody L. Infections in nursing homes: epidemiology and prevention programs. Clin Geriatr Med 2016;32(3):585-607
3 Cohen CC, Choi YJ, Stone PW. Costs of infection prevention practices in long-term care settings: a systematic review. Nurs Econ 2016 Jan-Feb;34(1):16-24.
4 U.S. Department of Health & Human Services. National Action Plan to Prevent Health Care-Associated Infections: Road Map to Elimination. April 2013. Retrieved from https://health.gov/hcq/prevent-hai-action-plan.asp#phase3.
AHRQ Safety Program for Long-Term Care: HAIs/CAUTI Final Report 8

care facilities to LTC facilities.5,6 The AHRQ Safety Program for LTC: HAIs/CAUTI promotes the use of bundles or combinations of interventions to reduce CAUTIs, prevent infections, and improve the safety culture in LTC facilities.
The AHRQ Safety Program for LTC: HAIs/CAUTI was coordinated at the national level by the Health Research & Educational Trust (HRET), the research affiliate of the American Hospital Association. HRET’s national project team members included Abt Associates, the Association for Professionals in Infection Control and Epidemiology (APIC), Baylor College of Medicine, Qualidigm, Society of Hospital Medicine (SHM), and the University of Michigan. In addition to the national project team, central program partners (i.e., lead organizations) were relied upon to coordinate, promote, and coach facility teams as they implemented the CAUTI prevention protocols and the C.A.U.T.I. and T.E.A.M.S. interventions, both of which are defined below. Lead organizations included State hospital associations, State-based and professional organizations, national partners from LTC corporations, State and regional organizations with expertise in QI, and the Department of Veterans Affairs (VA). AHRQ and HRET also worked with Federal partners, the Centers for Disease Control and Prevention (CDC), and the Centers for Medicare & Medicaid Services (CMS).
Objectives The objectives of this initiative were to develop and implement a program to support the development, implementation, adoption, and use of a CUSP to reduce CAUTI in LTC facilities and nursing homes in all States, the District of Columbia, and Puerto Rico through State-based or regional consortia or collaboratives in a phased approach. This includes flexible training resources that build on the existing acute-care hospital oriented CUSP for CAUTI materials 7,8,9 and can be adapted to meet the needs of LTC facilities and nursing homes.
5 Smith PW, Bennett G, Bradley SF, et al. SHEA/APIC Guideline: Infection prevention and control in the long-term care facility. Infect Control Hosp Epidemiol 2008;29:785-814. PMID: 18786461.
6 Mody L, Bradley SF, Galecki A, et al. Conceptual model for reducing infections and antimicrobial resistance in skilled nursing facilities: focus on residents with indwelling devices. Clin Infect Dis 2011;52:654-61. PMID: 21292670.
7 AHRQ Web site: http://www.ahrq.gov/professionals/quality-patient-safety/hais/tools/cauti-hospitals/index.html.
8 Fakih MG, Krein SL, Edson B, et al. Engaging health care workers to prevent catheter-associated urinary tract infection and avert patient harm. Am J Infect Control 2014 Oct;42(10 Suppl):S223-9.
9 Saint S, Greene MT, Krein SL, et al. A program to prevent catheter-associated urinary tract infection in acute care. New Engl J Med 2016;374:2111-2119.
AHRQ Safety Program for Long-Term Care: HAIs/CAUTI Final Report 9

The C.A.U.T.I. intervention is made up of evidence-based 10 infection prevention practices focused on catheter removal, catheter management, urine culture ordering,11 and antimicrobial stewardship 12 and how these practices influence transitions of care. The T.E.A.M.S. intervention focuses on the importance of having a good safety culture and uses TeamSTEPPS (Team Strategies and Tools to Enhance Performance and Patient Safety) training on teamwork and communication. The national project team developed infographics (Appendix A and Appendix B) to assist facilities in implementing these interventions.
C.A.U.T.I. Intervention • Catheters in newly admitted (and readmitted) residents should be removed to assess if still
needed; every resident deserves a chance to be “catheter free.” • Aseptic insertion of indwelling catheters is essential, with hand hygiene before and after every
resident contact and barrier precautions 13,14 during intimate (e.g., toileting, bathing) assistance with activities of daily living.
• Use catheters only if indicated; routine assessments of catheter need (daily for short-term residents, monthly for long-term residents) should be conducted, and alternatives should be considered (such as intermittent catheterization, use of bladder scanner protocols to decrease need for catheterization, and other noncatheter solutions for incontinence).
• Training and mentorship of staff and family regarding catheter care are important, emphasizing the following points: keep the drainage bag below the bladder, no violations of “closed” drainage system, and learn the appropriate use of leg bags.
• Incontinence care planning to address individual resident challenges and solutions is important, including behavioral interventions such as timed and prompted voiding and appropriate medical management.
10 Meddings J, Saint S, Krein S, et al. Systematic review of interventions to reduce catheter-associated urinary tract infection in the long-term care setting. Open Forum Infect Dis 2014;1(Suppl 1):S252-3.
11 Trautner BW, Grigoryan L, Petersen NJ, et al. Effectiveness of an antimicrobial stewardship approach for urinary catheter-associated asymptomatic bacteriuria. JAMA Intern Med 2015 Jul;175(7):1120-7.
12 Crnich CJ, Jump R, Trautner B, et al. Optimizing antibiotic stewardship in nursing homes: a narrative review and recommendations for improvement. Drugs Aging 2015 Sep;32(9):699-716.
13 Mody L, Krein SL, Saint S, et al. A targeted infection prevention intervention in nursing home residents with indwelling devices: a randomized clinical trial. JAMA Internal Med 2015;175:714-723.
14 Roghmann MC, Johnson JK, Sorkin JD, et al. Transmission of methicillin-resistant Staphylococcus aureus (MRSA) to healthcare worker gowns and gloves during care of nursing home residents. Infect Control Hosp Epidemiol 2015 Sep;36(9):1050-7.
AHRQ Safety Program for Long-Term Care: HAIs/CAUTI Final Report 10

T.E.A.M.S. Intervention • Team Formation—Form a diverse team that will plan, champion, and implement the program. • Excellent Communication—Encourage and educate the team on communication strategies. • Assess What’s Working—Evaluate current culture, data, and practices; learn and implement;
and continually reevaluate. • Meet Monthly—Meet with the team regularly to discuss successes and barriers and to review
data trends. • Sustain Efforts—Plan for program sustainability early, and integrate program elements into
daily workflow.
Program Spread HRET partnered with State hospital associations, State or regional organizations with expertise in QI, the VA, and other health care organizations (e.g., Genesis HealthCare) to support the implementation of this program. These lead organizations were tasked with recruiting facilities within their State or region, ensuring facilities were actively participating in the program (e.g., attending educational sessions, submitting data), and disseminating any program-related information, materials, and resources developed by the national project team. A full list of lead organizations is included in Appendix J.
A total of 652 LTC facilities were recruited into five cohorts across 48 States, the District of Columbia, and Puerto Rico. Of these 652 facilities, 505 completed the program and 147 withdrew. Figure 1 highlights program participation by State. In some cases, multiple lead organizations within the same State recruited facilities to participate in this program (e.g., Missouri Center for Patient Safety recruited facilities from Missouri for Cohort 2, while Presbyterian Manors of Mid-America recruited facilities from Missouri and Kansas for Cohort 4).
Figure 1. Map of Enrolled States/Facilities (n=652)
AHRQ Safety Program for Long-Term Care: HAIs/CAUTI Final Report 11

Impact For this report, the national project team assessed changes in outcomes over time for the facilities in Cohorts 1–4 that were active at the end of the program and submitted data for at least two time periods. Cohort 5 was analyzed separately because of its compressed data submission schedule and difference in program implementation. For Cohort 5, HRET staff assumed the role of the organizational leads and worked with the facilities directly in communicating the educational content, tools, and resources and following up on data submission. During analysis, the national project team found no significant differences in outcome rates between cohorts. Therefore, all analyses and figures in this report illustrate Cohort 1–4 aggregate results unless otherwise specified. Rates broken down by cohort are included in the appendices of this report.
The main outcome measure used for this program was the CAUTI rate, defined using CDC’s 2015 National Healthcare Safety Network (NHSN) LTC definition (see Appendix I).15 Indwelling urinary catheter utilization and urine culture collection rates were also used to monitor progress in achieving the goals of this program.16,17 Only 20 facilities submitted data into the NHSN system; the rest of the participating LTC facilities submitted their data into HRET’s Comprehensive Data System (CDS). The aggregate CAUTI, catheter utilization, and urine culture collection measures for Cohorts 1–4 by program period are presented graphically in Figures 2–5. The numerators, denominators, and number of reporting facilities for each outcome measure are presented in Tables 1–4. Overall, the Month 1 (M1) crude aggregate CAUTI rate using the NHSN definition for LTC (see Equation 1 in Project Measures) was 5.79 CAUTIs per 1,000 catheter days. This rate decreased to 2.72 CAUTIs per 1,000 catheter days in M12, a 47-percent reduction (incidence rate ratio (IRR) = 0.53, 95% confidence interval (CI) = 0.43 to 0.65, p<0.0001). Similarly, population-based CAUTI rates (see Equation 2) decreased by 51 percent (IRR=0.49, 95% CI=0.39 to 0.61, p<0.0001), from 3.00 to 1.47 CAUTIs per 10,000 resident days. Conversely, catheter utilization (see Equation 3) did not change significantly (IRR=0.96, 95% CI=0.90 to 1.04, p=0.31). Urine culture orders decreased from 3.69 at M1 to 3.29 urine cultures per 1,000 resident days at M12, a 14-percent reduction (IRR=0.86, 95% CI=0.79 to 0.94, p<0.0001).
15 Stone ND, Palms D, Nguyen D, et al. Long-term care facilities enrolled in the National Healthcare Safety Network (NHSN), January 2013-December 2014: examining reporting patterns of early adopters. Open Forum Infect Dis 2015;2(Suppl 1):S133.
16 Ground K, Jones W, Drake C, et al. Antibiotic treatment for urinary tract infections in nursing homes: identifying opportunities for antimicrobial stewardship. Open Forum Infect Dis 2015;2(Suppl 1):S46.
17 Trautner BW, Grigoryan L, Petersen NJ, et al. Effectiveness of an antimicrobial stewardship approach for urinary catheter-associated asymptomatic bacteriuria. JAMA Intern Med 2015 Jul;175(7):1120-7.
AHRQ Safety Program for Long-Term Care: HAIs/CAUTI Final Report 12
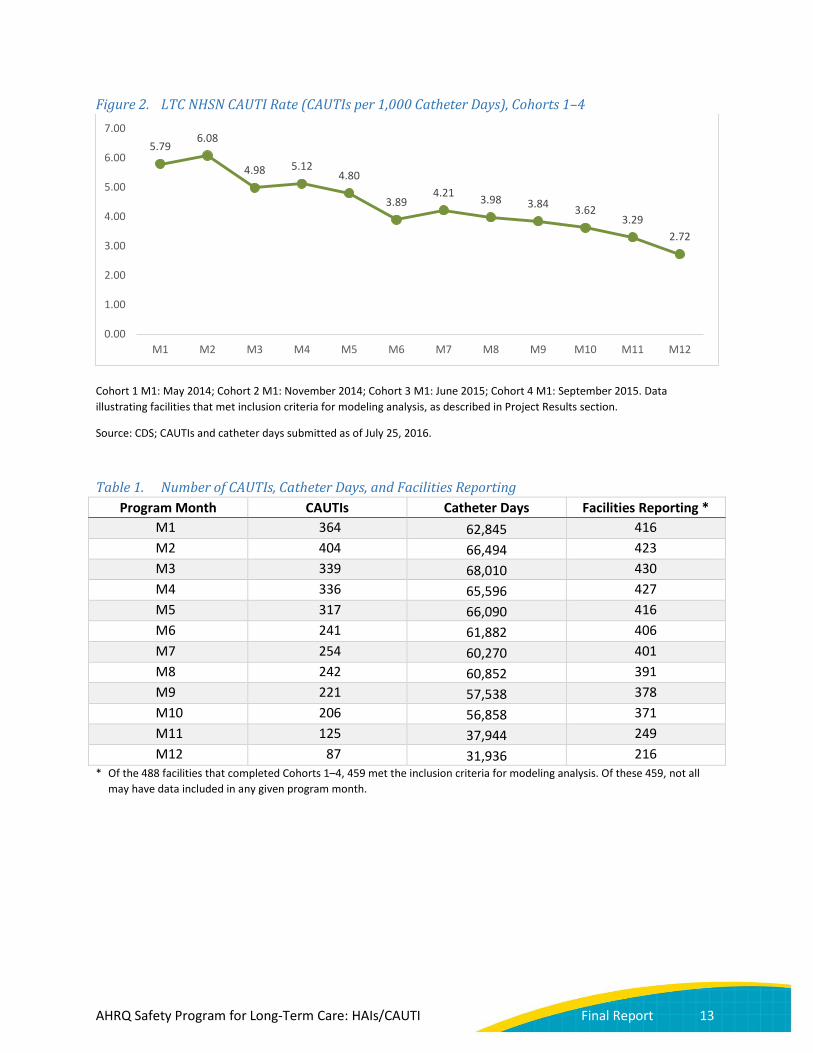
Figure 2. LTC NHSN CAUTI Rate (CAUTIs per 1,000 Catheter Days), Cohorts 1–4
Cohort 1 M1: May 2014; Cohort 2 M1: November 2014; Cohort 3 M1: June 2015; Cohort 4 M1: September 2015. Data illustrating facilities that met inclusion criteria for modeling analysis, as described in Project Results section.
Source: CDS; CAUTIs and catheter days submitted as of July 25, 2016.
Table 1. Number of CAUTIs, Catheter Days, and Facilities Reporting Program Month CAUTIs Catheter Days Facilities Reporting *
M1 364 62,845 416 M2 404 66,494 423 M3 339 68,010 430 M4 336 65,596 427 M5 317 66,090 416 M6 241 61,882 406 M7 254 60,270 401 M8 242 60,852 391 M9 221 57,538 378 M10 206 56,858 371 M11 125 37,944 249 M12 87 31,936 216
* Of the 488 facilities that completed Cohorts 1–4, 459 met the inclusion criteria for modeling analysis. Of these 459, not all may have data included in any given program month.
5.79 6.08
4.98 5.12 4.80
3.89 4.21 3.98 3.84 3.62
3.29 2.72
0.00
1.00
2.00
3.00
4.00
5.00
6.00
7.00
M1 M2 M3 M4 M5 M6 M7 M8 M9 M10 M11 M12
AHRQ Safety Program for Long-Term Care: HAIs/CAUTI Final Report 13

Figure 3. Population CAUTI Rate (CAUTIs per 10,000 Resident Days), Cohorts 1–4
Cohort 1 M1: May 2014; Cohort 2 M1: November 2014; Cohort 3 M1: June 2015; Cohort 4 M1: September 2015. Data illustrating facilities that met inclusion criteria for modeling analysis.
Source: CDS; CAUTIs and resident days submitted as of July 25, 2016.
Table 2. Number of CAUTIs, Resident Days, and Facilities Reporting Program Month CAUTIs Resident Days Facilities Reporting *
M1 364 1,212,765 416 M2 404 1,262,024 423 M3 339 1,318,917 430 M4 336 1,228,818 427 M5 317 1,256,419 416 M6 241 1,217,040 406 M7 254 1,200,763 401 M8 242 1,192,914 391 M9 221 1,137,941 378 M10 206 1,108,839 371 M11 125 696,798 249 M12 87 593,494 216
* Of the 488 facilities that completed Cohorts 1–4, 459 met the inclusion criteria for modeling analysis. Of these 459, not all may have data included in any given program month.
3.00 3.20
2.57 2.73
2.52
1.98 2.12 2.03 1.94 1.86 1.79
1.47
0.00
0.50
1.00
1.50
2.00
2.50
3.00
3.50
M1 M2 M3 M4 M5 M6 M7 M8 M9 M10 M11 M12
AHRQ Safety Program for Long-Term Care: HAIs/CAUTI Final Report 14

Figure 4. Catheter Utilization, Cohorts 1–4
Cohort 1 M1: May 2014; Cohort 2 M1: November 2014; Cohort 3 M1: June 2015; Cohort 4 M1: September 2015. Data illustrating facilities that met inclusion criteria for modeling analysis.
Source: CDS; resident days and catheter days submitted as of July 25, 2016.
Table 3. Number of Catheter Days, Resident Days, and Facilities Reporting Program Month Catheter Days Resident Days Facilities Reporting *
M1 62,845 1,212,765 416 M2 66,494 1,262,024 423 M3 68,010 1,318,917 430 M4 65,596 1,228,818 427 M5 66,090 1,256,419 416 M6 61,882 1,217,040 406 M7 60,270 1,200,763 401 M8 60,852 1,192,914 391 M9 57,538 1,137,941 378 M10 56,858 1,108,839 371 M11 37,944 696,798 249 M12 31,936 593,494 216
* Of the 488 facilities that completed Cohorts 1–4, 459 met the inclusion criteria for modeling analysis. Of these 459, not all may have data included in any given program month.
5.18% 5.27% 5.16% 5.34% 5.26% 5.08% 5.02% 5.10% 5.06% 5.13% 5.45% 5.38%
0.00%
1.00%
2.00%
3.00%
4.00%
5.00%
6.00%
7.00%
8.00%
9.00%
10.00%
M1 M2 M3 M4 M5 M6 M7 M8 M9 M10 M11 M12
AHRQ Safety Program for Long-Term Care: HAIs/CAUTI Final Report 15

Figure 5. Urine Culture Collection Rate, Cohorts 2–4
Cohort 2 M1: November 2014; Cohort 3 M1: June 2015; Cohort 4 M1: September 2015. Data illustrating Cohort 2–4 facilities that met inclusion criteria for modeling analysis. Urine culture data were not collected during Cohort 1.
Source: CDS; resident days and urine cultures submitted as of July 25, 2016.
Table 4. Number of Urine Cultures, Resident Days, and Facilities Reporting Program Month Urine Cultures Resident Days Facilities Reporting *
M1 3,957 1,071,582 388 M2 4,133 1,119,393 392 M3 4,047 1,134,063 396 M4 4,064 1,098,606 398 M5 4,065 1,142,050 396 M6 3,732 1,069,001 386 M7 3,658 1,087,262 380 M8 3,593 1,045,196 370 M9 3,424 1,026,214 361 M10 3,529 998,550 349 M11 2,113 611,404 232 M12 1,580 479,576 190
* Of the 425 facilities that completed Cohorts 2–4, 405 met the inclusion criteria for modeling analysis for urine cultures collected. Of these 405, not all may have data included in any given program month. Urine culture data were not collected during Cohort 1.
3.69 3.69 3.57 3.70 3.56 3.49 3.36 3.44 3.34 3.53 3.46 3.29
0.00
0.50
1.00
1.50
2.00
2.50
3.00
3.50
4.00
4.50
5.00
M1 M2 M3 M4 M5 M6 M7 M8 M9 M10 M11 M12
AHRQ Safety Program for Long-Term Care: HAIs/CAUTI Final Report 16
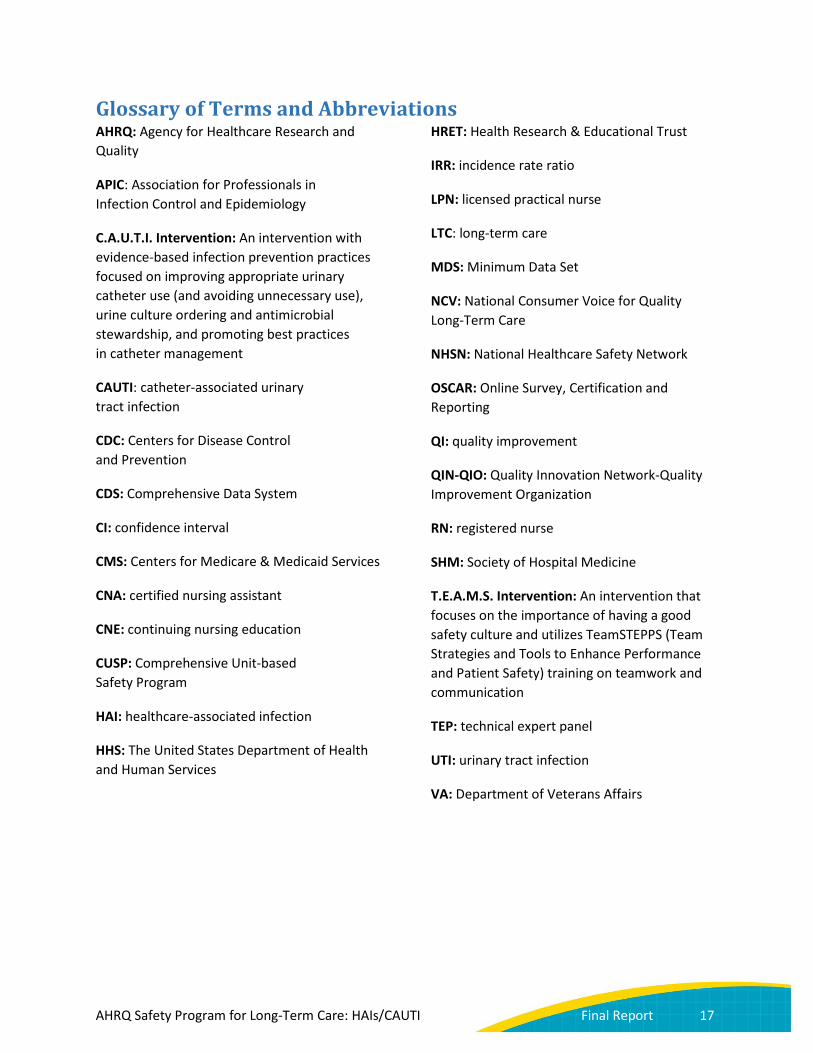
Glossary of Terms and Abbreviations AHRQ: Agency for Healthcare Research and Quality
APIC: Association for Professionals in Infection Control and Epidemiology
C.A.U.T.I. Intervention: An intervention with evidence-based infection prevention practices focused on improving appropriate urinary catheter use (and avoiding unnecessary use), urine culture ordering and antimicrobial stewardship, and promoting best practices in catheter management
CAUTI: catheter-associated urinary tract infection
CDC: Centers for Disease Control and Prevention
CDS: Comprehensive Data System
CI: confidence interval
CMS: Centers for Medicare & Medicaid Services
CNA: certified nursing assistant
CNE: continuing nursing education
CUSP: Comprehensive Unit-based Safety Program
HAI: healthcare-associated infection
HHS: The United States Department of Health and Human Services
HRET: Health Research & Educational Trust
IRR: incidence rate ratio
LPN: licensed practical nurse
LTC: long-term care
MDS: Minimum Data Set
NCV: National Consumer Voice for Quality Long-Term Care
NHSN: National Healthcare Safety Network
OSCAR: Online Survey, Certification and Reporting
QI: quality improvement
QIN-QIO: Quality Innovation Network-Quality Improvement Organization
RN: registered nurse
SHM: Society of Hospital Medicine
T.E.A.M.S. Intervention: An intervention that focuses on the importance of having a good safety culture and utilizes TeamSTEPPS (Team Strategies and Tools to Enhance Performance and Patient Safety) training on teamwork and communication
TEP: technical expert panel
UTI: urinary tract infection
VA: Department of Veterans Affairs
AHRQ Safety Program for Long-Term Care: HAIs/CAUTI Final Report 17

Background Healthcare-associated infections (HAIs) are especially significant in long-term care (LTC) settings, as they have been estimated to account for 1.6 million to 3.8 million infections and 388,000 deaths annually.18,19 Additionally, infections have very high costs to LTC facilities: $38 million to $137 million annually for antimicrobial therapy and $673 million to $2 billion for hospitalizations.20 Catheter-associated urinary tract infection (CAUTI) is a costly and potentially life-threatening HAI for LTC residents. An estimated 7 percent to 10 percent of all LTC residents have indwelling urinary catheters, including 12 percent of all new admissions at the time of transfer from acute care facilities to LTC facilities.21,22
The Agency for Healthcare Research and Quality (AHRQ) National Implementation of Comprehensive Unit-based Safety Program (CUSP) to Reduce Catheter-Associated Urinary Tract Infection in Long-Term Care Facilities, herein referred to as the AHRQ Safety Program for LTC: HAIs/CAUTI, is a national quality improvement (QI) learning collaborative designed to reduce CAUTIs and enhance resident safety culture. The AHRQ Safety Program for LTC: HAIs/CAUTI promotes the use of bundles or combinations of interventions to reduce CAUTIs and improve the safety culture in LTC facilities. It is funded by AHRQ and is part of the United States Department of Health and Human Services (HHS) National Action Plan to Prevent Healthcare-Associated Infections.
The purpose of the contract was to adapt CUSP, which was initially developed for the acute care setting,23,24 for use in LTC facilities. Additional tasks included developing State or regional consortia to recruit LTC facilities and implement this program to reduce HAIs, specifically CAUTI. This report provides results from the evaluation of the impact of this program; provides information about the QI technical assistance provided to facilities, including educational activities such as learning sessions, onboarding
18 Richards, CL. Infections in residents of long-term care facilities: an agenda for research. Report of an expert panel. J Am Geriatr Soc 2002;50:570-6. PMID: 11943058.
19 Montoya A, Cassone M, Mody L. Infections in nursing homes: epidemiology and prevention programs. Clin Geriatr Med. 2016;32(3):585-607.
20 Cohen CC, Choi YJ, Stone PW. Costs of infection prevention practices in long-term care settings: a systematic review. Nurs Econ 2016 Jan-Feb;34(1):16-24.
21 Smith PW, Bennett G, Bradley SF, et al. SHEA/APIC Guideline: Infection prevention and control in the long-term care facility. Infect Control Hosp Epidemiol 2008;29:785-814. PMID: 18786461.
22 Mody L, Bradley SF, Galecki A, et al. Conceptual model for reducing infections and antimicrobial resistance in skilled nursing facilities: focus on residents with indwelling devices. Clin Infect Dis 2011;52:654-61. PMID: 21292670.
23 Fakih MG, Krein SL, Edson B, et al. Engaging health care workers to prevent catheter-associated urinary tract infection and avert patient harm. Am J Infect Control 2014 Oct;42(10 Suppl):S223-9.
24 Saint S, Greene MT, Krein SL, et al. A program to prevent catheter-associated urinary tract infection in acute care. New Engl J Med 2016;374:2111-2119.
AHRQ Safety Program for Long-Term Care: HAIs/CAUTI Final Report 18
Webinars, training modules, and coaching calls; and outlines program enhancements and lessons learned during the contract period as well as recommendations for future QI initiatives in this health care setting.
The AHRQ Safety Program for LTC: HAIs/CAUTI was coordinated at the national level by the Health Research & Educational Trust, the research affiliate of the American Hospital Association. The overall program goals were:
1. Develop and implement an intervention adapting CUSP to the LTC setting and considering a variety of additional sources such as information from evidence review and multidisciplinary experts (including those who conducted a recent randomized controlled trial 25).
2. Reduce CAUTI rates—by implementing the C.A.U.T.I. intervention, informed by a systematic review of the available evidence 26 for interventions to prevent CAUTI in the LTC setting: • Catheters in newly admitted (and readmitted) residents should be removed to assess if still
needed; every resident deserves a chance to be “catheter free.” • Aseptic insertion of indwelling catheters is essential, with hand hygiene before and after
every resident contact and barrier precautions 27 during intimate (e.g., toileting, bathing) assistance with activities of daily living.
• Use catheters only if indicated; routine assessments of catheter need (daily for short-term residents, monthly for long-term residents) should be conducted, and alternatives should be considered (such as intermittent catheterization, use of bladder scanner protocols to decrease need for catheterization, and other noncatheter solutions to incontinence).
• Training and mentorship of staff and family regarding catheter care are important, emphasizing the following points: keep the drainage bag below the bladder, no violations of “closed” drainage system, and learn the appropriate use of leg bags.
• Incontinence care planning to address individual resident challenges and solutions is important, including behavioral interventions such as timed and prompted voiding and appropriate medical management.
3. Improve safety culture—as evidenced through improved teamwork and communication by implementing the T.E.A.M.S. intervention. • Team Formation—Form a diverse team that will plan, champion, and implement
the program.
25 Mody L, Krein SL, Saint S, et al. A targeted infection prevention intervention in nursing home residents with indwelling devices: a randomized clinical trial. JAMA Intern Med 2015;175(5):714-723. PMID: 25775048.
26 Meddings J, Saint S, Krein S, et al. Systematic review of interventions to reduce catheter-associated urinary tract infection in the long-term care setting. Open Forum Infect Dis 2014;1(Suppl 1):S252-3.
27 Roghmann MC, Johnson JK, Sorkin JD, et al. Transmission of methicillin-resistant Staphylococcus aureus (MRSA) to healthcare worker gowns and gloves during care of nursing home residents. Infect Control Hosp Epidemiol 2015 Sep;36(9):1050-7.
AHRQ Safety Program for Long-Term Care: HAIs/CAUTI Final Report 19

• Excellent Communication—Encourage and educate the team on communication strategies. • Assess What’s Working—Evaluate current culture, data, and practices; learn and implement;
and continually reevaluate. • Meet Monthly—Meet with the team regularly to discuss successes and barriers and to
review data trends. • Sustain Efforts—Plan for program sustainability early and integrate program elements into
daily workflow.
Secondary goals for this program were to support expanded infection prevention efforts for Clostridium difficile, non-catheter-associated urinary tract infection, and multidrug-resistant organisms by providing education to:
• Improve hygiene practices (e.g., hand hygiene,28 environmental cleaning, and disinfection) • Promote antibiotic stewardship 29,30,31 • Promote catheter stewardship
Program Implementation The AHRQ Safety Program for LTC: HAIs/CAUTI was led by Health Research & Educational Trust (HRET) program staff in collaboration with national faculty and collaborators from a network of seven partner organizations, known as the national project team, as well as a technical expert panel (TEP) of leaders in infection prevention, patient safety, and long-term care (LTC). In addition, implementation of the program at LTC facilities across the country was supported by organizational leads from a variety of State-level and national stakeholders in LTC, including but not limited to State hospital associations, State or regional organizations with expertise in quality improvement (QI), LTC management companies, and professional societies.
Key People and Partnerships Program Stakeholders The collaboration of operational stakeholders throughout this program was maintained with optimal care of residents being paramount. In addition to residents and families, operational stakeholders
28 Mody L, McNeil SA, Sun R, et al. Introduction of a waterless alcohol-based hand rub in a long-term care facility. Infect Control Hosp Epidemiol 2003;24:165-171.
29 Crnich CJ, Jump R, Trautner B, et al. Optimizing antibiotic stewardship in nursing homes: a narrative review and recommendations for improvement. Drugs Aging 2015 Sep;32(9):699-716.
30 Daneman N, Bronskill SE, Gruneir A, et al. Variability in antibiotic use across nursing homes and the risk of antibiotic-related adverse outcomes for individual residents. JAMA Intern Med 2015 Aug;175(8):1331-9.
31 Mody L, Crnich C. Effects of excessive antibiotic use in nursing homes. JAMA Intern Med 2015 Aug;175(8):1339-41.
AHRQ Safety Program for Long-Term Care: HAIs/CAUTI Final Report 20
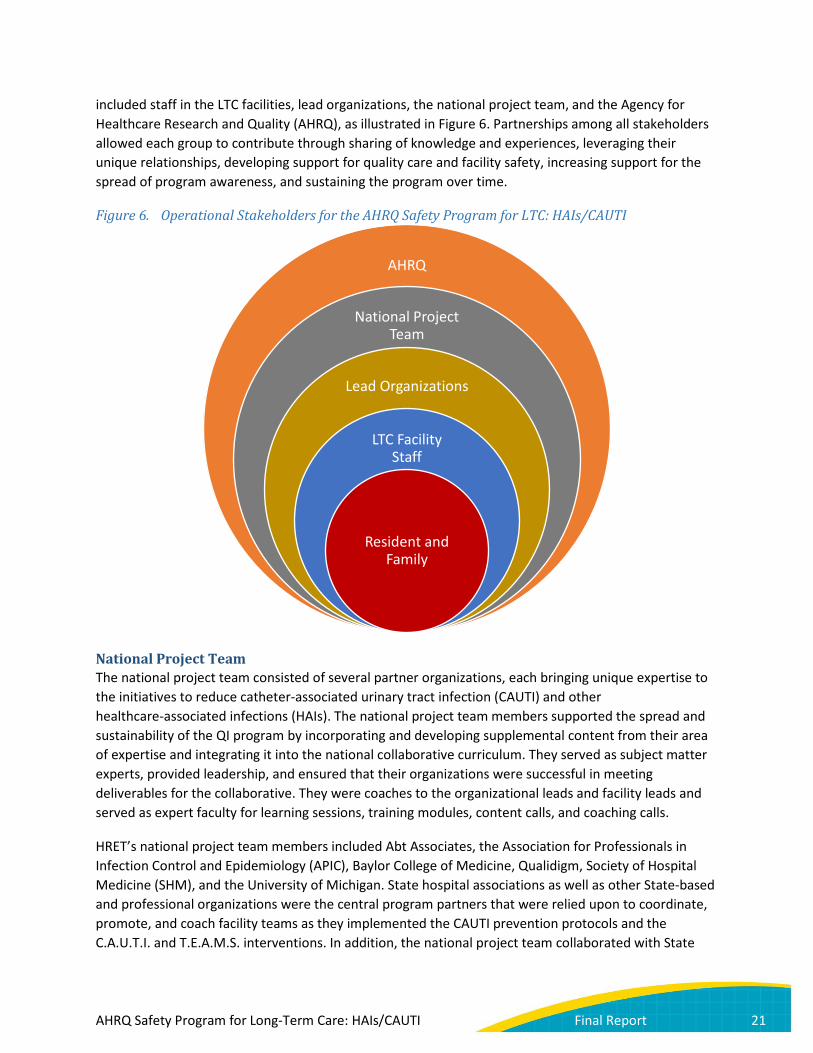
included staff in the LTC facilities, lead organizations, the national project team, and the Agency for Healthcare Research and Quality (AHRQ), as illustrated in Figure 6. Partnerships among all stakeholders allowed each group to contribute through sharing of knowledge and experiences, leveraging their unique relationships, developing support for quality care and facility safety, increasing support for the spread of program awareness, and sustaining the program over time.
Figure 6. Operational Stakeholders for the AHRQ Safety Program for LTC: HAIs/CAUTI
National Project Team The national project team consisted of several partner organizations, each bringing unique expertise to the initiatives to reduce catheter-associated urinary tract infection (CAUTI) and other healthcare-associated infections (HAIs). The national project team members supported the spread and sustainability of the QI program by incorporating and developing supplemental content from their area of expertise and integrating it into the national collaborative curriculum. They served as subject matter experts, provided leadership, and ensured that their organizations were successful in meeting deliverables for the collaborative. They were coaches to the organizational leads and facility leads and served as expert faculty for learning sessions, training modules, content calls, and coaching calls.
HRET’s national project team members included Abt Associates, the Association for Professionals in Infection Control and Epidemiology (APIC), Baylor College of Medicine, Qualidigm, Society of Hospital Medicine (SHM), and the University of Michigan. State hospital associations as well as other State-based and professional organizations were the central program partners that were relied upon to coordinate, promote, and coach facility teams as they implemented the CAUTI prevention protocols and the C.A.U.T.I. and T.E.A.M.S. interventions. In addition, the national project team collaborated with State
AHRQ
National Project Team
Lead Organizations
LTC Facility Staff
Resident and Family
AHRQ Safety Program for Long-Term Care: HAIs/CAUTI Final Report 21
and regional organizations with expertise in QI that have other business as Centers for Medicare & Medicaid Services (CMS)-contracted Quality Innovation Network-Quality Improvement Organizations (QIN-QIOs) as well as other government entities, including the Centers for Disease Control and Prevention (CDC), CMS, and the Department of Veterans Affairs (VA), to develop, review, and disseminate key educational content to LTC facilities.
HRET Staff To manage the range of activities and multiple deliverables associated with this large and complex program, HRET built an internal operations team and developed standardized processes to implement the program and monitor and report progress. HRET designed its program management structure based on six functional areas: (1) content development and dissemination, (2) communications, (3) data management, analysis, and reporting, (4) recruitment and relationship management, (5) operations, and (6) contracts and financial management. HRET staff also gathered information on any opportunities to improve the program based on feedback from the organizational leads and LTC facilities and provided reports to the national project team to determine how best to address these suggestions and concerns. Examples of program improvements include the content redesign (described below), development of data interpretation guides, and additional educational Webinars to help LTC facilities develop action plans based on results from the AHRQ Nursing Home Survey on Patient Safety Culture.
Organizational Leads Organizational leads were crucial to the facility teams’ success in this initiative. The organizational lead was an individual designated by a State or regional lead organization (e.g., State nursing home associations, corporations, or State provider associations) who acted as an intermediary between the national project team and nursing homes. These organizational leads, with the exception of the VA, were brought on as subcontractors with a defined scope of work and payment schedule. This arrangement created accountability for each State to ensure that all deliverables were completed throughout the course of the program. The role of the organizational lead was to recruit and register LTC facilities into the program and provide ongoing program direction, education, and coaching throughout the duration of the program. Organizational leads were also responsible for the promotion and communication of all educational activities, program updates, and available resources. Finally, organizational leads were crucial in supporting the surveillance efforts in the LTC facilities. During monthly coaching calls, they helped LTC facilities review and interpret their data and develop plans to ensure LTC facilities continued to show improvements in their CAUTI reduction efforts. Organizational leads served an important role in program execution, but also an even more important role in program sustainability, as they are there to support LTC facilities at the completion of the program. The tools developed by the national project team as well as the experience in coaching LTC facilities in collecting, reviewing, and using data to drive improvement efforts equipped the organizational leads to continue this work with LTC facilities in their State or region after the conclusion of the program.
Faculty Coaches Expert faculty were assigned to each organizational lead to assist in training the staff of participating LTC facilities on how to implement and effectively use HAI prevention practices and safety culture tools. Faculty also assisted facilities in correctly identifying CAUTIs using the National Healthcare Safety Network (NHSN) definition for LTC and in interpreting their data. As with the organizational leads, faculty coaches were vital in improving surveillance efforts in LTC facilities. Faculty coaches participated
AHRQ Safety Program for Long-Term Care: HAIs/CAUTI Final Report 22

in recurring coaching calls to facilitate the teams’ access to program resources, explore challenges, and identify opportunities to improve the use of clinical and cultural interventions.
Long-Term Care Facilities Each LTC facility team was led by a facility team lead and consisted of a set of core team members plus others who participated on an as-needed basis. The core team included an administrative champion, a survey coordinator, and a data coordinator. In addition to the required roles, it was suggested that each team include six to eight members, including a nurse champion, physician champion, infection preventionist, and key members of the clinical staff (e.g., registered nurses (RNs), licensed practical nurses (LPNs), and certified nursing assistants (CNAs)). LTC facilities participating in the program were expected to form an active, multidisciplinary program team and conduct training sessions for all staff members, including nurses, nurse aides, housekeeping, dietary, et cetera, on the C.A.U.T.I. and T.E.A.M.S. interventions. Teams were expected to communicate with residents and families about the program; participate in team coaching sessions via teleconference or Webinar on a monthly basis; collect and submit facility demographic data, knowledge assessments,32 safety culture surveys, and monthly outcome data; and attend all educational events.
Residents and Families Involving residents and their families in care decisions and program implementation is key to achieving a culture of safety and respect. To ensure resident and family engagement, the national project team created and disseminated educational materials pertaining to residents’ and families’ roles in CAUTI prevention, antibiotic stewardship, and other topics.
Technical Expert Panel The program’s TEP consisted of stakeholder representatives and nationally recognized and well-respected experts in the areas of patient safety, QI, HAIs, teamwork, and change implementation. The role of the TEP was to provide expert input to the national project team, at annual virtual meetings throughout the program, on strategies to facilitate adoption and implementation of interventions to reduce HAIs and CAUTI.
Other Relationships The national project team collaborated with the National Consumer Voice for Quality Long-Term Care (NCV) to get input from State and local ombudsmen on program resources, to disseminate information through State NCV networks, and to integrate perspectives and insights of residents and families in LTC facilities into program materials. The national project team shared the education and resources
32 Trautner B, Greene T, Rolle AJ, et al. Infection prevention and antimicrobial stewardship knowledge for selected infections among nursing home personnel. Infect Control Hosp Epidemiol 2016 Sept [in press].
AHRQ Safety Program for Long-Term Care: HAIs/CAUTI Final Report 23
available in the program with State, local, and volunteer ombudsmen, who then shared the education gained through this program with residents and their family members. The NCV recruited eight State ombudsmen who reviewed the onboarding, training, and other educational materials developed for the program and then developed and delivered training programs for local and volunteer ombudsmen in their States. Local and volunteer ombudsmen who participated in the training program were encouraged to share the information as appropriate with residents, family members, and staff during the ombudsmen’s site visits to LTC facilities.
Project Components Recruitment Strategy The recruitment goal of this national program was to spread throughout all 50 States, the District of Columbia, and Puerto Rico. Participation in the program is divided into recruitment of five cohorts, or groupings of LTC facilities, dispersed throughout the 3 years of the contract. Thirty lead organizations recruited facilities within their States or regions for this program. Lead organizations from Cohorts 1 and 2 were a mix of hospital associations and State organizations with expertise in QI (e.g., Professional Nursing Solutions, Qualidigm, Spectrum Health, South Carolina Hospital Association) with 284 facilities recruited during the first year of the program (2014). During Year 2 of the program, HRET identified 15 lead organizations, including the VA, Genesis HealthCare, the Joint Commission, and other national nursing home systems, to participate in Cohorts 3 and 4. A full list of Cohort 1–4 lead organizations is included in Appendix J. For the fifth and final cohort, organizational leads from previous cohorts recruited facilities that were unable to participate in the previous cohorts. However, HRET staff took over the role of the organizational lead for Cohort 5 after facilities registered for the program.
Educational Events and Resources After joining the program, facility teams participated in a series of educational onboarding events to familiarize themselves with the program, timelines, roles and responsibilities, data collection, and the program’s cultural and clinical interventions. This was followed by a series of training modules highlighting general infection prevention practices (e.g., hand and environmental hygiene
AHRQ Safety Program for Long-Term Care: HAIs/CAUTI Final Report 24
practices,33,34,35 standard precautions,36,37 and antibiotic stewardship 38), that can be applied not only to CAUTI prevention but to any other HAI, such as Clostridium difficile or other multidrug-resistant organisms. This training addresses our secondary goals for this program.
The program interventions were discussed in detail during three learning sessions and monthly content Webinars. They were then reinforced on the teams’ monthly coaching calls or Webinars with their organizational leads and assigned coach who had expertise in infection prevention or QI in LTC. Table 5 describes the different types of program Webinars, calls, and meetings through which facility teams were educated on the interventions.
33 Schweon SJ, Kirk J. A realistic approach towards hand hygiene for long-term care residents and health care personnel. Am J Infect Control 2011;39(4):336-338.
34 Centers for Disease Control and Prevention, Healthcare Infection Control Practices Advisory Committee (HICPAC). Guideline for Disinfection and Sterilization in Healthcare Facilities, 2008. Available at: https://www.cdc.gov/hicpac/pdf/guidelines/Disinfection_Nov_2008.pdf. Accessed August 15, 2016.
35 Han JH, Sullivan N, Leas BF, et al. Cleaning hospital room surfaces to prevent healthcare-associated infections: a technical brief. Ann Intern Med 2015 Oct 20;163(8):598-607.
36 Stone ND. Revisiting standard precautions to reduce antimicrobial resistance in nursing homes. JAMA Intern Med 2015 May;175(5):723-4.
37 Siegel JD, Rhinehart E, Jackson M, et al.; Healthcare Infection Control Practices Advisory Committee. 2007 Guideline for Isolation Precautions: Preventing Transmission of Infectious Agents in Health Care Settings. Available at: http://www.cdc.gov/hicpac/2007IP/2007isolationPrecautions.html. Accessed August 15, 2016.
38 Centers for Disease Control and Prevention. The Core Elements of Antibiotic Stewardship for Nursing Homes. Atlanta, GA: US Department of Health and Human Services, CDC; 2015. Available at: http://www.cdc.gov/longtermcare/index.html. Accessed August 15, 2016.
AHRQ Safety Program for Long-Term Care: HAIs/CAUTI Final Report 25

Table 5. Webinars, Modules, Conference Calls, and Meetings Category Description
Informational This introductory Webinar familiarized the organizational leads and facility teams with a general overview of the program, encouraged enrollment, and provided registration details. (Audience: organizational leads and facility teams of new cohorts)
Onboarding This series of Webinars at the beginning of each cohort launch reviewed the program collaborative model, the technical and socioadaptive interventions, and data and measurement. Topics are listed in Table 29. (Audience: organizational leads and facility teams of new cohorts)
Training Modules This four-part series of educational bundles was intended to strengthen knowledge and infection prevention skills related to CAUTI reduction and to the program’s secondary goals of reducing other HAIs, such as Clostridium difficile. These modules were delivered via live Webinars for Cohorts 1 and 2. For Cohorts 3, 4, and 5, each bundle followed a train-the-trainer format and included a video for core team members outlining how facility team leaders should teach and engage frontline staff with the content; a video for all staff to watch; activities such as skills practice, quizzes, or discussion guides; and an evaluation and certificate of completion. Topics are listed in Table 30. (Audience: organizational leads and facility teams of new cohorts)
Content On this series of monthly Webinars, the national project team, faculty, coaches, and resident advocates presented on technical, socioadaptive, and coaching topics to teach on the program interventions. Topics are listed in Table 32. (Audience: organizational leads and facility teams of existing cohorts)
Coaching These organization-level calls or Webinars occurred monthly and were designed to be an open forum among the organizational lead, facility teams, and assigned coach. These meetings provided participating facilities an opportunity to share their experiences and concerns with each other, enhancing their success in program implementation. Most calls reviewed teams’ program data, discussed implementation strategies, and reflected on recent content Webinars. (Audience: organizational leads, facility teams, and assigned coaches of new and existing cohorts)
Learning Session #1 (Kick-Off)
Learning Session #1 was the first in-person (or virtual) meeting for the facility teams, led by organizational leads. The purpose of this meeting was to serve as an official program launch and introduce teams to each other, their organizational lead, and their assigned coach for the program. This meeting reviewed information about CAUTI and HAI prevention, data collection, QI, and action planning.
AHRQ Safety Program for Long-Term Care: HAIs/CAUTI Final Report 26
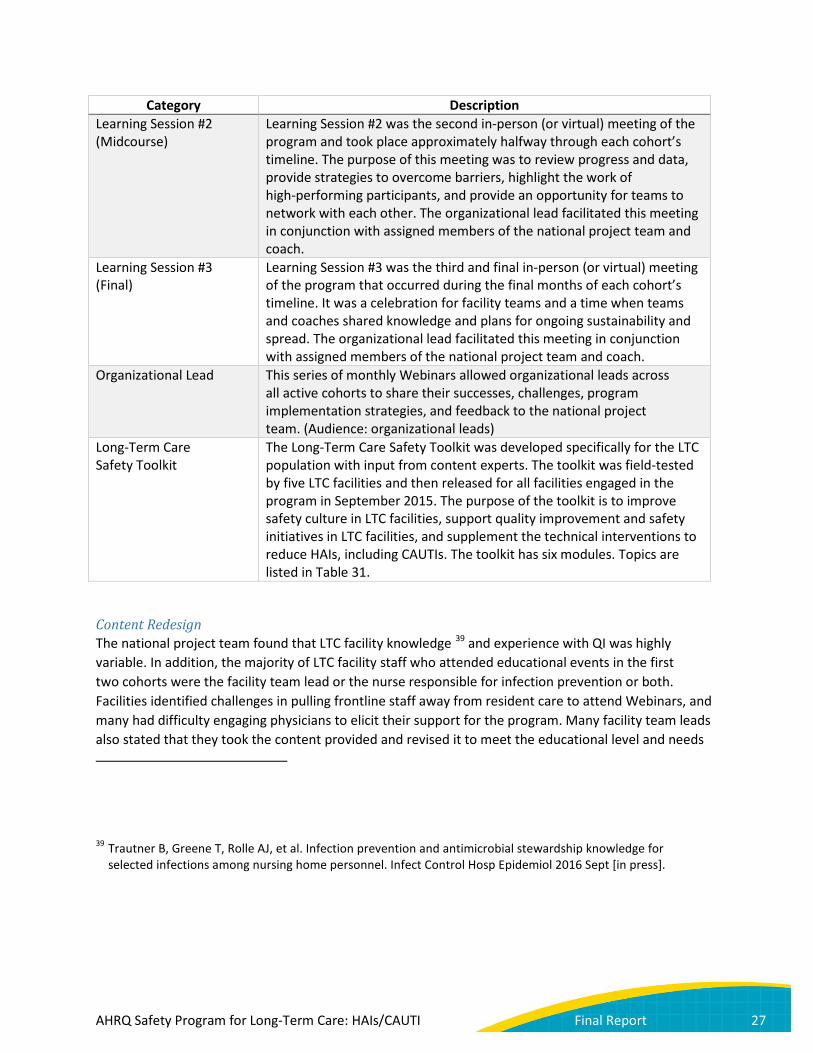
Category Description Learning Session #2 (Midcourse)
Learning Session #2 was the second in-person (or virtual) meeting of the program and took place approximately halfway through each cohort’s timeline. The purpose of this meeting was to review progress and data, provide strategies to overcome barriers, highlight the work of high-performing participants, and provide an opportunity for teams to network with each other. The organizational lead facilitated this meeting in conjunction with assigned members of the national project team and coach.
Learning Session #3 (Final)
Learning Session #3 was the third and final in-person (or virtual) meeting of the program that occurred during the final months of each cohort’s timeline. It was a celebration for facility teams and a time when teams and coaches shared knowledge and plans for ongoing sustainability and spread. The organizational lead facilitated this meeting in conjunction with assigned members of the national project team and coach.
Organizational Lead This series of monthly Webinars allowed organizational leads across all active cohorts to share their successes, challenges, program implementation strategies, and feedback to the national project team. (Audience: organizational leads)
Long-Term Care Safety Toolkit
The Long-Term Care Safety Toolkit was developed specifically for the LTC population with input from content experts. The toolkit was field-tested by five LTC facilities and then released for all facilities engaged in the program in September 2015. The purpose of the toolkit is to improve safety culture in LTC facilities, support quality improvement and safety initiatives in LTC facilities, and supplement the technical interventions to reduce HAIs, including CAUTIs. The toolkit has six modules. Topics are listed in Table 31.
Content Redesign The national project team found that LTC facility knowledge 39 and experience with QI was highly variable. In addition, the majority of LTC facility staff who attended educational events in the first two cohorts were the facility team lead or the nurse responsible for infection prevention or both. Facilities identified challenges in pulling frontline staff away from resident care to attend Webinars, and many had difficulty engaging physicians to elicit their support for the program. Many facility team leads also stated that they took the content provided and revised it to meet the educational level and needs
39 Trautner B, Greene T, Rolle AJ, et al. Infection prevention and antimicrobial stewardship knowledge for selected infections among nursing home personnel. Infect Control Hosp Epidemiol 2016 Sept [in press].
AHRQ Safety Program for Long-Term Care: HAIs/CAUTI Final Report 27
of their frontline staff. Therefore, prior to the start of Cohort 3 in April 2015, the national project team identified a need to redesign the educational content and delivery to ensure consistency across learning objectives by topic for the facility team leads and frontline staff. Additionally, the national project team began offering continuing nursing education (CNE) credits for Webinars.
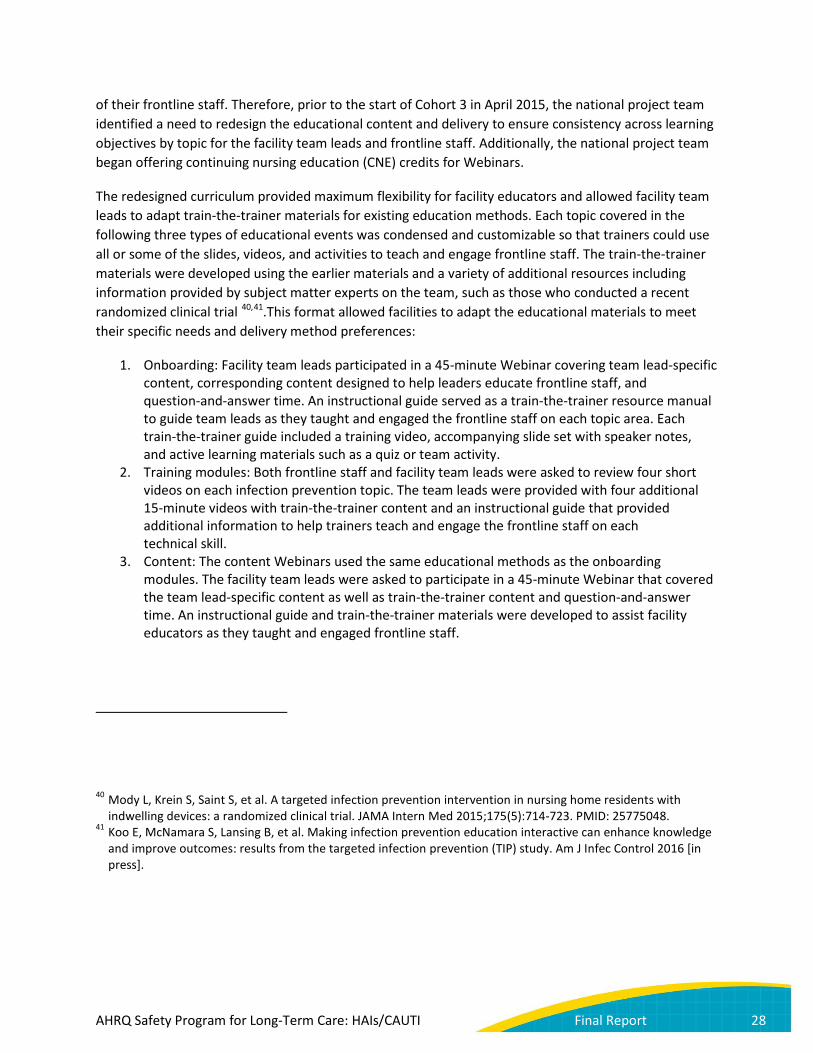
The redesigned curriculum provided maximum flexibility for facility educators and allowed facility team leads to adapt train-the-trainer materials for existing education methods. Each topic covered in the following three types of educational events was condensed and customizable so that trainers could use all or some of the slides, videos, and activities to teach and engage frontline staff. The train-the-trainer materials were developed using the earlier materials and a variety of additional resources including information provided by subject matter experts on the team, such as those who conducted a recent randomized clinical trial 40,41.This format allowed facilities to adapt the educational materials to meet their specific needs and delivery method preferences:
1. Onboarding: Facility team leads participated in a 45-minute Webinar covering team lead-specific content, corresponding content designed to help leaders educate frontline staff, and question-and-answer time. An instructional guide served as a train-the-trainer resource manual to guide team leads as they taught and engaged the frontline staff on each topic area. Each train-the-trainer guide included a training video, accompanying slide set with speaker notes, and active learning materials such as a quiz or team activity.
2. Training modules: Both frontline staff and facility team leads were asked to review four short videos on each infection prevention topic. The team leads were provided with four additional 15-minute videos with train-the-trainer content and an instructional guide that provided additional information to help trainers teach and engage the frontline staff on each technical skill.
3. Content: The content Webinars used the same educational methods as the onboarding modules. The facility team leads were asked to participate in a 45-minute Webinar that covered the team lead-specific content as well as train-the-trainer content and question-and-answer time. An instructional guide and train-the-trainer materials were developed to assist facility educators as they taught and engaged frontline staff.
40 Mody L, Krein S, Saint S, et al. A targeted infection prevention intervention in nursing home residents with indwelling devices: a randomized clinical trial. JAMA Intern Med 2015;175(5):714-723. PMID: 25775048.
41 Koo E, McNamara S, Lansing B, et al. Making infection prevention education interactive can enhance knowledge and improve outcomes: results from the targeted infection prevention (TIP) study. Am J Infec Control 2016 [in press].
AHRQ Safety Program for Long-Term Care: HAIs/CAUTI Final Report 28

Continuing Education Offered As part of the content and delivery redesign process, CNE was offered for a majority of the Webinars targeted toward the facility team leads that were most often nurses, beginning in May 2015. This process ensured consistency across learning objectives and final training materials.
Supplemental Material, Manuals, and National Project Web Site In addition to the onboarding, training modules, content Webinars, and supplemental tools and all-staff training materials, the national project team developed other tools and resources to assist organizational leads and facility teams in program implementation:
• Organizational Leads o Organizational lead manual—Provided to organizational leads at their initial in-person
training, this manual summarized the role of organizational leads and discussed all the activities they needed to perform during each phase of the program’s lifecycle: planning, execution, and sustainability.
o Coaching call materials—These tools included a Webinar introducing coaching methods, expectations of each role on the coaching call, and guidance on how to set agendas and what topics to discuss.
o Dashboards—Each organizational lead received regularly updated dashboards of their facilities’ data submission, outcomes, and process measures.
o Monitoring tools—Organizational leads had access to trackers and communication logs to assess their facility teams’ participation and progress in the program. This included guidance on what to do if a facility had low engagement.
• Facilities o Facility implementation guide—Provided to facility teams at their Learning Session #1,
this guide served as a reference for facility team leads on how to coordinate and implement the program.
o Physician resources—These tools assisted teams in engaging physicians and prescribing clinicians in supporting the program by outlining the evidence-based practices and clinical guidelines essential to reducing HAIs.
o Posters and brochures—The national project team developed various posters and brochures to reinforce the program’s technical and socioadaptive interventions among facility team members, educate residents and families on appropriate use of antibiotics, and encourage resident and family engagement in the program’s goals.
o Tools—These tools included pocket cards for facility team members to evaluate residents with signs or symptoms of CAUTI before prescribing antibiotic treatment, surveillance assessments with the LTC NHSN criteria, indwelling urinary catheter insertion and maintenance checklists, CAUTI case review forms to identify possible resident care issues that might have contributed to the infection, the Team Communication Guide to help teams assess progress toward implementing program interventions, and an antibiotic stewardship educational video.
o FAQs—The national project team developed multiple documents to respond to frequently asked questions around clinical and cultural interventions. In most cases, a multidisciplinary team reviewed relevant literature to identify evidence-based practices and then wrote up their findings in a brief, user-friendly format. When questions raised
AHRQ Safety Program for Long-Term Care: HAIs/CAUTI Final Report 29
by facility teams could not be answered through a literature review, content experts from the national project team shared their seasoned experience.
All educational materials were available to participants on the program’s password-protected Web site. The Web site served as a central location for a wide range of program information and resources. It included a calendar of educational events, archived Webinars, links to data collection systems, newsletters, and frequently asked questions.
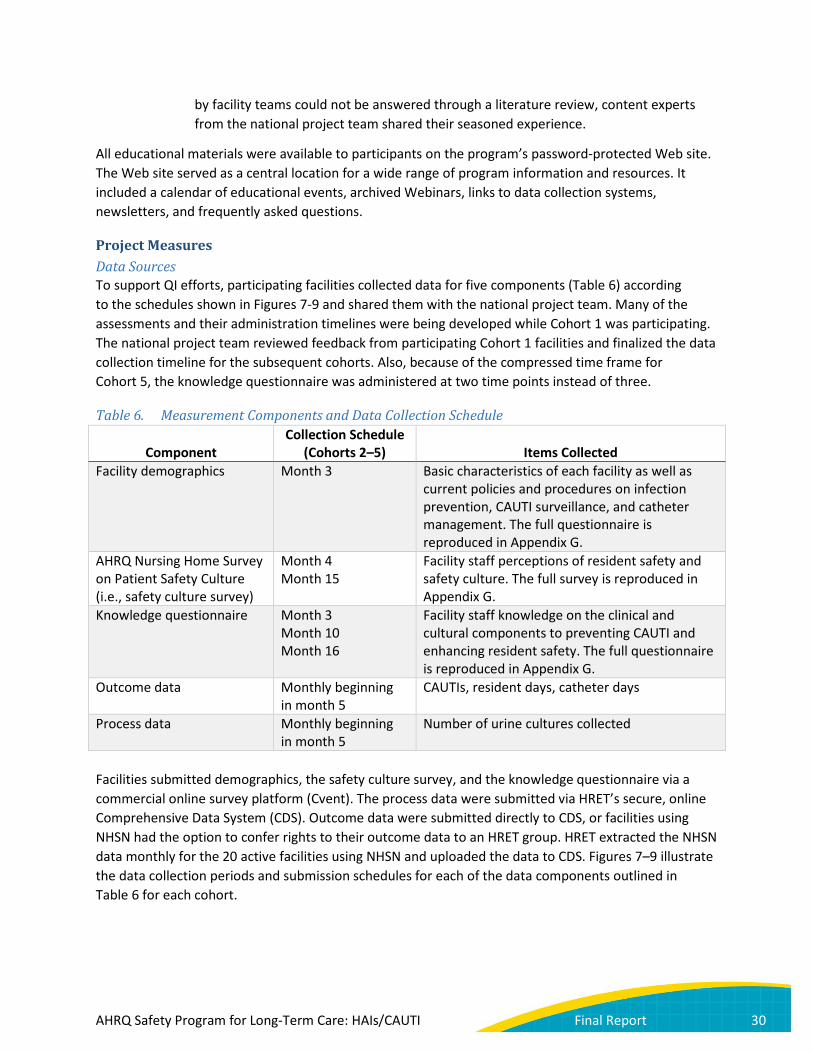
Project Measures Data Sources To support QI efforts, participating facilities collected data for five components (Table 6) according to the schedules shown in Figures 7-9 and shared them with the national project team. Many of the assessments and their administration timelines were being developed while Cohort 1 was participating. The national project team reviewed feedback from participating Cohort 1 facilities and finalized the data collection timeline for the subsequent cohorts. Also, because of the compressed time frame for Cohort 5, the knowledge questionnaire was administered at two time points instead of three.
Table 6. Measurement Components and Data Collection Schedule
Component Collection Schedule
(Cohorts 2–5) Items Collected Facility demographics Month 3 Basic characteristics of each facility as well as
current policies and procedures on infection prevention, CAUTI surveillance, and catheter management. The full questionnaire is reproduced in Appendix G.
AHRQ Nursing Home Survey on Patient Safety Culture (i.e., safety culture survey)
Month 4 Month 15
Facility staff perceptions of resident safety and safety culture. The full survey is reproduced in Appendix G.
Knowledge questionnaire Month 3 Month 10 Month 16
Facility staff knowledge on the clinical and cultural components to preventing CAUTI and enhancing resident safety. The full questionnaire is reproduced in Appendix G.
Outcome data Monthly beginning in month 5
CAUTIs, resident days, catheter days
Process data Monthly beginning in month 5
Number of urine cultures collected
Facilities submitted demographics, the safety culture survey, and the knowledge questionnaire via a commercial online survey platform (Cvent). The process data were submitted via HRET’s secure, online Comprehensive Data System (CDS). Outcome data were submitted directly to CDS, or facilities using NHSN had the option to confer rights to their outcome data to an HRET group. HRET extracted the NHSN data monthly for the 20 active facilities using NHSN and uploaded the data to CDS. Figures 7–9 illustrate the data collection periods and submission schedules for each of the data components outlined in Table 6 for each cohort.
AHRQ Safety Program for Long-Term Care: HAIs/CAUTI Final Report 30
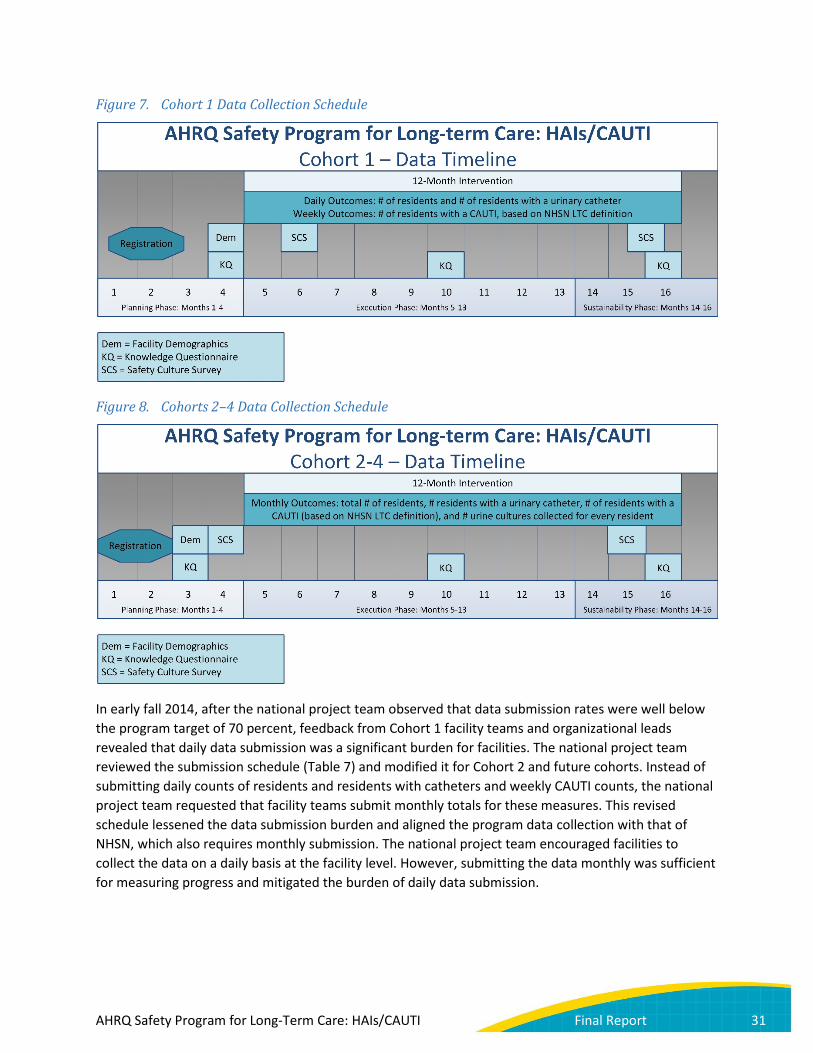
Figure 7. Cohort 1 Data Collection Schedule
Figure 8. Cohorts 2–4 Data Collection Schedule
In early fall 2014, after the national project team observed that data submission rates were well below the program target of 70 percent, feedback from Cohort 1 facility teams and organizational leads revealed that daily data submission was a significant burden for facilities. The national project team reviewed the submission schedule (Table 7) and modified it for Cohort 2 and future cohorts. Instead of submitting daily counts of residents and residents with catheters and weekly CAUTI counts, the national project team requested that facility teams submit monthly totals for these measures. This revised schedule lessened the data submission burden and aligned the program data collection with that of NHSN, which also requires monthly submission. The national project team encouraged facilities to collect the data on a daily basis at the facility level. However, submitting the data monthly was sufficient for measuring progress and mitigated the burden of daily data submission.
AHRQ Safety Program for Long-Term Care: HAIs/CAUTI Final Report 31

Figure 9. Cohort 5 Data Collection Schedule
Table 7. Cohort 1 and Cohorts 2–5 Initial Data Collection and Submission Outcome Measures Cohort 1 Cohorts 2–5
Resident days Submit daily counts each month Submit monthly totals each month Catheter days Submit daily counts each month Submit monthly totals each month CAUTI events as defined by LTC NHSN criteria
Submit event counts each week Submit monthly totals each month
Modifications in the data collection and submission process were made for the 63 VA facilities enrolled as part of the VA-led group in Cohort 3. (Of these 63 enrolled facilities, 55 completed the program.) VA facilities submitted their outcome data monthly directly to the VA organizational lead via a SharePoint site accessible only to those participating in this initiative. The organizational lead then sent a de-identified dataset to HRET to upload to CDS for use in evaluating CAUTI rates and catheter utilization.
Also in early fall 2014, after observing low catheter utilization and CAUTI rates for Cohort 1, the national project team added an additional process measure to assess success in the initiative. Beginning with Cohort 2, facility teams were asked to track and report the number of urine cultures that were collected from catheterized and noncatheterized residents in their facility each month. Since urine culture counts should be readily available from facility contract laboratories, the addition of this measure was not expected to pose an additional data collection burden. The national project team communicated and provided education around the potential impact that culturing stewardship can have on CAUTI rates and the usefulness of monitoring and tracking the rate of urine culturing as a process measure in CAUTI reduction efforts.
AHRQ Safety Program for Long-Term Care: HAIs/CAUTI Final Report 32
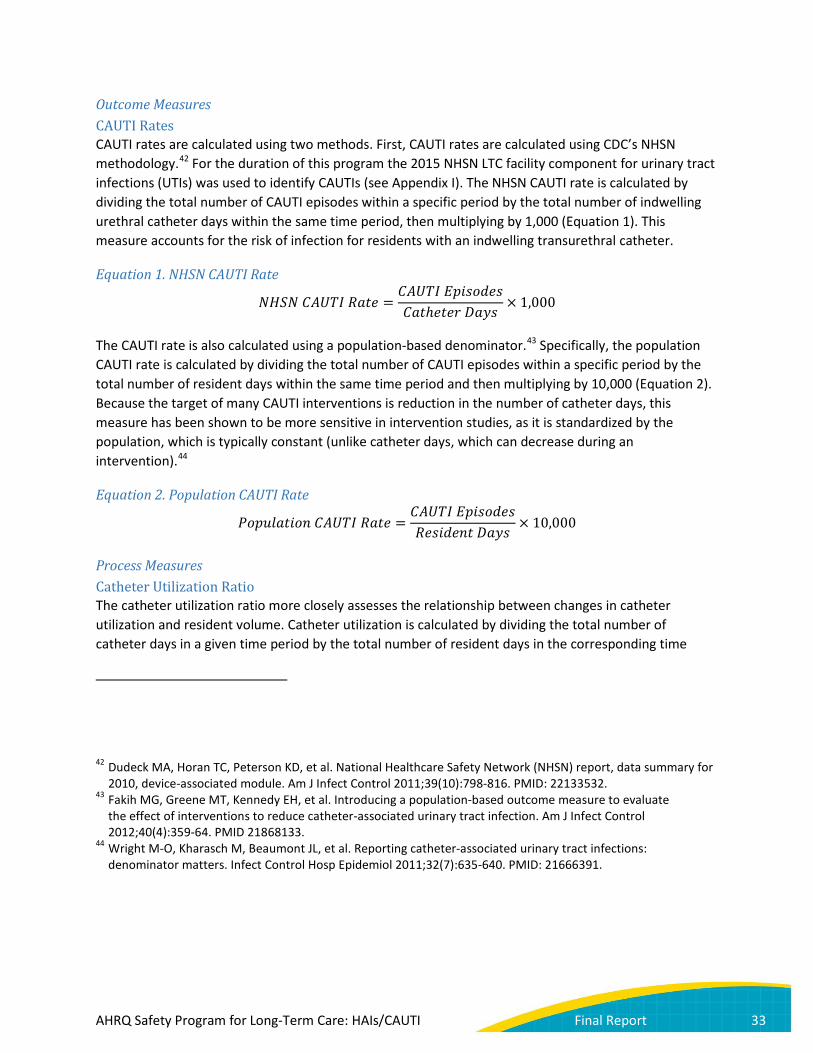
Outcome Measures CAUTI Rates CAUTI rates are calculated using two methods. First, CAUTI rates are calculated using CDC’s NHSN methodology.42 For the duration of this program the 2015 NHSN LTC facility component for urinary tract infections (UTIs) was used to identify CAUTIs (see Appendix I). The NHSN CAUTI rate is calculated by dividing the total number of CAUTI episodes within a specific period by the total number of indwelling urethral catheter days within the same time period, then multiplying by 1,000 (Equation 1). This measure accounts for the risk of infection for residents with an indwelling transurethral catheter.
Equation 1. NHSN CAUTI Rate
𝑁𝑁𝑁𝑁𝑁𝑁𝑁𝑁 𝐶𝐶𝐶𝐶𝐶𝐶𝐶𝐶𝐶𝐶 𝑅𝑅𝑅𝑅𝑅𝑅𝑅𝑅 =𝐶𝐶𝐶𝐶𝐶𝐶𝐶𝐶𝐶𝐶 𝐸𝐸𝐸𝐸𝐸𝐸𝐸𝐸𝐸𝐸𝐸𝐸𝑅𝑅𝐸𝐸𝐶𝐶𝑅𝑅𝑅𝑅ℎ𝑅𝑅𝑅𝑅𝑅𝑅𝑒𝑒 𝐷𝐷𝑅𝑅𝐷𝐷𝐸𝐸
× 1,000
The CAUTI rate is also calculated using a population-based denominator.43 Specifically, the population CAUTI rate is calculated by dividing the total number of CAUTI episodes within a specific period by the total number of resident days within the same time period and then multiplying by 10,000 (Equation 2). Because the target of many CAUTI interventions is reduction in the number of catheter days, this measure has been shown to be more sensitive in intervention studies, as it is standardized by the population, which is typically constant (unlike catheter days, which can decrease during an intervention).44
Equation 2. Population CAUTI Rate
𝑃𝑃𝐸𝐸𝐸𝐸𝑃𝑃𝑃𝑃𝑅𝑅𝑅𝑅𝐸𝐸𝐸𝐸𝑃𝑃 𝐶𝐶𝐶𝐶𝐶𝐶𝐶𝐶𝐶𝐶 𝑅𝑅𝑅𝑅𝑅𝑅𝑅𝑅 =𝐶𝐶𝐶𝐶𝐶𝐶𝐶𝐶𝐶𝐶 𝐸𝐸𝐸𝐸𝐸𝐸𝐸𝐸𝐸𝐸𝐸𝐸𝑅𝑅𝐸𝐸𝑅𝑅𝑅𝑅𝐸𝐸𝐸𝐸𝐸𝐸𝑅𝑅𝑃𝑃𝑅𝑅 𝐷𝐷𝑅𝑅𝐷𝐷𝐸𝐸
× 10,000
Process Measures Catheter Utilization Ratio The catheter utilization ratio more closely assesses the relationship between changes in catheter utilization and resident volume. Catheter utilization is calculated by dividing the total number of catheter days in a given time period by the total number of resident days in the corresponding time
42 Dudeck MA, Horan TC, Peterson KD, et al. National Healthcare Safety Network (NHSN) report, data summary for 2010, device-associated module. Am J Infect Control 2011;39(10):798-816. PMID: 22133532.
43 Fakih MG, Greene MT, Kennedy EH, et al. Introducing a population-based outcome measure to evaluate the effect of interventions to reduce catheter-associated urinary tract infection. Am J Infect Control 2012;40(4):359-64. PMID 21868133.
44 Wright M-O, Kharasch M, Beaumont JL, et al. Reporting catheter-associated urinary tract infections: denominator matters. Infect Control Hosp Epidemiol 2011;32(7):635-640. PMID: 21666391.
AHRQ Safety Program for Long-Term Care: HAIs/CAUTI Final Report 33
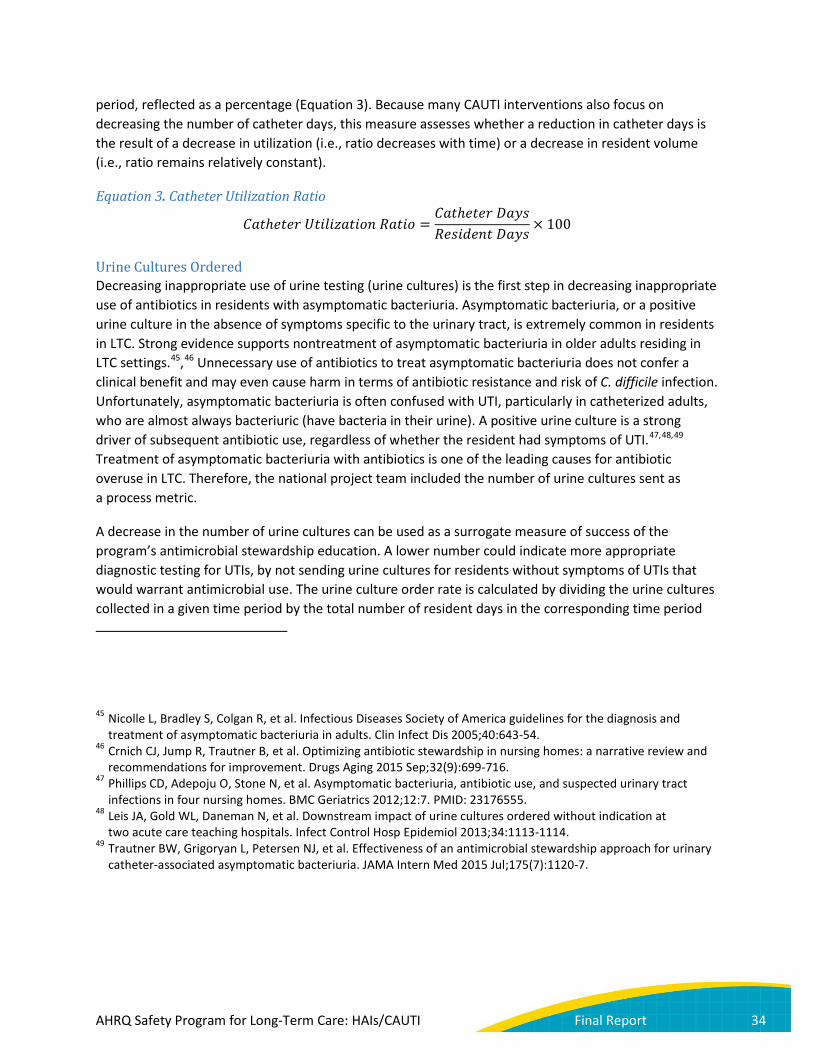
period, reflected as a percentage (Equation 3). Because many CAUTI interventions also focus on decreasing the number of catheter days, this measure assesses whether a reduction in catheter days is the result of a decrease in utilization (i.e., ratio decreases with time) or a decrease in resident volume (i.e., ratio remains relatively constant).
Equation 3. Catheter Utilization Ratio
𝐶𝐶𝑅𝑅𝑅𝑅ℎ𝑅𝑅𝑅𝑅𝑅𝑅𝑒𝑒 𝐶𝐶𝑅𝑅𝐸𝐸𝑃𝑃𝐸𝐸𝑈𝑈𝑅𝑅𝑅𝑅𝐸𝐸𝐸𝐸𝑃𝑃 𝑅𝑅𝑅𝑅𝑅𝑅𝐸𝐸𝐸𝐸 =𝐶𝐶𝑅𝑅𝑅𝑅ℎ𝑅𝑅𝑅𝑅𝑅𝑅𝑒𝑒 𝐷𝐷𝑅𝑅𝐷𝐷𝐸𝐸𝑅𝑅𝑅𝑅𝐸𝐸𝐸𝐸𝐸𝐸𝑅𝑅𝑃𝑃𝑅𝑅 𝐷𝐷𝑅𝑅𝐷𝐷𝐸𝐸
× 100
Urine Cultures Ordered Decreasing inappropriate use of urine testing (urine cultures) is the first step in decreasing inappropriate use of antibiotics in residents with asymptomatic bacteriuria. Asymptomatic bacteriuria, or a positive urine culture in the absence of symptoms specific to the urinary tract, is extremely common in residents in LTC. Strong evidence supports nontreatment of asymptomatic bacteriuria in older adults residing in LTC settings.45,46 Unnecessary use of antibiotics to treat asymptomatic bacteriuria does not confer a clinical benefit and may even cause harm in terms of antibiotic resistance and risk of C. difficile infection. Unfortunately, asymptomatic bacteriuria is often confused with UTI, particularly in catheterized adults, who are almost always bacteriuric (have bacteria in their urine). A positive urine culture is a strong driver of subsequent antibiotic use, regardless of whether the resident had symptoms of UTI.47,48,49 Treatment of asymptomatic bacteriuria with antibiotics is one of the leading causes for antibiotic overuse in LTC. Therefore, the national project team included the number of urine cultures sent as a process metric.
A decrease in the number of urine cultures can be used as a surrogate measure of success of the program’s antimicrobial stewardship education. A lower number could indicate more appropriate diagnostic testing for UTIs, by not sending urine cultures for residents without symptoms of UTIs that would warrant antimicrobial use. The urine culture order rate is calculated by dividing the urine cultures collected in a given time period by the total number of resident days in the corresponding time period
45 Nicolle L, Bradley S, Colgan R, et al. Infectious Diseases Society of America guidelines for the diagnosis and treatment of asymptomatic bacteriuria in adults. Clin Infect Dis 2005;40:643-54.
46 Crnich CJ, Jump R, Trautner B, et al. Optimizing antibiotic stewardship in nursing homes: a narrative review and recommendations for improvement. Drugs Aging 2015 Sep;32(9):699-716.
47 Phillips CD, Adepoju O, Stone N, et al. Asymptomatic bacteriuria, antibiotic use, and suspected urinary tract infections in four nursing homes. BMC Geriatrics 2012;12:7. PMID: 23176555.
48 Leis JA, Gold WL, Daneman N, et al. Downstream impact of urine cultures ordered without indication at two acute care teaching hospitals. Infect Control Hosp Epidemiol 2013;34:1113-1114.
49 Trautner BW, Grigoryan L, Petersen NJ, et al. Effectiveness of an antimicrobial stewardship approach for urinary catheter-associated asymptomatic bacteriuria. JAMA Intern Med 2015 Jul;175(7):1120-7.
AHRQ Safety Program for Long-Term Care: HAIs/CAUTI Final Report 34
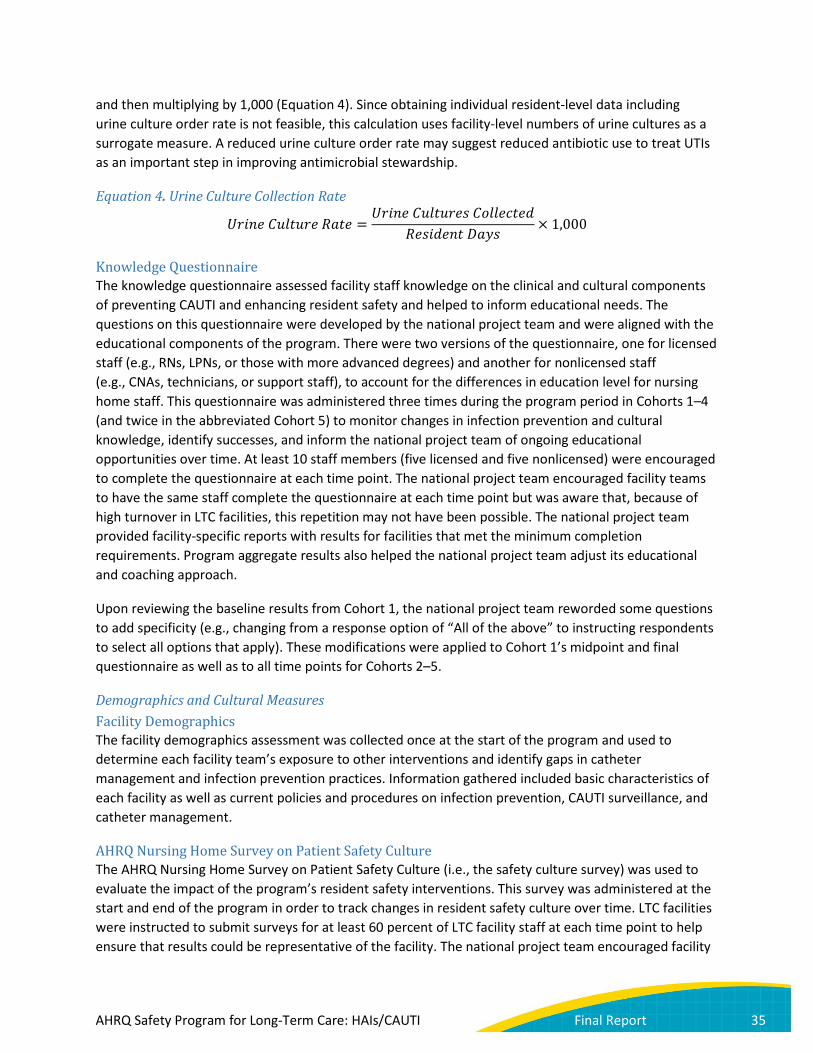
and then multiplying by 1,000 (Equation 4). Since obtaining individual resident-level data including urine culture order rate is not feasible, this calculation uses facility-level numbers of urine cultures as a surrogate measure. A reduced urine culture order rate may suggest reduced antibiotic use to treat UTIs as an important step in improving antimicrobial stewardship.
Equation 4. Urine Culture Collection Rate
𝐶𝐶𝑒𝑒𝐸𝐸𝑃𝑃𝑅𝑅 𝐶𝐶𝑃𝑃𝑃𝑃𝑅𝑅𝑃𝑃𝑒𝑒𝑅𝑅 𝑅𝑅𝑅𝑅𝑅𝑅𝑅𝑅 =𝐶𝐶𝑒𝑒𝐸𝐸𝑃𝑃𝑅𝑅 𝐶𝐶𝑃𝑃𝑃𝑃𝑅𝑅𝑃𝑃𝑒𝑒𝑅𝑅𝐸𝐸 𝐶𝐶𝐸𝐸𝑃𝑃𝑃𝑃𝑅𝑅𝐶𝐶𝑅𝑅𝑅𝑅𝐸𝐸
𝑅𝑅𝑅𝑅𝐸𝐸𝐸𝐸𝐸𝐸𝑅𝑅𝑃𝑃𝑅𝑅 𝐷𝐷𝑅𝑅𝐷𝐷𝐸𝐸× 1,000
Knowledge Questionnaire The knowledge questionnaire assessed facility staff knowledge on the clinical and cultural components of preventing CAUTI and enhancing resident safety and helped to inform educational needs. The questions on this questionnaire were developed by the national project team and were aligned with the educational components of the program. There were two versions of the questionnaire, one for licensed staff (e.g., RNs, LPNs, or those with more advanced degrees) and another for nonlicensed staff (e.g., CNAs, technicians, or support staff), to account for the differences in education level for nursing home staff. This questionnaire was administered three times during the program period in Cohorts 1–4 (and twice in the abbreviated Cohort 5) to monitor changes in infection prevention and cultural knowledge, identify successes, and inform the national project team of ongoing educational opportunities over time. At least 10 staff members (five licensed and five nonlicensed) were encouraged to complete the questionnaire at each time point. The national project team encouraged facility teams to have the same staff complete the questionnaire at each time point but was aware that, because of high turnover in LTC facilities, this repetition may not have been possible. The national project team provided facility-specific reports with results for facilities that met the minimum completion requirements. Program aggregate results also helped the national project team adjust its educational and coaching approach.
Upon reviewing the baseline results from Cohort 1, the national project team reworded some questions to add specificity (e.g., changing from a response option of “All of the above” to instructing respondents to select all options that apply). These modifications were applied to Cohort 1’s midpoint and final questionnaire as well as to all time points for Cohorts 2–5.
Demographics and Cultural Measures Facility Demographics The facility demographics assessment was collected once at the start of the program and used to determine each facility team’s exposure to other interventions and identify gaps in catheter management and infection prevention practices. Information gathered included basic characteristics of each facility as well as current policies and procedures on infection prevention, CAUTI surveillance, and catheter management.
AHRQ Nursing Home Survey on Patient Safety Culture The AHRQ Nursing Home Survey on Patient Safety Culture (i.e., the safety culture survey) was used to evaluate the impact of the program’s resident safety interventions. This survey was administered at the start and end of the program in order to track changes in resident safety culture over time. LTC facilities were instructed to submit surveys for at least 60 percent of LTC facility staff at each time point to help ensure that results could be representative of the facility. The national project team encouraged facility
AHRQ Safety Program for Long-Term Care: HAIs/CAUTI Final Report 35

teams to administer the safety culture survey to all staff, including those with no direct care to residents, at both time points.
Stakeholder Feedback The national project team administered a practice change assessment to Cohort 2 LTC facilities and conducted interviews with select LTC facility teams and organizational leads. Information from this feedback allowed the national project team to better understand the needs of program participants in the LTC environment and the program results.
Cohort 2 Practice Change Assessment To evaluate evidence-based practice changes among Cohort 2 facilities over the course of the program, HRET designed a followup assessment based on the demographics questionnaire. Questions were selected to solicit information about whether or not facilities had implemented specific practices and policies related to program education. The questionnaire was administered to the 136 facilities in Cohort 2 that were active at the end of the Cohort 2 program period. Because of the program closeout in September 2016 and the need for Cohorts 3, 4, and 5 to complete their final knowledge questionnaires and safety culture surveys, the national project team administered this practice change assessment only to Cohort 2.
Questions covered six domains: 1. Catheter management 2. Surveillance 3. QI programs 4. Training 5. Infection prevention policies 6. Sustainability strategies
Stakeholder Interviews To better understand changes made by facility teams as a result of participation in the program, the national project team conducted a series of 30-minute semistructured qualitative interviews with select facilities in Cohorts 2–4. Most candidates were identified based on either high or low participation in program activities; organizational leads also recommended a few additional facilities to be interviewed. Some organizational leads from Cohorts 3 and 4 were also interviewed about their experiences implementing the program.
The interviews addressed topics including: • Facilities’ reasons for joining the initiative • Practice changes observed among facility teams • Which changes the interviewees believed had the greatest long-term impact on clinical practices
and why • Which changes the facilities planned to encourage or sustain over time and why • Barriers to staff implementing practice changes to reduce CAUTI
Site Visits The national project team conducted site visits to facilities in seven States, with the purpose of learning about success factors and challenges encountered by participants. The site visit teams included
AHRQ Safety Program for Long-Term Care: HAIs/CAUTI Final Report 36
representatives of HRET, faculty coaches, and organizational leads. Some visits lasted an entire day, while others were half-day visits. Each site visit agenda included a review of the facility’s data, a tour of the complex, interaction with staff and residents, and a discussion of what aspects of the program the facility team lead or staff found most useful in implementing the program.
Project Recap Meeting In August 2016, HRET convened a program recap meeting in Chicago to solicit feedback from stakeholders. The meeting was attended by organizational leads, coaches, HRET staff, and members of the national project team. Through a series of panels, presentations, and discussions, attendees addressed successes of the program, lessons learned, sustainability, and recommendations for future collaboratives in LTC from a variety of perspectives.
AHRQ Safety Program for Long-Term Care: HAIs/CAUTI Final Report 37
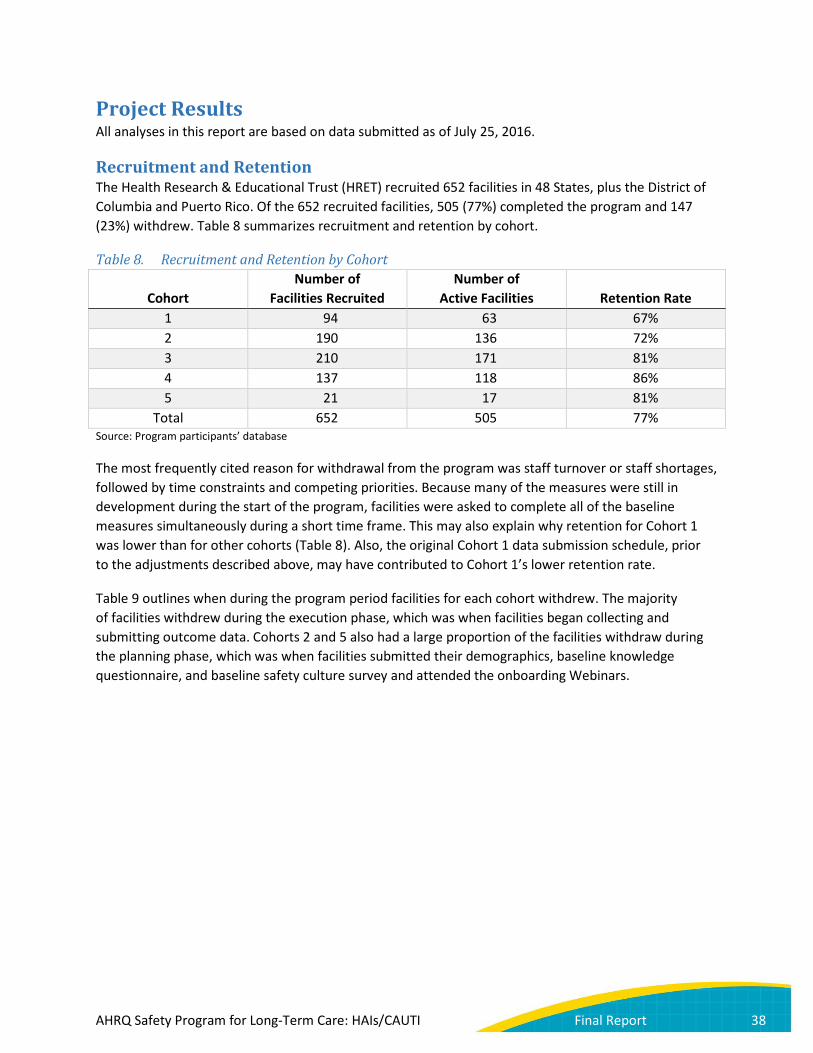
Project Results All analyses in this report are based on data submitted as of July 25, 2016.
Recruitment and Retention The Health Research & Educational Trust (HRET) recruited 652 facilities in 48 States, plus the District of Columbia and Puerto Rico. Of the 652 recruited facilities, 505 (77%) completed the program and 147 (23%) withdrew. Table 8 summarizes recruitment and retention by cohort.
Table 8. Recruitment and Retention by Cohort
Cohort Number of
Facilities Recruited Number of
Active Facilities Retention Rate 1 94 63 67% 2 190 136 72% 3 210 171 81% 4 137 118 86% 5 21 17 81%
Total 652 505 77% Source: Program participants’ database
The most frequently cited reason for withdrawal from the program was staff turnover or staff shortages, followed by time constraints and competing priorities. Because many of the measures were still in development during the start of the program, facilities were asked to complete all of the baseline measures simultaneously during a short time frame. This may also explain why retention for Cohort 1 was lower than for other cohorts (Table 8). Also, the original Cohort 1 data submission schedule, prior to the adjustments described above, may have contributed to Cohort 1’s lower retention rate.
Table 9 outlines when during the program period facilities for each cohort withdrew. The majority of facilities withdrew during the execution phase, which was when facilities began collecting and submitting outcome data. Cohorts 2 and 5 also had a large proportion of the facilities withdraw during the planning phase, which was when facilities submitted their demographics, baseline knowledge questionnaire, and baseline safety culture survey and attended the onboarding Webinars.
AHRQ Safety Program for Long-Term Care: HAIs/CAUTI Final Report 38
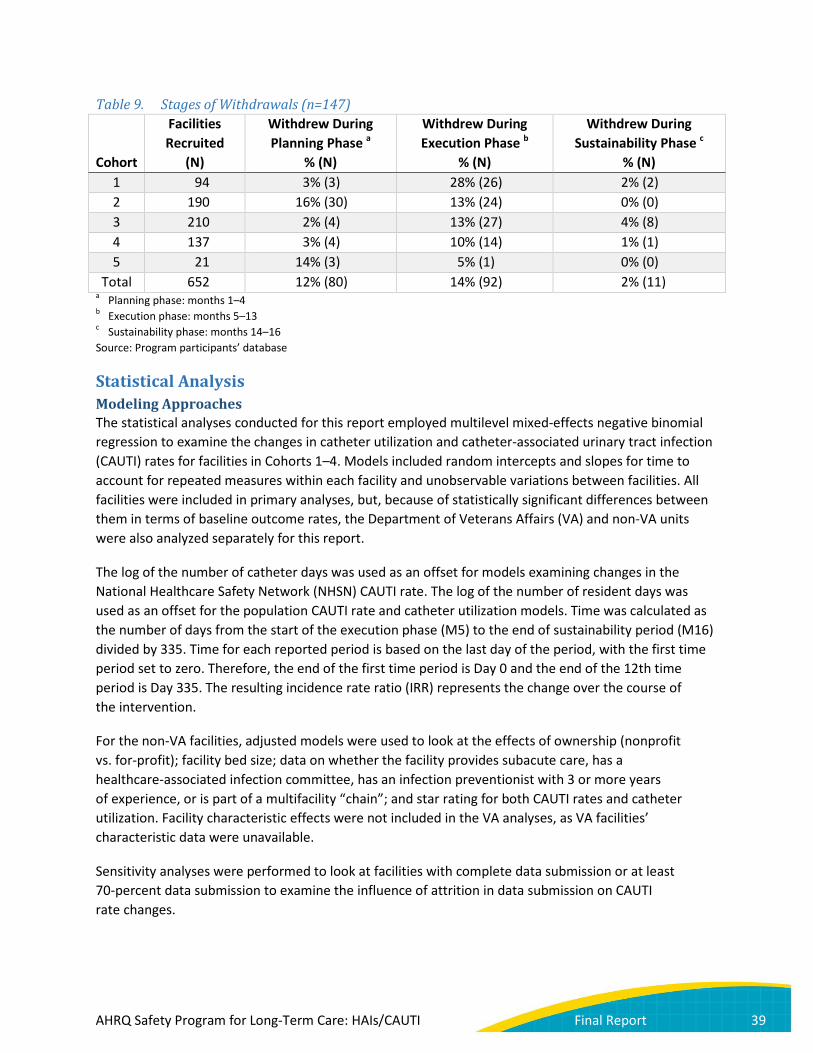
Table 9. Stages of Withdrawals (n=147)
Cohort
Facilities Recruited
(N)
Withdrew During Planning Phase a
% (N)
Withdrew During Execution Phase b
% (N)
Withdrew During Sustainability Phase c
% (N)
1 94 3% (3) 28% (26) 2% (2) 2 190 16% (30) 13% (24) 0% (0) 3 210 2% (4) 13% (27) 4% (8) 4 137 3% (4) 10% (14) 1% (1) 5 21 14% (3) 5% (1) 0% (0)
Total 652 12% (80) 14% (92) 2% (11) a Planning phase: months 1–4 b Execution phase: months 5–13 c Sustainability phase: months 14–16 Source: Program participants’ database
Statistical Analysis Modeling Approaches The statistical analyses conducted for this report employed multilevel mixed-effects negative binomial regression to examine the changes in catheter utilization and catheter-associated urinary tract infection (CAUTI) rates for facilities in Cohorts 1–4. Models included random intercepts and slopes for time to account for repeated measures within each facility and unobservable variations between facilities. All facilities were included in primary analyses, but, because of statistically significant differences between them in terms of baseline outcome rates, the Department of Veterans Affairs (VA) and non-VA units were also analyzed separately for this report.
The log of the number of catheter days was used as an offset for models examining changes in the National Healthcare Safety Network (NHSN) CAUTI rate. The log of the number of resident days was used as an offset for the population CAUTI rate and catheter utilization models. Time was calculated as the number of days from the start of the execution phase (M5) to the end of sustainability period (M16) divided by 335. Time for each reported period is based on the last day of the period, with the first time period set to zero. Therefore, the end of the first time period is Day 0 and the end of the 12th time period is Day 335. The resulting incidence rate ratio (IRR) represents the change over the course of the intervention.
For the non-VA facilities, adjusted models were used to look at the effects of ownership (nonprofit vs. for-profit); facility bed size; data on whether the facility provides subacute care, has a healthcare-associated infection committee, has an infection preventionist with 3 or more years of experience, or is part of a multifacility “chain”; and star rating for both CAUTI rates and catheter utilization. Facility characteristic effects were not included in the VA analyses, as VA facilities’ characteristic data were unavailable.
Sensitivity analyses were performed to look at facilities with complete data submission or at least 70-percent data submission to examine the influence of attrition in data submission on CAUTI rate changes.
AHRQ Safety Program for Long-Term Care: HAIs/CAUTI Final Report 39

Inclusion/Exclusion Criteria To be included in the analyses, facilities had to be active at the end of their cohort and report at least two time periods of outcome data with nonzero denominators. Cohort 1 facilities also had to submit data directly to HRET. There were two Cohort 1 facilities that conferred their NHSN rights to HRET. Because Cohort 1 facilities submitting data into the Comprehensive Data System (CDS) did so daily or weekly, depending on the measure, it is difficult to match the monthly time points from the two Cohort 1 facilities submitting data to NHSN, so these two facilities were excluded from the analysis. After applying these exclusions, 459 of the 631 facilities enrolled in Cohorts 1–4 were included in the analyses. In addition to these exclusions, improbable data, such as large fluctuations in reported device days or resident days from month to month within a given nursing home, were identified and excluded from the analysis dataset.
Facility Characteristics To better understand the types of facilities participating in this initiative, the national project team compared various characteristics of facilities in this initiative with a control group using publicly available data, as described below. Of the 459 facilities from Cohorts 1–4 that were actively participating in the program and met all criteria for inclusion in the analysis, 55 were VA facilities and five did not participate in Medicare and therefore did not have Federal ID numbers. The remaining 399 had Federal identifiers necessary to link with external data sources from Online Survey, Certification and Reporting (OSCAR), Minimum Data Set (MDS), and Centers for Medicare & Medicaid Services (CMS) health care files.
The presented analyses included only facilities with all four quarters from 2013 in the Nursing Home Compare five-star data (publically available via CMS) and focused on variables with the least missing data. Of the 399 facilities, 12 were missing data from one or more of these three sources and were therefore dropped from the analyses. To obtain a control group, the national project team used the Federal OSCAR data to identify 14,652 facilities with complete Nursing Home Compare data in 2013, OSCAR and MDS data, and a bed size of at least 20 beds (the minimum bed size for facilities participating in this program). To compare characteristics of the two groups, the national project team used one-way analysis of variance.
Among these 387 non-VA program facilities with complete data, the mean bed size was 121, 67 percent were for-profit, and 56 percent were part of a chain (Table 10). The most notable difference between participating and nonparticipating facilities was size: the average participating facility was larger in comparison to nonparticipating control facilities, which had a mean bed size of 107. Resident complexity was about the same, with a case-mix index of 1.30 versus 1.28, a difference that did not reach statistical significance. The CMS five-star rating was higher for participating facilities at 3.5 versus 3.2; however, this overall difference was not driven by differences in quality measure performance, but rather in staffing ratios and health inspection. The characteristics that did not differ were ownership, percentage of patients on Medicare or Medicaid, and reported percentage of residents on antibiotics.
In summary, participating facilities were larger and had slightly better five-star ratings (staffing ratios and health inspection components) than nonparticipating facilities. Therefore, subsequent analyses controlled for these characteristics. The national project team does not expect that the small differences would limit generalizability of results.
AHRQ Safety Program for Long-Term Care: HAIs/CAUTI Final Report 40
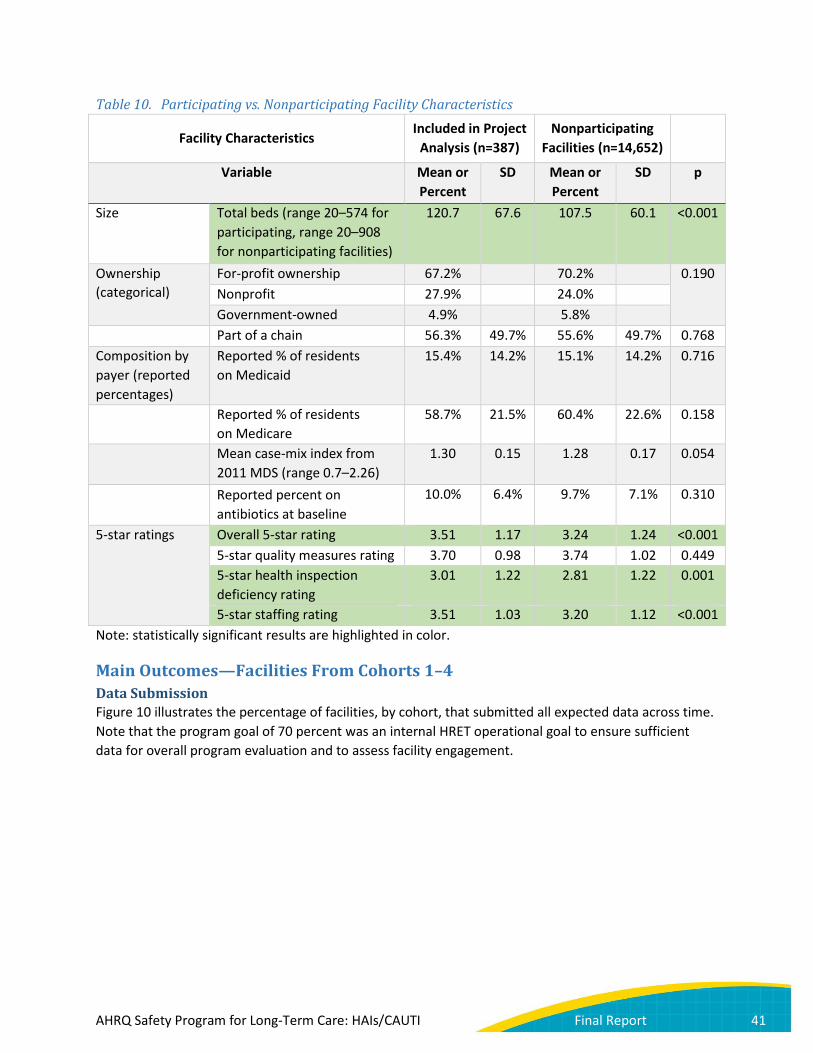
Table 10. Participating vs. Nonparticipating Facility Characteristics
Facility Characteristics Included in Project
Analysis (n=387) Nonparticipating
Facilities (n=14,652)
Variable Mean or Percent
SD Mean or Percent
SD p
Size Total beds (range 20–574 for participating, range 20–908 for nonparticipating facilities)
120.7 67.6 107.5 60.1 <0.001
Ownership (categorical)
For-profit ownership 67.2% 70.2% 0.190 Nonprofit 27.9% 24.0% Government-owned 4.9% 5.8%
Part of a chain 56.3% 49.7% 55.6% 49.7% 0.768 Composition by payer (reported percentages)
Reported % of residents on Medicaid
15.4% 14.2% 15.1% 14.2% 0.716
Reported % of residents on Medicare
58.7% 21.5% 60.4% 22.6% 0.158
Mean case-mix index from 2011 MDS (range 0.7–2.26)
1.30 0.15 1.28 0.17 0.054
Reported percent on antibiotics at baseline
10.0% 6.4% 9.7% 7.1% 0.310
5-star ratings Overall 5-star rating 3.51 1.17 3.24 1.24 <0.001 5-star quality measures rating 3.70 0.98 3.74 1.02 0.449 5-star health inspection deficiency rating
3.01 1.22 2.81 1.22 0.001
5-star staffing rating 3.51 1.03 3.20 1.12 <0.001 Note: statistically significant results are highlighted in color.
Main Outcomes—Facilities From Cohorts 1–4 Data Submission Figure 10 illustrates the percentage of facilities, by cohort, that submitted all expected data across time. Note that the program goal of 70 percent was an internal HRET operational goal to ensure sufficient data for overall program evaluation and to assess facility engagement.
AHRQ Safety Program for Long-Term Care: HAIs/CAUTI Final Report 41

Figure 10. Percentage of Active Facilities Submitting Outcome Data by Program Month (n=505)
Note: M1 of data is M5 of overall program participation, as shown in Figures 7–9. Cohort 1 M1: May 2014. Cohort 2 M1: November 2014. Cohort 3 M1: June 2015. Cohort 4 M1: September 2015. Cohort 5 M1: November 2015. The N’s shown in parentheses represent the number of active facilities in each cohort.
Source: CDS; CAUTIs, resident days, and catheter days submitted as of July 25, 2016.
For Cohort 1 facilities, outcome data submission decreased to below the program goal of 70 percent as the cohort came to a close. Cohort 2 outcome data submission remained strong, with a slight decline for the final month of the program. Cohort 3, which struggled with outcome data submission from the onset of the program, showed trends similar to Cohort 1. Cohort 4 was strong at data submission, while Cohort 5 was above the 70-percent target for all but the last month of data submission (M8). In past programs, the national project team has seen decreases in data submission over time. To address these lower-than-expected rates, the national project team adjusted the submission schedule between Cohorts 1 and 2 and developed a process with organizational leads to monitor data submission rates and develop action plans to improve submission rates as needed. It must also be noted that Cohort 5 was a much smaller cohort and, as described above, was managed differently than previous cohorts. In regard to Cohort 5, HRET advisors developed a decision tree for addressing low data submission with their facilities and increased one-on-one communications with these facilities. Details of actions taken to increase and maintain data submission rates are outlined in later sections of this report.
Outcome Measures: Model-Based Results—Cohorts 1–4 For the final report, the national project team assessed change over time for the facilities in Cohorts 1–4 that were active at the end of the program and submitted at least two time periods worth of data (see
M1 M2 M3 M4 M5 M6 M7 M8 M9 M10 M11 M12Cohort 1 (n=63) 91% 87% 83% 83% 81% 79% 75% 70% 67% 64% 61% 52%Cohort 2 (n=136) 98% 98% 99% 97% 97% 97% 96% 97% 97% 96% 95% 81%Cohort 3 (n=171) 85% 88% 89% 93% 92% 88% 87% 82% 80% 75% 68% 59%Cohort 4 (n=118) 99% 99% 99% 99% 99% 99% 97% 98% 94% 93%Cohort 5 (n=17) 88% 88% 88% 88% 88% 82% 82% 41%Program Goal 70% 70% 70% 70% 70% 70% 70% 70% 70% 70% 70% 70%
0%
10%
20%
30%
40%
50%
60%
70%
80%
90%
100%
Perc
ent O
utco
me
Subm
issio
n
AHRQ Safety Program for Long-Term Care: HAIs/CAUTI Final Report 42
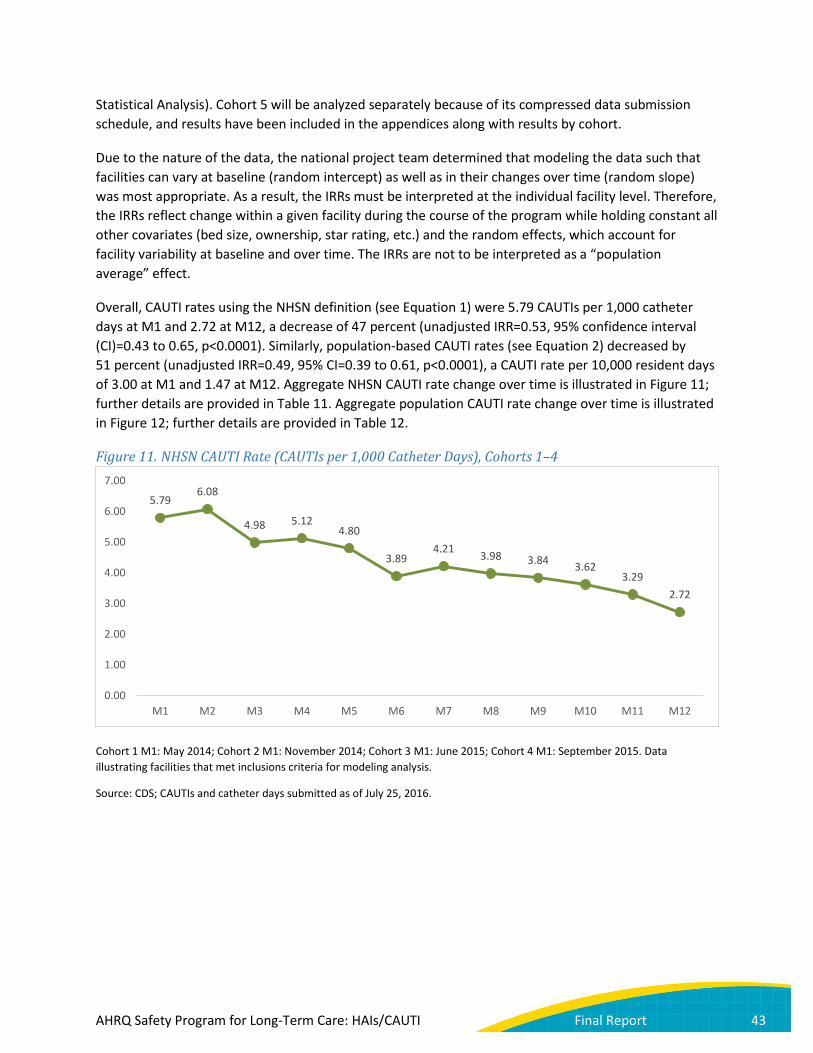
Statistical Analysis). Cohort 5 will be analyzed separately because of its compressed data submission schedule, and results have been included in the appendices along with results by cohort.
Due to the nature of the data, the national project team determined that modeling the data such that facilities can vary at baseline (random intercept) as well as in their changes over time (random slope) was most appropriate. As a result, the IRRs must be interpreted at the individual facility level. Therefore, the IRRs reflect change within a given facility during the course of the program while holding constant all other covariates (bed size, ownership, star rating, etc.) and the random effects, which account for facility variability at baseline and over time. The IRRs are not to be interpreted as a “population average” effect.
Overall, CAUTI rates using the NHSN definition (see Equation 1) were 5.79 CAUTIs per 1,000 catheter days at M1 and 2.72 at M12, a decrease of 47 percent (unadjusted IRR=0.53, 95% confidence interval (CI)=0.43 to 0.65, p<0.0001). Similarly, population-based CAUTI rates (see Equation 2) decreased by 51 percent (unadjusted IRR=0.49, 95% CI=0.39 to 0.61, p<0.0001), a CAUTI rate per 10,000 resident days of 3.00 at M1 and 1.47 at M12. Aggregate NHSN CAUTI rate change over time is illustrated in Figure 11; further details are provided in Table 11. Aggregate population CAUTI rate change over time is illustrated in Figure 12; further details are provided in Table 12.
Figure 11. NHSN CAUTI Rate (CAUTIs per 1,000 Catheter Days), Cohorts 1–4
Cohort 1 M1: May 2014; Cohort 2 M1: November 2014; Cohort 3 M1: June 2015; Cohort 4 M1: September 2015. Data illustrating facilities that met inclusions criteria for modeling analysis.
Source: CDS; CAUTIs and catheter days submitted as of July 25, 2016.
5.79 6.08
4.98 5.12 4.80
3.89 4.21 3.98 3.84 3.62
3.29 2.72
0.00
1.00
2.00
3.00
4.00
5.00
6.00
7.00
M1 M2 M3 M4 M5 M6 M7 M8 M9 M10 M11 M12
AHRQ Safety Program for Long-Term Care: HAIs/CAUTI Final Report 43

Table 11. Number of CAUTIs, Catheter Days, and Facilities Reporting Program Month CAUTIs Catheter Days Facilities Reporting *
M1 364 62,845 416 M2 404 66,494 423 M3 339 68,010 430 M4 336 65,596 427 M5 317 66,090 416 M6 241 61,882 406 M7 254 60,270 401 M8 242 60,852 391 M9 221 57,538 378 M10 206 56,858 371 M11 125 37,944 249 M12 87 31,936 216
* Of the 488 facilities that completed Cohorts 1–4, 459 met the inclusion criteria for modeling analysis. Of these 459, not all may have data included in any given program month.
Figure 12. Population CAUTI Rate (CAUTIs per 10,000 Resident Days), Cohorts 1–4
Cohort 1 M1: May 2014; Cohort 2 M1: November 2014; Cohort 3 M1: June 2015; Cohort 4 M1: September 2015. Data illustrating facilities that met inclusions criteria for modeling analysis.
Source: CDS; CAUTIs and resident days submitted as of July 25, 2016.
3.00 3.20
2.57 2.73
2.52
1.98 2.12 2.03 1.94 1.86 1.79
1.47
0.00
0.50
1.00
1.50
2.00
2.50
3.00
3.50
M1 M2 M3 M4 M5 M6 M7 M8 M9 M10 M11 M12
AHRQ Safety Program for Long-Term Care: HAIs/CAUTI Final Report 44

Table 12. Number of CAUTIs, Resident Days, and Facilities Reporting Program Month CAUTIs Resident Days Facilities Reporting *
M1 364 1,212,765 416 M2 404 1,262,024 423 M3 339 1,318,917 430 M4 336 1,228,818 427 M5 317 1,256,419 416 M6 241 1,217,040 406 M7 254 1,200,763 401 M8 242 1,192,914 391 M9 221 1,137,941 378 M10 206 1,108,839 371 M11 125 696,798 249 M12 87 593,494 216
* Of the 488 facilities that completed Cohorts 1–4, 459 met the inclusion criteria for modeling analysis. Of these 459, not all may have data included in any given program month.
Using Cohort 1–4 data, NHSN CAUTI rates differed by VA status at baseline (IRR=0.40, 95% CI=0.27 to 0.57, p<0.0001) and over time (IRR=1.79, 95% CI=1.03 to 3.12, p=0.04). Given known differences between veteran and nonveteran resident populations, coupled with these overall findings, the national project team also analyzed the VA and non-VA facilities separately. Among non-VA facilities included in program analyses (n=404), NHSN CAUTI rates decreased from 6.78 CAUTIs per 1,000 catheter days at M1 to 2.63 at M12, a reduction of 52 percent (IRR=0.48, 95% CI=0.38 to 0.60, p<0.0001). After adjustment for facility characteristics, the results were similar (IRR=0.46, 95% CI=0.36 to 0.58, p<0.0001). Similarly, the M1 and M12 population-based CAUTI rates were 3.06 and 1.28 CAUTIs per 10,000 resident days respectively, a decrease of 53 percent (IRR=0.47, 95% CI=0.37 to 0.60, p<0.0001). The results were again similar after adjustment (IRR=0.45, 95% CI=0.34 to 0.58, p<0.0001).
VA facilities began the program with markedly lower CAUTI rates than non-VA facilities (2.26 vs. 6.78 CAUTIs per 1,000 catheter days). Among VA facilities in Cohort 3 included in program analyses (n=55), NHSN CAUTI rates and population-based CAUTI rates did not change significantly. The NHSN CAUTI rate among VA facilities was 2.26 CAUTIs per 1,000 catheter days at M1 and 3.19 at M12, while the population rate (i.e., CAUTIs per 10,000 resident days) at M1 and M12 was 2.49 and 3.61, respectively. The unadjusted IRRs, 95% CIs, and p-values were 0.99, 0.67 to 1.44, p=0.94; and 0.99, 0.67 to 1.47, p=0.95, respectively. The VA rate in later months, especially M12, should be interpreted with caution because of the small number of VA facilities reporting and small number of CAUTIs.
In summary, 75 percent of non-VA facilities reported at least 40 percent reduction in CAUTIs. This result is presented only for non-VA facilities because, as noted above, although VA facilities began the program with markedly lower CAUTI rates, significant CAUTI rate reductions were not observed among the VA facilities.
Non-VA versus VA NHSN and population CAUTI rates are illustrated in Figures 13 and 14. Further details are provided in Tables 13-16.
AHRQ Safety Program for Long-Term Care: HAIs/CAUTI Final Report 45

Figure 13. NHSN CAUTI Rate (CAUTIs per 1,000 Catheter Days), Non-VA (Cohorts 1–4) vs. VA (Cohort 3)
Cohort 1 M1: May 2014; Cohort 2 M1: November 2014; Cohort 3 M1: June 2015; Cohort 4 M1: September 2015. Data illustrating facilities that met inclusion criteria for modeling analysis, stratified by VA status. The VA rate in later months, especially M12, should be interpreted with caution because of the small number of facilities reporting.
Source: CDS; resident days and catheter days submitted as of July 25, 2016.
Table 13. Number of CAUTIs, Catheter Days, and Facilities Reporting, Non-VA Facilities (Cohorts 1–4) Program Month CAUTIs Catheter Days Facilities Reporting *
M1 333 49,140 361 M2 366 52,062 368 M3 302 54,227 376 M4 300 52,660 374 M5 286 53,839 366 M6 211 50,618 361 M7 223 49,285 358 M8 216 50,137 349 M9 199 47,862 337 M10 186 47,618 333 M11 104 30,538 216 M12 70 26,610 193
* Of the 433 non-VA facilities that completed Cohorts 1–4, 404 met the inclusion criteria for modeling analysis. Of these 404, not all may have data included in any given month.
M1 M2 M3 M4 M5 M6 M7 M8 M9 M10 M11 M12Non-VA 6.78 7.03 5.57 5.70 5.31 4.17 4.52 4.31 4.16 3.91 3.41 2.63VA 2.26 2.63 2.68 2.78 2.53 2.66 2.82 2.43 2.27 2.16 2.84 3.19
0.00
1.00
2.00
3.00
4.00
5.00
6.00
7.00
8.00
AHRQ Safety Program for Long-Term Care: HAIs/CAUTI Final Report 46
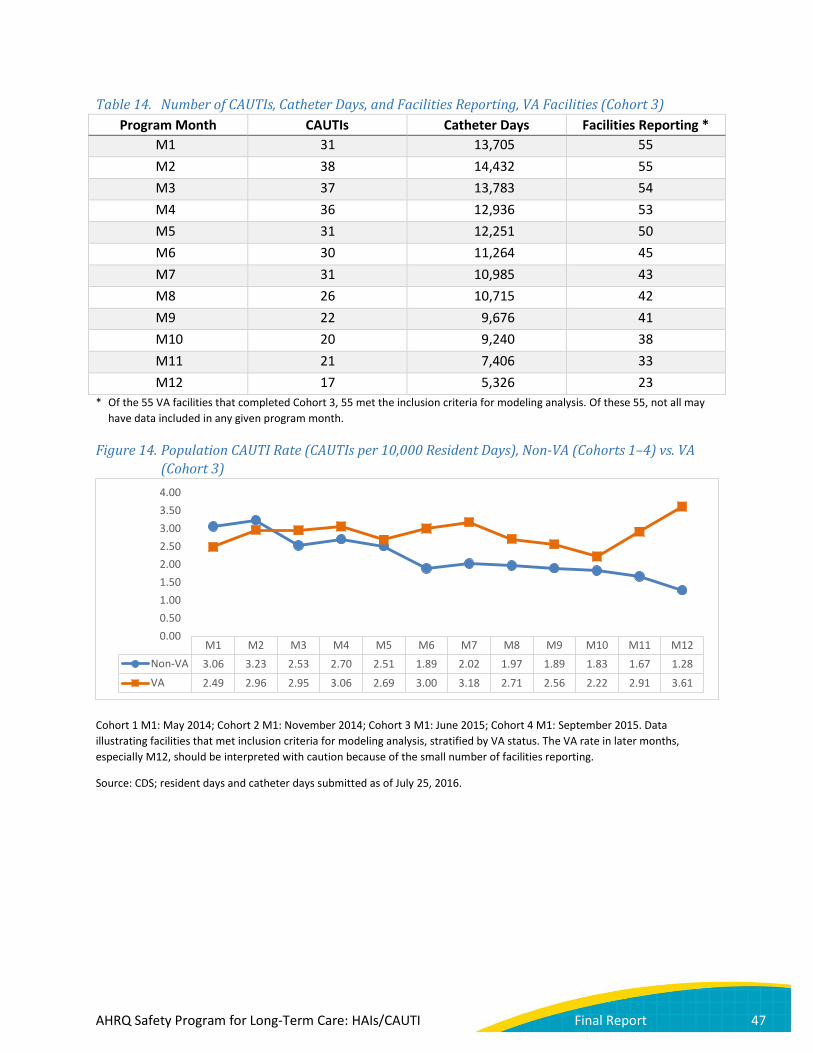
Table 14. Number of CAUTIs, Catheter Days, and Facilities Reporting, VA Facilities (Cohort 3) Program Month CAUTIs Catheter Days Facilities Reporting *
M1 31 13,705 55 M2 38 14,432 55 M3 37 13,783 54 M4 36 12,936 53 M5 31 12,251 50 M6 30 11,264 45 M7 31 10,985 43 M8 26 10,715 42 M9 22 9,676 41 M10 20 9,240 38 M11 21 7,406 33 M12 17 5,326 23
* Of the 55 VA facilities that completed Cohort 3, 55 met the inclusion criteria for modeling analysis. Of these 55, not all may have data included in any given program month.
Figure 14. Population CAUTI Rate (CAUTIs per 10,000 Resident Days), Non-VA (Cohorts 1–4) vs. VA (Cohort 3)
Cohort 1 M1: May 2014; Cohort 2 M1: November 2014; Cohort 3 M1: June 2015; Cohort 4 M1: September 2015. Data illustrating facilities that met inclusion criteria for modeling analysis, stratified by VA status. The VA rate in later months, especially M12, should be interpreted with caution because of the small number of facilities reporting.
Source: CDS; resident days and catheter days submitted as of July 25, 2016.
M1 M2 M3 M4 M5 M6 M7 M8 M9 M10 M11 M12Non-VA 3.06 3.23 2.53 2.70 2.51 1.89 2.02 1.97 1.89 1.83 1.67 1.28VA 2.49 2.96 2.95 3.06 2.69 3.00 3.18 2.71 2.56 2.22 2.91 3.61
0.000.501.001.502.002.503.003.504.00
AHRQ Safety Program for Long-Term Care: HAIs/CAUTI Final Report 47
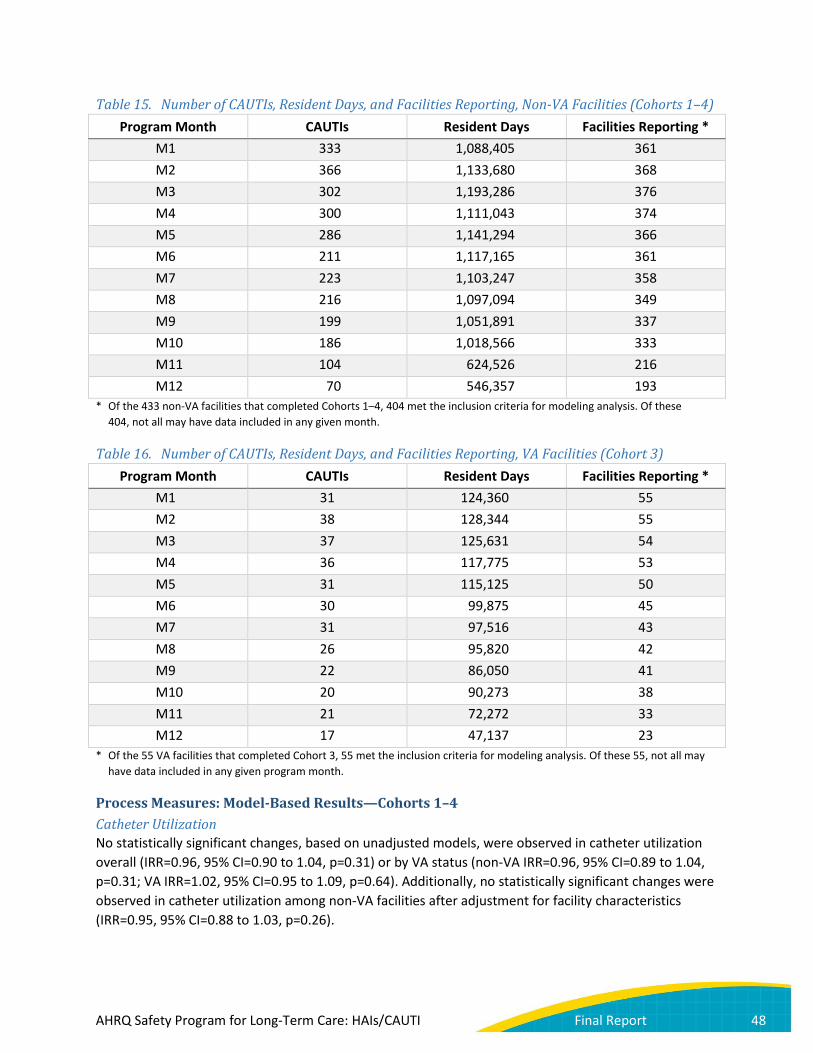
Table 15. Number of CAUTIs, Resident Days, and Facilities Reporting, Non-VA Facilities (Cohorts 1–4) Program Month CAUTIs Resident Days Facilities Reporting *
M1 333 1,088,405 361 M2 366 1,133,680 368 M3 302 1,193,286 376 M4 300 1,111,043 374 M5 286 1,141,294 366 M6 211 1,117,165 361 M7 223 1,103,247 358 M8 216 1,097,094 349 M9 199 1,051,891 337 M10 186 1,018,566 333 M11 104 624,526 216 M12 70 546,357 193
* Of the 433 non-VA facilities that completed Cohorts 1–4, 404 met the inclusion criteria for modeling analysis. Of these 404, not all may have data included in any given month.
Table 16. Number of CAUTIs, Resident Days, and Facilities Reporting, VA Facilities (Cohort 3) Program Month CAUTIs Resident Days Facilities Reporting *
M1 31 124,360 55 M2 38 128,344 55 M3 37 125,631 54 M4 36 117,775 53 M5 31 115,125 50 M6 30 99,875 45 M7 31 97,516 43 M8 26 95,820 42 M9 22 86,050 41 M10 20 90,273 38 M11 21 72,272 33 M12 17 47,137 23
* Of the 55 VA facilities that completed Cohort 3, 55 met the inclusion criteria for modeling analysis. Of these 55, not all may have data included in any given program month.
Process Measures: Model-Based Results—Cohorts 1–4 Catheter Utilization No statistically significant changes, based on unadjusted models, were observed in catheter utilization overall (IRR=0.96, 95% CI=0.90 to 1.04, p=0.31) or by VA status (non-VA IRR=0.96, 95% CI=0.89 to 1.04, p=0.31; VA IRR=1.02, 95% CI=0.95 to 1.09, p=0.64). Additionally, no statistically significant changes were observed in catheter utilization among non-VA facilities after adjustment for facility characteristics (IRR=0.95, 95% CI=0.88 to 1.03, p=0.26).
AHRQ Safety Program for Long-Term Care: HAIs/CAUTI Final Report 48

The raw aggregate catheter utilization by program period is presented graphically in Figure 15; further details are provided in Table 17. Catheter utilization was 5.18 percent at M1 and 5.38 percent at M12. Raw catheter utilization rates stratified by VA status are illustrated in Figure 16; further details are provided in Tables 18 and 19. Among VA facilities in Cohort 3, catheter utilization at M1 and M12 were 11.02 and 11.30 percent, respectively.50
Figure 15. Catheter Utilization, Cohorts 1–4
Cohort 1 M1: May 2014; Cohort 2 M1: November 2014; Cohort 3 M1: June 2015; Cohort 4 M1: September 2015. Data illustrating facilities that met inclusion criteria for modeling analysis.
Source: CDS; resident and catheter days submitted as of July 25, 2016.
50 Tsan L, Langberg R, Davis C, et al. Nursing home-associated infections in the Department of Veterans Affairs community living centers. Am J Infect Control 2010;38:461-6.
5.18% 5.27% 5.16% 5.34% 5.26% 5.08% 5.02% 5.10% 5.06% 5.13% 5.45% 5.38%
0.00%
1.00%
2.00%
3.00%
4.00%
5.00%
6.00%
7.00%
8.00%
9.00%
10.00%
M1 M2 M3 M4 M5 M6 M7 M8 M9 M10 M11 M12
AHRQ Safety Program for Long-Term Care: HAIs/CAUTI Final Report 49
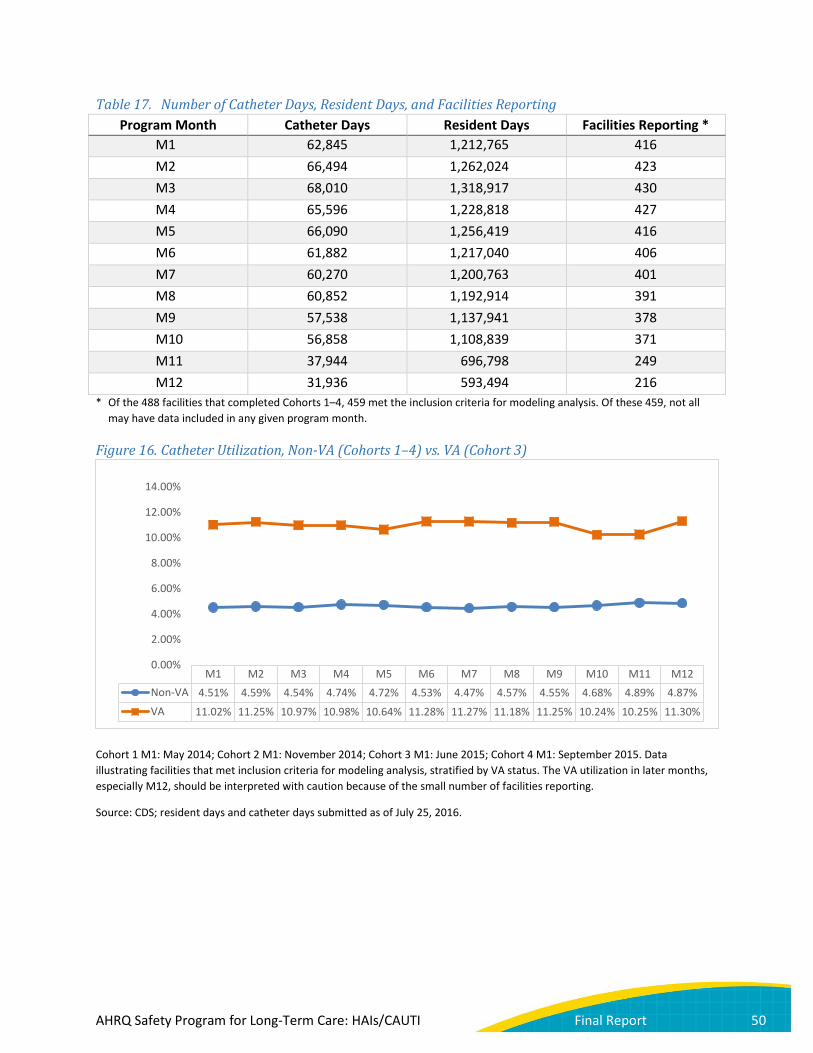
Table 17. Number of Catheter Days, Resident Days, and Facilities Reporting Program Month Catheter Days Resident Days Facilities Reporting *
M1 62,845 1,212,765 416 M2 66,494 1,262,024 423 M3 68,010 1,318,917 430 M4 65,596 1,228,818 427 M5 66,090 1,256,419 416 M6 61,882 1,217,040 406 M7 60,270 1,200,763 401 M8 60,852 1,192,914 391 M9 57,538 1,137,941 378 M10 56,858 1,108,839 371 M11 37,944 696,798 249 M12 31,936 593,494 216
* Of the 488 facilities that completed Cohorts 1–4, 459 met the inclusion criteria for modeling analysis. Of these 459, not all may have data included in any given program month.
Figure 16. Catheter Utilization, Non-VA (Cohorts 1–4) vs. VA (Cohort 3)
Cohort 1 M1: May 2014; Cohort 2 M1: November 2014; Cohort 3 M1: June 2015; Cohort 4 M1: September 2015. Data illustrating facilities that met inclusion criteria for modeling analysis, stratified by VA status. The VA utilization in later months, especially M12, should be interpreted with caution because of the small number of facilities reporting.
Source: CDS; resident days and catheter days submitted as of July 25, 2016.
M1 M2 M3 M4 M5 M6 M7 M8 M9 M10 M11 M12Non-VA 4.51% 4.59% 4.54% 4.74% 4.72% 4.53% 4.47% 4.57% 4.55% 4.68% 4.89% 4.87%VA 11.02% 11.25% 10.97% 10.98% 10.64% 11.28% 11.27% 11.18% 11.25% 10.24% 10.25% 11.30%
0.00%
2.00%
4.00%
6.00%
8.00%
10.00%
12.00%
14.00%
AHRQ Safety Program for Long-Term Care: HAIs/CAUTI Final Report 50

Table 18. Number of Catheter Days, Resident Days, and Facilities Reporting, Non-VA Facilities (Cohorts 1–4)
Program Month Catheter Days Resident Days Facilities Reporting * M1 49,140 1,088,405 361 M2 52,062 1,133,680 368 M3 54,227 1,193,286 376 M4 52,660 1,111,043 374 M5 53,839 1,141,294 366 M6 50,618 1,117,165 361 M7 49,285 1,103,247 358 M8 50,137 1,097,094 349 M9 47,862 1,051,891 337 M10 47,618 1,018,566 333 M11 30,538 624,526 216 M12 26,610 546,357 193
* Of the 433 non-VA facilities that completed Cohorts 1–4, 404 met the inclusion criteria for modeling analysis. Of these 404, not all may have data included in any given month.
Table 19. Number of Catheter Days, Resident Days, and Facilities Reporting, VA Facilities (Cohort 3) Program Month Catheter Days Resident Days Facilities Reporting *
M1 13,705 124,360 55 M2 14,432 128,344 55 M3 13,783 125,631 54 M4 12,936 117,775 53 M5 12,251 115,125 50 M6 11,264 99,875 45 M7 10,985 97,516 43 M8 10,715 95,820 42 M9 9,676 86,050 41 M10 9,240 90,273 38 M11 7,406 72,272 33 M12 5,326 47,137 23
* Of the 55 VA facilities that completed Cohort 3, 55 met the inclusion criteria for modeling analysis. Of these 55, not all may have data included in any given program month.
Urine Culture Collection Rate Urine culture data were not collected during Cohort 1. For the Cohort 2–4 facilities included in the analysis, urine culture collection rates were 3.69 urine cultures per 1,000 resident days at M1 and 3.29 at M12, an overall reduction of 14 percent (Figure 17) (IRR=0.86, 95% CI=0.79 to 0.94, p<0.001). This reduction was more pronounced and statistically significant among the non-VA facilities (IRR=0.85, 95% CI=0.77 to 0.93, p=0.001) compared with the VA facilities (IRR=0.93, 95% CI=0.82 to 1.05, p=0.25). After facility characteristic adjustment, the results in the non-VA facilities held (IRR=0.85, 95% CI=0.77 to
AHRQ Safety Program for Long-Term Care: HAIs/CAUTI Final Report 51

0.94, p=0.001). Among VA facilities in Cohort 3, urine cultures per 1,000 resident days for M1 and M12 were 5.27 and 5.31, respectively.
Figure 17. Urine Culture Collection Rate, Cohorts 2–4
Cohort 2 M1: November 2014; Cohort 3 M1: June 2015; Cohort 4 M1: September 2015. Data illustrating Cohort 2–4 facilities that met inclusion criteria for modeling analysis. Urine culture data were not collected during Cohort 1.
Source: CDS; resident days and urine cultures collected submitted as of July 25, 2016.
Table 20. Number of Urine Cultures, Resident Days, and Facilities Reporting Program Month Urine Cultures Resident Days Facilities Reporting *
M1 3,957 1,071,582 388 M2 4,133 1,119,393 392 M3 4,047 1,134,063 396 M4 4,064 1,098,606 398 M5 4,065 1,142,050 396 M6 3,732 1,069,001 386 M7 3,658 1,087,262 380 M8 3,593 1,045,196 370 M9 3,424 1,026,214 361 M10 3,529 998,550 349 M11 2,113 611,404 232 M12 1,580 479,576 190
* Of the 425 facilities that completed Cohorts 2–4, 405 met the inclusion criteria for modeling analysis for urine cultures collected. Of these 405, not all may have data included in any given program month. Urine culture data were not collected during Cohort 1.
3.69 3.69 3.57 3.70 3.56 3.49 3.36 3.44 3.34 3.53 3.46
3.29
0.00
0.50
1.00
1.50
2.00
2.50
3.00
3.50
4.00
4.50
5.00
M1 M2 M3 M4 M5 M6 M7 M8 M9 M10 M11 M12
AHRQ Safety Program for Long-Term Care: HAIs/CAUTI Final Report 52

The raw Cohort 2–4 aggregate urine culture order rate by program period is presented graphically in Figure 17; further details are provided in Table 20. The raw urine culture order rate stratified by VA status is illustrated in Figure 18; further details are provided in Tables 21 and 22.
Figure 18. Urine Culture Collection Rate, Non-VA (Cohorts 2–4) vs. VA (Cohort 3)
Cohort 2 M1: November 2014; Cohort 3 M1: June 2015; Cohort 4 M1: September 2015. Data illustrating Cohort 2–4 facilities that met inclusion criteria for modeling analysis, stratified by VA status. Urine culture data were not collected during Cohort 1. The VA rate in later months, especially M12, should be interpreted with caution because of the small number of facilities reporting.
Source: CDS; resident days and urine cultures collected submitted as of July 25, 2016.
Table 21. Number of Urine Cultures, Resident Days, and Facilities Reporting, Non-VA Facilities (Cohorts 2–4)
Program Month Urine Cultures Resident Days Facilities Reporting * M1 3,302 947,222 333 M2 3,483 994,550 339 M3 3,454 1,010,825 343 M4 3,439 980,125 345 M5 3,445 1,025,941 345 M6 3,269 971,371 342 M7 3,166 989,746 337 M8 3,148 950,495 329 M9 2,968 941,270 321 M10 3,061 908,821 311 M11 1,715 537,194 198 M12 1,336 433,667 168
* Of the 370 non-VA facilities that completed Cohorts 2–4, 350 met the inclusion criteria for modeling analysis. Of these 350, not all may have data included in any given month.
M1 M2 M3 M4 M5 M6 M7 M8 M9 M10 M11 M12Non-VA 3.49 3.50 3.42 3.51 3.36 3.37 3.20 3.31 3.15 3.37 3.19 3.08VA 5.27 5.21 4.81 5.28 5.34 4.74 5.05 4.7 5.37 5.22 5.36 5.31
0.00
1.00
2.00
3.00
4.00
5.00
6.00
AHRQ Safety Program for Long-Term Care: HAIs/CAUTI Final Report 53

Table 22. Number of Urine Cultures, Resident Days, and Facilities Reporting, VA Facilities (Cohort 3) Program Month Urine Cultures Resident Days Facilities Reporting *
M1 655 124,360 55 M2 650 124,843 53 M3 593 123,238 53 M4 625 118,481 53 M5 620 116,109 51 M6 463 97,630 44 M7 492 97,516 43 M8 445 94,701 41 M9 456 84,944 40 M10 468 89,729 38 M11 398 74,210 34 M12 244 45,909 22
* Of the 55 VA facilities that completed Cohort 3, 55 met the inclusion criteria for modeling analysis. Of these 55, not all may have data included in any given program month.
Sensitivity Analyses Additional analyses were conducted to determine if attrition of facilities reporting over the course of the program period affected the outcome rates.
Of the 459 facilities in the primary analysis, 258 (56%) submitted all expected data for each period of the program. Among these 258 facilities, the NHSN CAUTI rate was 5.38 CAUTIs per 1,000 catheter days at M1 and 2.55 at M12, a decrease of 45 percent (IRR=0.55, 95% CI=0.43 to 0.72, p<0.001). At least 70 percent of expected data was submitted by 384 facilities (84%), and among these facilities the M1 and M12 NHSN CAUTI rates were 5.77 and 2.70 CAUTIs per 1,000 catheter days, respectively, an overall decrease of 49 percent (IRR=0.51, 95% CI=0.42 to 0.63, p<0.001).
Of the 368 non-VA facilities with data for all covariates included in the adjusted analysis, 228 (62%) submitted all expected data for each period of the program. Among these 228 facilities, the NHSN CAUTI rate was 6.09 CAUTIs per 1,000 catheter days at M1 and 2.52 at M12, a decrease of 50 percent (IRR=0.50, 95% CI=0.38 to 0.66, p<0.001). At least 70 percent of expected data was submitted by 318 facilities (86%), and among these facilities the M1 and M12 NHSN CAUTI rates were 6.72 and 2.59 CAUTIs per 1,000 catheter days, respectively, an overall decrease of 55 percent (IRR=0.45, 95% CI=0.35 to 0.58, p<0.001).
These results support that attrition of data submission among a subset of long-term care facilities throughout the program period was not responsible for the rate reductions observed.
Knowledge Questionnaire Knowledge Questionnaire Submission At least 10 staff members from each facility were encouraged to complete the knowledge questionnaire at the baseline, midpoint, and final time points (see Project Measures for details). Cohort 1-4 submission windows are shown in Table 23, and Tables 24 and 25 summarize submission rates by cohort for each
AHRQ Safety Program for Long-Term Care: HAIs/CAUTI Final Report 54
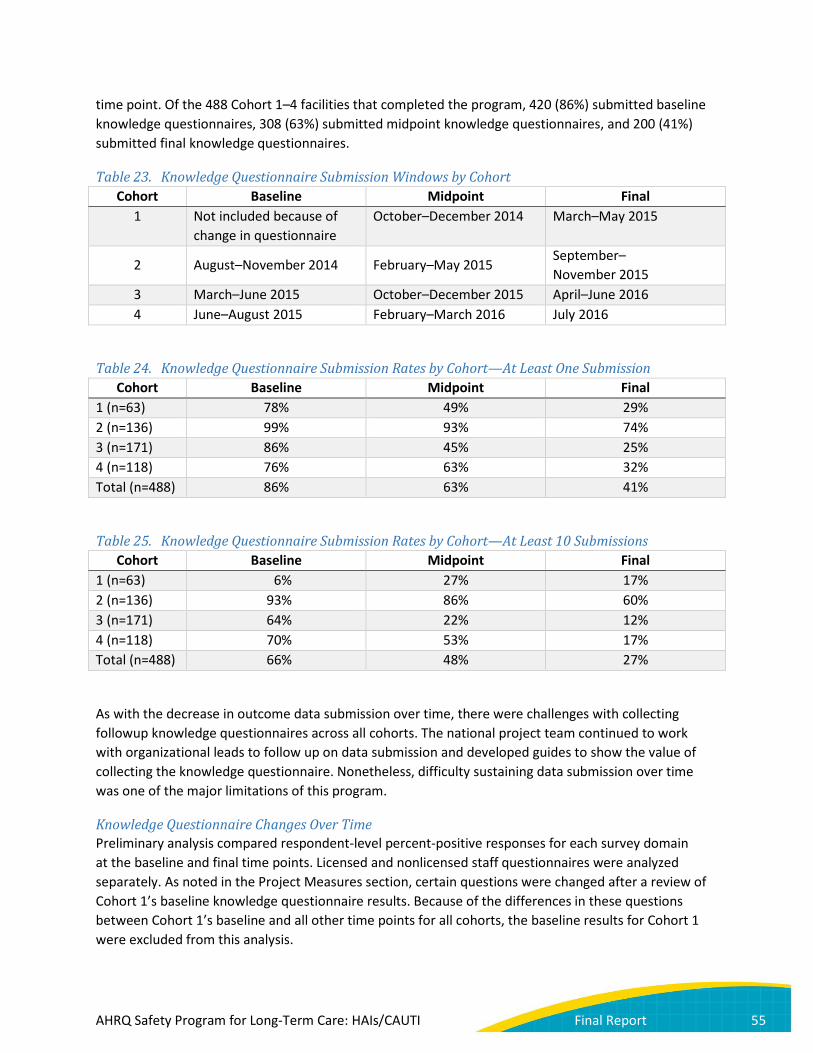
time point. Of the 488 Cohort 1–4 facilities that completed the program, 420 (86%) submitted baseline knowledge questionnaires, 308 (63%) submitted midpoint knowledge questionnaires, and 200 (41%) submitted final knowledge questionnaires.
Table 23. Knowledge Questionnaire Submission Windows by Cohort Cohort Baseline Midpoint Final
1 Not included because of change in questionnaire
October–December 2014 March–May 2015
2 August–November 2014 February–May 2015 September– November 2015
3 March–June 2015 October–December 2015 April–June 2016 4 June–August 2015 February–March 2016 July 2016
Table 24. Knowledge Questionnaire Submission Rates by Cohort—At Least One Submission Cohort Baseline Midpoint Final
1 (n=63) 78% 49% 29% 2 (n=136) 99% 93% 74% 3 (n=171) 86% 45% 25% 4 (n=118) 76% 63% 32% Total (n=488) 86% 63% 41%
Table 25. Knowledge Questionnaire Submission Rates by Cohort—At Least 10 Submissions Cohort Baseline Midpoint Final
1 (n=63) 6% 27% 17% 2 (n=136) 93% 86% 60% 3 (n=171) 64% 22% 12% 4 (n=118) 70% 53% 17% Total (n=488) 66% 48% 27%
As with the decrease in outcome data submission over time, there were challenges with collecting followup knowledge questionnaires across all cohorts. The national project team continued to work with organizational leads to follow up on data submission and developed guides to show the value of collecting the knowledge questionnaire. Nonetheless, difficulty sustaining data submission over time was one of the major limitations of this program.
Knowledge Questionnaire Changes Over Time Preliminary analysis compared respondent-level percent-positive responses for each survey domain at the baseline and final time points. Licensed and nonlicensed staff questionnaires were analyzed separately. As noted in the Project Measures section, certain questions were changed after a review of Cohort 1’s baseline knowledge questionnaire results. Because of the differences in these questions between Cohort 1’s baseline and all other time points for all cohorts, the baseline results for Cohort 1 were excluded from this analysis.
AHRQ Safety Program for Long-Term Care: HAIs/CAUTI Final Report 55
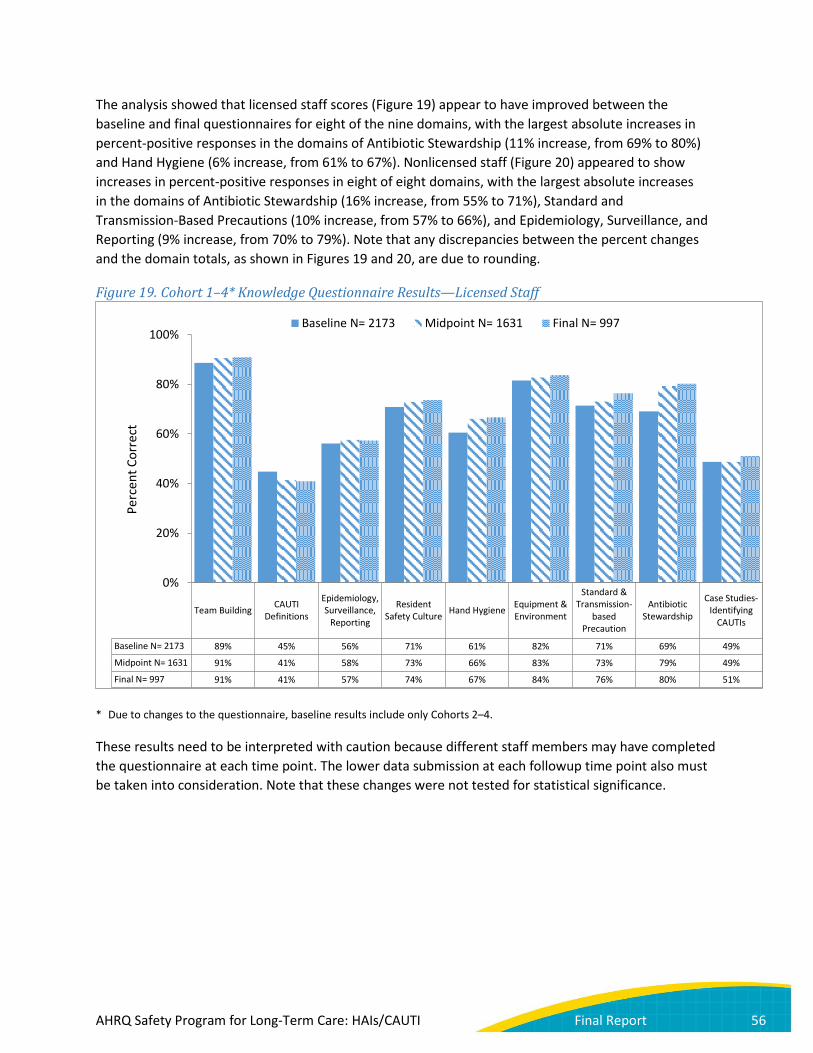
The analysis showed that licensed staff scores (Figure 19) appear to have improved between the baseline and final questionnaires for eight of the nine domains, with the largest absolute increases in percent-positive responses in the domains of Antibiotic Stewardship (11% increase, from 69% to 80%) and Hand Hygiene (6% increase, from 61% to 67%). Nonlicensed staff (Figure 20) appeared to show increases in percent-positive responses in eight of eight domains, with the largest absolute increases in the domains of Antibiotic Stewardship (16% increase, from 55% to 71%), Standard and Transmission-Based Precautions (10% increase, from 57% to 66%), and Epidemiology, Surveillance, and Reporting (9% increase, from 70% to 79%). Note that any discrepancies between the percent changes and the domain totals, as shown in Figures 19 and 20, are due to rounding.
Figure 19. Cohort 1–4* Knowledge Questionnaire Results—Licensed Staff
* Due to changes to the questionnaire, baseline results include only Cohorts 2–4.
These results need to be interpreted with caution because different staff members may have completed the questionnaire at each time point. The lower data submission at each followup time point also must be taken into consideration. Note that these changes were not tested for statistical significance.
Team Building CAUTIDefinitions
Epidemiology,Surveillance,
Reporting
ResidentSafety Culture Hand Hygiene Equipment &
Environment
Standard &Transmission-
basedPrecaution
AntibioticStewardship
Case Studies-Identifying
CAUTIs
Baseline N= 2173 89% 45% 56% 71% 61% 82% 71% 69% 49%
Midpoint N= 1631 91% 41% 58% 73% 66% 83% 73% 79% 49%
Final N= 997 91% 41% 57% 74% 67% 84% 76% 80% 51%
0%
20%
40%
60%
80%
100%
Perc
ent C
orre
ct
Baseline N= 2173 Midpoint N= 1631 Final N= 997
AHRQ Safety Program for Long-Term Care: HAIs/CAUTI Final Report 56
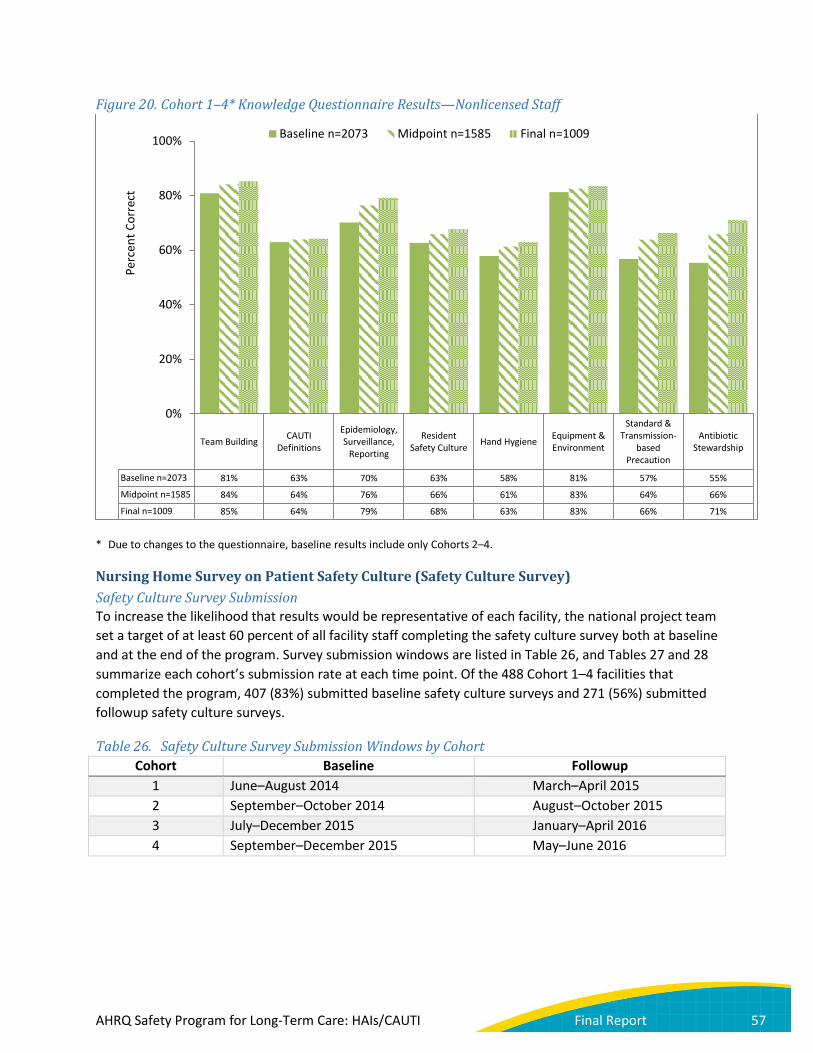
Figure 20. Cohort 1–4* Knowledge Questionnaire Results—Nonlicensed Staff
* Due to changes to the questionnaire, baseline results include only Cohorts 2–4.
Nursing Home Survey on Patient Safety Culture (Safety Culture Survey) Safety Culture Survey Submission To increase the likelihood that results would be representative of each facility, the national project team set a target of at least 60 percent of all facility staff completing the safety culture survey both at baseline and at the end of the program. Survey submission windows are listed in Table 26, and Tables 27 and 28 summarize each cohort’s submission rate at each time point. Of the 488 Cohort 1–4 facilities that completed the program, 407 (83%) submitted baseline safety culture surveys and 271 (56%) submitted followup safety culture surveys.
Table 26. Safety Culture Survey Submission Windows by Cohort Cohort Baseline Followup
1 June–August 2014 March–April 2015 2 September–October 2014 August–October 2015 3 July–December 2015 January–April 2016 4 September–December 2015 May–June 2016
Team Building CAUTIDefinitions
Epidemiology,Surveillance,
Reporting
ResidentSafety Culture Hand Hygiene Equipment &
Environment
Standard &Transmission-
basedPrecaution
AntibioticStewardship
Baseline n=2073 81% 63% 70% 63% 58% 81% 57% 55%
Midpoint n=1585 84% 64% 76% 66% 61% 83% 64% 66%
Final n=1009 85% 64% 79% 68% 63% 83% 66% 71%
0%
20%
40%
60%
80%
100%Pe
rcen
t Cor
rect
Baseline n=2073 Midpoint n=1585 Final n=1009
AHRQ Safety Program for Long-Term Care: HAIs/CAUTI Final Report 57

Table 27. Safety Culture Survey Submission Rates—Any Staff Submitting Cohort Baseline Followup
1 (n=63) 81% 51% 2 (n=136) 97% 80% 3 (n=171) 80% 43% 4 (n=118) 74% 47% Total (n=488) 83% 56%
Table 28. Safety Culture Survey Submission Rates—At Least 60% of Staff Submitting
Cohort Baseline Followup 1 (n=63) 40% 25% 2 (n=136) 79% 53% 3 (n=171) 28% 4% 4 (n=118) 36% 20% Total (n=488) 46% 24%
Safety Culture Survey Pre-/Post-Crude Results A total of 407 active Cohort 1–4 facilities (83%) submitted safety culture surveys at baseline, while 271 facilities (56%) submitted followup surveys. Preliminary analysis, incorporating all baseline (n=26,469) and followup (n=14,879) responses from these facilities, is visible in Figure 21. This analysis compared the respondent-level percent-positive responses for each of the 12 domains at baseline and followup. Eight of the twelve domains saw increases in aggregate absolute percent-positive responses over time. The greatest absolute increases were observed in the domains of Management Support for Resident Safety (6% increase, from 69% to 74%), Communication Openness (5% increase, from 54% to 59%), and Teamwork (4% increase, from 65% to 70%). Overall positive responses decreased in the domain of Organizational Learning (−1%, from 71% to 70%). Note that any discrepancies between the percent changes and the domain totals, as shown in Figure 21, are due to rounding.
These results need to be interpreted with caution because of the lower rate of data submission at the followup time point. Note also that these changes were not tested for statistical significance. Additional analyses assessing statistically significant changes in responses to the safety culture survey are reported below.
AHRQ Safety Program for Long-Term Care: HAIs/CAUTI Final Report 58

Figure 21. Safety Culture Survey Results—Cohorts 1–4 Aggregate
N’s represent number of facility staff who completed the safety culture survey. 407 facilities submitted at least one safety culture survey at baseline, while 271 facilities submitted at the end of the project. Note that any discrepancies between this figure and the explanation above are due to rounding.
Safety Culture Survey Pre-/Post-Results Excluding VA facilities, 202 facilities in Cohorts 1–4 had at least five safety culture surveys submitted at both the baseline and followup data collection points. Relative to non-VA sites that had safety culture surveys only at baseline for five or more respondents (n=171), the facilities included in this analysis had significantly higher percent-positive responses at baseline for nine of the 12 safety culture domains.
Changes in safety culture were examined by comparing the facility-level percent-positive responses for each of the 12 domains at baseline and followup. Figure 22 presents the aggregate responses by domain for each time point. Six domains saw increases in aggregate percent-positive responses from baseline to followup. However, only the increase in Management Support for Resident Safety was significant (absolute increase 3.8%; t=−2.40, p=0.02). The remaining six domains saw small, insignificant declines in facility-level percent-positive responses between the baseline and followup surveys.
86%
85%
80%
71%
69%
71%
64%
65%
65%
54%
52%
51%
86%
85%
82%
70%
74%
71%
64%
70%
68%
59%
54%
54%
1. Overall Perceptions of Resident Safety
2. Feedback & Communication About Incidents
3. Supervisor Expectations & Actions Promoting…
4. Organizational Learning
5. Management Support for Resident Safety
6. Training & Skills
7. Compliance with Procedures
8. Teamwork
9. Handoffs
10. Communication Openness
11. Nonpunitive Response to Mistakes
12. Staffing
Baseline (N = 26469) Final (N = 14879)
AHRQ Safety Program for Long-Term Care: HAIs/CAUTI Final Report 59
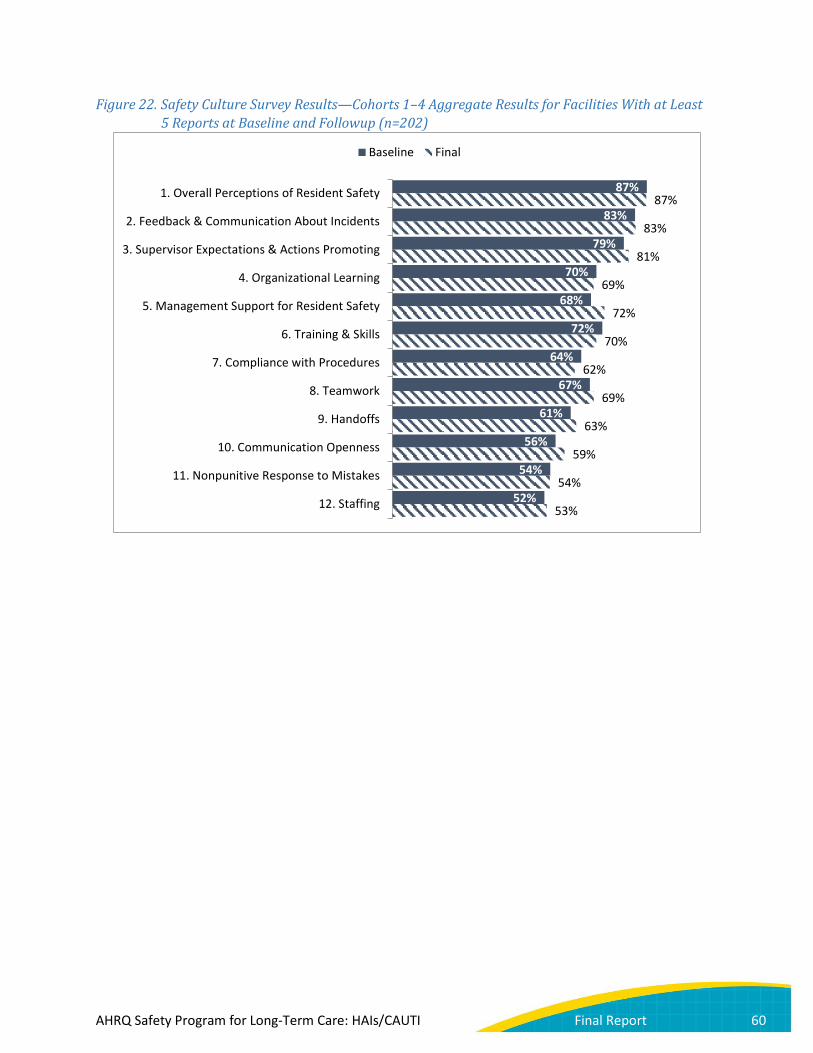
Figure 22. Safety Culture Survey Results—Cohorts 1–4 Aggregate Results for Facilities With at Least 5 Reports at Baseline and Followup (n=202)
87%
83%
79%
70%
68%
72%
64%
67%
61%
56%
54%
52%
87%
83%
81%
69%
72%
70%
62%
69%
63%
59%
54%
53%
1. Overall Perceptions of Resident Safety
2. Feedback & Communication About Incidents
3. Supervisor Expectations & Actions Promoting
4. Organizational Learning
5. Management Support for Resident Safety
6. Training & Skills
7. Compliance with Procedures
8. Teamwork
9. Handoffs
10. Communication Openness
11. Nonpunitive Response to Mistakes
12. Staffing
Baseline Final
AHRQ Safety Program for Long-Term Care: HAIs/CAUTI Final Report 60
Discussion In this large-scale national collaborative conducted in the long-term care (LTC) setting, the national project team recruited 652 facilities to participate over the 3-year contract period, and 505 LTC facilities completed the program. Of the facilities that completed this initiative, there were significant reductions in catheter-associated urinary tract infection (CAUTI) rates, both National Healthcare Safety Network (NHSN) and population, as well as decreases in the number of urine cultures collected.
As shown in Figure 10, data submission decreased over time for all cohorts. To assess the possible impact of attrition in data submission on overall outcome trends, the national project team conducted a sensitivity analysis comparing the NHSN CAUTI rate of facilities that reported at least 70 percent of expected data (i.e., at least eight time points for Cohorts 1–3 and at least six time points for Cohort 4) with all active facilities included in the main analysis. The results led the national project team to conclude that attrition of data submission was likely not responsible for the decreases in overall CAUTI rates. The unadjusted incidence rate ratios (IRRs) are 0.51 (95% CI=0.42 to 0.63) for the group with at least 70 percent of data available and 0.53 (95% CI=0.43 to 0.65) for the full group.
Catheter utilization did not decrease significantly during the collaborative, perhaps in part because utilization rates were low at the start. With catheter use being a Centers for Medicare & Medicaid Services (CMS) publicly reported measure since 1990,51,52 LTC facilities have already developed a culture of prompt removal of catheters once clinical need is resolved.53 Indeed, an assessment of CAUTI prevention practices at the start of the collaborative showed that a high percentage of nursing homes required documentation of indications as well as a physician order.54 As a result, unnecessary urinary catheters were generally removed within 48 hours of nursing home admission. Moreover, catheters are seen by nursing providers as an impediment to functional independence of older nursing home residents.55
51 Centers for Medicare & Medicaid Services. Nursing Home Compare. https://data.medicare.gov/data/nursing-home-compare. Accessed July 5, 2016.
52 Centers for Medicare & Medicaid Services. Five-star quality rating system. 2015. Available at: https://www.cms.gov/medicare/provider-enrollment-and-certification/certificationandcomplianc/fsqrs.html. Accessed July 5, 2016.
53 Hawes C, Mor V, Phillips CD, et al. The OBRA-87 nursing home regulations and implementation of the Resident Assessment Instrument: effects on process quality. J Am Geriatr Soc 1997;45:977-85.
54 Mody L, Greene M, Krein S, et al. Influence of ownership status on the infection prevention program resources between for-profit and not-for-profit nursing homes: a national study. J Am Geriatr Soc 2015;63:S9-S10.
55 Saint S, Lipsky BA, Goold SD. Indwelling urinary catheters: a one-point restraint? Ann Intern Med 2002;137:125-7.
AHRQ Safety Program for Long-Term Care: HAIs/CAUTI Final Report 61

Qualitative interviews with participating facility team leads confirmed a preexisting culture of catheter avoidance and removal. Many facility leaders reported having low rates of catheters at the start of the program and catheter reduction programs already in place. However, interviewees also spoke about other policies implemented as a result of the program that may have positively impacted infection rates: increased hand hygiene, reducing inappropriate urine cultures, facilitywide education about CAUTI, walking rounds, better monitoring, and random auditing to ensure adherence to best practices for urinary catheter insertion and maintenance. Data from the interviews also indicated potential improvement in infection surveillance, as team leads spoke about how organizational leads, educational modules, and other resources helped staff learn standard definitions and best practices. Additionally, interviewees described cultural shifts as a result of the program, such as nursing staff’s feeling more empowered to speak with physicians and senior leadership about not requesting unneeded urine cultures.
The CAUTI reductions seen in this program are likely the result of several factors. First, the collaborative emphasized foundational infection prevention strategies as well as strategies specific to catheter use. In particular, with low rates of catheter utilization, the intervention focused primarily on evidence-based strategies for catheter maintenance and appropriate diagnostic testing as shown by reductions in urine culture order rates. Second, the educational sessions were informed by knowledge and practice gaps identified by prior literature and the baseline knowledge questionnaire. The educational sessions followed a train-the-trainer model, which allowed the team leads to share with frontline personnel the educational content along with additional tools, including infographics and pocket cards. Third, socioadaptive elements modified from successful large-scale Comprehensive Unit-based Safety Program (CUSP) projects in acute care were an explicit and unique part of the intervention to facilitate adoption of the technical elements. Fourth, facility teams received sustained external support through the program’s network of organizational leads and coaches, including through coaching calls and learning from teams at other facilities. For example, external support provided by the organizational leads and coaches allowed facilities to understand their infection data in relation to local and national benchmarks and provided targeted feedback to enhance evidence-based practices, making facilities’ surveillance data actionable. These external partners helped to identify opportunities for improvement which then allowed facility teams to lead local efforts.
Insights From Stakeholder Feedback The national project team gathered information about facilities’ challenges, success factors, and responses to program elements through the Cohort 2 practice change assessment, qualitative interviews with Cohorts 2–4, site visits to facilities, and meetings and interviews with various stakeholders. Overall, the following successes and opportunities for improvement for the program emerged:
• Successes o Enhancement of the work that facilities were already doing to reduce CAUTI o Valuable educational materials for staff training o Tips on how to work with and engage residents and families as partners o Help with physician buy-in o Broadened awareness of evidence-based practices o Support for leaders and staff in identifying gaps in knowledge and opportunities
for improvement
AHRQ Safety Program for Long-Term Care: HAIs/CAUTI Final Report 62

• Challenges o Significant burden for small facilities, especially if one person was assigned to complete
all of the program work o Turnover and staff changes, especially turnover in senior leadership
Feedback from facility team leaders, organizational leads, coaches, and national project team members is further explored in the Lessons Learned section, as this feedback provides valuable insights that can be used to enhance future LTC facility resident safety programs.
Lessons Learned: Challenges and Success Factors Lessons Specific to Environment Bringing National Attention to Long-Term Care One intangible yet crucial success of the program was featuring the important work of LTC facilities. Many faculty coaches noted that the program respected the LTC environment by its very nature and demonstrated to LTC facilities that they are as significant as acute care settings when it comes to quality of health care. As one faculty coach commented, “People that can make a difference are finally paying attention to long-term care.” Organizational leads also discussed the value of the program for introducing facilities to quality improvement (QI). Faculty coaches and other national project team members were thankful for the attention the program brought to the field, as well. For example, many were able to connect with other colleagues and clinicians in geriatrics and infectious diseases and were appreciative of how the program highlighted the importance of infection prevention in LTC facilities to their academic communities and physician residents in training.
Importance of Relationships Relationships were extremely important among the organizational leads, the facilities, and the faculty coaches. Having someone at the State or national level to contact when they had issues, or to share successes, was a benefit for some facilities, particularly those without a large corporate support structure. The organizational leads and coaches were highly invested in the success of the LTC facilities, brainstormed how they could help overcome barriers, and provided recommendations on new and innovative ideas to work with the individual facilities. Organizational leads who were interviewed about their experiences described their role as that of intermediary, translator, coach, and creator of a safe space for facility teams to ask questions and receive resources and support. Feedback provided by the facility team leads who were interviewed was unanimous: interviewees described their organizational leads and national project team contacts as proactive, responsive, helpful, and knowledgeable. Specific types of organizational lead support mentioned during interviews included help with data entry and survey submission and one-on-one help overcoming physician resistance by providing resources and education on best practices for CAUTI reduction.
Relationships among the LTC facility team members were also key to program success. During qualitative interviews, facility team leads indicated that strong staff relationships led to more excitement and support among the staff participating in the program, while weak or nonexistent relationships meant that staff would not participate in the same way or would only dedicate the minimum time and energy toward completing the program goals. In the same vein, facility leads who were new in their positions often found it harder to achieve buy-in because of the lack of relationships with the staff. Finally, the relationships among participating facilities were also very beneficial with
AHRQ Safety Program for Long-Term Care: HAIs/CAUTI Final Report 63

respect to teams’ ability to learn from peers in the same cohort. Qualitative interview feedback from team leads indicated that Webinars were appreciated as opportunities to bring many facilities together at once and allowed for the exchange of ideas and experiences. Unfortunately, several organizational leads and faculty coaches also reported that coaching calls were sometimes unsuccessful because facility teams were reluctant to share their challenges in front of a group. In many cases, organizational leads and coaches supplemented group calls with one-on-one coaching.
Limitations of Technology LTC facilities had various challenges to participating in a distance-based QI program, including but not limited to lack of access to computers with internet, firewalls not allowing access to the program Web site, and inability to download files during Webinars. Interviews with facility team leads confirmed that staff at some facilities had a limited ability to fill out surveys electronically and to view Webinars. Several organizational leads and national project team members observed that attending hour-long Webinars is not realistic for most facility staff.
To overcome these challenges, the national project team and organizational leads came up with innovative ways to enable LTC facilities to access the education. Organizational leads downloaded resources and sent them via email to LTC facilities or printed and distributed paper copies. Some organizational leads also supported LTC facilities without internet access for staff by providing paper copies of the surveys and entering the data for the facilities afterward. The national project team made the train-the-trainer materials available for download during Webinars and provided print and electronic materials in binders with flash drives to LTC facilities at the conclusion of the program. Finally, the national project team lengthened the duration of educational Webinars from 45 minutes to 1 hour because of the large volume of questions and discussion that occurred. This change also allowed the national project team to offer 1 full hour of continuing nursing education credit.
Staff Turnover/Shortages Participants voiced issues with high rates of staff turnover throughout the program. During site visits and qualitative interviews, many facility team members spoke about changes in facility administration, leadership, and licensed and nonlicensed staff. Teams reported that these changes hindered dissemination of education and training. Turnover, especially among leadership, also led to challenges with consistency of engagement in the program, consistency of data quality and submission rates, and, at times, a lack of ongoing understanding of program expectations. Organizational leads and faculty coaches reiterated these challenges with communication, expectation-setting, and engagement during interviews and the program recap meeting.
Staff turnover resulted in unique challenges in onboarding new staff and forced the national project team to define exactly what leaders, staff, and teams needed to assume program responsibility after previous staff members left. The content redesign process provided standardized, yet adaptable, educational materials to support LTC facilities—especially those that had high staff turnover. The instructional guide offered suggestions for using the materials, such as incorporating the education into staff orientation and annual competency testing. The national project team also emphasized the importance of team building and identifying backups for team roles to combat challenges with turnover.
AHRQ Safety Program for Long-Term Care: HAIs/CAUTI Final Report 64
Varying Experience With Surveillance, Infection Prevention, and QI Initiatives Unlike most acute care hospitals, many LTC facilities did not have a full-time infection preventionist on staff at baseline or during the initiative.56 The responsibilities of an infection preventionist were more often shared among staff, and a number of facilities shared an infection preventionist who was part of a broader hospital or LTC system. To address gaps in infection prevention knowledge and shared responsibilities, the national project team developed many tools and manuals about data collection and offered one-on-one and group coaching to facilities. In addition, the content was redesigned to include a train-the-trainer component to ensure consistency across learning objectives and materials provided and to support the varying levels of knowledge and expertise of the facility team members conducting the training. Education was customizable and flexible to allow for LTC facilities to focus on gaps identified in the knowledge questionnaire and safety culture survey results. Moreover, each monthly newsletter included a “Making It Work” column that highlighted specific strategies and ideas to implement key components of the content released the month prior. Organizational leads and faculty coaches emphasized the lesson that education must be kept as short, simple, and targeted as possible. Overall, facility team leads interviewed about their experience with the program indicated that their teams found program resources, including educational materials and specific tools (e.g., NHSN definition pocket cards), to be very helpful and informative.
Engaging All Staff A theme that emerged during site visits and interviews with facility team leaders was the importance of involving all levels of staff in improving infection prevention and resident care. Team leads emphasized that all staff at LTC facilities participate in resident care, including certified nursing assistants (CNAs), nurses, physicians, environmental services, physical therapists, laundry, et cetera, and that all need to be educated on best practices for infection prevention. Several stakeholders voiced the difficulty and the importance of involving staff on overnight and weekend shifts. Many teams took a holistic approach, broadening their teams, leveraging internal relationships, and involving CNAs and others in QI meetings. Some suggested that program education was too narrowly geared toward nurses and should have been expanded to include resources for a wider array of staff—a concern that was at least partially addressed by the content redesign. During the program recap meeting in August 2016, national project team members discussed opportunities for CNAs and other frontline staff to be more involved in curriculum development and pilot testing in future initiatives.
56 Mody L, Langa KM, Saint S, et al. Preventing infections in nursing homes: a survey of infection control practices in Southeast Michigan. Am J Infect Control 2005;33:489-492.
AHRQ Safety Program for Long-Term Care: HAIs/CAUTI Final Report 65

Engaging Physicians and Senior Leadership Stakeholders at all levels emphasized the need to engage physicians, as well as strategies to do so. During site visits, several facility teams spoke about activating physician champions to communicate with other physicians about catheter care and antibiotic stewardship, including urologists and others in local acute care facilities. Coaches and organizational leads reported during organizational lead calls and the program recap meeting how they provided literature for facility teams to share with clinicians and coached teams on crafting one-on-one appeals.
Another group critical to program success was facility leadership. In qualitative interviews and during site visits, both organizational leads and facility team leads emphasized that committed leadership support is essential for both initial buy-in and for sustainability of the program goals. The national project team also reflected during the program recap meeting on the value to teams of receiving support from administration, and on the barriers faced by those facilities whose team leaders were not decisionmakers. Faculty coaches described the ideal implementation structure as both bottom-up and top-down.
The national project team addressed both of these important needs by developing tools and resources for organizational leads and facility teams to share with physicians and leaders to encourage their buy-in. Feedback suggested that coaching on physician and leadership engagement was a key benefit of many faculty coach-facility relationships.
Engaging Residents and Families The national project team actively sought and encouraged the involvement of residents and families in the program’s infection prevention efforts. The national project team engaged residents and family members in the review of select educational materials, in the presentation of content during national content Webinars, and in the development of a number of tools and resources designed to address residents’ and families’ perspectives and engagement. During site visits, teams spoke about using program materials to communicate with residents’ families about the program’s aims and to respond to resident or family resistance to best practices in preventing CAUTIs.
The national project team collaborated with the National Consumer Voice for Quality Long-Term Care (NCV) to recruit eight State ombudsmen who helped develop and deliver training programs for local and volunteer ombudsmen in their States. The content for the training programs aligned with the national project’s education and resources. Feedback from ombudsmen and national resident advocates indicated that engaging residents and families was essential to empowering residents to speak up and get involved in their care, and to translating technical infection prevention language into easy-to-understand language for consumers. Local and volunteer ombudsmen who participated in the training program were encouraged to share the information with residents, family members, and staff as appropriate during the ombudsmen’s site visits to LTC facilities. One trainer who helped present to local ombudsmen was quoted as saying:
Seeing recognition in the eyes of volunteers as they realized that CAUTI was about basic resident rights, participation by residents, and dignity issues involving everything they were already doing—that made them realize that this new topic fit right in with their work and gave them confidence about pursuing this issue for residents.
AHRQ Safety Program for Long-Term Care: HAIs/CAUTI Final Report 66
Over 330 local ombudsmen participated in the State-led training programs. Training evaluations showed that over 90 percent of participants agreed that the training increased their knowledge of the signs and symptoms of CAUTI and increased their knowledge of ways to prevent CAUTI. The majority of participants completed pre- and post-training questionnaires on knowledge of infection prevention and CAUTI. Overall, knowledge increased in both areas. Participants in the training programs reported in the evaluations that they would share the knowledge they gained during visits with residents and families and at resident and family council meetings.
Near the close of the contract, NCV invited all State ombudsmen and their staff to attend a national Webinar titled “Engaging Ombudsmen, Residents, and Families as Partners in Preventing Catheter-Associated Urinary Tract Infections (CAUTI).” The purpose of the Webinar was to share the program with ombudsmen nationwide as a way to generate interest in CAUTI prevention. Fifty-one people from 17 States participated in the national Webinar, and two of the eight partner State ombudsmen presented a summary of their experiences with the CAUTI program. Eighty-three percent of attendees indicated that they planned to use the resources discussed on the Webinar, and 75 percent indicated they would like to implement the project in their State.
Lessons Specific to Program Implementation Purpose and Messaging of Program Value Because this program was focused on reducing CAUTI, it presented challenges with recruitment and retention of LTC facilities. For most LTC facilities, CAUTI was not viewed as a pressing issue to address. Despite changing the name of the program to include all healthcare-associated infections (HAIs), discussing the other benefits of participating related to antibiotic stewardship and QI, and having multiple communications with organizational leads and LTC facilities, the national project team found that the main focus on CAUTI affected recruitment of LTC facilities or hindered their engagement in the program.
The national project team attempted to address this barrier by emphasizing that, although much of the evidence-based clinical education focused on CAUTI reduction and catheter stewardship, the socioadaptive elements and general QI concepts could be applied across efforts to reduce any HAI. The national project team focused on the transferability of the knowledge and skills gained through participation and strategies to integrate the program into facilities’ preexisting practices. Qualitative interviews with facility team leads indicated some success in this messaging about the broad applicability of the education. Facilities were able to see how this program, while aimed at reducing CAUTIs, had messaging and education, specifically regarding personal protective equipment and hand hygiene, that could be translated to broader infection prevention efforts. Organizational leads and faculty coaches also reported success in tying this program to antibiotic stewardship, with one organizational lead describing improved antibiotic stewardship as the “low-hanging fruit.”
In addition, it was important for the national project team to understand current requirements of the LTC environment, such as CMS’s Quality Assurance and Performance Improvement programs and differences from acute care hospitals (e.g., NHSN is voluntary for LTC facilities but has been mandated for hospitals), and to provide the LTC facilities with the knowledge, tools, and resources to better sustain their QI gains.
AHRQ Safety Program for Long-Term Care: HAIs/CAUTI Final Report 67

Variations in Surveillance Practices Long-term care facilities had varying degrees of knowledge around surveillance practices, including identifying CAUTIs using the Centers’ for Disease Control and Prevention (CDC’s) NHSN criteria and using standardized processes to submit data, monitor and track infection rates, and utilize the data to drive improvement efforts. According to interviews with facility team leads, the educational modules, program tools, and support from organizational leads helped staff learn to use standard definitions and implement surveillance best practices. Faculty coaches also provided education and guidance on appropriately identifying CAUTIs. The national project team was in constant communication with organizational leads to verify data submitted by their facilities, as potential errors in data submission or inappropriate use of CAUTI definitions could lead to either unusually high rates or large month-to-month rate fluctuations. It was essential to provide continual education and support on understanding and applying standard surveillance measures in LTC facilities to ensure accurate data results.
The Health Research & Educational Trust’s (HRET’s) Comprehensive Data System provided a centralized location for LTC facilities to submit and monitor their surveillance data. By providing this platform and demonstrating the impact that standard surveillance practices can have in reducing HAIs, this initiative gave LTC facilities tools to evaluate outcome rates for future HAI QI initiatives. The national project team encouraged LTC facilities to continue their surveillance practices by enrolling into CDC’s NHSN, as this could also assist with sustainability. The ongoing technical and clinical coaching in applying standard surveillance measures to drive QI efforts, along with a centralized platform to submit and monitor surveillance data, were critical to the successful CAUTI surveillance performed by more than 500 LTC facilities participating in this initiative.
Value of Aligning Project Metrics With Educational Content As described under Project Components, numerous metrics were developed and collected for use in overall program evaluation. Organizational leads, coaches, and facility teams reported that data could be one of the most powerful motivators for change. Teams appreciated seeing clinical changes immediately reflected in their outcome data, and one organizational lead described the data reports as “empowering” to teams. Surveys and assessments could also be powerful motivators when results were used to understand gaps and drive the development of action plans, particularly when facility leadership was involved.
Unfortunately, among all cohorts, followup assessment submission was low and organizational leads reported difficulty in convincing teams of the value of completing assessments at the end of the program. Several facility team leads who were interviewed reported that program assessments were too long and submission was too frequent. To address this, the national project team took several approaches. First, after reviewing results from Cohort 1’s assessments and hearing their feedback, the national project team worked to better align the results from the various data collected with the program’s interventions. The national project team developed and shared feedback reports and discussion guides that helped the LTC facilities identify potential gaps in infection prevention knowledge or practices, develop action plans, and align the program’s educational content and resources to address those gaps. This allowed the LTC facilities to use their data to drive their improvement efforts. Next, HRET worked closely with the organizational leads and faculty coaches to review the data during coaching calls to guide discussions around barriers and best practices with the LTC facilities. Lastly, Webinars after completion of the baseline safety culture survey and near the end of each cohort
AHRQ Safety Program for Long-Term Care: HAIs/CAUTI Final Report 68

highlighted the importance of using the results to show change over time and to drive improvement. HRET also supplied organizational leads with materials on sustainability of change using these results, for use with their facilities at the final learning session.
Ultimately, stakeholders at the program recap meeting suggested that program participants may have been expected to meet too many measurement targets for the program timeframe. One suggestion for future programs included extracting pieces of the Agency for Healthcare Research and Quality Nursing Home Survey on Patient Safety Culture directly related to program content, rather than administering the full survey.
Coaching Experience Across Organizational Leads, Faculty, and HRET Staff Participating LTC facilities were recruited by regional or administrative organizational leads and were assigned coaching faculty and HRET staff members to guide them through the program. Although each of the groups used the same coaching structure, there was unavoidable variation in LTC facility teams’ experiences in the program, due in part to organizational leads, faculty, and HRET staff having different levels of familiarity with the subject matter, coaching, and QI initiatives.
Organizational leads noted that effective relationships with facilities and coaches made a positive impact on the overall program. Organizational leads who had preexisting relationships with their recruited facilities, for example through the nursing home division of their State’s Quality Innovation Network-Quality Improvement Organization (QIN-QIO), reported more success with engagement and compliance. In cases where LTC facilities were part of a corporate system or chain of nursing homes that implemented systemwide mandates, teams may have also been more responsive to their organizational leads and the requirements of the program.
While organizational leads received in-person training prior to starting their cohort, some faculty coaches suggested that more training and onboarding, whether virtually or in-person, may have been beneficial for their role. More robust job descriptions and orientation may have better prepared coaches for their responsibilities, as would shadowing or viewing experienced coaches in action.
Flexible Implementation Model The national project team adapted the implementation model for the program over time to address lessons learned and each cohort’s needs. As needs were identified, the national project team redeveloped materials, education, and processes. For instance, beginning in Cohort 3, educational programming changed from standard educational Webinars to a train-the-trainer model. The new model used a combination of team lead-specific content delivered via a live Webinar and additional content specifically designed to help leaders educate and engage frontline staff in the education. The additional content included an instructional guide, a training video, a slide set with speaker notes, and a quiz or team activity to support the team leads as they taught frontline staff on each topic area. The train-the-trainer model allowed LTC facilities to adapt the materials to meet their unique educational needs. This redesigned approach provided maximum flexibility for facility educators who requested more condensed and customizable materials to teach and engage frontline staff. Qualitative interviews with organizational leads and facility team leads indicated success in facilities using the materials and integrating them into preexisting practices.
AHRQ Safety Program for Long-Term Care: HAIs/CAUTI Final Report 69

The flexible materials also integrated the evidence-based clinical education and the socioadaptive elements. Materials, especially the training videos on personal protective equipment and hand hygiene, reinforced the idea that general education on QI concepts can be used to help staff reduce any HAI. Content was also developed to help frontline staff understand current and future requirements such as Quality Assurance and Performance Improvement.
While the national project team’s flexibility meant that the program was able to meet a range of LTC facility needs, it also had some disadvantages. As much as Cohort 1 was a pilot group, educational materials still had to be created and taught without time to elicit feedback and modify materials before implementation. Faculty coaches also noted the challenges of trying to educate facility staff on interventions while concurrently developing the interventions. Redesigning educational content and processes in response to feedback was time-consuming for the national project team. Changes also meant that the national project team could not truly compare results across all cohorts, and they led to unexpected challenges and revision to developing materials before LTC facility recruitment or while the program was implemented.
In-Person Meetings As this program was implemented on a national scale, the majority of engagement with participants occurred virtually. While travel and time associated with in-person meetings can be expensive, the national project team heard from many LTC facilities, organizational leads, and faculty coaches that some of their most gratifying experiences were during in-person meetings. Connections are more strongly forged face to face than over the phone or via distance-based technology. Sharing of knowledge about best practices and barriers is also more likely to occur in an in-person collaborative setting. When budgets allowed, the national project team implemented in-person learning sessions, site visits, organizational lead trainings, national project team “reboot” meetings, and an in-person program recap meeting to help foster better working relationships and participation in the program. During qualitative interviews, facility team leads reinforced the value of these in-person meetings for creating an environment for open discussion and collaboration. Many team leads said that they would have liked more in-person meetings, although they understood that it was not always feasible.
Project Fatigue Project teams had numerous responsibilities, and, as the program continued over time, data submission and participation in online education declined. The national project team also recognized that there were numerous components for participation that may have been seen as competing priorities to the day-to-day work being done in the facilities. Most team leads interviewed near the end of the program confirmed that project fatigue occurred for multiple reasons, including staff shortages and turnover. Some facilities began to lose dedication to the purpose of the program, and staff willingness to complete multiple surveys and questionnaires declined.
Learning from this, the national project team modified the requirements of the program, became flexible with submission deadlines, and communicated that the work in this program should not be an “add-on,” but should rather be integrated into current processes. The amount of information collected and time needed from participants is something to consider for future initiatives. The beginning and end of this initiative were heavily loaded with program activities, so clearly communicating time commitment, expectations, and the value of having a team to implement this program was vital to
AHRQ Safety Program for Long-Term Care: HAIs/CAUTI Final Report 70
continued engagement over the course of the program. Also, as mentioned previously, it was important to develop and communicate this intervention in a way that allowed participating facilities to easily integrate this work into their existing practices. The national project team wanted LTC facilities to view this program as a way to enhance their QI efforts, not only to reduce CAUTI, but all HAIs, rather than viewing it as additional work that ends once participation in the program concludes.
AHRQ Safety Program for Long-Term Care: HAIs/CAUTI Final Report 71
Sustainability Tools and Resources As mentioned earlier, the Long-Term Care (LTC) Safety Toolkit was developed as part of this program. The entire toolkit was translated into Spanish for use with a wider audience of LTC facility staff.
The national project team provided all educational materials, tools, and resources through Webinars and on the program Web site. However, organizational leads and participants indicated that many facilities had technological barriers to accessing computers or the internet. Some facilities relied on print materials, DVDs, and flash drives to access and share information. To support the legacy of the program, the national project team offered participating facilities a binder of hard-copy materials, including educational bundles from a selection of the content Webinars, brochures and infographics, data collection and surveillance tools, and the LTC Safety Toolkit, along with a flash drive of these materials and accompanying educational videos.
Several enduring electronic resources will also be submitted to the Agency for Healthcare Research and Quality (AHRQ) for posting on the AHRQ Web site.
Manuscripts Members of the national project team have developed several manuscripts, abstracts, and presentations for national conferences based on the overall program. The following manuscripts have been published or are in various stages of development.
Mody L, Meddings J, Edson B, et al. Enhancing Resident Safety by Preventing Healthcare-Associated Infection: A National Initiative To Reduce Catheter-Associated Urinary Tract Infections in Nursing Homes. Clin Infect Dis 2015; 61(1):86-94. This manuscript provides an overview of the program, outlining the strategy of emphasis on professional development in catheter utilization, catheter care and maintenance, and antimicrobial stewardship as well as promoting patient safety culture, team building, and leadership engagement. The program timeline, educational program, and data collection plan is described.
Crnich C, Jump R, Trautner B, et al. Optimizing Antibiotic Stewardship in Nursing Homes: A Narrative Review and Recommendations for Improvement. Drugs Aging 2015; 32:699-716. This review summarizes current research and presents ways in which antibiotic stewardship can be implemented and optimized in the nursing home setting.
Meddings J, Saint S, Krein S, et al. Systematic Review of Interventions To Reduce Catheter-Associated Urinary Tract Infection in Nursing Home Residents. Submitted to the Journal of Hospital Medicine July 2016. This review summarizes current research for urinary tract infection (UTI) and CAUTI prevention that was used to inform the program intervention. While no single intervention was effective in reducing UTIs, several best practices that reduce UTI, CAUTI, and urinary catheter use when implemented as a bundle were identified. These practices include hand hygiene, avoiding placement and prompting catheter removal, aseptic catheter insertion/maintenance, and education. Other strategies studied with success target challenges common for LTC residents, such as prolonged catheter use, hydration needs, incontinence, and preemptive barrier precautions for patients with indwelling devices.
Mody L, Green MT, Saint S, et al. Comparing Catheter-Associated Urinary Tract Infection Prevention Programs Between VA and Non-VA Nursing Homes. Analysis includes data from Cohorts 1–3. Submitted to Infection Control and Hospital Epidemiology August 2016, in revision.
AHRQ Safety Program for Long-Term Care: HAIs/CAUTI Final Report 72
Trautner BW, Greene MT, Krein S, et al. Infection prevention and antimicrobial stewardship knowledge for selected infections among nursing home personnel. Analysis includes data from Cohorts 1–3. Accepted to Infection Control and Hospital Epidemiology September 2016.
Banaszak-Holl J, Reichert H, Greene MT, et al. Safety Culture and CAUTI Prevention in Nursing Homes: Results From a National Safety Program. Analysis includes data from Cohorts 1-2. (in progress).
Bradley S, Schweon S, Mody L, et al. Identifying Safe Practices for Use of the Urinary Leg Bag Drainage System in the Post-Acute and Long-Term Care Setting: An Integrative Review. This integrative review will provide evidence-based guidance for leg bags. (in progress).
Mody L, Greene MT, Meddings J, et al. A National Implementation Project To Prevent Catheter-Associated Urinary Tract Infection in Nursing Home Residents. This will be the main manuscript to describe outcomes of the project for community-based nursing homes across Cohorts 1–4. (in progress).
Smith S, Greene MT, Mody L, et al. Evaluation of the Association Between Nursing Home Survey on Patient Safety (NHSOPS) Measures and Catheter-Associated UTI Outcomes in a National Collaborative of Nursing Homes. This manuscript will use baseline and followup safety culture survey results merged with CAUTI outcome data from non-VA facilities in Cohorts 1–4. Data analysis and manuscript preparation is in progress.
Krein S, Greene MT, Saint S, et al. Main analysis of project outcomes for VA nursing homes. Data analysis and manuscript preparation are in progress.
Recommendations for Continued QI Work In this large-scale quality improvement (QI) initiative in the LTC setting, the national project team was able to recruit 652 facilities, with 505 completing the initiative. This implementation model was able to show a 47-percent reduction in the catheter-associated urinary tract infection (CAUTI) rate per 1,000 catheter days. Furthermore, 75 percent of non-VA facilities reported at least 40 percent reduction in CAUTIs. However, there’s more work in QI efforts to be done in LTC facilities, as this initiative focused primarily on CAUTI reduction, and facilities participating in this initiative are a small sample of the more than 15,000 LTC facilities nationwide.
Given the lessons learned over the past 3 years, the national project team has several recommendations for future directions that will help sustain and spread the work of this program. Any future work in the LTC environment needs to emphasize the importance of forming a team to implement any QI initiative, including backups for each team role. If coaching models are put in place, there should be training and resources available for the coaches to ensure they understand, and are comfortable with, their roles and expectations. It is also important to involve the frontline staff when developing the intervention, as they are the ones providing direct care to residents. Their needs should be addressed when developing any education, tools, and resources, since they will be the main group of staff members applying education learned from any initiative. Similarly, any education should be simple, streamlined, and visually appealing, tightly focused around what staff members need to know to ensure the highest quality of resident care. Additionally, the development, implementation, and evaluation of education, tools, and resources should include residents and family members as key partners in improving quality and resident safety.
Regarding program evaluation, it is essential that any measures being considered be directly related to overall program goals as well as the content provided. It is important to show LTC facilities how the data
AHRQ Safety Program for Long-Term Care: HAIs/CAUTI Final Report 73
they collect aligns with the education and interventions so they can use the data to drive their improvement efforts. One strategy to consider is modifying validated surveys to collect only certain sections that are relevant to specific program interventions. It is also vital that any initiative takes into account the technological needs and limitations of LTC facilities; otherwise, participants will quickly disengage.
Finally, to maintain engagement of LTC facilities, any successful program should demonstrate not only how implementation of the initiative can impact facility star ratings and adherence to Federal regulations but also how it can improve the overall care of residents.
AHRQ Safety Program for Long-Term Care: HAIs/CAUTI Final Report 74
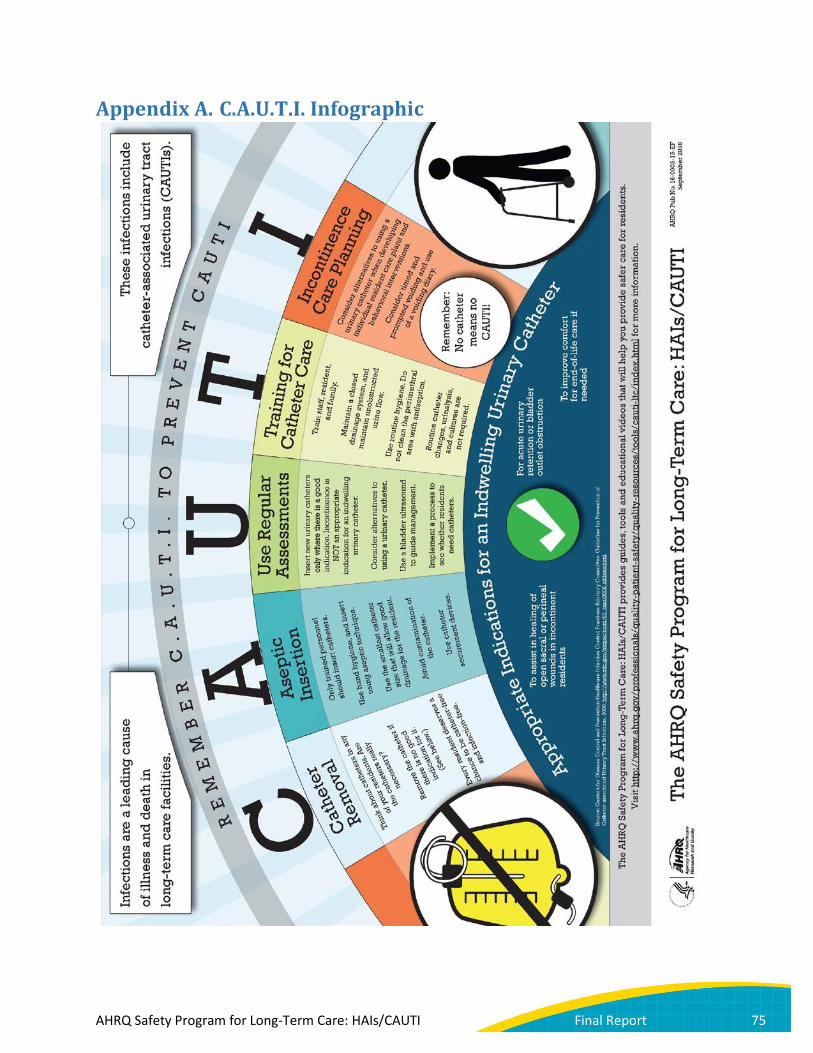
Appendix A. C.A.U.T.I. Infographic
AHRQ Safety Program for Long-Term Care: HAIs/CAUTI Final Report 75
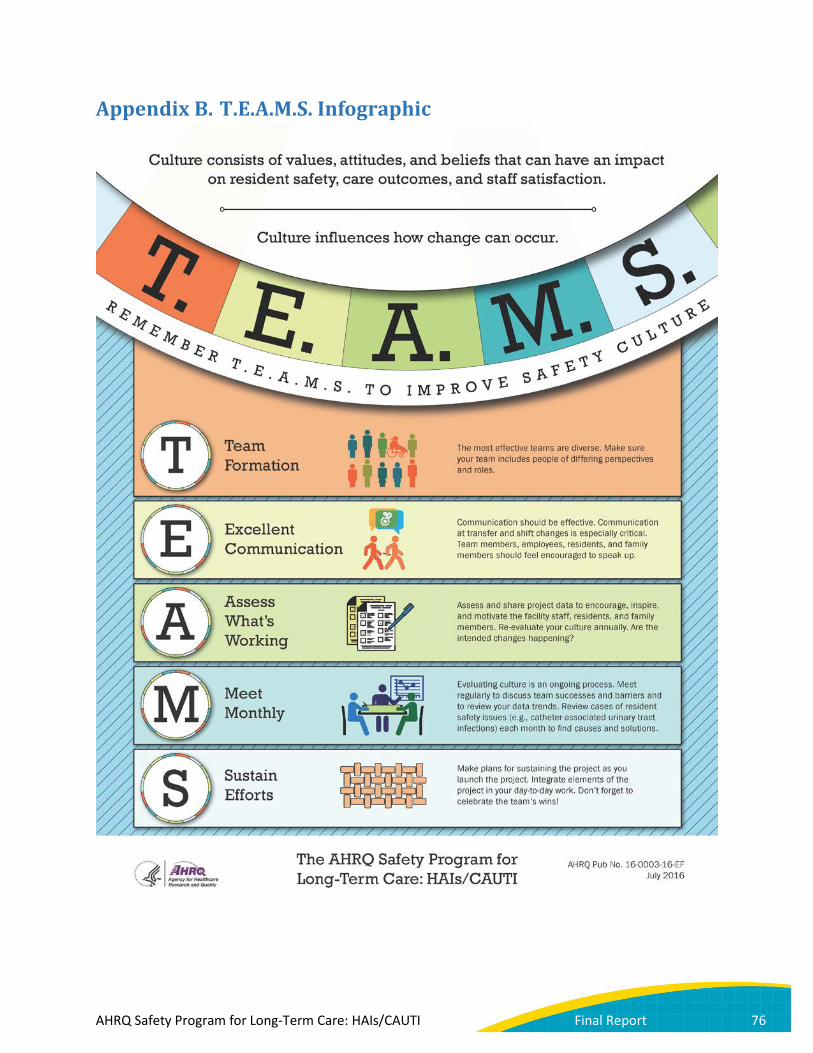
Appendix B. T.E.A.M.S. Infographic
AHRQ Safety Program for Long-Term Care: HAIs/CAUTI Final Report 76

Appendix C. Exclusion Criteria
AHRQ Safety Program for Long-Term Care: HAIs/CAUTI Final Report 77
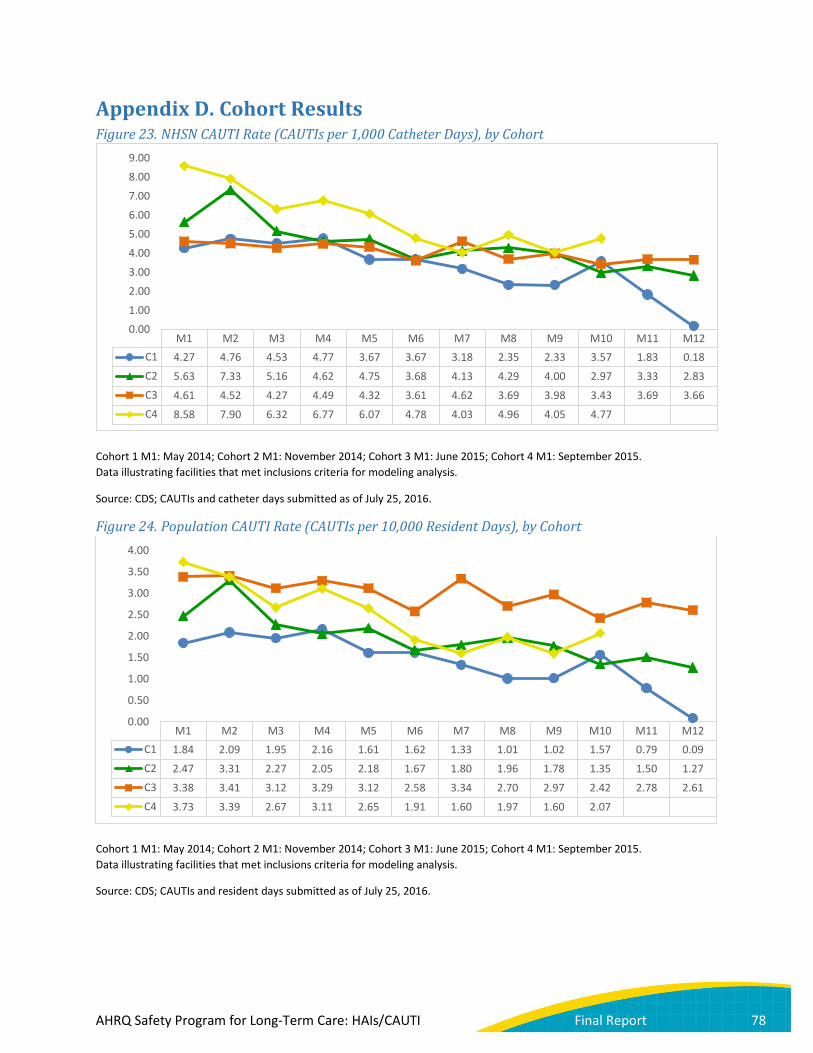
Appendix D. Cohort Results Figure 23. NHSN CAUTI Rate (CAUTIs per 1,000 Catheter Days), by Cohort
Cohort 1 M1: May 2014; Cohort 2 M1: November 2014; Cohort 3 M1: June 2015; Cohort 4 M1: September 2015. Data illustrating facilities that met inclusions criteria for modeling analysis.
Source: CDS; CAUTIs and catheter days submitted as of July 25, 2016.
Figure 24. Population CAUTI Rate (CAUTIs per 10,000 Resident Days), by Cohort
Cohort 1 M1: May 2014; Cohort 2 M1: November 2014; Cohort 3 M1: June 2015; Cohort 4 M1: September 2015. Data illustrating facilities that met inclusions criteria for modeling analysis.
Source: CDS; CAUTIs and resident days submitted as of July 25, 2016.
M1 M2 M3 M4 M5 M6 M7 M8 M9 M10 M11 M12C1 4.27 4.76 4.53 4.77 3.67 3.67 3.18 2.35 2.33 3.57 1.83 0.18C2 5.63 7.33 5.16 4.62 4.75 3.68 4.13 4.29 4.00 2.97 3.33 2.83C3 4.61 4.52 4.27 4.49 4.32 3.61 4.62 3.69 3.98 3.43 3.69 3.66C4 8.58 7.90 6.32 6.77 6.07 4.78 4.03 4.96 4.05 4.77
0.00
1.00
2.00
3.00
4.00
5.00
6.00
7.00
8.00
9.00
M1 M2 M3 M4 M5 M6 M7 M8 M9 M10 M11 M12C1 1.84 2.09 1.95 2.16 1.61 1.62 1.33 1.01 1.02 1.57 0.79 0.09C2 2.47 3.31 2.27 2.05 2.18 1.67 1.80 1.96 1.78 1.35 1.50 1.27C3 3.38 3.41 3.12 3.29 3.12 2.58 3.34 2.70 2.97 2.42 2.78 2.61C4 3.73 3.39 2.67 3.11 2.65 1.91 1.60 1.97 1.60 2.07
0.00
0.50
1.00
1.50
2.00
2.50
3.00
3.50
4.00
AHRQ Safety Program for Long-Term Care: HAIs/CAUTI Final Report 78

Figure 25. Catheter Utilization, by Cohort
Cohort 1 M1: May 2014; Cohort 2 M1: November 2014; Cohort 3 M1: June 2015; Cohort 4 M1: September 2015. Data illustrating facilities that met inclusions criteria for modeling analysis. As discussed above, higher catheter utilization in Cohort 3 is driven by the higher utilization in the 55 included VA facilities, which make up 40 percent of Cohort 3.
Source: CDS; catheter days and resident days submitted as of July 25, 2016.
Figure 26. Urine Culture Collection Rate, by Cohort
Cohort 1 M1: May 2014; Cohort 2 M1: November 2014; Cohort 3 M1: June 2015; Cohort 4 M1: September 2015. Data illustrating facilities that met inclusions criteria for modeling analysis. As discussed above, the higher urine culture collection rate in Cohort 3 is driven by the higher urine culture collection rate among the 55 included VA facilities, which make up 40 percent of Cohort 3.
Source: CDS; urine culture orders and resident days submitted as of July 25, 2016.
M1 M2 M3 M4 M5 M6 M7 M8 M9 M10 M11 M12C1 4.30% 4.39% 4.31% 4.53% 4.38% 4.42% 4.19% 4.30% 4.35% 4.39% 4.28% 4.78%C2 4.39% 4.52% 4.40% 4.45% 4.60% 4.54% 4.36% 4.58% 4.44% 4.54% 4.52% 4.49%C3 7.33% 7.54% 7.29% 7.33% 7.21% 7.15% 7.23% 7.32% 7.48% 7.06% 7.54% 7.12%C4 4.34% 4.28% 4.22% 4.59% 4.36% 4.00% 3.97% 3.98% 3.94% 4.35%
0.00%
1.00%
2.00%
3.00%
4.00%
5.00%
6.00%
7.00%
8.00%
M1 M2 M3 M4 M5 M6 M7 M8 M9 M10 M11 M12C2 3.01 3.16 3.37 3.40 3.28 3.36 3.10 3.43 3.32 3.36 3.05 2.79C3 4.46 4.39 4.01 4.34 4.16 3.91 4.01 3.99 4.11 3.99 4.08 4.09C4 3.69 3.57 3.30 3.33 3.24 3.20 3.01 2.90 2.65 3.32
0.00
0.50
1.00
1.50
2.00
2.50
3.00
3.50
4.00
4.50
5.00
AHRQ Safety Program for Long-Term Care: HAIs/CAUTI Final Report 79

Appendix E. Cohort 5 Results Cohort 5 was excluded from the main analysis because of differences in the implementation model and a compressed intervention period. Cohort 5 crude outcome and process data are illustrated in Figures 27–30. Note: M8 is not shown because of a dropoff in data submission.
Figure 27. NHSN CAUTI Rate (CAUTIs per 1,000 Catheter Days), Cohort 5
Cohort 5 M1: November 2015. Data illustrating facilities that met inclusion criteria for modeling analysis. Note: M8 is not shown because of a dropoff in data submission.
Source: CDS; CAUTIs and catheter days submitted as of July 25, 2016.
7.63
9.98
6.62 6.61 7.04
5.68 5.78
0.00
2.00
4.00
6.00
8.00
10.00
12.00
M1 (n=14) M2 (n=14) M3 (n=14) M4 (n=14) M5 (n=15) M6 (n=14) M7 (n=14)
AHRQ Safety Program for Long-Term Care: HAIs/CAUTI Final Report 80
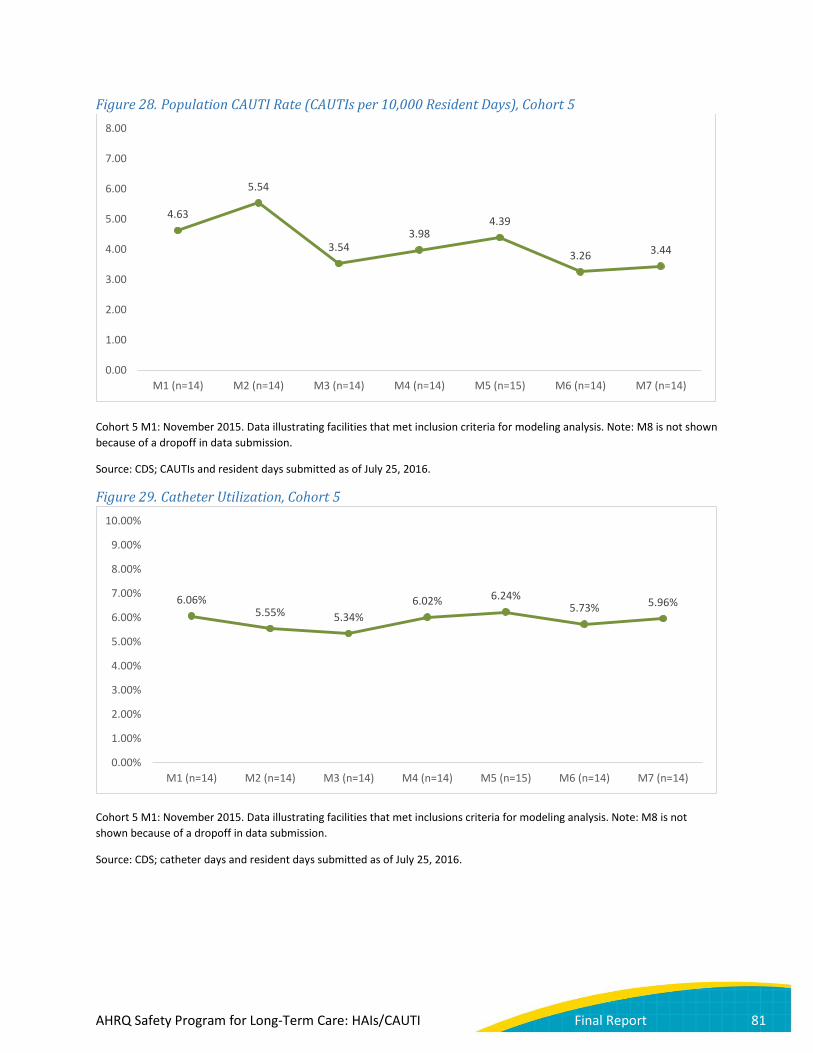
Figure 28. Population CAUTI Rate (CAUTIs per 10,000 Resident Days), Cohort 5
Cohort 5 M1: November 2015. Data illustrating facilities that met inclusion criteria for modeling analysis. Note: M8 is not shown because of a dropoff in data submission.
Source: CDS; CAUTIs and resident days submitted as of July 25, 2016.
Figure 29. Catheter Utilization, Cohort 5
Cohort 5 M1: November 2015. Data illustrating facilities that met inclusions criteria for modeling analysis. Note: M8 is not shown because of a dropoff in data submission.
Source: CDS; catheter days and resident days submitted as of July 25, 2016.
4.63
5.54
3.54 3.98
4.39
3.26 3.44
0.00
1.00
2.00
3.00
4.00
5.00
6.00
7.00
8.00
M1 (n=14) M2 (n=14) M3 (n=14) M4 (n=14) M5 (n=15) M6 (n=14) M7 (n=14)
6.06% 5.55% 5.34%
6.02% 6.24% 5.73% 5.96%
0.00%
1.00%
2.00%
3.00%
4.00%
5.00%
6.00%
7.00%
8.00%
9.00%
10.00%
M1 (n=14) M2 (n=14) M3 (n=14) M4 (n=14) M5 (n=15) M6 (n=14) M7 (n=14)
AHRQ Safety Program for Long-Term Care: HAIs/CAUTI Final Report 81
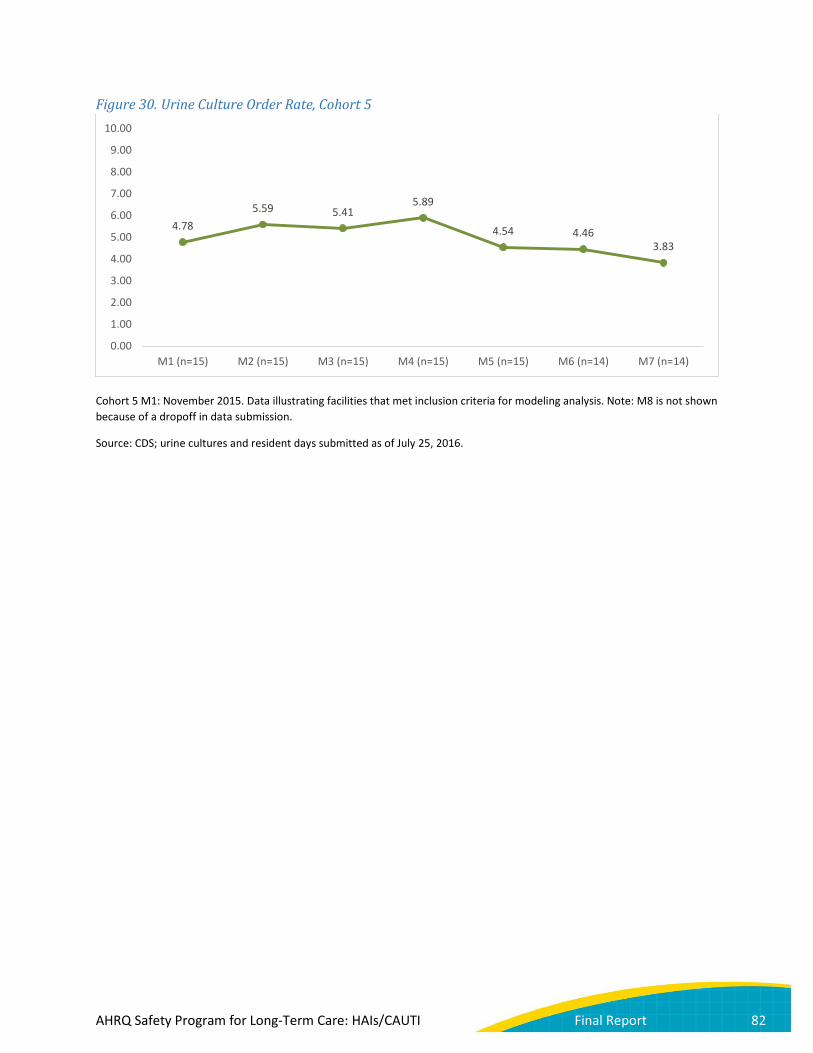
Figure 30. Urine Culture Order Rate, Cohort 5
Cohort 5 M1: November 2015. Data illustrating facilities that met inclusion criteria for modeling analysis. Note: M8 is not shown because of a dropoff in data submission.
Source: CDS; urine cultures and resident days submitted as of July 25, 2016.
4.78 5.59 5.41
5.89
4.54 4.46 3.83
0.00
1.00
2.00
3.00
4.00
5.00
6.00
7.00
8.00
9.00
10.00
M1 (n=15) M2 (n=15) M3 (n=15) M4 (n=15) M5 (n=15) M6 (n=14) M7 (n=14)
AHRQ Safety Program for Long-Term Care: HAIs/CAUTI Final Report 82

Appendix F. Webinar and Module Topics Onboarding Webinars This series of Webinars at the beginning of each cohort launch reviewed the program collaborative model, the technical and socioadaptive interventions, and data and measurement. Webinar topics are listed in Table 29.
Table 29. Onboarding Webinar Topics Onboarding Topic Onboarding
1 Building Your Team to Enhance Resident Safety
Onboarding 2
CAUTI Definitions and Reporting
Onboarding 3
Data Collection, Submission, and the AHRQ Nursing Home Survey on Patient Safety Culture
Onboarding 4
Infection Prevention: Surveillance Essentials in Preventing Healthcare-Associated Infections
Training Modules This four-part series of educational bundles was intended to strengthen knowledge and infection prevention skills related to catheter-associated urinary tract infection (CAUTI) reduction and healthcare-associated infection (HAI) prevention. These modules were delivered via live Webinars for Cohorts 1 and 2. For Cohorts 3, 4, and 5, each bundle followed a train-the-trainer format and included a video for core team members outlining how facility team leaders should teach and engage frontline staff with the content; a video for all staff to watch; activities such as skills practice, quizzes, or discussion guides; and an evaluation and certificate of completion. Module topics are listed in Table 30.
Table 30. Training Module Topics Module Topic
Module 1 Exploring Hand Hygiene: Knowledge and Practice Module 2 Clean Equipment and Environment: Knowledge and Practice Module 3 Personal Protective Equipment and Standard and Transmission-Based Precautions Module 4 How To Avoid the Harms of Antibiotic Overuse
Long-Term Care Safety Toolkit The Long-Term Care Safety Toolkit was developed specifically for the long-term care population with input from content experts. The purpose of the toolkit is to improve safety culture in LTC facilities, support quality improvement and safety initiatives in LTC facilities, and supplement the technical interventions to reduce HAIs, including CAUTIs. The toolkit has six modules focused on socioadaptive intervention elements. Toolkit module topics are listed in Table 31.
AHRQ Safety Program for Long-Term Care: HAIs/CAUTI Final Report 83

Table 31. Long-Term Care Safety Toolkit Module Topics Module Topic
Module 1 Using the Comprehensive Long-Term Care Safety Toolkit Module 2 Senior Leader Engagement Module 3 Staff Empowerment Module 4 Teamwork and Communication Module 5 Resident and Family Engagement Module 6 Sustainability
National Content Webinars In this series of monthly Webinars, the national project team, faculty, coaches, and resident advocates presented on technical, socioadaptive, and coaching topics to teach on the program interventions. Webinar topics are listed in Table 32.
AHRQ Safety Program for Long-Term Care: HAIs/CAUTI Final Report 84
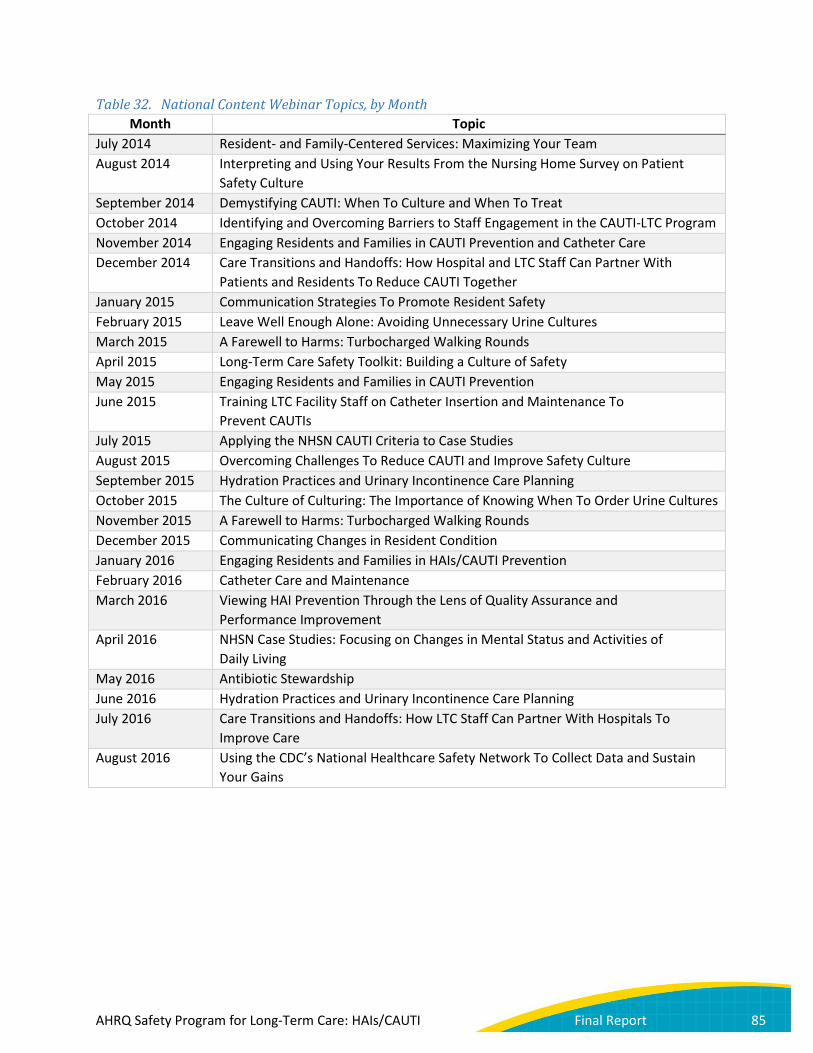
Table 32. National Content Webinar Topics, by Month Month Topic
July 2014 Resident- and Family-Centered Services: Maximizing Your Team August 2014 Interpreting and Using Your Results From the Nursing Home Survey on Patient
Safety Culture September 2014 Demystifying CAUTI: When To Culture and When To Treat October 2014 Identifying and Overcoming Barriers to Staff Engagement in the CAUTI-LTC Program November 2014 Engaging Residents and Families in CAUTI Prevention and Catheter Care December 2014 Care Transitions and Handoffs: How Hospital and LTC Staff Can Partner With
Patients and Residents To Reduce CAUTI Together January 2015 Communication Strategies To Promote Resident Safety February 2015 Leave Well Enough Alone: Avoiding Unnecessary Urine Cultures March 2015 A Farewell to Harms: Turbocharged Walking Rounds April 2015 Long-Term Care Safety Toolkit: Building a Culture of Safety May 2015 Engaging Residents and Families in CAUTI Prevention June 2015 Training LTC Facility Staff on Catheter Insertion and Maintenance To
Prevent CAUTIs July 2015 Applying the NHSN CAUTI Criteria to Case Studies August 2015 Overcoming Challenges To Reduce CAUTI and Improve Safety Culture September 2015 Hydration Practices and Urinary Incontinence Care Planning October 2015 The Culture of Culturing: The Importance of Knowing When To Order Urine Cultures November 2015 A Farewell to Harms: Turbocharged Walking Rounds December 2015 Communicating Changes in Resident Condition January 2016 Engaging Residents and Families in HAIs/CAUTI Prevention February 2016 Catheter Care and Maintenance March 2016 Viewing HAI Prevention Through the Lens of Quality Assurance and
Performance Improvement April 2016 NHSN Case Studies: Focusing on Changes in Mental Status and Activities of
Daily Living May 2016 Antibiotic Stewardship June 2016 Hydration Practices and Urinary Incontinence Care Planning July 2016 Care Transitions and Handoffs: How LTC Staff Can Partner With Hospitals To
Improve Care August 2016 Using the CDC’s National Healthcare Safety Network To Collect Data and Sustain
Your Gains
AHRQ Safety Program for Long-Term Care: HAIs/CAUTI Final Report 85

Appendix G. Assessments Facility Demographics
AHRQ Safety Program for Long-Term Care: HAIs/CAUTI Final Report 86

AHRQ Safety Program for Long-Term Care: HAIs/CAUTI Final Report 87
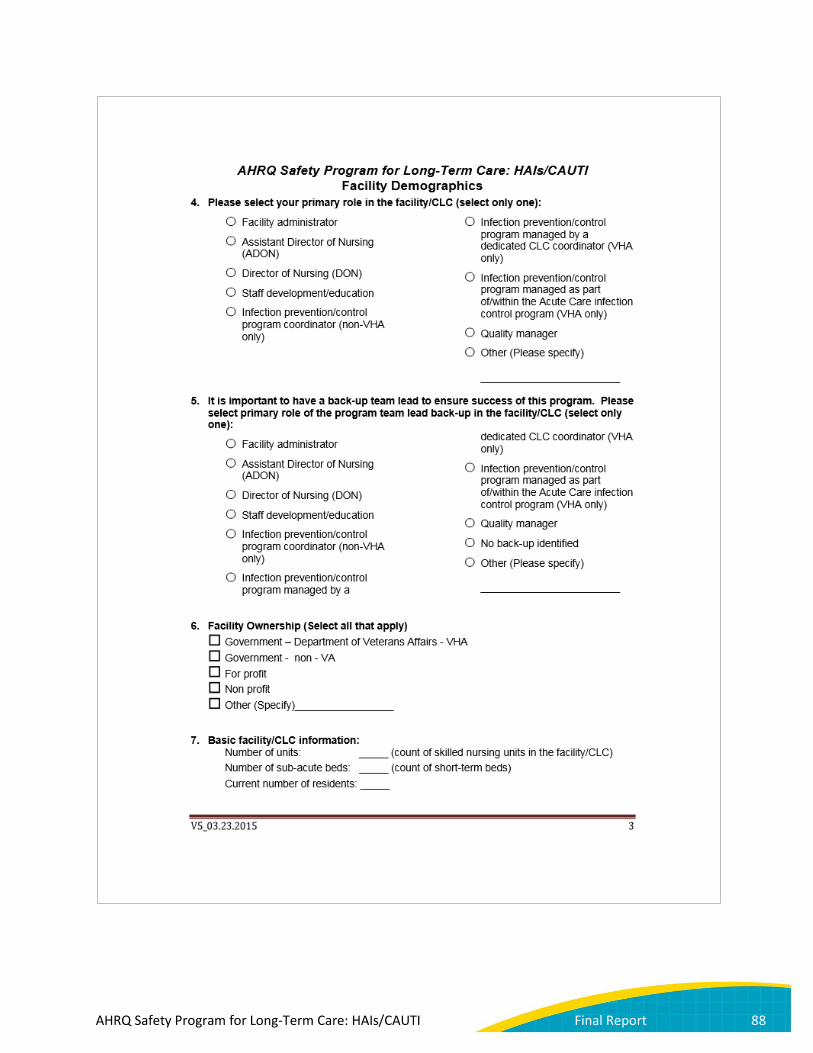
AHRQ Safety Program for Long-Term Care: HAIs/CAUTI Final Report 88
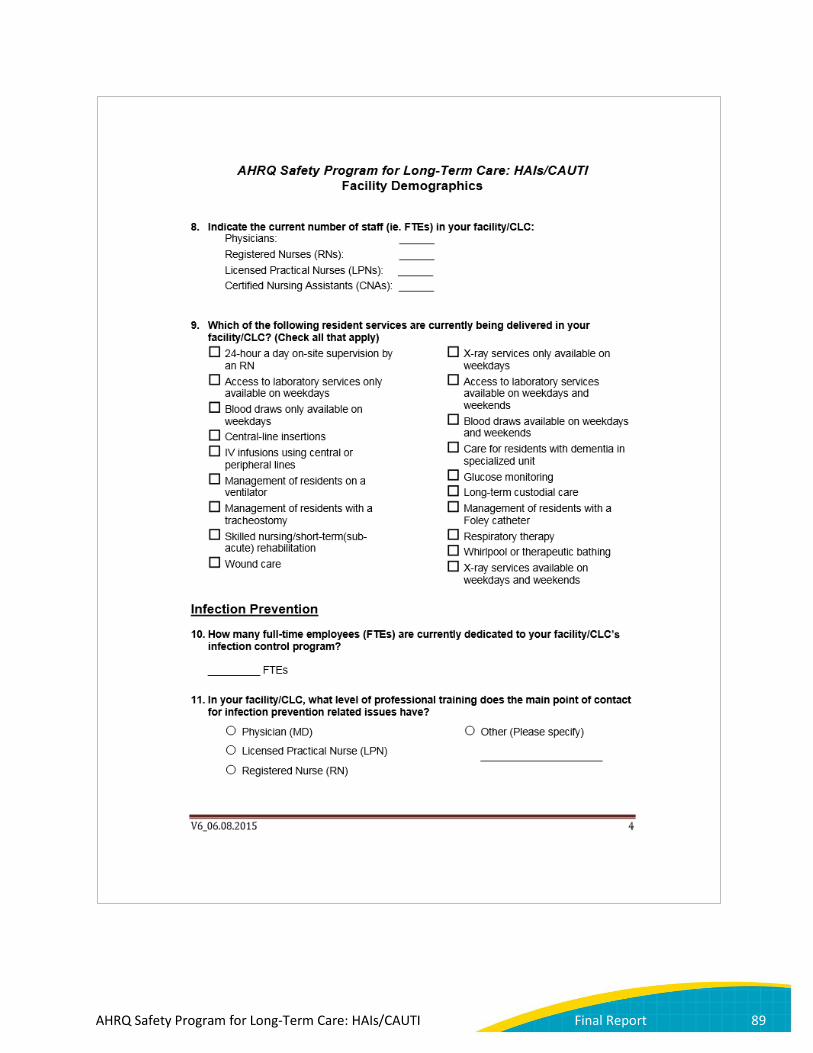
AHRQ Safety Program for Long-Term Care: HAIs/CAUTI Final Report 89
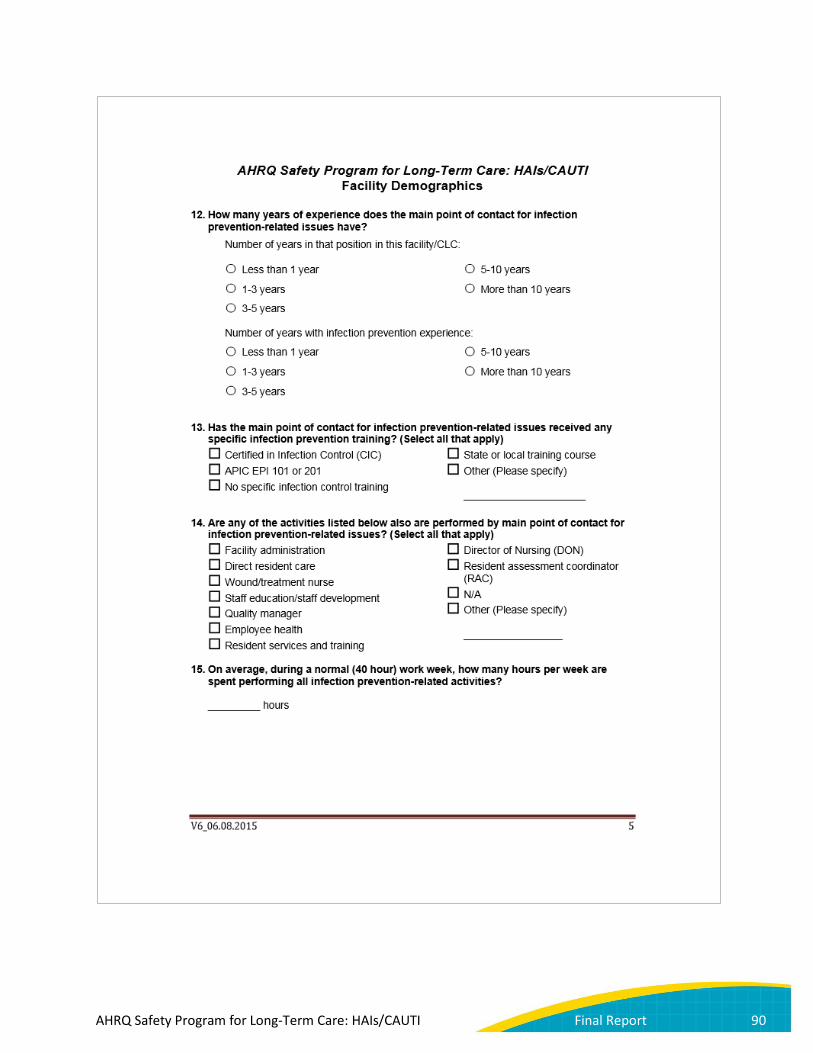
AHRQ Safety Program for Long-Term Care: HAIs/CAUTI Final Report 90
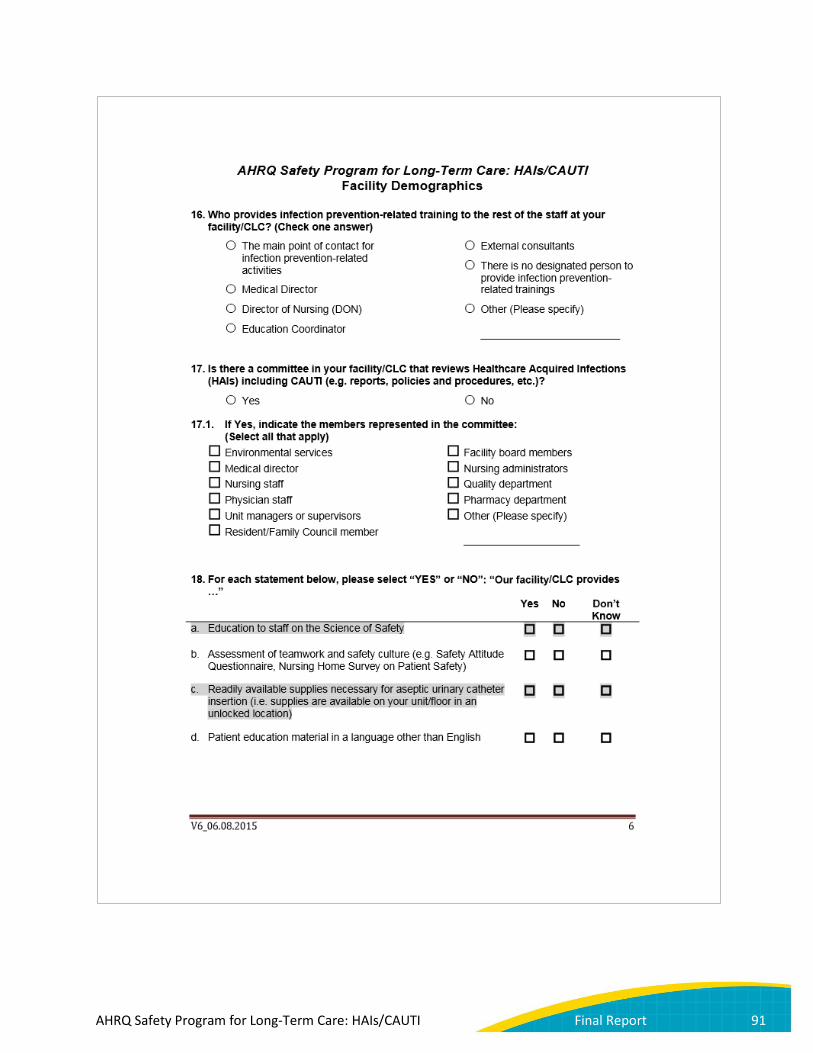
AHRQ Safety Program for Long-Term Care: HAIs/CAUTI Final Report 91

AHRQ Safety Program for Long-Term Care: HAIs/CAUTI Final Report 92

AHRQ Safety Program for Long-Term Care: HAIs/CAUTI Final Report 93
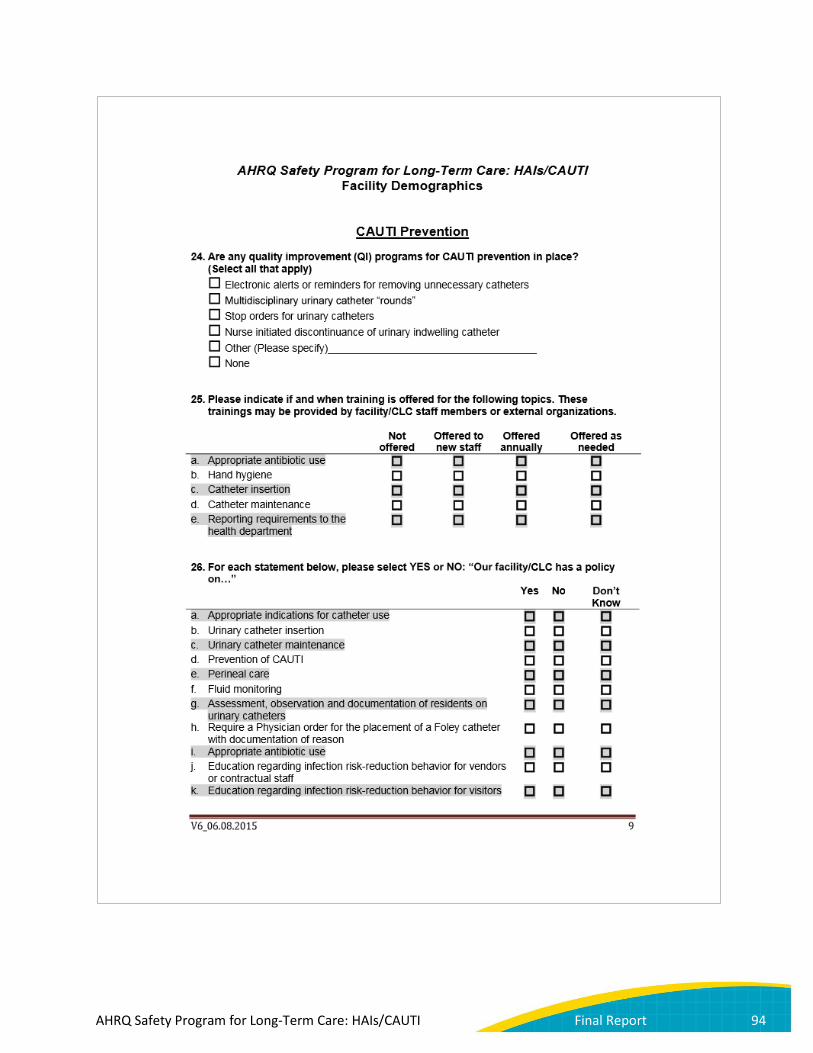
AHRQ Safety Program for Long-Term Care: HAIs/CAUTI Final Report 94

AHRQ Safety Program for Long-Term Care: HAIs/CAUTI Final Report 95

AHRQ Safety Program for Long-Term Care: HAIs/CAUTI Final Report 96

Nursing Home Survey on Patient Safety Culture (Safety Culture Survey)
AHRQ Safety Program for Long-Term Care: HAIs/CAUTI Final Report 97
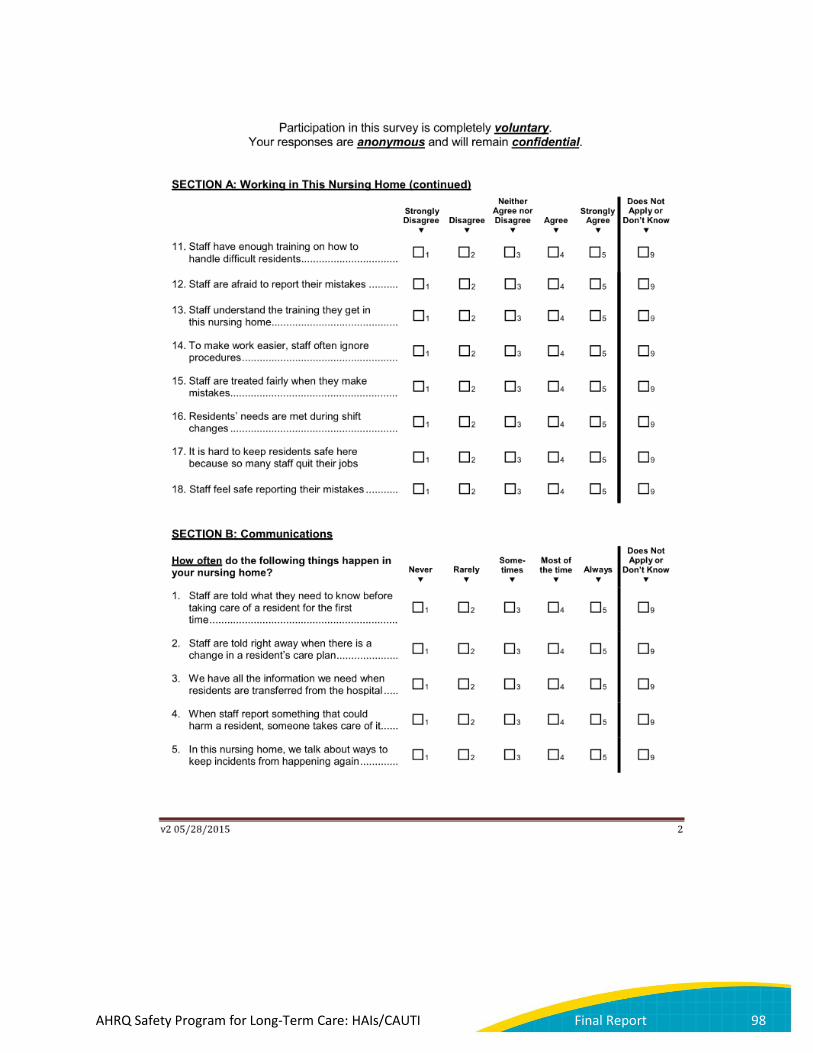
AHRQ Safety Program for Long-Term Care: HAIs/CAUTI Final Report 98
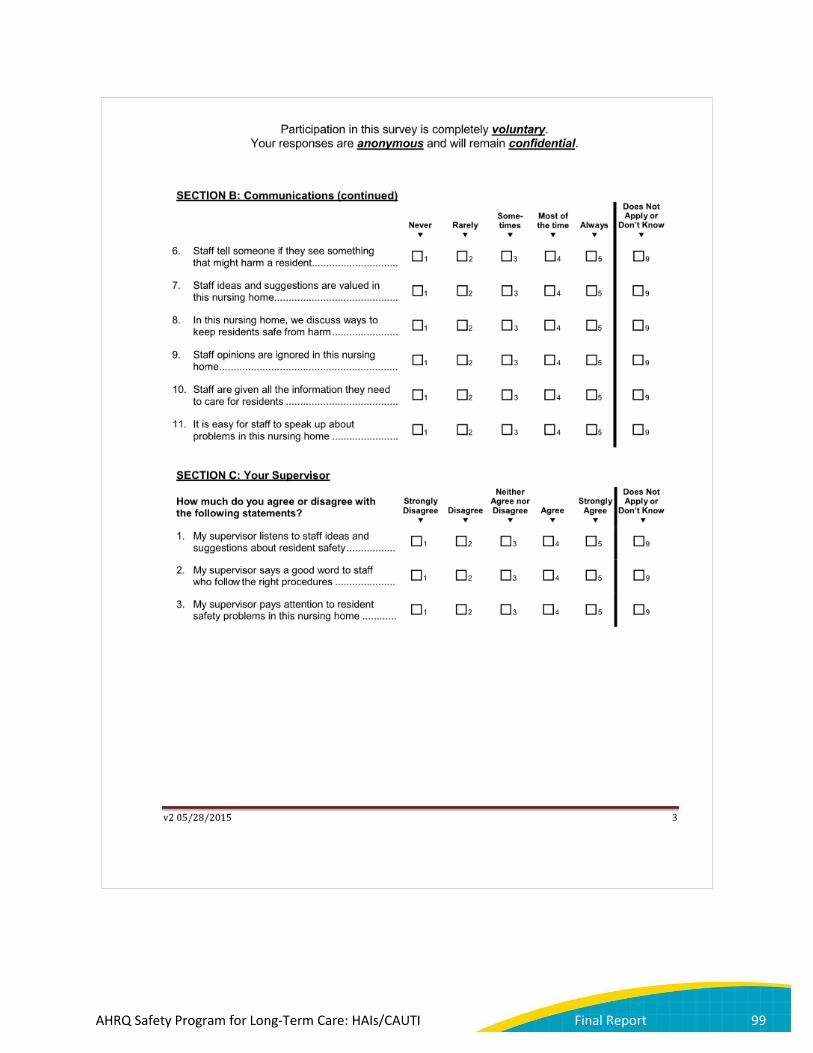
AHRQ Safety Program for Long-Term Care: HAIs/CAUTI Final Report 99

AHRQ Safety Program for Long-Term Care: HAIs/CAUTI Final Report 100
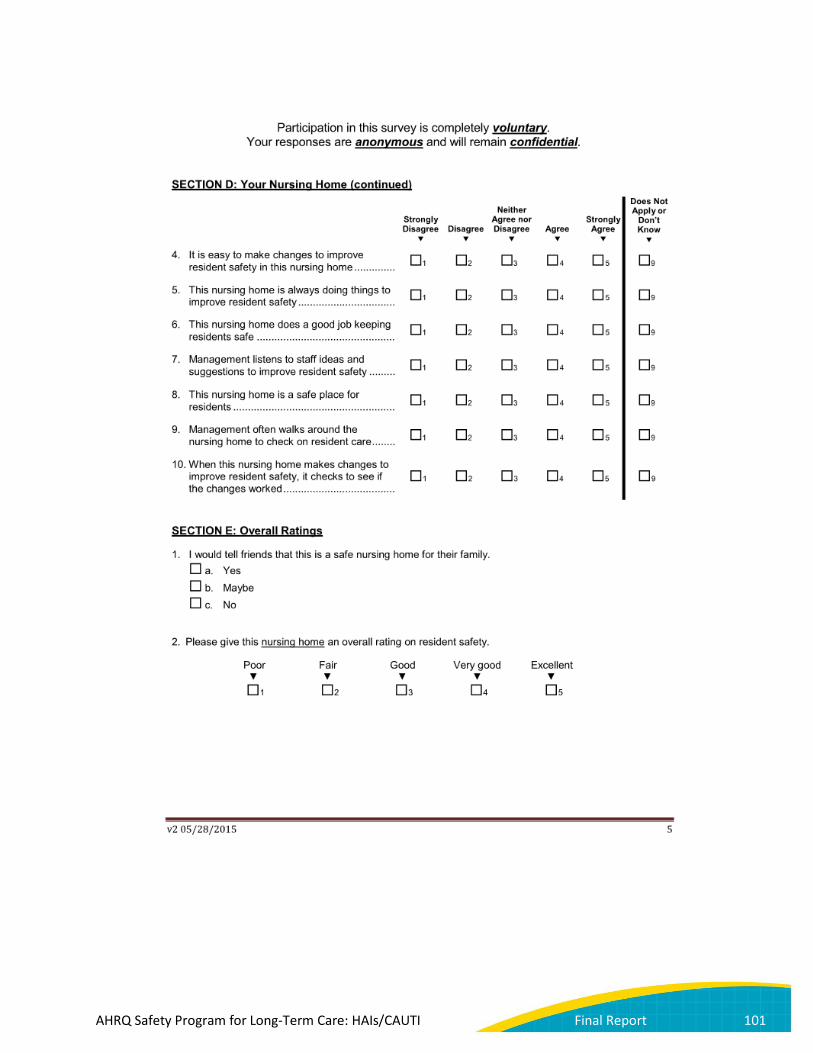
AHRQ Safety Program for Long-Term Care: HAIs/CAUTI Final Report 101
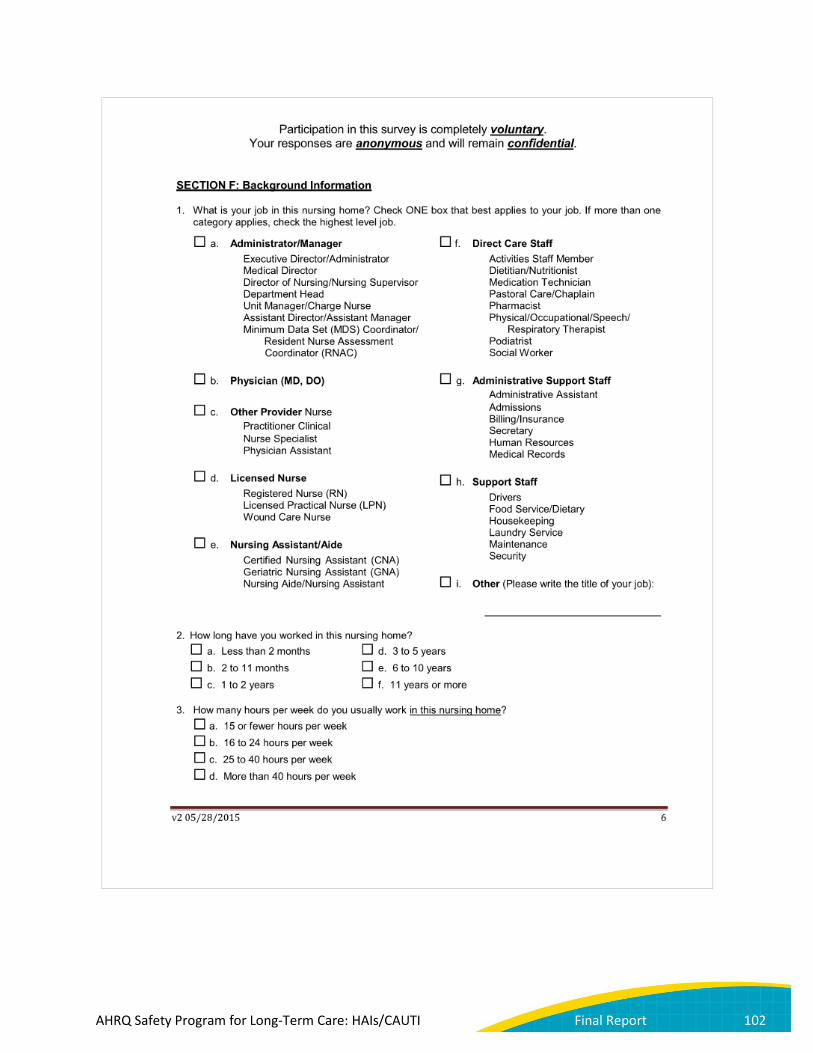
AHRQ Safety Program for Long-Term Care: HAIs/CAUTI Final Report 102

AHRQ Safety Program for Long-Term Care: HAIs/CAUTI Final Report 103
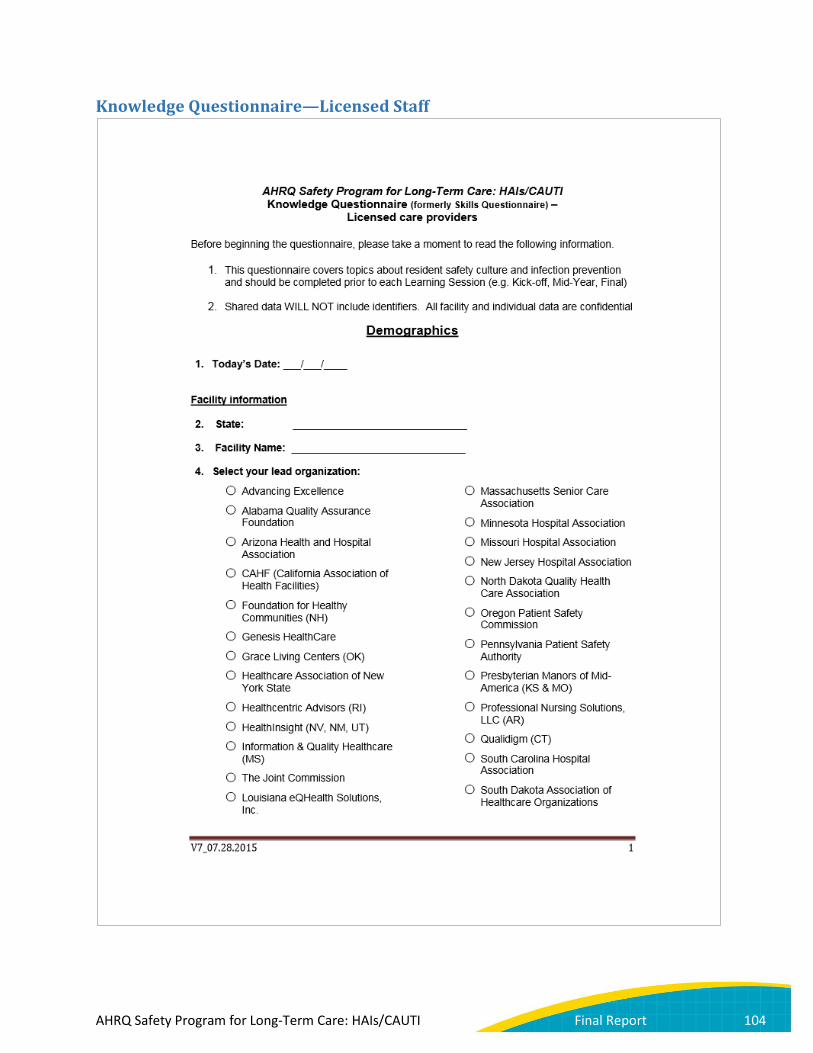
Knowledge Questionnaire—Licensed Staff
AHRQ Safety Program for Long-Term Care: HAIs/CAUTI Final Report 104

AHRQ Safety Program for Long-Term Care: HAIs/CAUTI Final Report 105
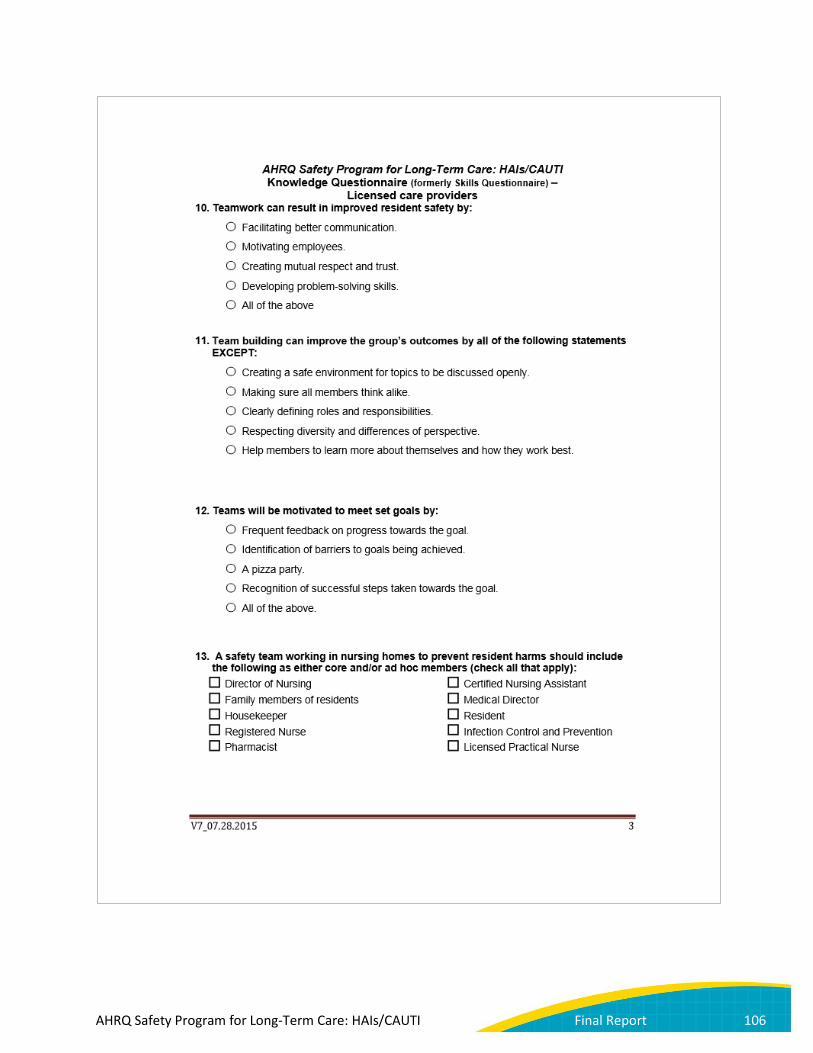
AHRQ Safety Program for Long-Term Care: HAIs/CAUTI Final Report 106
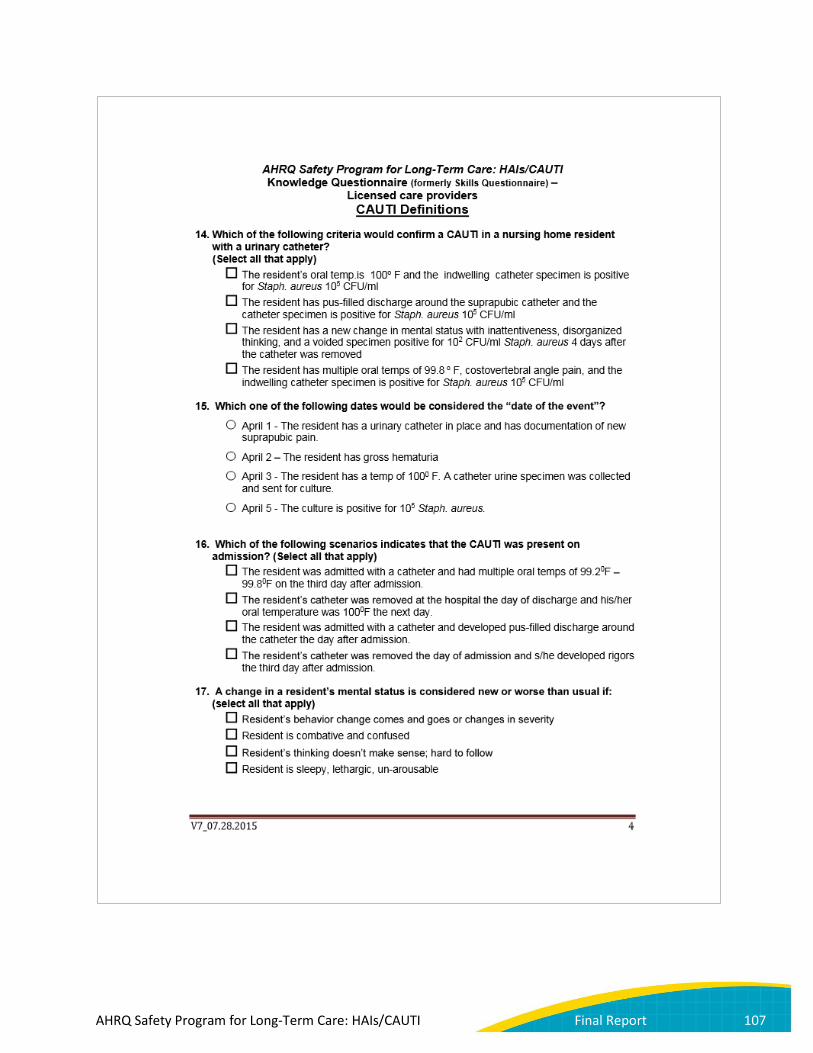
AHRQ Safety Program for Long-Term Care: HAIs/CAUTI Final Report 107

AHRQ Safety Program for Long-Term Care: HAIs/CAUTI Final Report 108
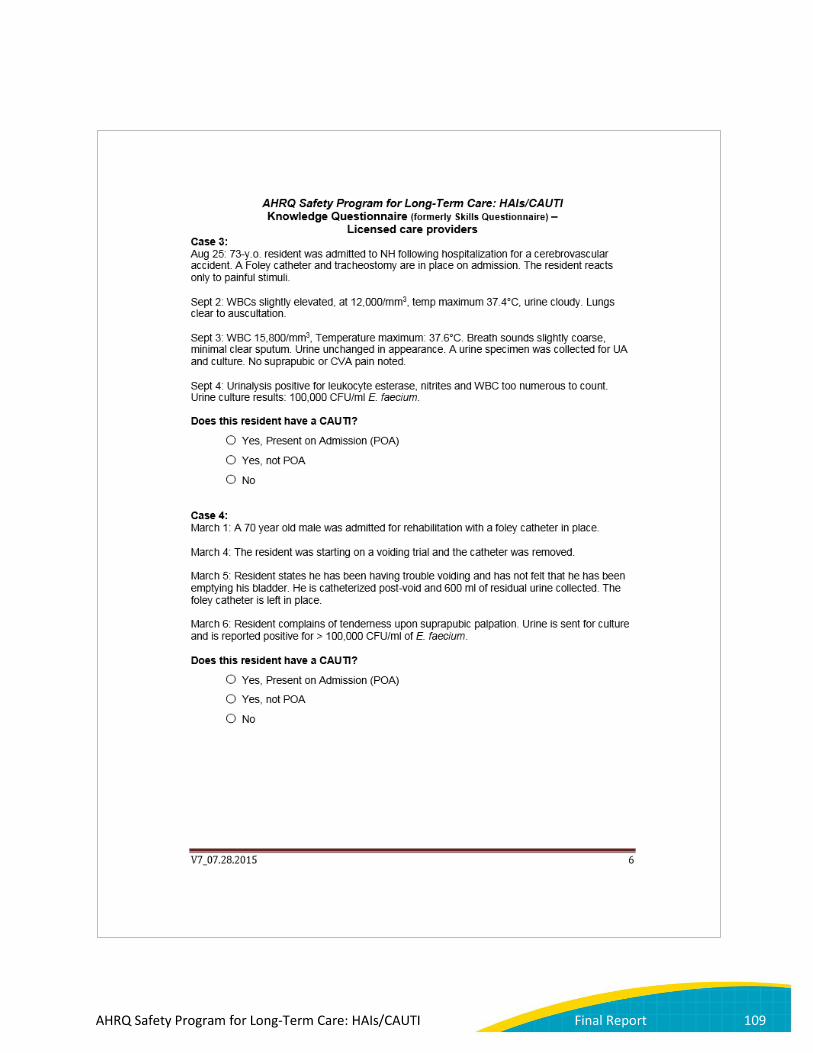
AHRQ Safety Program for Long-Term Care: HAIs/CAUTI Final Report 109
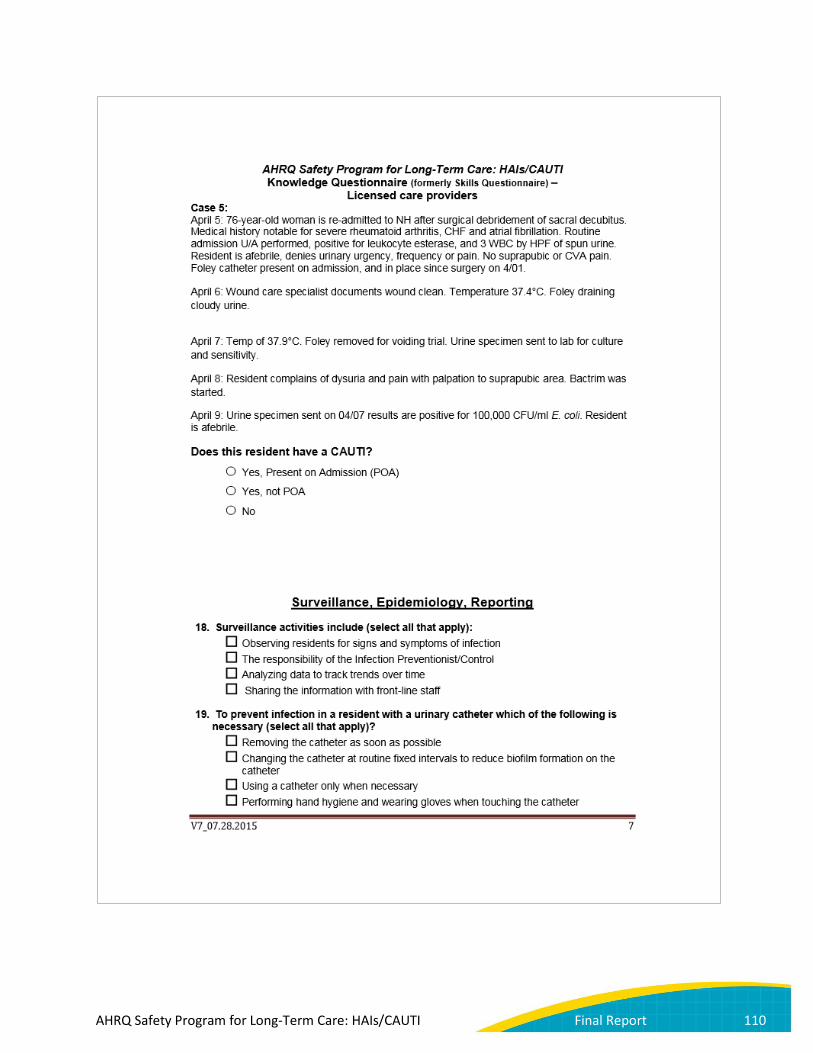
AHRQ Safety Program for Long-Term Care: HAIs/CAUTI Final Report 110

AHRQ Safety Program for Long-Term Care: HAIs/CAUTI Final Report 111

AHRQ Safety Program for Long-Term Care: HAIs/CAUTI Final Report 112
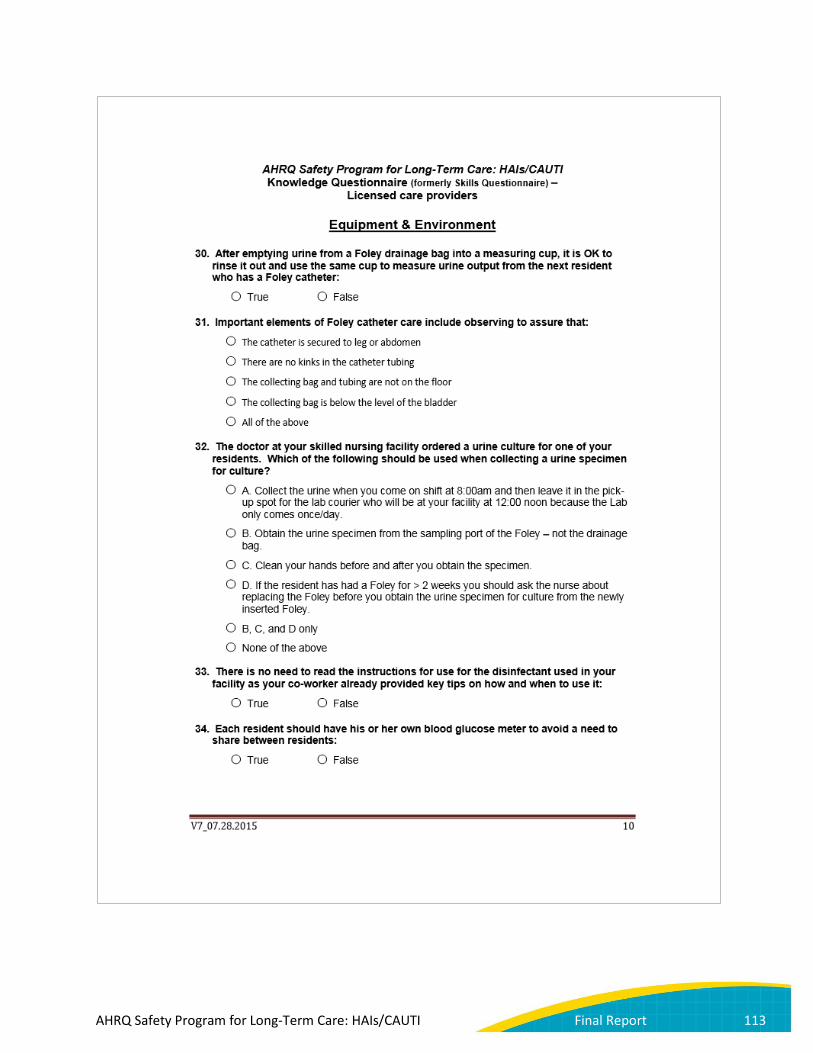
AHRQ Safety Program for Long-Term Care: HAIs/CAUTI Final Report 113

AHRQ Safety Program for Long-Term Care: HAIs/CAUTI Final Report 114
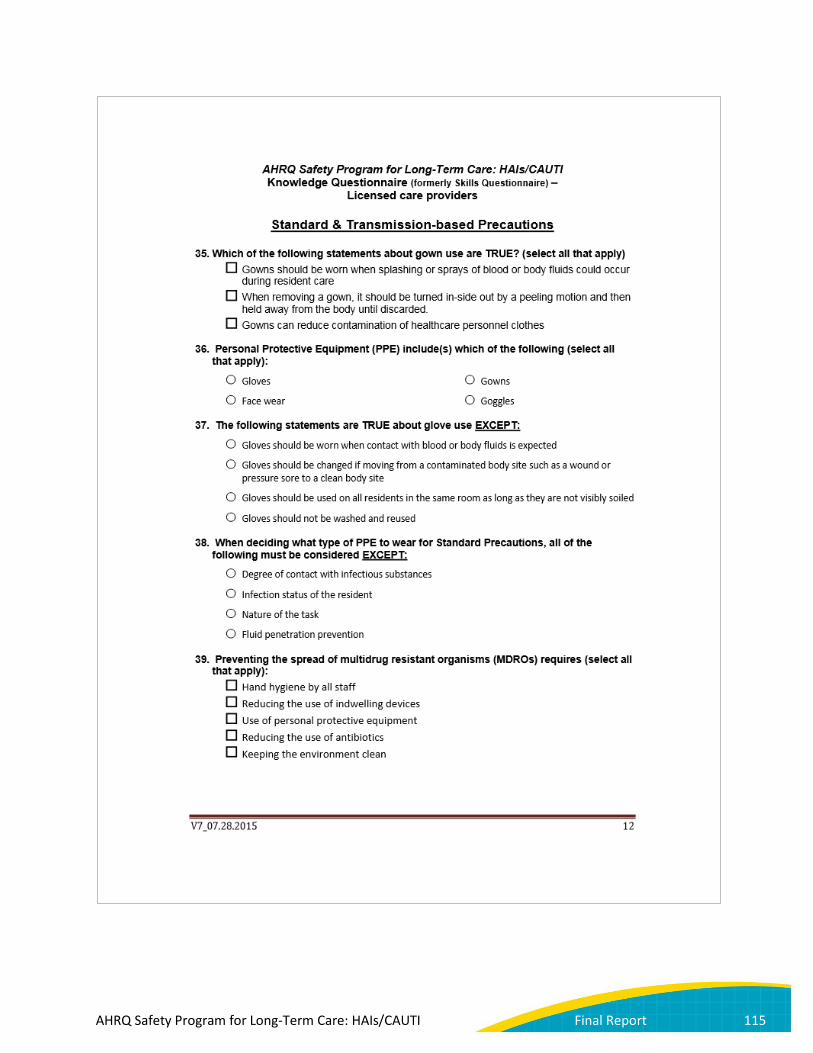
AHRQ Safety Program for Long-Term Care: HAIs/CAUTI Final Report 115
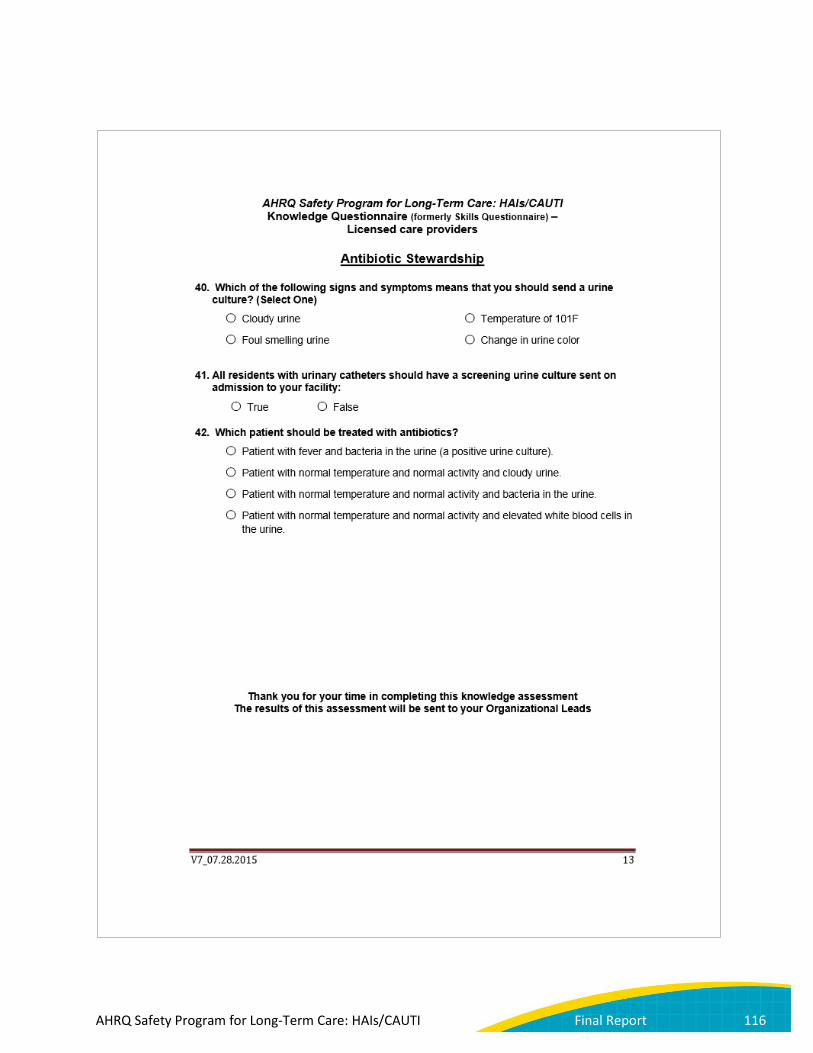
AHRQ Safety Program for Long-Term Care: HAIs/CAUTI Final Report 116
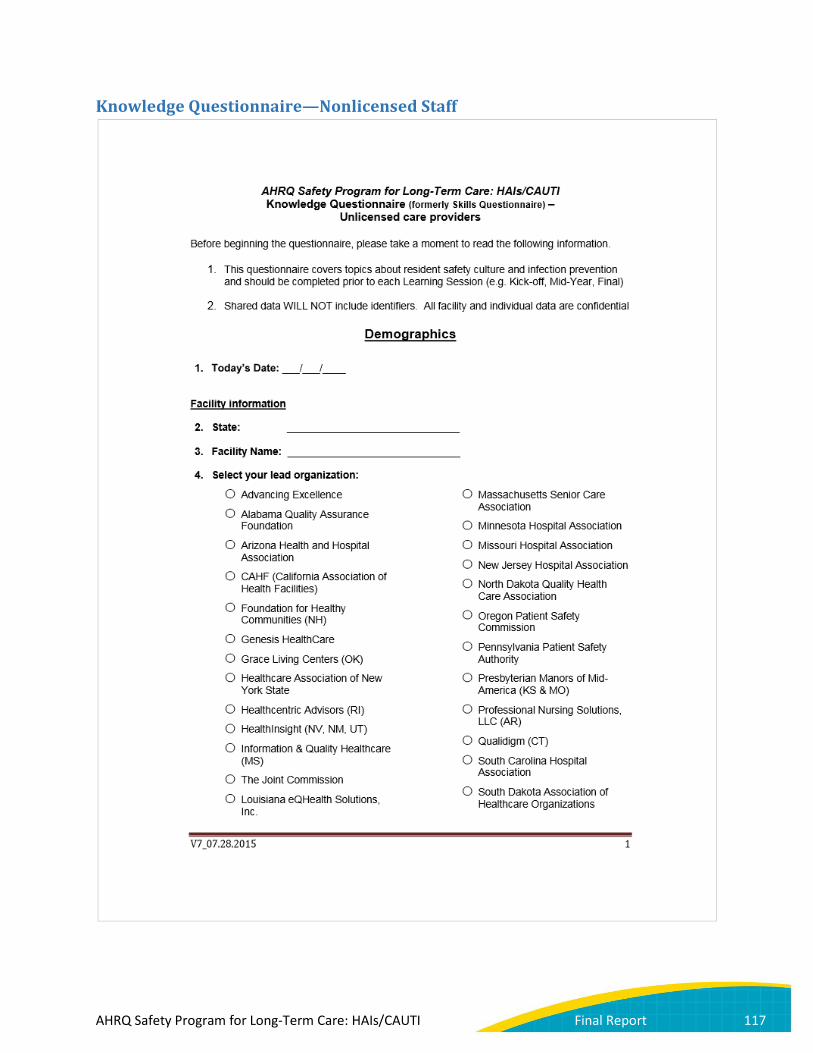
Knowledge Questionnaire—Nonlicensed Staff
AHRQ Safety Program for Long-Term Care: HAIs/CAUTI Final Report 117

AHRQ Safety Program for Long-Term Care: HAIs/CAUTI Final Report 118
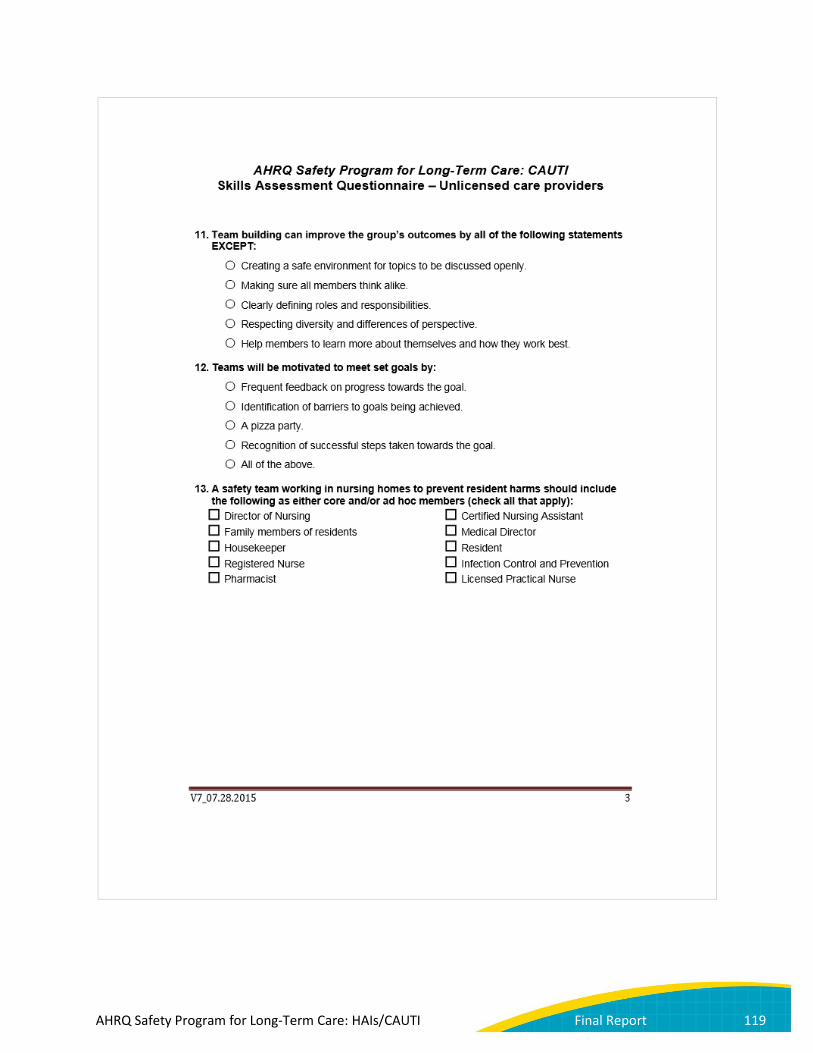
AHRQ Safety Program for Long-Term Care: HAIs/CAUTI Final Report 119
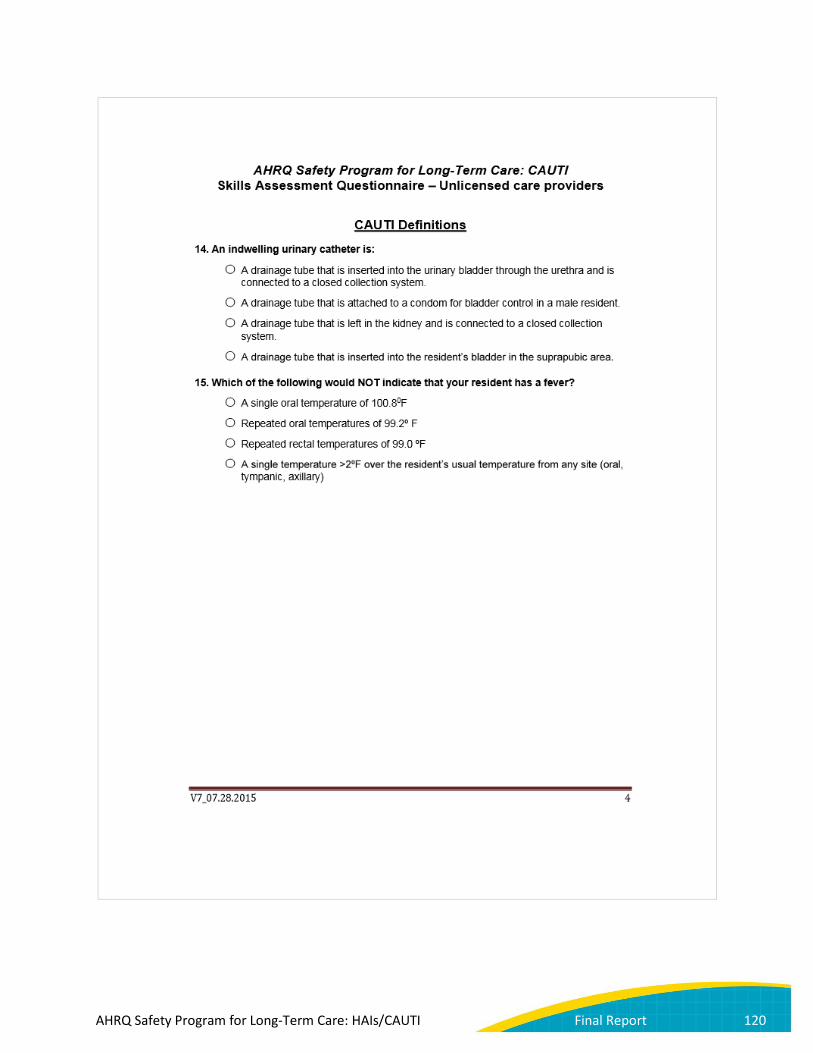
AHRQ Safety Program for Long-Term Care: HAIs/CAUTI Final Report 120

AHRQ Safety Program for Long-Term Care: HAIs/CAUTI Final Report 121
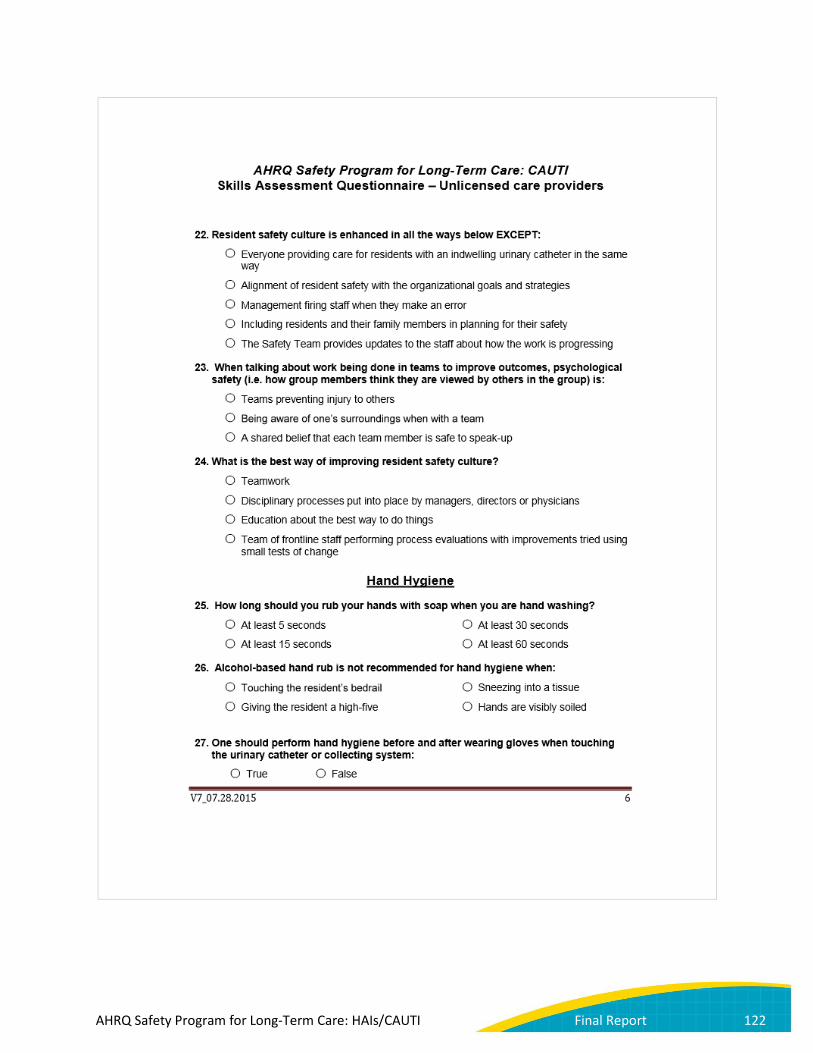
AHRQ Safety Program for Long-Term Care: HAIs/CAUTI Final Report 122
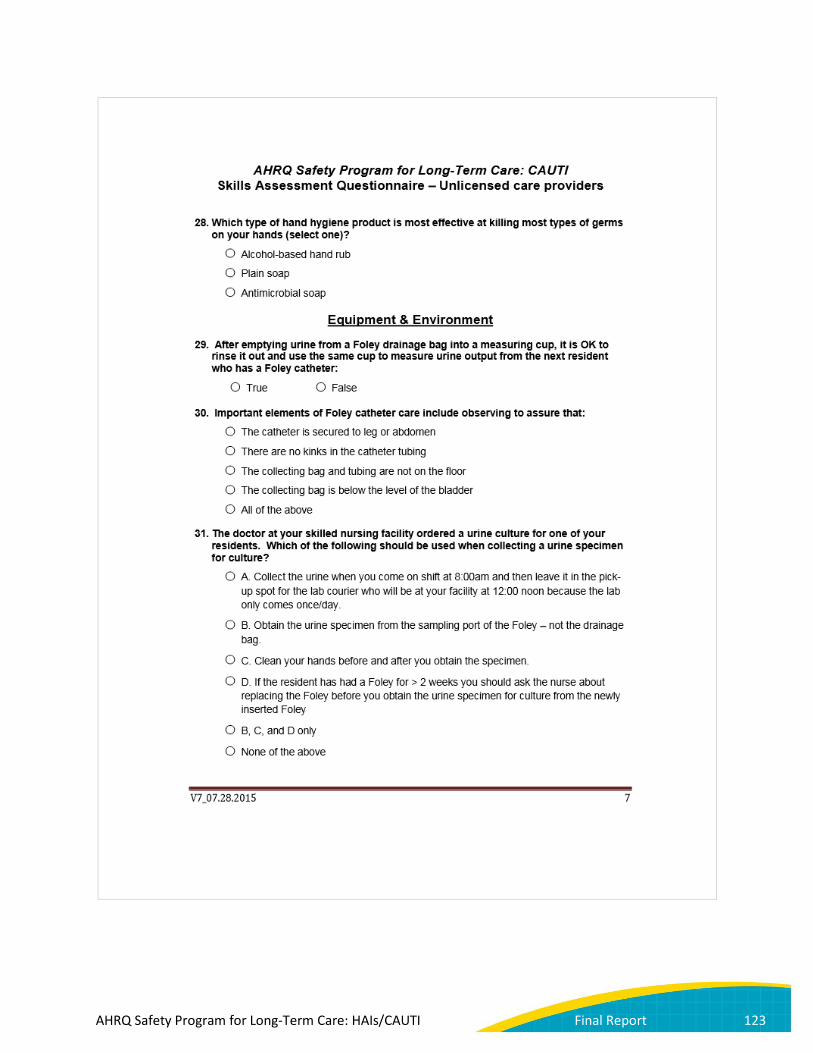
AHRQ Safety Program for Long-Term Care: HAIs/CAUTI Final Report 123
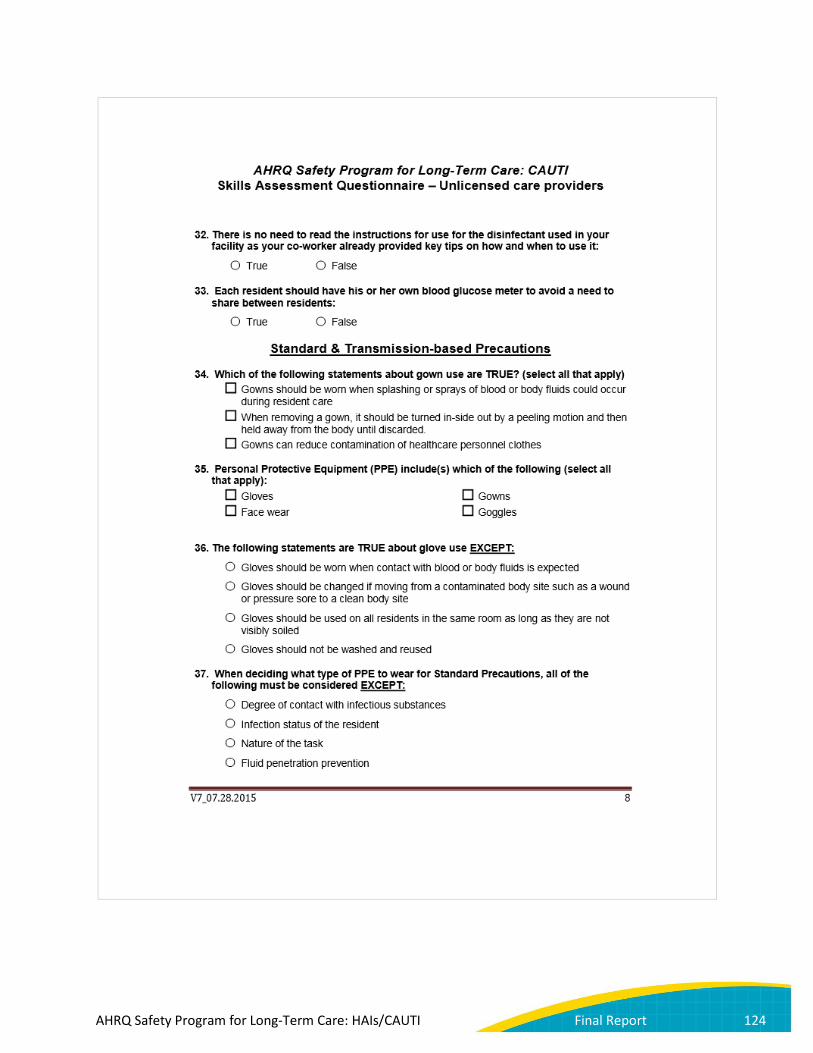
AHRQ Safety Program for Long-Term Care: HAIs/CAUTI Final Report 124
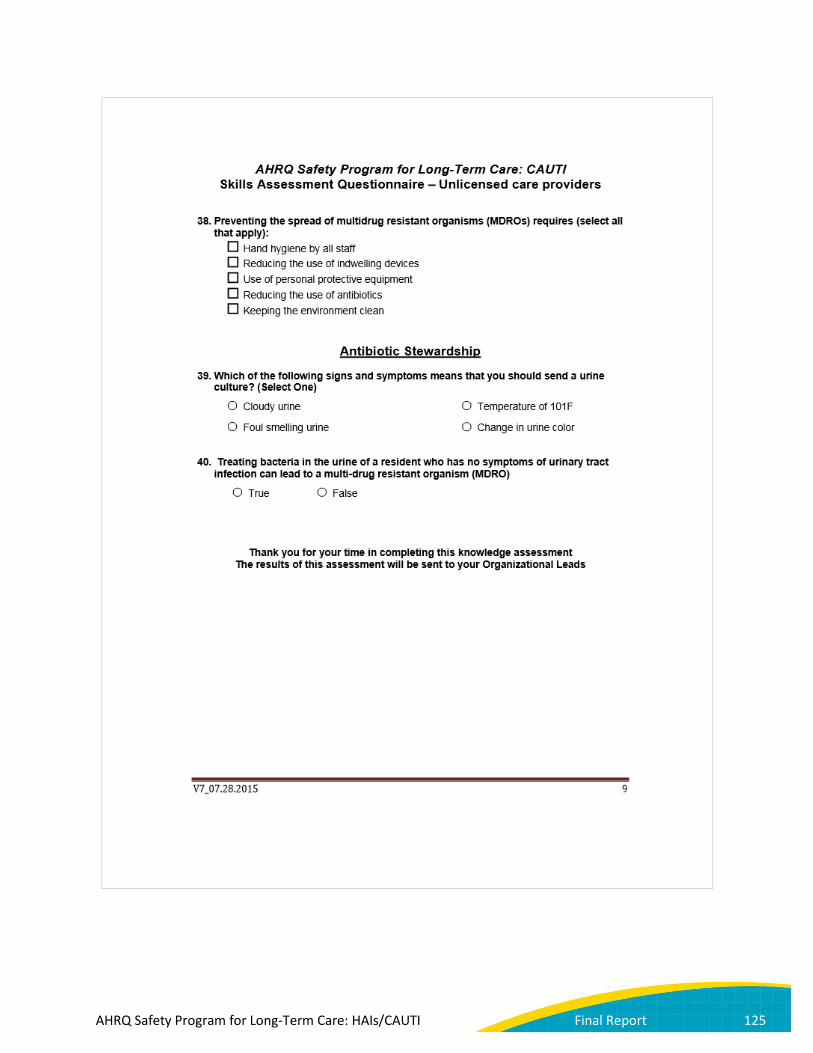
AHRQ Safety Program for Long-Term Care: HAIs/CAUTI Final Report 125

Appendix H. Contract Deliverables Table Date of Award: 19 September 2013
Task Deliverable Due Date Status Base Contract Period
Task 1. Design CUSP for CAUTI-LTC Module
Subtask 1.1.2 Draft Evidence Report Meeting 19 November 2013 Completed
Subtask 1.1.2.1 Final Evidence Report 17 December 2013 Completed Subtask 1.1.3 TEP Meeting Report 17 December 2013 Completed Subtask 1.2.4 Draft Course Design Guide 19 December 2013 Completed Subtask 1.2.4.1 Final Course Design Guide 16 January 2014 Completed
Task 2. Produce CUSP for CAUTI-LTC Module
*Subtask 2.2 Submit Prototype for AHRQ Approval 19 March 2014 Completed
Subtask 2.2.1 Submit Final Prototype Materials 16 April 2014 Completed
Task 3. Recruitment Plan
Subtask 3.1 Draft Recruitment Plan 19 December 2013 Completed Subtask 3.1.1 Final Recruitment Plan 16 January 2013 Completed Subtask 3.2 State Operating Plan 19 March 2014 Completed
Subtask 3.3.1 Draft State Sustainability Plan 19 April 2014 Completed
Subtask 3.3.2 Final State Sustainability Plan 16 May 2014 Completed
Task 4. Implement CUSP for CAUTI-LTC
Subtask 4.1 Submit Stakeholder Meeting Report 16 June 2014 Completed
Subtask 4.2 Submit Master Trainers Report 16 July 2014 Completed
Subtask 4.4 Submit State Coordinators Meeting Report 16 July 2014 Completed
Task 5. Assess Adoption of CUSP for CAUTI-LTC
*Subtask 5.3 Submit Draft Annual Report 19 August 2014 Completed *Subtask 5.3.1 Submit Final Annual Report 16 September 2014 Completed
Task 6. Project Administration
Subtask 6.2 Final Work Plan 13 November 2013 Completed
Subtask 6.3 Project Summary for
Posting on the ACTION II Extranet
13 November 2013 Completed
AHRQ Safety Program for Long-Term Care: HAIs/CAUTI Final Report 126
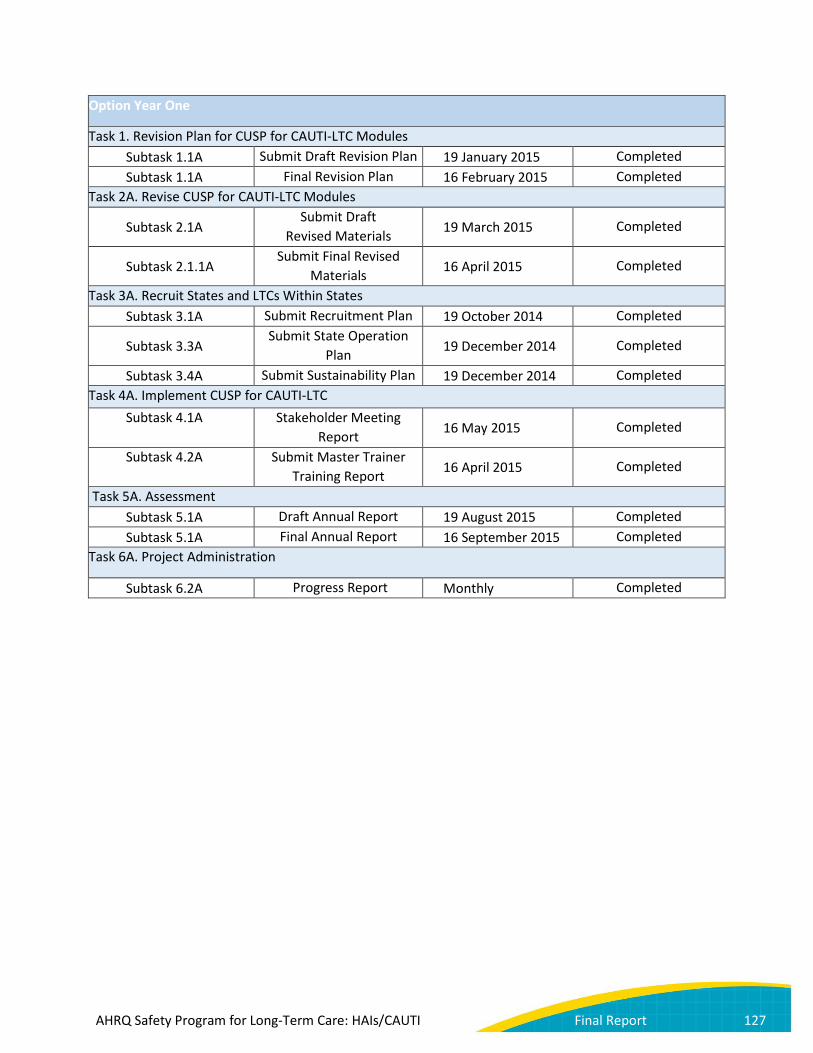
Option Year One
Task 1. Revision Plan for CUSP for CAUTI-LTC Modules Subtask 1.1A Submit Draft Revision Plan 19 January 2015 Completed Subtask 1.1A Final Revision Plan 16 February 2015 Completed
Task 2A. Revise CUSP for CAUTI-LTC Modules
Subtask 2.1A Submit Draft
Revised Materials 19 March 2015 Completed
Subtask 2.1.1A Submit Final Revised
Materials 16 April 2015 Completed
Task 3A. Recruit States and LTCs Within States Subtask 3.1A Submit Recruitment Plan 19 October 2014 Completed
Subtask 3.3A Submit State Operation
Plan 19 December 2014 Completed
Subtask 3.4A Submit Sustainability Plan 19 December 2014 Completed Task 4A. Implement CUSP for CAUTI-LTC
Subtask 4.1A Stakeholder Meeting Report 16 May 2015 Completed
Subtask 4.2A Submit Master Trainer Training Report 16 April 2015 Completed
Task 5A. Assessment Subtask 5.1A Draft Annual Report 19 August 2015 Completed Subtask 5.1A Final Annual Report 16 September 2015 Completed
Task 6A. Project Administration
Subtask 6.2A Progress Report Monthly Completed
AHRQ Safety Program for Long-Term Care: HAIs/CAUTI Final Report 127
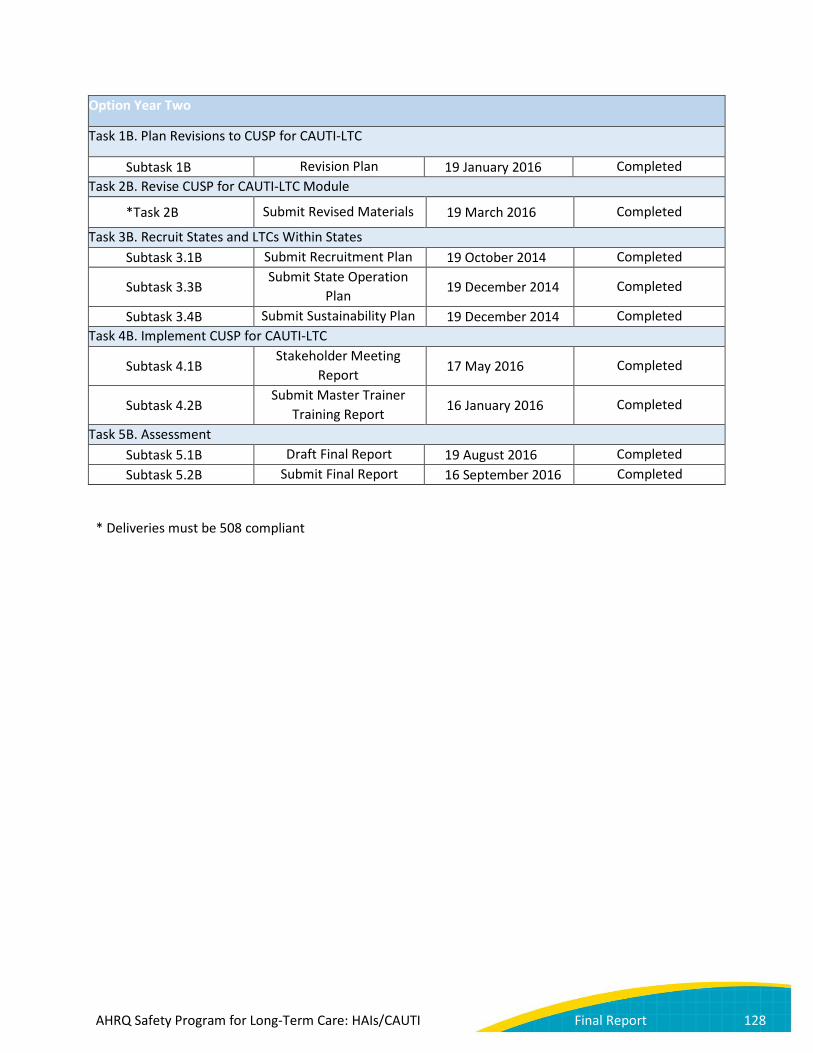
Option Year Two
Task 1B. Plan Revisions to CUSP for CAUTI-LTC
Subtask 1B Revision Plan 19 January 2016 Completed Task 2B. Revise CUSP for CAUTI-LTC Module
*Task 2B Submit Revised Materials 19 March 2016 Completed
Task 3B. Recruit States and LTCs Within States Subtask 3.1B Submit Recruitment Plan 19 October 2014 Completed
Subtask 3.3B Submit State Operation
Plan 19 December 2014 Completed
Subtask 3.4B Submit Sustainability Plan 19 December 2014 Completed Task 4B. Implement CUSP for CAUTI-LTC
Subtask 4.1B Stakeholder Meeting
Report 17 May 2016 Completed
Subtask 4.2B Submit Master Trainer
Training Report 16 January 2016 Completed
Task 5B. Assessment Subtask 5.1B Draft Final Report 19 August 2016 Completed Subtask 5.2B Submit Final Report 16 September 2016 Completed
* Deliveries must be 508 compliant
AHRQ Safety Program for Long-Term Care: HAIs/CAUTI Final Report 128

Appendix I. NHSN Long-Term Care Facility Component: Urinary Tract Infection
AHRQ Safety Program for Long-Term Care: HAIs/CAUTI Final Report 129

AHRQ Safety Program for Long-Term Care: HAIs/CAUTI Final Report 130
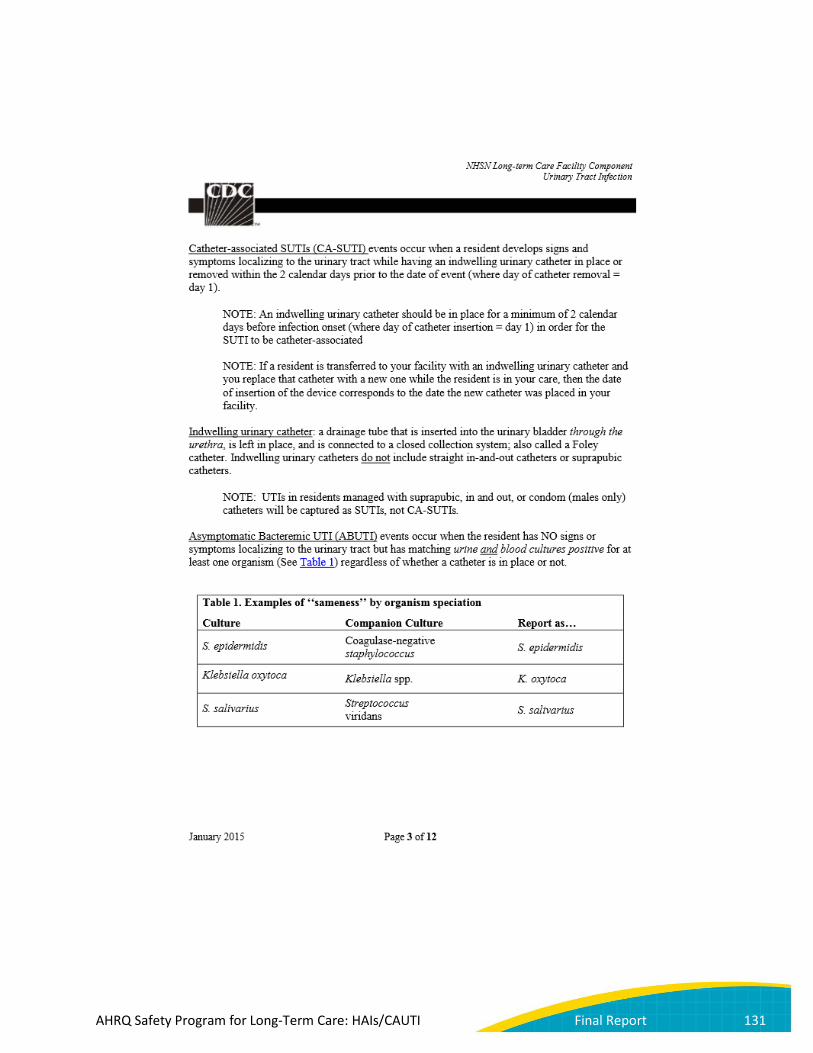
AHRQ Safety Program for Long-Term Care: HAIs/CAUTI Final Report 131
AHRQ Safety Program for Long-Term Care: HAIs/CAUTI Final Report 132

AHRQ Safety Program for Long-Term Care: HAIs/CAUTI Final Report 133

AHRQ Safety Program for Long-Term Care: HAIs/CAUTI Final Report 134

AHRQ Safety Program for Long-Term Care: HAIs/CAUTI Final Report 135

AHRQ Safety Program for Long-Term Care: HAIs/CAUTI Final Report 136
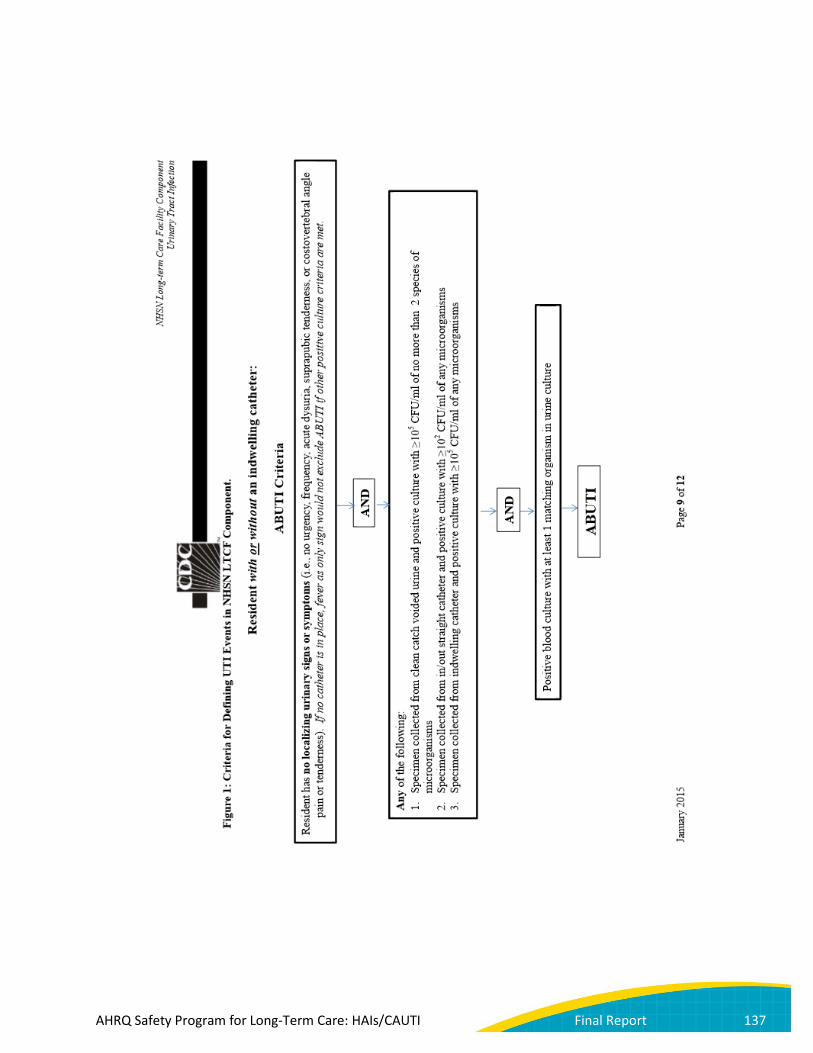
AHRQ Safety Program for Long-Term Care: HAIs/CAUTI Final Report 137
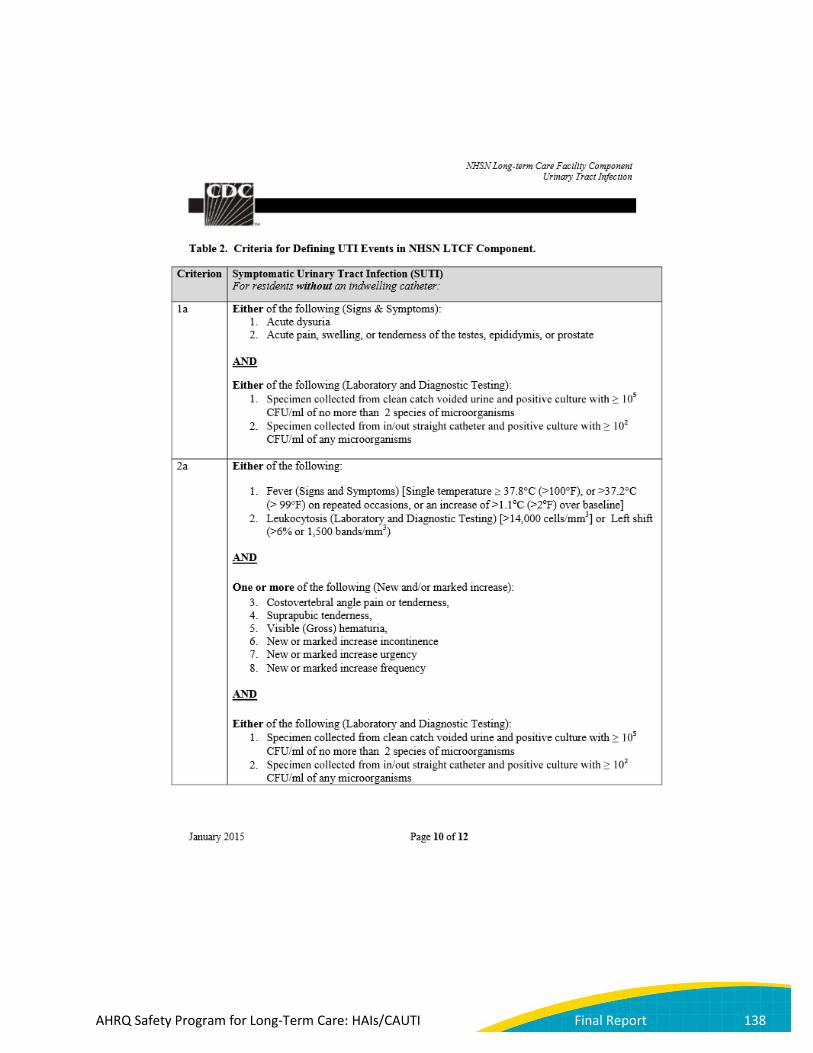
AHRQ Safety Program for Long-Term Care: HAIs/CAUTI Final Report 138
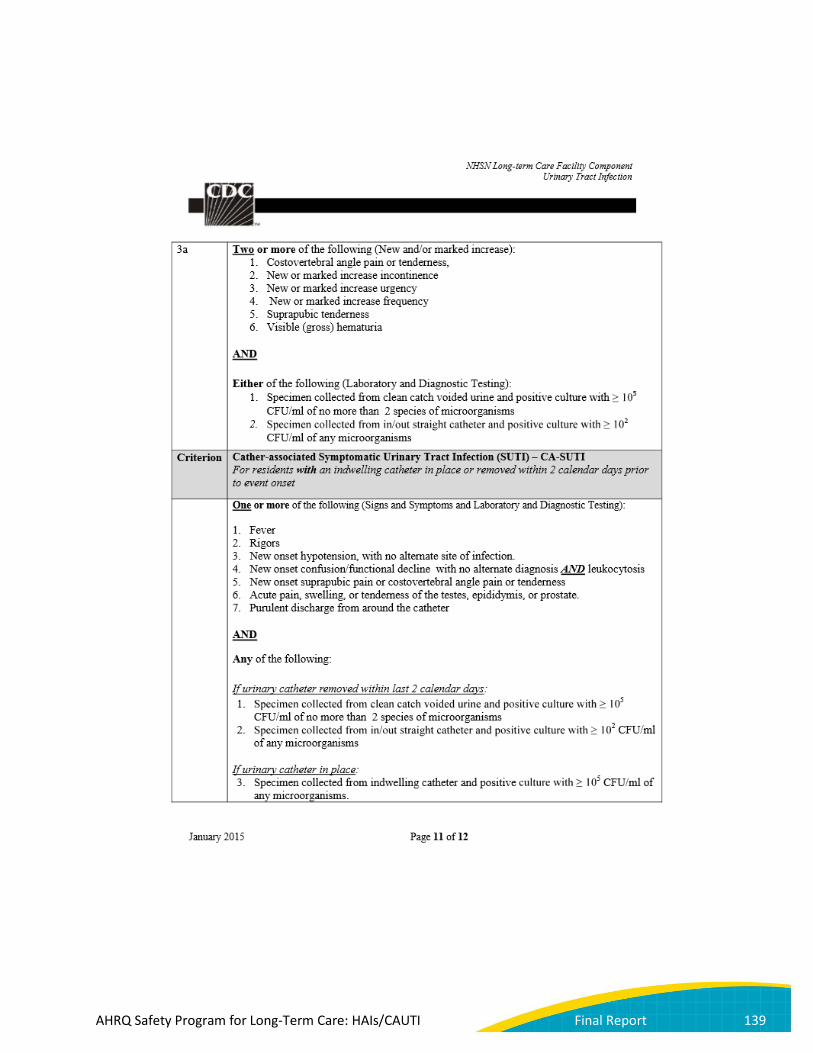
AHRQ Safety Program for Long-Term Care: HAIs/CAUTI Final Report 139

AHRQ Safety Program for Long-Term Care: HAIs/CAUTI Final Report 140
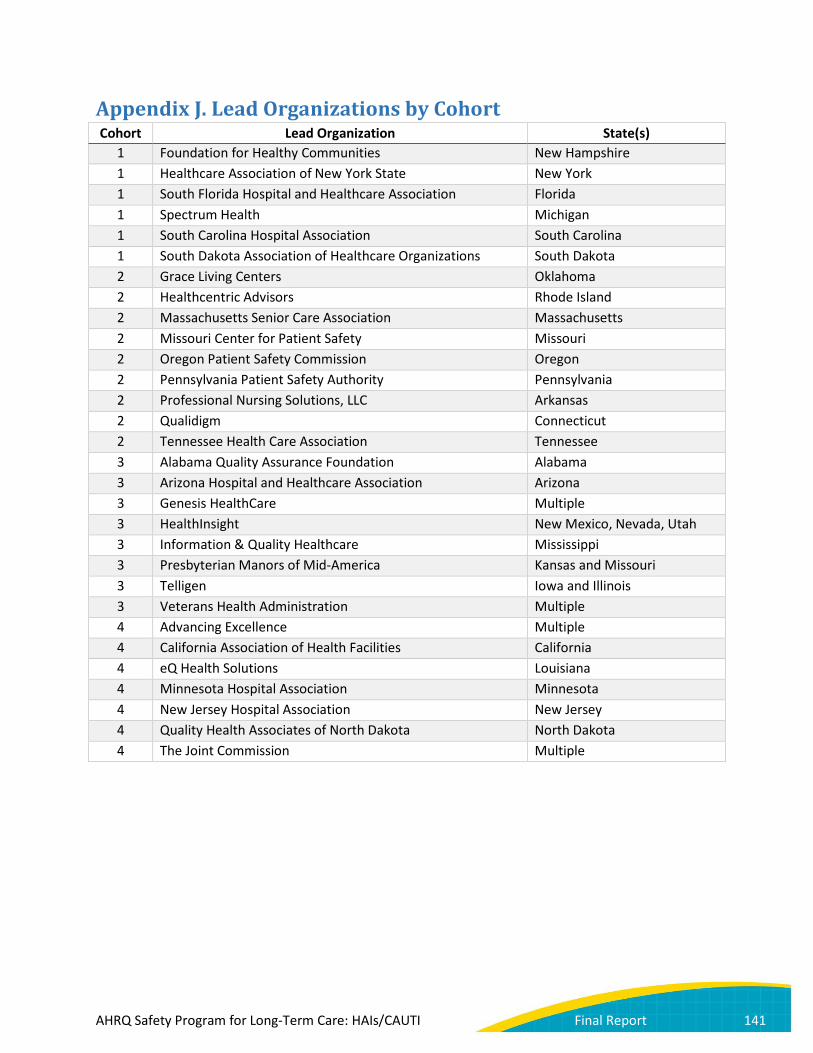
Appendix J. Lead Organizations by Cohort Cohort Lead Organization State(s)
1 Foundation for Healthy Communities New Hampshire 1 Healthcare Association of New York State New York 1 South Florida Hospital and Healthcare Association Florida 1 Spectrum Health Michigan 1 South Carolina Hospital Association South Carolina 1 South Dakota Association of Healthcare Organizations South Dakota 2 Grace Living Centers Oklahoma 2 Healthcentric Advisors Rhode Island 2 Massachusetts Senior Care Association Massachusetts 2 Missouri Center for Patient Safety Missouri 2 Oregon Patient Safety Commission Oregon 2 Pennsylvania Patient Safety Authority Pennsylvania 2 Professional Nursing Solutions, LLC Arkansas 2 Qualidigm Connecticut 2 Tennessee Health Care Association Tennessee 3 Alabama Quality Assurance Foundation Alabama 3 Arizona Hospital and Healthcare Association Arizona 3 Genesis HealthCare Multiple 3 HealthInsight New Mexico, Nevada, Utah 3 Information & Quality Healthcare Mississippi 3 Presbyterian Manors of Mid-America Kansas and Missouri 3 Telligen Iowa and Illinois 3 Veterans Health Administration Multiple 4 Advancing Excellence Multiple 4 California Association of Health Facilities California 4 eQ Health Solutions Louisiana 4 Minnesota Hospital Association Minnesota 4 New Jersey Hospital Association New Jersey 4 Quality Health Associates of North Dakota North Dakota 4 The Joint Commission Multiple
AHRQ Safety Program for Long-Term Care: HAIs/CAUTI Final Report 141