Embed Size (px)
Citation preview
PREVENT
HAIsHealthcare-Associated Infections
CUSP
AHRQ Safety Program for Ambulatory Surgery

AHRQ Safety Program for Ambulatory Surgery
Final Report
Prepared for: Agency for Healthcare Research and Quality (AHRQ) U.S. Department of Health and Human Services
Contract Number: HHSA2902010000251
Prepared by: The Health Research & Educational Trust of the American Hospital Association
AHRQ Publication No. 16(17)-0019-1-EF May 2017

Final Report 2
Contents
Executive Summary .................................................................................... 6Background ..................................................................................................................................................................... 6
Objectives ....................................................................................................................................................................... 6
Program Spread ............................................................................................................................................................. 6
Outcomes ....................................................................................................................................................................... 7
ASC Toolkit .................................................................................................................................................................... 9
Lessons Learned ............................................................................................................................................................ 9
Report Organization ................................................................................. 11
Project Background ................................................................................... 12
Program Development ............................................................................. 14Key People .................................................................................................................................................................... 14
Facility Recruitment .................................................................................................................................................... 17
Curriculum .................................................................................................................................................................... 19
Communication ........................................................................................................................................................... 20
Program Resources and Sustainability .................................................................................................................... 21
ASC Implementation ................................................................................ 24Registration, Onboarding and Education ............................................................................................................... 24
Cohort Participation ................................................................................................................................................... 24
Program Results ........................................................................................ 29Program Implementation ........................................................................................................................................... 29
Summary ........................................................................................................................................................................ 37
Program Measures and Data Sources .................................................................................................................... 37
Results ............................................................................................................................................................................ 39
Lessons Learned ........................................................................................ 55Site Visits ....................................................................................................................................................................... 55
Success Factors and Lessons Learned .................................................................................................................... 56
Challenges ..................................................................................................................................................................... 58
Recommendations ....................................................................................................................................................... 59
Conclusion .................................................................................................. 61
References .................................................................................................. 62
AHRQ Safety Program for Ambulatory Surgery

Final Report 3
Appendixes ................................................................................................. 63Appendix A: Glossary of Acronyms and Abbreviations .................................................................................... 63
Appendix B: ASC Success Stories ........................................................................................................................... 65
Appendix C: Linear Regression Analysis Demonstrating the Relationship Between the Step Scores and Number of Coaching Calls ........................................................................................................ 67
Appendix D: Clinical Outcome Measures Currently Collected ...................................................................... 69
Appendix E: Clinical Process Measures Currently Collected........................................................................... 70
Appendix F: Demographic, Cultural, Program Participation, and Other Process Elements Collected ............................................................................................................................................... 71
Appendix G: Cohort Outcome Measure Results ................................................................................................ 72
AHRQ Safety Program for Ambulatory Surgery

Final Report 4
Figures
Figure A Program Reach Map ................................................................................................................................... 7 Figure 1 Program Reach Map ................................................................................................................................. 18 Figure 2 Center Engagement in QIA Activities.................................................................................................. 25 Figure 3 Evaluation Results From Educational Webinars—Information Rating ......................................... 27 Figure 4 Evaluation Results From Educational Webinars—Information Use ............................................. 27 Figure 5 Implementation Pathway (n=180) ......................................................................................................... 33 Figure 6 Cohort 5 Progression Through the Implementation Pathway (n=63) ........................................ 33 Figure 7 Outcome Rates, Cohorts 1–7, AAOS Pilot ....................................................................................... 40 Figure 8 Knowledge Assessment Results for Cohort 6 (Endoscopy) .......................................................... 47 Figure G.1 Cohort 1 Outcome Measure Results .................................................................................................. 72 Figure G.2 Cohort 2 Outcome Measure Results .................................................................................................. 73 Figure G.3 Cohort 3 Outcome Measure Results .................................................................................................. 74 Figure G.4 AAOS Pilot Cohort Outcome Measure Results ............................................................................... 75 Figure G.5 Cohort 4 Outcome Measure Results .................................................................................................. 76 Figure G.6 Cohort 5 Outcome Measure Results .................................................................................................. 77 Figure G.7 Cohort 6 Outcome Measure Results .................................................................................................. 78 Figure G.8 Cohort 7 Outcome Measure Results .................................................................................................. 79
AHRQ Safety Program for Ambulatory Surgery

Final Report 5
Tables
Table 1 Partners ....................................................................................................................................................... 15 Table 2 Educational Program Events ................................................................................................................... 20 Table 3 External Communication Methods ....................................................................................................... 21 Table 4 ASC Toolkit Modules .............................................................................................................................. 22 Table 5 Cohort Participation ................................................................................................................................ 24 Table 6 QIA Activities Cohorts 3–7 ................................................................................................................... 25 Table 7 Baseline Information Collected via the Facility Demographics Form (FDF) .............................. 30 Table 8 Implementation Categories and Criteria Collected by QIAs ........................................................ 31 Table 9 Number of Coaching Calls Completed by Centers in Cohort 5 (n=63) .................................... 34 Table 10 Correlation Between Number of Calls and “Scores of the Stages” of Improvement
(n=180) ........................................................................................................................................................ 34 Table 11 Program Measurement Components—Across All Cohorts.......................................................... 38 Table 12 Program Measurement Components—Endoscopy-Specific Cohort ........................................... 39 Table 13 Percentage of Active Facilities Reporting Required Data as of August 1, 2016 ........................ 39 Table 14 Incidence Rate Ratios of Having Outcome Event at Month 12 Relative to Month 1,
Adjusted for Cohort ................................................................................................................................ 41 Table 15 Unexpected Events, Cohorts 3–7, Data as of May 24, 2016 ......................................................... 42 Table 16 Reasons for Hospital Transfer/Admission From the ASC (Minus “Other” Reasons), Data
as of May 24, 2016 .................................................................................................................................... 42 Table 17 “Other” Reasons for Hospital Transfer/Admission for Cohorts 3–7, Data as of
May 24, 2016 .............................................................................................................................................. 43 Table 18 Unexpected Events Collected in Cohorts 3, 4, 5, and 7, Data as of May 24, 2016 ................. 43 Table 19 Reasons for Reoperation, Data as of May 24, 2016 ......................................................................... 44 Table 20 Types of Surgical Site Infection (SSI) Reported, Data as of May 24, 2016 .................................. 44 Table 21 Additional Unexpected Events Collected in C6, Data as of May 24, 2016 ................................ 44 Table 22 Reasons for Same Day Cancellations, Data as of May 24, 2016 ................................................... 44 Table 23 Additional Unexpected Event Collected in C7, Data as of May 24, 2016 .................................. 44 Table 24 “Other” Events—Characterization of Event ..................................................................................... 46 Table 25 Culture Survey Participation by Cohort as of August 3, 2016 ...................................................... 48 Table 26 C3–C7 Aggregate Baseline and Followup Percent Positive Scores by Role Type for Each
Question in the ASC-SOPS .................................................................................................................... 51
AHRQ Safety Program for Ambulatory Surgery

Final Report 6
Executive Summary
Background
In the United States, more than 25 million surgeries a year are performed in over 5,300 ambulatory surgery centers (ASCs).1 National estimates regarding the number of healthcare-associated infections (HAIs) originating in ASCs are not available, and little is known about infection control and prevention practices in these settings. Current data related to surgical site infections (SSIs) and other HAIs come primarily from hospitals, which have an established infrastructure with personnel dedicated to infection control and prevention and HAI surveillance. This infrastructure is different in ASCs. Additionally, safe surgery goes beyond infections to a variety of other complications.
As a result, the Agency for Healthcare Research and Quality (AHRQ) funded a multicohort, quality improvement (QI) collaborative for the ambulatory surgery environment, entitled AHRQ Safety Program for Ambulatory Surgery, Contract HHSA2902010000251, PRISM Order Number: HHSA29032005T, ACTION II Task Order #5. The Health Research & Educational Trust (HRET)/American Hospital Association (AHA) was tasked with the management of the AHRQ project contract over a 4-year period from September 30, 2012, to September 29, 2016. The purpose of the contract was to adapt the Comprehensive Unit-based Safety Program (CUSP), which was initially developed for the acute care setting, for use in ASCs. The project was a collaborative effort with key partners, including Harvard T.H. Chan School of Public Health (HSPH), Ambulatory Surgery Center Association (ASCA), ASC Quality Collaboration (ASC QC), South Carolina Hospital Research and Education Foundation (SCHREF), Institute for Healthcare Improvement (IHI), and Westat.
The program goals were to reduce infections and surgical harms in ASCs through use of a surgical safety checklist and to improve safety culture through teamwork and communication. This report provides results from the evaluation of the impact of this program; summarizes information about the QI intervention; summarizes the technical and socioadaptive assistance provided to facilities, including educational activities such as Webinars, resources, and coaching calls; and outlines program enhancements and lessons learned during the contract period as well as recommendations for future QI initiatives in this health care setting. This program was the first of its kind to focus on a national implementation of a QI intervention within the ambulatory surgery setting.
Objectives
The objectives of this initiative were to modify the CUSP protocol and materials to be applied to SSI and other surgical complications in ambulatory surgery, including the development and use of a new survey on patient safety culture for ASCs.
Program Spread
The program implementation intended to include all States, the District of Columbia, and Puerto Rico through State-based or regional consortia or collaboratives in a phased approach. Overall, 665 facilities across 47 States participated in the program, potentially affecting 1,533,425 patient admissions and 2,220,374 procedures nationwide (Figure A).
AHRQ Safety Program for Ambulatory Surgery

Final Report 7
Figure A. Program Reach Map
The ASC program was structured initially with consortium leads (CLs) who functioned as intermediaries and project liaisons between the national project team (NPT) and ASCs. The CLs were tasked with disseminating educational activities, facilitating data submission, and coaching for improvement. The majority of the CLs came from State ambulatory surgery center associations or ASC management companies or both. Within the first two cohorts, it became clear that few of the associations had prior experience doing structured QI work, resulting in variable and inconsistent methods of coaching and mentoring participating facilities. Starting in Cohort 3, HRET, in conjunction with the HSPH, decided to fill that gap by using QI Advisors (QIAs) to work directly with the facility leads at each participating ASC. The QIAs were tasked with building relationships and coaching the facility leads in a virtual environment. This model provided a single point of contact for the facility leads and allowed for continuity of contact, which further enhanced relationship building.
Outcomes
Program impact was measured through the collection of data in four specific areas: outcomes, process, patient satisfaction, and patient safety culture. Participating facilities were required to collect and submit data on four outcome measures and one process measure (as applicable) as developed by ASC QC and required by the Centers for Medicare and Medicaid Services (CMS) Ambulatory Surgical Center Quality Reporting (ASCQR) Program. The four outcome measures were: Wrong site/side/patient/procedure/implant, Hospital transfer/admission, Patient fall, and Patient burn. The process measure was Prophylactic Intravenous Antibiotic Timing.
AHRQ Safety Program for Ambulatory Surgery

Final Report 8
Since the beginning of the program, participating facilities have reported very low rates of adverse outcomes. Outcome measures approached 0 percent, and observed changes do not appear to reflect improvement over time. Given such low rates, very large numbers of admissions and outcomes data would need to be analyzed in order to assess any significant changes.
Beginning in Cohort 3, facilities provided additional details on unexpected events. This data collection on unexpected events was designed to provide a more detailed look at other events that were taking place in centers that may have an impact on patient safety and care. As of May 24, 2016, 177 facilities submitted data on 4,745 unexpected events. Twelve percent of unexpected events reported across cohorts 3–7 were hospital transfer/admission and 10 percent were hospital/emergency department visits within 48 hours. In Cohort 6, same-day cancellations were also collected, accounting for 82 percent of all unexpected events collected for that cohort. Fifteen percent of all events collected were “other” events and were analyzed and recoded.
Additionally, evaluations indicated that program educational Webinars have led to 80 percent of participants’ stating they would make changes (n=1,418) within their facility. The changes included:
• adapting and implementing the surgical checklist• a focus on the checklist for the purpose of safety rather than as a task• auditing for checklist compliance• improving team building and communication between clinical areas• facilitating briefings and debriefings• using culture survey results to effect change• sharing data with clinical teams and encouraging their involvement in addressing
unfavorable trends• coaching staff to “speak up”• employing tactics to encourage physician engagement
Furthermore, Cohort 2 baseline and followup culture survey results indicated a significant improvement in responses to questions related to communication and teamwork. In the baseline versus followup analysis, the perception of team discussions significantly improved among all health care providers working in the operating room. In the baseline survey, 62.5 percent of respondents agreed with the survey statement “Team discussions (e.g., before or after procedures) are common,” compared to 67.7 percent in the followup (p=0.02). There was also a significant improvement in respondents’ perception of whether “Team members make sure their comments or instructions are heard.” 73.2 percent of respondents agreed to the survey statement in the baseline compared to 78.7 percent of respondents in the followup (p=0.006).
An analysis was performed to better understand program implementation results using data combined from cohorts 4–7 (“aggregate analysis”) for quantitative analysis and with data from Cohort 5 analyzed more deeply using a mixed-methods approach. The data demonstrated that continuous coaching led to improved checklist implementation. Specifically, the analysis supported a statistically significant correlation between the individual stages in checklist implementation (from checklist preparation to ownership to expansion and to improvement). The results revealed a distinct advantage for facilities that engaged in a longitudinal relationship with a coach. Specifically, both the absolute number of goals
AHRQ Safety Program for Ambulatory Surgery

Final Report 9
achieved and the stage of implementation attained were positively correlated with the number of coaching calls completed. The data support the notion that numerous interactions with a coach facilitated movement beyond simple process changes and closer to meaningful checklist use as manifested by full team engagement and communication.
ASC Toolkit
Several resources were developed throughout the project, including the ASC toolkit that supplemented the previously developed CUSP toolkit by providing educational materials tailored specifically to the ASC setting. The ASC Toolkit was developed for this population with input from content experts and was field-tested by ASCs before it was released for all facilities engaged in the program. The toolkit modules, videos, and tools focus on the following topic areas: coaching clinical teams, communication and teamwork in the surgical environment, patient and family engagement in the surgical environment, and sustainability. Guides were also developed to assist ASC staff in utilizing the resources in their facilities, along with slides, facilitator notes, and videos.
Lessons Learned
Key success factors in project implementation included: • leveraging existing QI structure and resources• coaching targeted to specific areas for improvement through trusted relationships• multiple participation opportunities• identifying a physician champion• leadership engagement
Adapting the surgical safety checklist required culture and behavior change. Challenges to successful QI in the ASC setting included:
• low data submission rates and lack of actionable outcome data• lack of a consistent and reliable feedback loop to ASCs when complications manifest outside of
the ASC environment• lack of dedicated, trained QI staff• staff turnover• realization that culture change is complex and takes time
Efforts to increase the availability of meaningful data, including longer-term followup, would be beneficial to more accurately assess outcomes in this setting and facilitate ASCs ability to follow patients after discharge. Until this is accomplished, the NPT recommends that future projects should concentrate on data collection processes that focus on short-term gains that are meaningful to ASCs. The NPT also recommends that ASC staff responsible for QI initiatives receive more comprehensive training prior to program enrollment to better prepare them for implementing similar QI programs in the future. A significant part of this training would include the importance of creating a QI team composed of ASC leadership and physicians to increase overall engagement in these initiatives. Facilities with experienced and dedicated QI staff are better positioned to effectively use this program’s toolkit to improve patient safety. This program demonstrated the benefit of coaching to provide a tailored approach to
AHRQ Safety Program for Ambulatory Surgery

Final Report 10
implementation. The NPT recommends that future large-scale, federally funded implementation projects include, when possible, some element of QI coaching to provide direct support and training to facilities.
AHRQ Safety Program for Ambulatory Surgery

Final Report 11
Report Organization This report is organized in five sections: project background, program development, ambulatory surgery center (ASC) implementation, program results, and lessons learned. A list of abbreviations used in this report is included in Appendix A.
AHRQ Safety Program for Ambulatory Surgery

Final Report 12
Project Background In the United States, more than 25 million surgeries a year are performed in over 5,300 ambulatory surgery centers (ASCs).1 This represents a greater-than-54-percent increase in the number of ASCs since 2001. In 2007, Medicare paid for more than 6 million surgeries performed in these facilities at a cost of nearly $3 billion.
National estimates regarding the number of healthcare-associated infections (HAIs) originating in ASCs are not available, and little is known about infection control and prevention practices in these settings. Current data related to surgical site infections (SSIs) and other HAIs come primarily from hospitals, which have an established infrastructure with personnel dedicated to infection control and prevention and HAI surveillance. This infrastructure is different in the ASC environment. Additionally, safe surgery goes beyond preventing infections to the prevention of a variety of other complications. Many of the services performed in these facilities extend beyond procedures traditionally thought of as surgery, including endoscopy and injections to treat chronic pain.
A February 2009 report from the Government Accountability Office highlighted the lack of information related to health outcomes and process measures in ASCs. ASCs have a compelling need for current and nationally representative data on HAIs in ASCs in order to reduce their risk. As a major first step in examining issues related to ambulatory surgery, the Agency for Healthcare Research and Quality (AHRQ) commissioned a study in August 2010 to conduct a proactive risk assessment of SSIs within the ambulatory surgery setting. The intervention proposed in the project final report targeted two important processes of patient care: infection control practices and communications between health care providers. AHRQ, as part of the U.S. Department of Health and Human Services’ National Action Plan to Prevent Healthcare-Associated Infections, contracted with the Health Research & Educational Trust (HRET) to implement a national Quality Improvement (QI) collaborative targeted at reducing SSIs and other complications in ASCs. This program was the first of its kind to focus on the national implementation of a QI intervention within the ambulatory surgery setting.
The goals of AHRQ’s Safety Program for Ambulatory Surgery were to:
• Reduce SSIs and other major ambulatory surgery complications.• Improve safety culture as evidenced by improved teamwork and communication by employing
a surgical safety checklist utilizing an adapted Comprehensive Unit-based Safety Program (CUSP)methodology to the ASC setting.
• Reach a total of 520 facilities representing all 50 States as well as Puerto Rico and the Districtof Columbia.
This program adapted the CUSP framework to the ASC setting and integrated a combination of clinical and cultural interventions. Tools and resources for the project included:
• the World Health Organization’s (WHO’s) Safe Surgery Checklist• teamwork and communication tools• evidence-based infection prevention practices• evidence-based surgical complication prevention practices
AHRQ Safety Program for Ambulatory Surgery

Final Report 13
Based on HRET’s experience with the national CUSP/Central Line-Associated Bloodstream Infections and CUSP/Catheter-Associated Urinary Tract Infections programs along with modified ASC and endoscopy-specific curriculums, anticipated benefits for ASCs participating in the program included:
• reduction in SSIs and other surgical complications• reduction in infections through improved cleaning, sterilization, and reprocessing of endoscopes
for the endoscopy cohort• improved patient safety culture• improved patient experience of care• improved provider and staff satisfaction
AHRQ Safety Program for Ambulatory Surgery

Final Report 14
Program Development The Agency for Healthcare Research and Quality (AHRQ) Safety Program for Ambulatory Surgery was a large quality improvement (QI) project with many stakeholders and a complex implementation structure that included education, coaching, peer support, and performance monitoring. In addition to having evidence-based practices and interventions, this project required the Health Research & Educational Trust (HRET) to have a solid project management structure with defined roles and clear expectations.
The program was designed as a 12-month project for each cohort of multispecialty ambulatory surgery centers (ASCs) and as a 9-month engagement for endoscopy centers enrolled in the endoscopy-specific cohort. At the end of each cohort, the national project team (NPT) offered an optional 6-month sustainability period to all participating facilities from cohorts 1-3, American Academy of Orthopaedic Surgeons (AAOS) pilot, and cohorts 4-6. Cohort 7 had a 1-month sustainability period because of the contract’s ending. When ASCs joined the project, they committed to the following activities:
• submission of baseline and monthly process and outcome data• participation in scheduled content and coaching Webinars• completion of baseline and followup safety culture assessments• working as a team to discuss progress and improve performance• participation in one-on-one coaching calls and learning groups led by a quality improvement
advisor (QIA)• providing feedback on program elements• assessing the patient experience
Key People
The NPT comprised the Health Research & Educational Trust (HRET) and partner organizations (Table 1) that brought their unique expertise to the program. Each partner played a significant role indeveloping, implementing, and/or sustaining segments of this program to provide the necessary benefits to the participants.
AHRQ Safety Program for Ambulatory Surgery

Final Report 15
Partners
Table 1. Partners Partner Role
Harvard T.H. Chan School of Public Health (HSPH)
Provided subject matter expertise related to implementation of the surgical safety checklist, including the development of educational content, coaching facilities, facilitation of learning groups, and overall program strategy
The Ambulatory Surgery Center Association (ASCA)
Provided strategic guidance and feedback to the program, focusing primarily on the recruitment of ASC members and overall marketing of the program
The ASC Quality Collaboration (ASC QC)
Offered expertise and input in program data and measurement, specifically insight on the development and collection of measures
The South Carolina Hospital Research and Education Foundation (SCHREF)
Provided guidance on the implementation of the surgical safety checklist through its collaborative work in South Carolina and with HSPH
The Institute for Healthcare Improvement (IHI) Offered strategic guidance and feedback for the overall program sustainability
Westat Developed a Culture Survey Assessment tool piloted to program participants. This tool was modified from the hospital culture survey assessment for use specifically in the ASC environment.
HRET Staff
To manage the range of activities and multiple deliverables associated with this project, HRET built an internal operations team and developed standardized processes to implement the project and monitor and report progress. HRET’s project management structure was based on the following functional areas:
• content development and dissemination• communications• data management• recruitment and relationship management• operations• contracts and financial management
Extended Faculty Network
The extended faculty network (EFN) was composed of clinical and subject matter experts from the following health care professional organizations:
• Accreditation Association for Ambulatory Health Care (AAAHC)• Association for the Advancement of Medical Instrumentation (AAMI)• American Association of Nurse Anesthetists (AANA)• American Academy of Orthopaedic Surgeons (AAOS)• Association of periOperative Registered Nurses (AORN)• Association for Professionals in Infection Control and Epidemiology, Inc. (APIC)• American Society for Gastrointestinal Endoscopy (ASGE)• International Association of Healthcare Central Service Materiel Management (IAHCSMM)• Society for Ambulatory Anesthesia (SAMBA)• Society for Healthcare Epidemiology of America (SHEA)• The Joint Commission (TJC)
AHRQ Safety Program for Ambulatory Surgery

Final Report 16
These individuals were recruited because of their extensive knowledge of the outpatient and ambulatory surgery setting. Representatives from State ambulatory surgery associations, including those in Arizona, California, Colorado, Idaho, Illinois, Massachusetts, and Washington, and ASC management companies, including AMSURG, Hospital Corporation of America (HCA), Surgical Care Affiliates (SCA), and United Surgical Partners International (USPI), provided extra input and expertise.
Each EFN member’s role was based on the member’s individual interest areas along with the need to fill in any identified programmatic gaps. The general areas for EFN contribution included, but were not limited to, recruitment and referrals, content development, clinical subject matter expertise, data, strategic guidance, and participation in learning groups.
Quality Improvement Advisors
The ASC program was structured initially with consortium leads (CLs) who functioned as intermediaries and project liaisons between the national project and ASCs. A majority of the CLs came from State ambulatory surgery center associations or ASC management companies or both. Within the first two cohorts, it became clear that very few of the State associations had prior experience doing structured QIA work, resulting in variable and inconsistent methods of coaching and mentoring participating facilities. Starting in cohort 3, HRET, in conjunction with the Harvard School of Public Health (HSPH), decided to fill that gap by hiring a QIA to work directly with the facility leads at each participating ASC. The role of the QIA in this program was to reinforce the messages taught on the educational Webinars. The Webinars offered a vast amount of information, and it became clear after the first few cohorts that the Webinars alone were not enough to instigate change. Given the large number of facilities participating in the program, it was not practical to provide onsite, in-person coaching. Instead, the QIA was hired to work remotely via one-on-one coaching calls and learning groups to provide additional support throughout the program.
As the number of facilities increased in Option Year 2, another QIA was hired to provide additional assistance. Both QIAs had extensive experience coaching in health care-related environments and were solely dedicated to this project. To gain more understanding of the uniqueness of the ASC environment, the QIAs visited several local ASCs, attended Ambulatory Surgery Center Association (ASCA) conferences, the AAAHC Achieving Accreditation Educational Seminar, and the Northeast ASC Conference.
The QIAs were responsible for coaching all facility leads in cohorts 3-7. Effective coaching largely depends on building a trusting relationship with the facility lead. To make this intervention scalable across hundreds of facilities spread throughout the United States, the QIAs were tasked with building relationships with facility leads without meeting them in person. Each QIA assumed a lead role for individual cohorts and acted as a coach for facilities within those cohorts. This was done to provide a single point of contact for the facility leads and to allow for some continuity of contact, further enhancing relationship building. To avoid any lapses in communication, the QIAs approached the work as a team by closely coordinating the outreach activities and by utilizing shared electronic notebooks to house all information collected from a given facility during coaching activities.
The QIAs worked closely with HRET staff to identify the most pertinent information needed during one-on-one calls. HRET staff built facility-level profile reports to allow simple snapshots of information
AHRQ Safety Program for Ambulatory Surgery

Final Report 17
about centers all in one place and eliminated the need to search for data points in several different places. These profiles were found to be especially useful for the QIAs as a means to quickly access facility-level data when preparing for calls.
Each facility was offered six one-on-one coaching calls during the course of the program. The calls, which were coordinated and facilitated by the QIAs, were designed to reinforce the messages taught on the educational Webinars. The initial calls focused on relationship building, assessing site readiness, and potential implementation challenges. Subsequent calls focused on reviewing data results, following up on program assignments, and providing overall implementation guidance. The QIAs integrated sustainability practices into their coaching by improving participants’ comprehension of quality, data, and process improvement. This approach also provided participants with the tools to continue to improve processes in their facilities.
QIAs also facilitated learning groups that were designed to provide an opportunity for facility leads to come together to learn from each other. The learning groups provided a unique chance to connect participating facilities with members of the program’s EFN, who served as the clinical experts in the ambulatory surgery environment. The learning groups were facilitated in the virtual environment and met five times (three times for the truncated endoscopy cohort) throughout the course of the program with 8 to 10 facilities attending each group.
Facility Recruitment
The program consisted of eight cohorts, representing 665 facilities located in 47 States and the District of Columbia (Figure 1).
Initially designed on a State-based CL model, lessons learned from the recruitment process during cohorts 1 and 2 led to a program redirection that focused more on national recruitment through professional organizations and associations.
Facilities in cohorts 1 and 2 were recruited into consortia led by a CL who served as the primary communication line for information from the NPT to project participants. CLs leveraged the relationships with their facilities to motivate them toward QI. For cohorts 1 and 2, consortia included multispecialty and single specialty ambulatory surgery facilities as well as hospital outpatient departments. Due to the recruitment and engagement difficulties mentioned above for cohorts 1 and 2, the program adjusted its recruitment approach for future cohorts.
AHRQ Safety Program for Ambulatory Surgery

Final Report 18
Figure 1. Program Reach Map
As part of the program redirection, freestanding, multispecialty ASCs were recruited on a national level as opposed to the State and management firm approach. Cohorts 3-5 and Cohort 7 were focused on freestanding, multispecialty ASCs that performed incision-based procedures. Additionally, two specialty-specific cohorts were created due to interest in program participation: orthopaedic surgery and endoscopy.
AAOS collaborated with members of the NPT to create the AAOS pilot cohort. This pilot program was open to any ASC owned by AAOS fellows or operated under a joint venture with another entity, so long as orthopaedic surgeons participated in governance. This was the first cohort in which recruitment focused primarily on physicians, which were the majority of AAOS members. Therefore, all content and training was tailored to meet the needs of the participants in the AAOS pilot.
The AAOS pilot program recruitment and engagement efforts were coordinated by the NPT and AAOS leadership. The AAOS leadership disseminated program materials and information to AAOS TeamSTEPPS® Master Trainers to encourage program enrollment and participation. Members of the NPT held eight strategy meetings and a Master Trainer event with AAOS to plan and implement the AAOS pilot cohort. The Master Trainer event allowed partners to convene in person to discuss past patient safety team training initiatives and determine which approaches would be most beneficial for the AAOS ASCs participating in the program. Additionally, informational articles about the program were widely distributed to the AAOS membership through weekly and monthly publications. Direct, targeted
AHRQ Safety Program for Ambulatory Surgery

Final Report 19
outreach was also performed by the AAOS staff to potential participants who had previously expressed interest in engaging in safety programs at their facilities.
The project also expanded its reach into endoscopy ASCs and developed an endoscopy-specific cohort, Cohort 6. Endoscopy ASCs perform a large subset of procedures in the outpatient setting. Though there are many potential harms that may occur in endoscopy-only centers, similar to multispecialty ASCs, this project decided to focus on a few measureable harms including wrong procedure, infection, breaks in communication, and hospital transfer/emergency department admission.
The recruitment efforts for cohorts 3-7 were coordinated by a recruitment workgroup composed of members from HRET, ASCA, ASC Quality Collaboration (ASC QC) and Harvard. This workgroup identified target States for recruitment and contacted key personnel from those States to spread the word about the program to interested facilities in their areas. Additionally, CLS Strategies, ASCA’s communication firm, sent targeted messaging to ASCs through the ASCA national subscriber email database. Members of the NPT also recruited at national conferences and meetings, including ASCA and APIC annual conferences, AORN Surgical Conference & Expo, and the APIC-ASC Infection Prevention Training Course, among others.
Recruiting Partnerships
ASCA and ASC QC were instrumental in recruiting interested facilities for the program. By utilizing their existing communication infrastructure with several thousand ASCA member facilities, the NPT was able to message the program to a wide range of ambulatory surgery facilities. Additionally, representatives from ASCA provided their expertise and connection to influential individuals in key target States to disseminate information about the program.
HRET also expanded efforts by engaging the assistance of ASGE. The ASGE Endoscopy Unit Recognition Program, which has more than 400 participating centers, was a vital resource in increasing the program reach to endoscopy centers. This cohort proved to be successful because a majority of the facilities were engaged throughout the program.
The QIAs engaged in multiple successful recruitment activities by attending conferences, networking with facility leads, and providing relevant information for leads to share with their extended networks. Several of these facility leads held leadership roles for large State consortia where they presented information on the program and recruited other ASCs within their State.
Curriculum
During this program, educational materials and content were taught through a combination of milestone meetings, educational Webinars, office hours, learning groups, and master trainer events. Members of the NPT customized the content to meet the needs of each of the cohorts while maintaining a core set of principles. The core set of principles includes enhancing communication and teamwork, meaningful use of a surgical checklist, and evidence-based infection prevention techniques. A breakdown of educational program events is described in Table 2.
AHRQ Safety Program for Ambulatory Surgery

Final Report 20
Table 2. Educational Program Events
Event Description # of Meetings *
Milestone Meetings
Milestone meetings were held with each cohort as an opportunity to touch base at each stage of the program. These meetings were held both virtually and in person and included a kickoff in the beginning of the program, a midcourse meeting around 6–7 months into the program, and a final meeting upon program completion. With program redirection, midcourse meetings were held as needed.
25
Educational Webinars
Educational Webinars were 60 minutes of Web-based training that was structured to include 45 minutes of content and 15 minutes of question and answer. Webinars were hosted by the NPT and covered topics in the areas of data collection and reporting, checklist and safety, and infection prevention.
74
Office Hours
Office hours were monthly calls facilitated by a member of the NPT and were a platform for participating facilities to discuss their barriers and successes, leverage peer-to-peer experience, and learn how to improve program goals. Office hours educational topics were informed by participants, EFN, and partners through the Office Hours Evaluation Survey as well as feedback from monthly partner and EFN calls. QIAs actively participated in office hours by facilitating discussion, encouraging online peer-to-peer communication, and answering questions.
35
Learning Groups
Learning groups were small group discussions facilitated by QIAs. Benefits of these interactions included creating a sense of community within the program, providing time to share success stories and challenges, and building lasting networking relationships for program participants. Discussion topics included physician engagement, how to conduct the debriefing at the end of a case, administering the culture survey, speaking up using structured language, and use of the QI framework.
122
Master Trainer Events
The Master Trainer events occurred annually throughout the project. These events focused on several train-the-trainer educational events on the topics of coaching, TeamSTEPPS teamwork and communication tools, and patient and family engagement within ambulatory settings.
4
EFN = extended faculty network; NPT = national project team; QI = quality improvement; QIA = quality improvement advisor
*Number of meetings between April 24, 2013, and September 29, 2016
Communication
Internal Communication
HRET staff and QIAs used the Extranet (SharePoint) to communicate internally regarding facility participation, sharing engagement dashboards and facility questions for followup. HRET staff compiled all aspects of the program engagement and data submission to create weekly cohort dashboards to summarize overall participation.
These dashboards provided information for the QIAs to use on their check-in calls to target facility opportunities for improvement throughout the program. Attendance on Webinars, data submission, and culture survey administration could be viewed together to gain a comprehensive picture of facility engagement.
AHRQ Safety Program for Ambulatory Surgery

Final Report 21
External Communication
Communication about program events and upcoming deadlines were a crucial component for the success of participating facilities. HRET communicated directly with participants through various communication mediums to provide timely, accurate updates regarding the program and facilitate the peer-to-peer sharing crucial to successful learning collaborative initiatives. A breakdown of external communication methods is described in Table 3.
Table 3. External Communication Methods Communication Medium Description Program Web site and email address
Central information location for project participants housing program education, resources, contact information, etc. The Web site also featured recruitment materials as well as private, password-protected sections available only to participating facilities. Additionally, in an effort to streamline communication, program feedback and questions were directed to the general program email address at [email protected].
Real Magnet A marketing and communication tool used to allow HRET staff to send email reminders of important updates and upcoming events which were not only attractive and engaging, but allowed for tracking and analytics of information viewed. This intelligence provided feedback needed to continuously improve the effectiveness of communication sent to participating facilities.
Newsletter HRET circulated a biweekly newsletter to communicate important dates, upcoming events, and program updates to participants. The newsletters were cohort specific to ensure centers received only the information that was most pertinent to them. QIAs contributed to the newsletter on a monthly basis to share best practices, implementation successes and challenges, and lessons learned from one-on-one calls and learning groups.
LISTSERV® At the start of Cohort 5, a LISTSERV was created to serve as a resource for the facilities. The primary goal of the ASC Safety Program LISTSERV was to provide centers a community to share information, education, and practical strategies. Since its inception in April 2015, more than 300 messages have been exchanged. Centers used the program LISTSERV to communicate with their ASC peers to share processes, outcomes, and progress related to topics such as QI project ideas, policies, reporting, and standard practices.
Monthly progress reports HRET provided monthly progress reports to facilities which included helpful links and contact information along with their progress to date to encourage participation and engagement.
ASC = ambulatory surgery center; HRET = Health Research & Educational Trust; QI = quality improvement
Program Resources and Sustainability
Several resources were developed for the program participants, and many of these resources will be housed on the AHRQ Web site for the public to access after program end, including the resources below.
ASC Toolkit
The ASC Toolkit materials were developed in 2013, using preexisting resources where possible to ensure alignment with other AHRQ materials such as TeamSTEPPS and the Comprehensive Unit-based Safety Program (CUSP) Toolkit. The modules created as part of this toolkit highlight specific CUSP themes and their applicability to surgical settings. In this toolkit, the modules, videos, and tools highlight
AHRQ Safety Program for Ambulatory Surgery

Final Report 22
the following themes: coaching clinical teams, communication and teamwork in the surgical environment, patient and family engagement in the surgical environment, and sustainability. A description of each module is included in Table 4.
Table 4. ASC Toolkit Modules Module Title Description
Coaching Clinical Teams This module of the toolkit looks at coaching clinical teams as a whole. It gives an overview of current team training in the health care setting and outlines the benefits of coaching for a team. After completing the module, people will be able to identify the characteristics of a good coach, demonstrate coaching steps when giving feedback to a team, and describe how an observation tool can improve performance. The module provides observational tools and approaches to assist people in further developing the coaching skills in their facilities.
Communication and Teamwork in the Surgical Environment
This module of the toolkit features the role of checklists, structured briefings and debriefings, and closed-loop communication in supporting effective teamwork and communication among surgical teams. The use of a checklist standardizes care outcomes and supports reductions in patient harm, errors, and near misses. After completing the module, people will be able to describe challenges with teamwork and communication in the surgical environment, use structured briefings to improve communication and teamwork, use debriefings and ongoing quality improvement, demonstrate how the checklist can improve teamwork and communication, and design a quality improvement initiative using closed-loop communication. This module includes a checklist use modeling vignette and a tabletop simulation vignette.
Patient and Family Engagement in the Surgical Environment
This module supplements the preexisting Patient and Family Engagement module of the CUSP Toolkit highlighting factors that are of particular importance in the surgical environment. After completing the module, people will be able to explain the importance of engaging patients and family members, determine the level of patient and family engagement at their facility, distinguish between different methods of engaging patients and family members, and apply engagement methods to the ASC setting. Video vignette segments highlight patient engagement in the operating room and in checklist implementation.
Sustainability This module focuses on project sustainability and augments the existing module of the CUSP Toolkit. This module provides learners with the practical aspects of project sustainability and describes how to build a foundation for sustainability, determining readiness for sustainability and explaining continuous quality improvement principles and how they align with and support sustainability. Using this module, people will be able to better understand the link between sustainability and spread, create and implement a sustainability plan, establish a sustainability measurement plan, and learn from examples of sustainability success. Two audio recordings with real ASC staff highlight the importance of sustainability and steps to ensure a sustainable project.
ASC = ambulatory surgery center; CUSP = Comprehensive Unit-based Safety Program
Module materials included instructional use guides, PowerPoint presentations, accompanying facilitator notes and activities for each module, three video vignettes, and supporting tools for each module. Materials from each module were incorporated into content calls and were also made available for participating centers on the ASC Safety Program Web site. Additionally, the toolkit modules were translated to Spanish.
AHRQ Safety Program for Ambulatory Surgery

Final Report 23
QI Template
Early in cohort 3, facility leads requested guidance on how to use the work they were doing in this program to also meet accreditation requirements. The QIAs created a draft of a QI framework designed to provide simple how-to steps facility leads could follow to conduct a QI study based on different aspects of the program curriculum. HRET staff, EFN, and program partners including accrediting agencies reviewed and contributed to the final version of the QI framework. The QIAs presented the document during office hours and used it as a teaching tool on one-on-one calls and learning groups. Several facility leads used the tool to frame QI studies for both program-related and unrelated projects. The facility leads shared their studies with the QIAs to obtain guidance and feedback as they refined them in preparation for sharing with an accreditation surveyor.
Implementation Guide
In Option Year 3, HRET, HSPH, the Institute for Healthcare Improvement (IHI), and APIC began a review process for sustainable resources to be utilized by ASCs after the program end. The implementation guide provides step-by-step guidance on how to implement use of the safe surgery checklist as a teamwork and communication tool within the ASC environment. The guide contains several resources used by and developed for AHRQ’s Safety Program for Ambulatory Surgery.
IHI Resources
For the final year of the program, HRET collaborated with IHI to develop key processes and resources to sustain the gains achieved during the program. This collaboration emphasized the following five steps to improving sustainability:
1. selecting changes that have achieved performance thresholds that should be sustained2. predicting their “stickiness”3. developing the infrastructure for sustainability4. continuous ongoing measurement5. making changes to support systems that will improve likelihood of sustaining the gains
Upon completion of their observations and site visits, IHI tailored their frontline management system into a series of short modules focused on the core components of the management system. These modules cover the following topics to compose a Sustainability Toolkit:
• Module 1: Overview• Module 2: Daily Huddles• Module 3: Problem Solving and Escalation• Module 4: Observation and Integration• Module 5: Visual Management Boards
AHRQ Safety Program for Ambulatory Surgery

Final Report 24
ASC Implementation
Registration, Onboarding and Education
During the registration process, participating ambulatory surgery centers (ASCs) identified a facility lead to serve as the individual primarily responsible for the program implementation at the ASC. This individual was provided with a welcome packet outlining the components of the program including a welcome letter, syllabus, facility demographics form (FDF) worksheet, estimated time commitment, and a team roster template. This information helped the facility lead build the implementation team and provided a greater understanding about the program structure and requirements.
To provide additional information about the facility, the lead entered information from the FDF into the comprehensive data system. This demographics information helped the national project team and quality improvement advisor (QIA) to better understand the size, staffing, and scope of services provided at the facility as well as previous efforts around quality improvement. Following submission of the FDF, facilities were sent a binder containing additional program materials for distribution to the team, including the culture survey forms for staff to complete and return to the facility in anonymized envelopes.
While the lead was building the implementation team and submitting demographics information, facilities began participating in milestone meetings, educational Webinars, office hours, and learning groups as outlined in the curriculum section. These events helped reinforce the initial program requirements (FDF, Culture Surveys, data submission) but also helped to energize program teams for their participation in the year-long program. Facilities were introduced to the QIA and walked through the curriculum topics. Demonstrations of the program Web site, LISTSERV, and newsletter communication helped facility teams understand how and where information for the program could be located.
Cohort Participation
Program cohorts targeted a multispecialty ASC audience, with the exception of the American Academy of Orthopedic Surgeons (AAOS) pilot, which was tailored to orthopedic ASCs, and Cohort 6 which targeted endoscopy-only ASCs. Table 5 shows overall cohort participation in the program.
Table 5. Cohort Participation Cohort # of Facilities Participation Dates
Cohort 1 53 April 2013–April 2014 Cohort 2 109 September 2013–September 2014 Cohort 3 69 April 2014–May 2015 AAOS pilot 12 September 2014–September 2015 Cohort 4 100 September 2014–October 2015 Cohort 5 103 March 2015–April 2016 Cohort 6 (Endoscopy-only) 119 July 2015–April 2016 Cohort 7 82 September 2015–July 2016
AHRQ Safety Program for Ambulatory Surgery

Final Report 25
QIA Outreach Activities
In 2 years, the QIAs have completed 964 calls and conducted 121 learning groups. Table 6 provides an overview of the QIA activities to date. Figure 2 illustrates center engagement in QIA activities.
Table 6. QIA Activities Cohorts 3–7 Cohort 3 AAOS
Pilot Cohort 4 Cohort 5 Cohort 6
Endoscopy Cohort 7 Totals
Enrolled Centers 73 12 100 104 116 76 481
Centers Reached by QIA
51 9 55 63 70 34 282
Calls With QIA 193 39 229 189 234 96 980 Learning Groups With QIA
40 6 25 19 15 17 122
QIA = quality improvement advisor
Figure 2. Center Engagement in QIA Activities
Notes: Percentages are based on the number of facilities that initially enrolled and did not withdraw over the 12-month program. Cohort 6 was a truncated cohort (only four calls and three learning groups were conducted).
Retaining facilities that struggled to participate in the program was an ongoing focus through each cohort. On occasion, the QIAs discussed concerns with facility leads regarding their challenges balancing competing priorities within their ASC. In many cases the QIAs successfully retained facilities by providing a realistic assessment of the workload and applying coaching strategies to break down the work into manageable tasks. When facility leads ultimately decided to withdraw from the program, the
AHRQ Safety Program for Ambulatory Surgery

Final Report 26
QIAs encouraged and facilitated their participation in future cohorts. The vast majority of these facilities successfully participated in the full program.
Staff turnover among facility leads also posed a significant challenge to the success of the facility and continued participation. While the majority of the leads remained constant for the year-long engagement, an unexpected departure created a leadership void and stalled implementation progress within the facility. In a few cases, the QIAs coached and facilitated a transition plan of program duties from an original facility lead to a new one. For many facilities, however, the removal of a lead resulted in all program work’s coming to a halt until a suitable replacement was identified. Even when a replacement lead was readily available, the competing priorities of adjusting to a new role typically overruled the work in this program. The result was often a very slow transition to the new lead’s assuming program responsibilities. While turnover was low among facility leads in this environment, when it did occur it was deleterious to a facility’s overall implementation progress within the program.
Program Evaluations
AHRQ’s Safety Program for Ambulatory Surgery collected participant feedback to provide useful, actionable, and timely information to Health Research and Educational Trust (HRET), participating facilities, and presenters. For educational events, polling questions, speaker evaluations, facility attendance, qualitative feedback, continuing education unit attainment, and HRET Voice of the Customer evaluations were collected. These evaluations assisted in curriculum development and maintenance. Figure 3 shows the evaluation results from 97 educational Webinars conducted from May 2013 to June 2016. Ninety-four percent of participants (n=1,616) stated that the amount of useful information and ideas provided was “Good” or “Excellent.” Ninety-six percent of participants rated the usefulness of the information and ideas provided to their facility as “Good” or “Excellent.” Ninety-three percent rated the chance that the information and ideas provided will improve effectiveness and results as “Good” or “Excellent.”
Figure 4 also shows the evaluation results from 97 milestone meetings and educational Webinars conducted from May 2013 to June 2016. Eighty percent of participants (n=1,418) stated they would make changes in their facility based on the information provided in the educational call or Webinar. The changes included:
• adapting and implementing the surgical checklist• focusing on the checklist for the purpose of safety rather than as a task• auditing for checklist compliance• improving team building and communication between clinical areas• facilitating briefings and debriefings• using culture survey results to effect change• sharing data with clinical teams and encouraging their involvement in addressing
unfavorable trends• coaching staff to “speak up”• employing tactics to encourage physician engagement
AHRQ Safety Program for Ambulatory Surgery

Final Report 27
Figure 3. Evaluation Results From Educational Webinars—Information Rating
Figure 4. Evaluation Results From Educational Webinars—Information Use
AHRQ Safety Program for Ambulatory Surgery

Final Report 28
Program Implementation contains an analysis on facility progress and changes made in the program, and Appendix B has examples of success stories from the program.
AHRQ Safety Program for Ambulatory Surgery

Final Report 29
Program Results
Program Implementation
As stated earlier, the program team experienced challenges associated with measuring or detecting meaningful change in the patient-level outcomes measures. The majority of procedures done in ambulatory surgery centers (ASCs) are low risk, and many do not require an incision (e.g., endoscopy). Many also have extremely low rates of surgical site infection (SSI) (e.g., cataracts). Once patients leave the ASC, it may be difficult to track surgical site infections or complications as followup may occur in a different care setting such as the emergency department (ED) or primary care physician office. As a result of these low infection rates, as well as systemic challenges to tracking patients after surgery, this program was not able to produce meaningful outcomes data related to morbidity and mortality. However, much could still be learned about potential programmatic impact on patient safety by analyzing process data. Underlying the decision to focus on process data was the assumption that if centers complete the process steps, then it was likely that they would achieve positive clinical outcomes. This was based on the premise that using the Safe Surgery Checklist does lead to better outcomes. Although outcomes could not be examined directly, how facilities progressed through the implementation process was explored. It was assumed that, if implementation could be better facilitated, outcomes would be improved. To this end, the quantitative and qualitative data gathered from 180 ASCs were aggregated and analyzed.
In previous safe surgery implementation projects, coaching had been a cornerstone of the implementation strategy. Coaches have worked to ensure adherence to best practices regarding implementation and facilitated collaborative problem solving to support continuous quality improvement (QI) in the centers. Coaches have also been effective in gathering intelligence from the frontlines to inform the intervention and develop tailored implementation approaches to meet the needs of stakeholders. Quality improvement advisors (QIAs) were hired starting in Cohort 3 to replace the function of the State consortium leads and begin coaching individual facility leads. In this role, the QIAs were in a unique position to work directly with the facilities to drive meaningful change during individual and group coaching activities.
Methods
To track their coaching activities, maintain records of facility progress, and display improvement over time, the QIAs documented every interaction with facility leads. The notes included detailed accounts of all activities along the implementation path as well as notes about the interactions between QIAs and leads and other information that the QIAs thought could influence the success of coaching.
A two-pronged approach was taken in the analysis with data combined from cohorts 4–7 (“aggregate analysis”) for quantitative analysis and with data from Cohort 5 analyzed more deeply using a mixed-methods approach. In this report, the results from Cohort 5 will be used to further illustrate certain aspects of the aggregate analysis. The QIAs started with Cohort 3 and, as this was the first time coaching was used in this setting, numerous changes were made along the way that included refining the coaching strategy and the method of documentation. For the purposes of the primary quantitative analyses, Cohort 3 was viewed as a trial run, and analyses began with Cohort 4. All the qualitative and
AHRQ Safety Program for Ambulatory Surgery

Final Report 30
quantitative data collected, including the facility demographics form (FDF) data for cohorts 4–7, were combined and analyzed for improvement over time compared to baseline (Table 7). Note that qualitative data was converted to numerical or categorical data for the analyses.
Table 7. Baseline Information Collected via the Facility Demographics Form (FDF)
Did the facility have a designated QI person?
Did the facility allocate dedicated time for QI activities?
Did the facility lead have experience working on other QI projects?
Self-reported rating of difficulty implementing QI at facility
Has the facility ever administered a patient safety culture survey?
Did physicians participate in the patient safety culture survey?
Did they report surgical safety checklist use?
QI = quality improvement advisor
In addition to baseline data, coaches documented all interactions with 180 ASCs. A scoring system was created to evaluate stepwise completion of the program. Through expert consensus, key scores were generated from several components to represent where facilities started and how they moved along the implementation pathway. Scores were based on presence or absence of components within each stage and included the following: baseline (11 components), prepare (7 components), own (3 components), expand (3 components), and improve (2 components). (Score criteria are listed in Table 8.) Partial correlation coefficients were used to assess the strength of the relationships between “stage scores” in the checklist implementation pathway, controlling for all prior “stage scores” on the pathway. The pathway was based on learning from similar work in South Carolina and other settings.
In order to explore the relationship between coaching and implementation success in greater depth, a mixed-methods analysis was conducted for Cohort 5. QIA notes were used from a subset of centers from Cohort 5 to better understand the effect of coaching and factors that affected the success of the implementation. Cohort 5 was chosen because it included a representative diversity of ASCs and typical level of program engagement. The qualitative component entailed a descriptive analysis of the detailed coaching notes. Coaching notes were organized to track the implementation journey taken by each center, including the goals set on each call, the call at which each goal was achieved (if ever), QIA notes about the coaching that was done on each call, and other reflections and comments about the call, such as a center indicating competing priorities or changes in staffing.
AHRQ Safety Program for Ambulatory Surgery

Final Report 31
Table 8. Implementation Categories and Criteria Collected by QIAs
BASELINE PREPARE OWN EXPAND IMPROVE
Facility demographics prior to SSC implementation
Initial SSC rollout Individual site customization of the SSC
SSC spread at the institution
Continuous QI to sustain the SSC
Formal QI training for facility lead(s)
QI team in place **
Physician involvement on QI team **
Coach-designated readiness score (0–5)
Administered patient satisfaction survey
Designated QI person
Dedicated time for QI
Other QI
Self-reported rating of QI difficulty
Patient safety survey administration and physician involvement
Reported checklist use
Filled out FDF
Completed culture survey
Reviewed culture survey results with staff and physicians
Built a QI team
Participated in program Webinars
Sent initial checklist
Sent modified checklist
Customized surgical safety checklist
Identified a physician champion
Held meetings to review customized checklist
Held staff training sessions on checklist use
Gathered staff feedback on use of modified checklist
Distributed checklist throughout the facility
Observation of checklist use in the operating room
Further checklist customization based on observations (continuous improvement)
QI = quality improvement; SSC = surgical safety checklist
** CUSP/TeamSTEPPS principle
These data were also linked with data on each center’s initial readiness score, number of calls completed, and the highest stage attained along the implementation pathway. Depending on the
AHRQ Safety Program for Ambulatory Surgery

Final Report 32
number of calls attended, the centers were categorized as having low engagement (1–2 calls), moderate engagement (3–4 calls), or high engagement (5–6 calls). The readiness score was a numerical rating of a center’s readiness to implement based on the QIAs’ beliefs about factors that may be associated with a center’s preparedness for successful implementation. The qualitative data were also numerically and categorically coded for use in statistical analyses.
Findings and Discussion
Successful implementation follows a pathway
Successful implementation of the safe surgery checklist appeared to be associated with following a pathway of progress through stages we refer to as baseline, prepare, own, expand, and improve. Success was defined at each stage using a score that measured the number of steps completed at that stage; higher scores indicated more steps being completed. Success at a preceding stage leads to a greater chance of success at the subsequent stage. Figure 5 summarizes the partial correlations and p-values along the hypothesized pathway for the 180 ASCs. The graphic shows that a higher “baseline” score was significantly associated with a higher “prepare” score (ρ=0.29, p<0.001). In turn, higher “prepare” scores were significantly associated with both the third step on the pathway (own; ρ=0.44, p<0.001) and the fourth step on the pathway (expand; ρ=0.24, p=0.001). A higher “own” score was significantly associated with both the “expand” score (ρ=0.43, p<0.001) and “improve” score (ρ=0.25, p=0.001). Finally, a higher “expand” score was significantly associated with improvement (improve; ρ=0.35, p<0.001).
AHRQ Safety Program for Ambulatory Surgery

Final Report 33
The combination of baseline and prepare activities set the stage for moving along the implementation path toward local ownership and expansion stages. Ultimately, this led to the “improve” stage where the checklist was customized, tested, put in place, and used in the facility. Given that the baseline score predicted preparation and movement in a positive direction along the path, it is possible that further analyses could tease apart and elucidate specific baseline factors that might predict success in future implementation programs. In this analysis, though, the baseline score highlighted the importance of having key factors in place prior to initiating a QI program.
Figure 5 shows how the stages in the implementation pathway correlated with one another. Figure 6 is a more in-depth depiction of how the facilities moved along the pathway. The majority of the 63 Cohort 5 facilities enrolled made demonstrable progress toward full implementation of the surgical safety checklist over the course of the program. The small number of facilities that reached the final stage probably reflects the limited amount of time of their program participation and the different places that centers started from when they entered the program.
More coaching calls leads to more implementation progress
Prior to enrollment, facilities were informed that the program included six coaching calls spread evenly over the year-long engagement. Early in the program, the QIAs reiterated the importance of attending all six calls, but attendance on these coaching calls varied widely (Table 9).
Figure 6: Cohort 5 Progression Through the Implementation Pathway (n=63)
Figure 5: Implementation Pathway (n=180)
AHRQ Safety Program for Ambulatory Surgery

Final Report 34
Table 9. Number of Coaching Calls Completed by Centers in Cohort 5 (n=63)
1–2 Calls (Low engagement)
3–4 Calls (Moderate engagement)
5–6 Calls (High engagement)
Percentage of centers 51% 27% 22%
Number of centers 32 17 14
The calls did prove to be important to the progress that centers made along the implementation pathway. Based on all cohorts, the number of calls that a center completed with a coach was positively correlated with higher “prepare,” “own,” “expand,” and “improve” scores (Table 10).
A robust multivariable linear regression model was generated for ordinal scores 2 to further explore the relationship between number of calls and improvement. With this analysis, it was not possible to determine how many calls were necessary to make change, but the analysis suggested that completing a greater number of calls moved centers along in a positive direction toward improvement (Appendix C).
Within Cohort 5, the number of calls a center completed had a strong positive association with the number of goals achieved (ρ=0.85, p<0.001). Also within this cohort, 9 out of the 14 centers (64 percent) that completed 5–6 calls (high engagement) reached the “improve” stage, and 5 of these centers accomplished every goal that was set as they progressed through the program. Further supporting the value of the coaching calls, 9 of the 10 centers that reached the “improve” stage (90 percent) participated in 5–6 coaching calls.
Table 10. Correlation Between Number of Calls and “Scores of the Stages” of Improvement (n=180)
Stage Pearson Correlation Coefficient p-value
Prepare 0.61 <0.001
Own 0.46 <0.001
Expand 0.39 <0.001
Improve 0.44 <0.001
The case of a facility lead who set nine implementation goals and successfully achieved all of them with the help of the QIA coaching, exemplified how coaching can help centers progress through the implementation process. At the beginning of the program, this facility lead expressed concern over the surgical safety checklist’s just being a “box-ticking exercise” that was not taken seriously by staff. The lead even noted that, in many cases, the checklist was completely filled out by staff prior to the start of
AHRQ Safety Program for Ambulatory Surgery

Final Report 35
a case. In line with the QIA’s coaching, the facility used its culture survey results to make the case for change with staff. Over time the facility built awareness of the problems in their safety culture, leveraged the support of physicians and staff to make changes, modified their checklist to emphasize better team communication, tested their modified checklist on a small scale, and were poised to expand use of the new checklist across their facility by the end of the program. This type of change over time, facilitated by coaching interactions, was observed in all of the highly engaged facilities that eventually achieved higher levels of success.
In contrast, of the 27 centers that completed 1–2 calls (low engagement), 26 did not make it past the “prepare” stage on the implementation pathway. The one who did complete the “own” stage did so only because the facility lead had previously participated in Cohort 3 (and completed activities in both “baseline” and “prepare”) before reenrolling in Cohort 5.
Despite the strong relationship between number of calls completed and implementation progress, fully participating in coaching calls did not guarantee significant progress along the implementation pathway. Three of the 14 “high engagement” facilities failed to make significant progress in the program and never moved beyond the “prepare” stage. As documented in the coaching notes, there was a combination of factors at play. Among some of these facilities, the QIAs noted a high degree of complacency regarding interpretation of the culture survey results. In these cases, the leads were resistant to acknowledge less favorable survey results that indicated a clear case for culture change. Despite significant time spent coaching the facility leads on the need for change, little progress was made in convincing them that there was work to be done to improve their safety culture. Without an understanding of the message being communicated from the staff via the culture survey, the leads were unable to make progress in this program. This is clearly a conclusion that the individual facility leads need to come to on their own terms.
Another common theme among facilities that were highly engaged but failed to make progress was the presence of multiple competing priorities within the facility. While the leads in these facilities were able to make the time to join coaching calls, making meaningful change requires significant time and resources beyond simply attending a 30-minute call every other month. However, given the high level of engagement on coaching calls among these facilities, this program likely built a solid foundation upon which improvement work can begin when, and if, sufficient time and resources exist in the future.
Impact of coaching on a standardized QI program
Before the QIAs were introduced, facilities were part of a standardized QI program composed of didactic Webinars and office hours. The decision to implement a coaching approach resulted from the clear need expressed by the ASCs for additional support. The QIAs facilitated this QI program using tailored coaching to meet the ASCs’ unique needs.
Reviewing the QIAs’ notes showed evidence of the tailored approach they took to coaching. The QIAs devoted early coaching calls to building a foundational relationship with the facility leads to set the stage for future success. As the QIAs gained a better understanding of each facility lead’s unique needs and implementation challenges, coaching strategies were tailored to meet the facilities where they were in terms of readiness and capacity to take on a complex QI initiative.
AHRQ Safety Program for Ambulatory Surgery

Final Report 36
Rather than adhering to a predetermined set of goals for each call, facility leads were given the opportunity to set their own incremental goals with guidance from the QIA. Each facility was allowed to progress at their own pace regardless of where fellow program participants were in the program. Facilities with greater capacity were challenged to set more advanced goals and move more rapidly through the curriculum, while a more conservative approach was taken with facilities that experienced greater implementation barriers. It appears that this individualized approach helped the leads identify attainable goals and allowed them to capitalize on small successes to build momentum to progress toward future success.
The tailored approach was illustrated by comparing the coaching calls for two facilities. In a small plastic surgery center, the facility lead was very engaged and had tremendous support from the surgeon owners. As a result, the coaching strategy was customized to move this facility more rapidly through the various stages of implementation. Goals were set on each call and typically achieved by the next check-in, resulting in significant implementation progress. In comparison, in a larger multispecialty facility, the lead needed to spend more time getting buy-in among the staff and surgeons. More coaching was devoted on earlier calls to help the lead build support for this work before moving too far along the implementation path. As the lead made progress obtaining the support needed to move forward, the coaching shifted to the next phase of implementation and eventually led to significant progress within this facility. The key to success in both facilities was the tailoring of coaching to meet the needs of the specific facility.
This tailored approach to setting goals and frequent followup with QIAs to address challenges, share in accomplishments, and develop the plan for the next short-term goal led to increased accountability with the facility leads. Timely followup conversations allowed the QIAs to provide coaching around goals that were not accomplished since the last call. Once a facility lead reported attaining a goal, the QIA took the opportunity to coach the facility lead to set additional goals. It seems that this coaching process served to facilitate progress along the implementation pathway. This approach was instrumental to the success of the ASCs in this program.
Factors contributing to low engagement
As the quantitative analysis showed, the number of calls a center completed was positively correlated with each step of the implementation pathway. Thus, it is important to examine the “low engagement” centers to better understand the reasons facilities did not fully participate in the program. Out of Cohort 5’s 63 centers that were in touch with the QIA at least once during the program, 27 were classified as “low engagement,” meaning they had only 1–2 calls with the QIA. Of these “low engagement” centers, 14 indicated a potential barrier to full program participation on the initial call. Barriers included lack of leadership support, competing priorities, lack of time and resources, or a combination. Four of the “low engagement” centers did not complete the program due to staff turnover, meaning the initial lead was no longer there (or was out on leave), and program responsibilities were not assigned to someone else. Nine of the “low engagement” centers did not give a reason for their lack of continued participation in the program.
AHRQ Safety Program for Ambulatory Surgery

Final Report 37
Summary
The data demonstrate that continuous coaching is associated with improved checklist implementation. Specifically, the analysis supports a statistically significant correlation between the individual stages in checklist implementation (from checklist preparation to ownership to expansion and to improvement).
The results revealed a distinct advantage for facilities that engaged in a longitudinal relationship with a coach. Specifically, both the absolute number of goals achieved and the stage of implementation attained were positively correlated with the number of coaching calls completed. The data support the notion that numerous interactions with a coach facilitate movement beyond simple process changes and closer to meaningful checklist use.
Facilities entered this program with highly variable stages of readiness to undertake this QI initiative, and where they started predicted how far they could go in a 12-month period. It can be observed from the pathway that a higher entry score at baseline predicted greater success moving through the pathway. With this understanding, it is unrealistic to expect all facilities to successfully move through all stages in the implementation pathway at the same time. Future programs like this should be designed to recognize and address this variability, potentially with tailored interventions designed to meet the facilities where they are. The addition of QIAs to coach facilities is one way to accommodate the variability and promote greater progression along the implementation path.
Program Measures and Data Sources
Program participants submitted their data monthly via the comprehensive data system (CDS) and used CDS’s reporting functions to view their results as well as aggregate rates for the program. Participants collected and submitted data for each of the measurement components according to the specific cohort. Table 11 details measurement components for all cohorts. Table 12 highlights the difference in measurement components for the endoscopy cohort. Appendix D contains a complete list of all clinical outcome measures, Appendix E, process measures, and Appendix F, demographic, participation, and cultural measures collected in the program.
The program team experienced challenges associated with measuring or detecting meaningful change in outcome measures. The majority of procedures done in ASCs are low risk, and many do not require an incision (e.g., endoscopy) or they have extremely low rates of surgical site infection (e.g., cataracts). Once patients leave the ASC, there is little to no followup from the centers themselves to track surgical site infections or complications. The value of data submission was not clear to many centers, because, with already low outcome rates, significant changes were not observable. Many facilities also reported a lack of time and resources to dedicate to data submission, and high attrition rates were seen throughout the course of each cohort. As a result of these low outcome and data submission rates and systemic challenges to tracking patients after surgery, this program was not able to produce valuable outcomes data. In an effort to show programmatic impact on patient safety, the national project team (NPT) decided to aggregate and analyze quantitative and qualitative data gathered from 417 ASCs.
AHRQ Safety Program for Ambulatory Surgery

Final Report 38
Table 11. Program Measurement Components—Across All Cohorts Components/ Specifications
Frequency Description
Facility Demographics • Program defined
data elements
Once, upon enrollment
• Facility and staff member demographics• Surgeries and procedures—types and volume• Current data collection, measurement, and monitoring efforts• Current QI, patient safety, and surgical checklist practices
Patient Safety Culture Assessment • C3 and beyond:
AmbulatoryProcedure/SurgeryCenter Survey onPatient Safety
Beginning and end of program
Assesses staff perceptions of key patient safety elements, such as: • Current checklist environment• Teamwork/Communication• Commitment to safety
Patient Satisfaction • Facility defined
Beginning and end of program
Overall satisfaction with the center or likelihood to recommend the center
In-Center Outcomes and Process Measures • ASC QC• CMS Quality Reporting
Program (QRP)
Monthly • Wrong site, wrong side, wrong patient, wrong procedure,wrong implant
• Hospital transfer/admission from the ASC• Patient burn• Patient fall• Prophylactic IV antibiotic timing (if applicable)
Unexpected Events As they occur, C3 and beyond
For each event listed below, facilities provide additional information including the procedure that took place in the ASC, date of the event, date of the procedure, reason for transfer/admission, and the manner in which the facility found out about the event: • Wrong side, site, patient, procedure, implant• Hospital transfer/admission from the ASC• Hospitalization or ED visit within 48 hours of discharge
from ASC• Reoperation within 48 hours of discharge from ASC• SSI• Other infection (non-SSI)• Canceled procedure• Other unexpected event
ASC = ambulatory surgery center; ASC QC = Ambulatory Surgery Center Quality Collaboration; C3 = Cohort 3; CMS = Centers for Medicare & Medicaid Services; ED = emergency department; IV = intravenous; QI = quality improvement; SSI = surgical site infection
AHRQ Safety Program for Ambulatory Surgery

Final Report 39
Table 12. Program Measurement Components—Endoscopy-Specific Cohort Components/ Specifications
Frequency Description
In-center outcomes and process measures • ASC QC• CMS Quality Reporting
Program (QRP)
Monthly For this cohort, which focuses on gastroenterology procedures, the only applicable ASC QC/CMS QRP measures are: • Hospital transfer/admission from the ASC• Patient fall
Unexpected events As they occur In addition to the components in Table 4, the Endoscopy cohort also collects this information: • Unplanned intervention (resolved in the ASC)
Knowledge assessment Beginning and end of program
Assessment to measure the participant’s knowledge prior to the safety program, assess the needs for education throughout the course, and determine knowledge gained from the program
ASC QC = Ambulatory Surgical Center Quality Collaborative; CMS = Centers for Medicare & Medicaid Services
Results
Data Submission
Data submission has varied across the program cohorts (Table 13). Rates are calculated based on active facilities.
Table 13. Percentage of Active Facilities Reporting Required Data as of August 1, 2016
Components/ Specifications
Cohort 1
(N=52)
Cohort 2
(N=97)
Cohort 3
(N=53)
AAOS Pilot (N=8)
Cohort 4
(N=46)
Cohort 5
(N=68)
Cohort 6
(N=76)
Cohort 7
(N=29)
Facility Demographics 100% 93% 100% 100% 96% 94% 96% 93%
Patient Safety Culture Assessment—Baseline 40% 86% 96% 100% 87% 78% 88% 83%
Patient Safety Culture Assessment—Followup 17% 51% 53% 25% 33% 29% 43% 21%
Patient Satisfaction—Baseline 83% 67% 44% 0% 41% 59% 68% 59%
Patient Satisfaction—Followup 0% 19% 2% 0% 4% 0% 0% 0%
Unexpected Events * N/A N/A 60% 0% 65% 49% 76% 66% In-Center Outcomes (ASC QC, CMS QRP measures)*
96% 90% 100% 100% 100% 100% 100% 100%
ASC QC = Ambulatory Surgical Center Quality Collaborative; CMS QRP = Centers for Medicare & Medicaid Services Quality Reporting Program
*Percentage of currently active facilities that reported at least one data point/event since program start
Outcome Measures
The outcome measure results, shown in Figure 7, point to the challenges this project faces in demonstrating impact. Rates for all outcome measures are very low with many at or close to 0 percent. The axis scales used in the reports have been selected to visually demonstrate the relatively small
AHRQ Safety Program for Ambulatory Surgery

changes that have been observed from one month to the next. However, these scales may create the perception of larger changes than those actually observed per 100 admissions.
Figure 7. Outcome Rates, Cohorts 1–7, AAOS Pilot
To evaluate program progress toward reducing harm, the NPT employed statistical modeling to assess changes over time for four outcome measures employed across the entire project: wrong site, wrong side, wrong patient, wrong procedure, wrong implant; hospital transfer/admission; patient burn; patient fall.
Negative binomial count models were used to assess the change in rates over the 12 months of the project. The numerator for the rate is the outcome variable for the model with the denominator entered as an offset. Time in months (divided by 11) is the predictor variable of interest so that month 1 can be entered as 0 and the last month of the project has a time value of 1. This was done because baseline data collection was considered optional and many facilities did not provide a baseline. Using time as a continuous variable to evaluate the program allowed the NPT to use all data submitted during the project without artificially creating “baseline” and “remeasurement” time periods. Having consistent preintervention baseline data would have allowed for a “before” and “after” element to the analysis, but this was not possible given the data. The primary limitation to conducting the analysis in this way is that any effect that occurred between the months preceding the project and the first month of the intervention cannot be reflected in the evaluation. Facility identifiers are entered as a random effect to account for the lack of independence of scores within the facility. A secular offset variable, calculated as the number of months between the start of Cohort 1and each subsequent cohort, was entered as a covariate to adjust for any large linear trends in rates between cohorts. This secular variable was not statistically significant in any of the models, so a categorical indicator for cohort was included instead.
Data from facilities in cohorts 1–7 and the American Association of Orthopedic Surgeons (AAOS) pilot have been included. After excluding inactive (disenrolled centers, those that had not submitted any outcome data, measures with a denominator of 0, and data points outside of the 12-month project period), 338 facilities were included in the analysis.
AHRQ Safety Program for Ambulatory Surgery Final Report 40

Final Report 41
Table 14 shows that there is no statistically significant impact of time in the project on any of the four outcome measures. Not all facilities included in the analysis had all measures, so the N for each measure is also shown. The cohort variable was not statistically significant for any of the four models. The NPT also tested for differences between cohorts and for the interaction of cohort and time, none of which showed a statistically significant effect.
Table 14. Incidence Rate Ratios of Having Outcome Event at Month 12 Relative to Month 1, Adjusted for Cohort
Outcome Measure Number
of Facilities
IRR (95% Confidence
Interval)
p-value
Wrong Site, Wrong Side, Wrong Patient, Wrong Procedure, Wrong Implant 287 0.72 (0.22–2.41) 0.60
Hospital Transfer/Admission 338 0.91 (0.73–1.13) 0.39 Patient Burn 279 1.03 (0.24–4.47) 0.97 Patient Fall 338 0.74 (0.40–1.39) 0.36
There was substantial attrition of facilities in reporting of data during the project in all four of these measures. The patient falls measure was affected the most by this, with 334 facilities reporting at month 1 and only 60 reporting at month 12. To address the impact of attrition on changes in these outcome measures, the NPT ran additional models to test for an interaction between time and the number of measures contributed by a facility. This interaction was statistically significant for the patient burn measure (p=0.026). However, an additional model among the 183 facilities with at least 10 months of reporting a patient burn measure showed no statistically significant impact of time (incidence rate ration (IRR)=0.64 [95% confidence interval (CI) 0.11–3.67], p=0.62).
Individual cohort outcome measure results can be found in Appendix G.
Unexpected Events
After observing low rates of reported outcome measures, the NPT decided to collect additional data about specific unexpected events. Given that the unexpected events were reported to be infrequent, the program team designed its data collection approach to minimize data collection burden on the sites.
For each occurrence of an unexpected event, facilities were expected to report additional data about the event. The program team provided data collection worksheets to facilitate the collection of additional data. For Cohort 6, the program team adjusted the unexpected events data collection workbooks to align with the participating endoscopy centers’ characteristics.
Table 15 presents information for the two unexpected events that were reported across all cohorts.
AHRQ Safety Program for Ambulatory Surgery

Final Report 42
Table 15. Unexpected Events, Cohorts 3–7, Data as of May 24, 2016 Event description Percent of all
facilities reporting events
Number of events reported
Percent of all events reported
Hospital Transfer/Admission from the ASC 73% 552 12% Hospital Admission/ED Visit within 48 hours of discharge from the ASC 58% 479 10%
ASC = ambulatory surgery center; ED = emergency department
For the two events reported in Table 15, facilities were asked to provide the reason(s) for hospital transfer/admission or postprocedural hospital admission or ED visit. Facilities were provided with a list of reasons to choose from and could also select “other” and describe the reason. Table 16 presents the selected reasons these events took place. Note that facilities could select more than one reason per event.
Table 16. Reasons for Hospital Transfer/Admission From the ASC (Minus “Other” Reasons), Data as of May 24, 2016
Reason for Hospital Transfer/Admission From the ASC Number of Times Cited
Vital signs unstable 79 Airway management/concerns 78 Cardiac issue 74 Chest pain 47 Pain control 35 Abdominal pain 35 Bleeding 28 Altered mental status 17 GI issue (nausea, vomiting, constipation) 10 Suspected bowel perforation 8 Colon/bowel issue 3 Intractable nausea/vomiting 3 Fever 2 Failure to void 2 Allergic reaction 1 Sedation-related issue 1
GI = gastrointestinal
Even with the comprehensive list of reasons shown in Table 16, many facilities cited “other” reasons the events took place. The program team performed additional qualitative analyses on these other reasons (n=218) to better understand the unexpected events. Using an inductive approach for the 211 “other” events that had accompanying text, cardiac events (approximately 20 percent) were the most common “other” reason for hospital transfer/admission (Table 17). As this already has an existing code, clinicians should be encouraged to use this code rather than the “other” box. Low oxygen saturation and aspiration/vomiting were reported less frequently but could potentially be included as new codes for reasons for hospital transfer/admission. All of the “technical errors” reported were due to bowel (or colon) tears and should be coded under the existing “suspected bowel perforation” code. Overall, if facilities code into the correct, existing codes, the ones that go into the “other” category will be very small.
AHRQ Safety Program for Ambulatory Surgery

Final Report 43
Cohorts 3, 4, 5, and 7 provided additional data for the events, reported in Table 18.
Additional information about the events listed in Table 18 is provided in Tables 19 and 20.
Cohort 6 provided additional data for the events, reported in Table 21.
Nineteen unplanned intervention events reported a “sedation-related issue.” The program team followed up with the facilities to find out if a reversal agent was used for these events. Of the 11 facilities (17 events) we contacted, one facility reported use of Narcan® and Romazicon.
Table 17. “Other” Reasons for Hospital Transfer/Admission for Cohorts 3–7, Data as of May 24, 2016
Category Number of Coding References Cardiac 45 O2 Sat_low 15 Technical errors 13 Aspiration_vomiting 12 Loss of consciousness 8 Respiratory 8 Hematology_bleeding 7 Pain 7 Arthroscopy 6 Hypertension 6 Seizure 5 Digestive system obstruction 4 Dehydration 3 Fall 2 Stroke 2 Altered mental status 1 Reaction to med product 1 Unexpected operative findings 1
O2 = oxygen
Table 18. Unexpected Events Collected in Cohorts 3, 4, 5, and 7, Data as of May 24, 2016
Event Description
Percent of All Facilities Reporting Events
Number of Events Reported
Percent of All Events Reported
Reoperation within 48 hours of discharge from the ASC 26% 57 4%
Surgical site infection 35% 143 9%
Other infection (non-SSI) 9% 17 1% ASC = ambulatory surgery center; SSI = surgical site infection
AHRQ Safety Program for Ambulatory Surgery

Final Report 44
Table 19. Reasons for Reoperation, Data as of May 24, 2016 Reason for Reoperation Number of Times Cited Bleeding/hematoma 32 Other 17 Unknown/unable to determine 5 Wound disruption 4 Retained foreign body 1
Table 20. Types of Surgical Site Infection Reported, Data as of May 24, 2016 Type of SSI Count Superficial incisional infection 101 Deep incisional infection 27 Unknown/UTD SSI 12 Organ space infection 3
SSI = surgical site infection; UTD = unable to determine
Table 21. Additional Unexpected Events Collected in Cohort 6, Data as of May 24, 2016
Event Description Percent of All Facilities Reporting Events
Number of Events Reported
Percent of All Events Reported
Unplanned intervention resolved in the ASC 42% 92 3% Same-day canceled procedure 75% 2,602 82% ASC = ambulatory surgery center
Reasons for same-day cancellations were examined in Cohort 6, with the most common reasons being inadequate prep by patient, patient being medically unstable for procedure, patient having no chaperone home, or a combination (Table 22).
Table 22. Reasons for Same Day Cancellations, Data as of May 24, 2016 Reason for Same-Day Cancellation Number of Times Cited Inadequate prep by patient 445 Medically unstable for procedure 288 No chaperone home 87
Cohort 7 was asked to provide additional data for one specific event, as reported in Table 23.
Table 23. Additional Unexpected Event Collected in Cohort 7, Data as of May 24, 2016
Event Description Percent of All Facilities Reporting Events
Number of Events Reported
Percent of All Events Reported
Canceled surgery due to medical reason 48% 104 32%
Facilities were provided with an option to select “other unexpected event” (Table 24), and provided descriptive information about the event. Approximately 15 percent of all the unexpected events data was coded as “other” and collected as narrative in an accompanying text box. Codes were created, using an inductive approach, to characterize the kinds of events that had been coded as “other.” Events
AHRQ Safety Program for Ambulatory Surgery

Final Report 45
were coded along three dimensions: the type of event (e.g., unexpected preoperative findings), the location of the event (e.g., pre-op), and the response to the event (e.g., procedure canceled_delayed).
This process revealed patterns of more common events as well as rare events. The most commonly occurring “other” events can be categorized as:
• unexpected preoperative findings (approximately 25% of “other” events); for example, highblood pressure, fever, high glucose, new onset atrial fibrillation
• patient unprepared for procedure (approximately 8% of “other” events)
Data were commonly miscoded where an event that had an existing code was instead placed in “other.” Clinicians appeared to use the “other” field to describe or tell the story of the event that took place. In this situation, it is recommended that a text or comment box be added alongside specified codes to allow clinicians to document their explanation for a coded event. A comment box for storytelling might help sites categorize correctly. They should be trained to use this text box rather than the “other” category.
AHRQ Safety Program for Ambulatory Surgery

Final Report 46
Table 24. “Other” Events—Characterization of Event Category Number of
Coding References Unexpected preoperative findings 211 Pt unprepared 72 IV infiltrate 41 Unexpected operative findings 35 Hematology_bleeding 30 Vitrectomy related 30 Cardiac 29 Eye related 25 Fall 24 Pain 22 Patient info error_consent error 18 Technical errors 18 Equipment_supplies 17 Prolonged recovery 17 No show_late cancellation 16 Respiratory 16 Medication error 14 Wound_incision_abscess 14 Tongue_lips_eyes 12 Issue resolved 11 Tooth damage_loss 10 Aspiration_vomiting 8 Random accidents 8 Needle sticks 7 Reaction to med_product 7 Specimen error 7 Departed AMA 6 DVT 4 IV insertion 4 Needle count 3 Post-op fever 3 Power outage 3 Wrong side 3 Altered mental status 2 Catheter 1
DVT = deep vein thrombosis; IV = intravenous; PT = patient
In addition, if sites are allowed to write in “other,” there should be more guidelines in place on how to record this information so it is useful. An example of this could be to provide specific details in the text box, like whether the event took place in pre-op versus surgery and the response to the event (e.g., procedure canceled). When there are existing codes, facilities should be properly trained and encouraged to use them.
The events also indicate that the kinds of “other” events reported vary by facility and may correlate with the procedures commonly performed at the facility (such as vitrectomies at facilities that perform eye procedures and unexpected operative findings at facilities that perform colonoscopies). As a recommendation, ASCs may want to customize their data collection for internal purposes.
AHRQ Safety Program for Ambulatory Surgery

Final Report 47
In regard to “other” events, unexpected preoperative findings and inadequate preoperative patient preparation both led to higher than necessary rates of cancellations and delayed procedures. This highlights the need for improved preoperative processes and coordination to decrease the percentage of unprepared patients. Same-day cancellations have potential short- and long-term consequences for patient health and overall well-being. Patients who have to wait to reschedule might not be able to return to work during this time and, for some elected procedures, might not return to the ASC at all. Unanticipated case cancellations also lead to a waste of resources.
Process Measures
For the endoscopy-specific cohort, a knowledge assessment was developed to assess the participants’ knowledge at the beginning and at the end of the program. The knowledge assessment contains five questions in the content areas of surgical safety checklist use, teamwork and communication, scope processing, and sedation safety. Three hundred thirty-three individuals across 42 facilities participated in the baseline assessment. Facility leads received knowledge assessment reports that compared their facilities’ scores against the overall cohort’s scores, as well as curriculum resources and performance improvement tools such as a sample Plan-Do-Study-Act worksheet. Seventy-nine individuals across 13 facilities participated in the followup assessment in April 2016. Only 10 of those facilities had completed both the baseline and followup assessments, and only 4 facilities had more than five individuals complete both periods. Therefore, significant differences in average knowledge assessment scores cannot be ascertained. Overall results across the four categories are depicted in Figure 8.
Figure 8. Knowledge Assessment Results for Cohort 6 (Endoscopy)
Culture
Measuring patient safety culture in the ambulatory surgery environment was a key component to further the implementation of the World Health Organization (WHO) Surgical Safety Checklist and infection prevention techniques taught through this program’s curriculum. Using the culture survey as a
68% 82% 79% 72% 79% 83% 81% 74%
0%
20%
40%
60%
80%
100%
Use of the Checklist Teamwork andCommunication
Scope Processing Sedation Safety
Perc
ent o
f Cor
rect
Res
pons
es
Knowledge Assessment Categories
Cohort 6 Baseline and Follow Up Knowledge Assessment Average Scores by Category
Baseline, n= 333 Follow Up, n= 79
AHRQ Safety Program for Ambulatory Surgery

Final Report 48
measurement tool allowed facility leads and the implementation teams to better understand specific areas where their facilities could improve and increase buy-in among staff, physicians, and management to change clinical and behavioral practices.
Participating facilities were encouraged to administer a culture survey at the beginning and end of the program. Cohort 1 and Cohort 2 administered a culture assessment developed by the Ariadne Labs team at the Harvard School of Public Health. This assessment was based on a tool used to measure clinicians’ perspectives related to teamwork, communication, and respect in operating rooms (ORs) across the State of South Carolina. Starting with Cohort 3, the Ambulatory Surgery Center Survey on Patient Safety (ASC-SOPS) was distributed to the remaining cohorts. The overall survey participation numbers are listed in Table 25; however, it is important to note that the analyses for cohorts 2-4 are limited to surveys done at facilities that completed both the baseline and followup surveys.
Table 25. Culture Survey Participation by Cohort as of August 3, 2016
Cohort
Number of Facilities That Completed Surveys Number of Surveys Completed
Baseline Percent Followup Percent Baseline Percent Followup Percent
1 21 40% 9 17% 485 N/A 164 N/A
2 83 86% 49 51% 1,730 N/A 826 N/A
3 54 81% 27 48% 1,750 63% 608 28%
4 46 78% 16 29% 1,404 51% 533 27%
AAOS 9 75% 2 22% 319 38% 63 12%
5 56 80% 20 30% 1,685 44% 450 12%
6 70 88% 33 42% 1,757 61% 728 27%
7 26 79% 6 20% 1,027 44% 112 4%
Overall 365 78% 162 36% 10,175 52% 3,516 18% AAOS = American Academy of Orthopaedic Surgeons; N/A = not applicable
Cohort 1 Culture Survey Results
For Cohort 1 facilities, baseline and followup analyses were conducted; however, due to the small number of centers that participated in the followup administration, the NPT were not able to make any conclusions based on the results.
Cohort 2 Culture Survey Results
In the pre- versus followup-analysis for Cohort 2, the perception of team discussions significantly improved among all health care providers working in the operating room. In the Cohort 2 baseline survey, 62.5 percent of respondents agreed with the survey statement “Team discussions (e.g., before or after procedures) are common,” compared to 67.7 percent in the followup (p=0.02). There was also a significant improvement in respondents’ perception of whether “Team members make sure their comments or instructions are heard.” 73.2 percent of respondents agreed to the survey statement in the baseline compared to 78.7 percent of respondents in the followup (p=0.006). Furthermore, there was a significant increase in the percentage of respondents who would want a safety checklist used if
AHRQ Safety Program for Ambulatory Surgery

Final Report 49
they were having a procedure in the preanalysis compared to the followup, 88.2 percent in the baseline compared to 91.8 percent in the followup (p=0.01).
When analyzing the data according to physicians and nonphysicians separately, there were significant improvements in the perception of the tone of physicians throughout operations in both groups. When comparing baseline versus followups in Cohort 2 there was about a 10-percent improvement among physicians (p=0.002) and a 6-percent improvement among nonphysicians (p=0.04) on how they responded to the survey statement “Physicians maintain a positive tone throughout operations.”
Cohort 3 Culture Survey Results
In Cohort 3, the baseline versus followup analysis was limited due to the small number of centers that completed both the baseline and followup. This was further limited by the small number of respondents in each survey phase. Nevertheless, there were significant improvements in the perceptions of feeling empowered to speak up when appropriate among nonphysician respondents. For the statement “Key information about patients is missing when it is needed,” about 21.0 percent of all respondents agreed with this statement in the followup compared to 32.3 percent in the baseline, representing an 11-percent improvement (p=0.008).
Cohort 4 Culture Survey Results
There were 13 centers that completed both the baseline and the followup. The findings were limited due to the small number of respondents in each survey phase, and no statistically significant results were found in a baseline and followup comparison.
Cohorts 5-7 Baseline Results
Baselines from centers in cohorts 5-7 were included in the analysis. Similar to the pre/post-analysis performed in Cohort 4, responses were dichotomized into agree/strongly agree and strongly disagree/disagree/neither agree nor disagree, and analysis was confined to respondents who typically work in the procedure/surgery room. Physicians included anesthesiologists and surgeons. Nonphysicians included all other professionals who reported routinely working in the procedure/surgery room.
The findings from the three cohorts highlight that there are statistically significant differences between physicians and nonphysicians. In Cohort 5, 80.2 percent of nonphysicians agreed with the statement “We have enough staff to handle the workload” compared to 96.4 percent of physicians (a 16% difference) (p<0.0001). This statistically significant difference was also seen in Cohort 6 and Cohort 7. There was also a statistically significant difference among physicians and nonphysicians in their perception of whether their “ideas and suggestions are valued.” In Cohort 6, 67.8 percent of nonphysicians agreed with this statement compared to 95.1 percent of physicians (an approximately 27% difference) (p<0.0001). This difference was also observed in Cohort 5 and Cohort 7. The perception of whether staff are treated fairly when they make mistakes also differed between physicians and nonphysicians. In Cohort 7, 73.7 percent of nonphysicians agreed with the statement that “staff are treated fairly when they make mistakes” compared to 92.4 percent of physicians (an 18.7% difference) (p<0.0001). Similar to the other previous statements, this difference was also observed in Cohort 5 and
AHRQ Safety Program for Ambulatory Surgery

Final Report 50
Cohort 6. Overall, nonphysicians typically had a less favorable perception of surgical safety than physicians in the operating room environment in ASCs.
Manuscript Pending “Perception of Safety Surgical Practice Among Healthcare Professionals who Work in an Operating Room in Ambulatory Surgery Centers in the United States: A Retrospective Analysis of Survey Data”
In a submitted manuscript, additional analyses were completed to study the baseline survey results from a more defined population of respondents. The analysis included only those respondents who reported that they are typically in the procedure/surgery room during procedures. Professional roles were clearly categorized as physicians (including anesthesiologists, doctors, physicians, and surgeons), advanced practice clinicians (physician assistants, certified registered nurse anesthetists, and nurse practitioners), and “other group” (management, clinical staff, clinical support staff, administrative, or other).
The study included data from 137 ASCs in 37 States and found that, overall, respondents reported high levels of safety culture. However, there were differences in the perception of safe surgical practice in ASCs when nonphysicians were compared to physicians. Most physicians had a more positive perception of safe surgical practice when compared to nonphysicians.
Table 26 shows the aggregate baseline and followup ASC-SOPS results from cohorts 3–7 and AAOS Pilot for all respondents, physicians (includes doctors (nonanesthesia), surgeons, and anesthesiologists) and nonphysician clinical staff (those who work in the operating room, pre-op, or post-op).
AHRQ Safety Program for Ambulatory Surgery

Final Report 51
Table 26. Cohorts 3-7 Aggregate Baseline and Followup Percent Positive Scores by Role Type for Each Question in the ASC-SOPS
Baseline Followup
All Respondents
(n=7,621)
Physician (n=
1,756)
Non- physician Clinical
Staff (n=4,568)
All Respondents
(n=2,414)
Physician (n=455)
Non- physician Clinical
Staff (n=1,536)
Section A: Working in This Facility Percent Reporting Most of the Time/Always to Statement
1. Important patient careinformation is clearly communicated across areas in this facility.
94% 99% 93% 95% 99% 94%
2. We feel comfortableasking questions when something doesn’t seem right.
92% 99% 90% 92% 99% 90%
3. We have enough staffto handle the workload. 82% 97% 78% 83% 96% 79%
4. When we see someonewith more authority doing something unsafe for patients, we speak up.
85% 96% 82% 87% 97% 85%
5. Key information aboutpatients is missing when it is needed.
5% 5% 4% 5% 9% 4%
6. Our ideas andsuggestions are valued in this facility.
75% 94% 68% 76% 93% 72%
7. We share keyinformation about patients as soon as it becomes available.
94% 99% 92% 94% 99% 92%
8. There is enough timebetween procedures to properly prepare for the next one.
82% 98% 76% 82% 97% 77%
9. Within this facility, wedo a good job communicating information that affects patient care.
93% 99% 91% 93% 99% 91%
10. We feel rushed whentaking care of patients. 12% 4% 16% 11% 5% 14%
AHRQ Safety Program for Ambulatory Surgery

Final Report 52
Baseline Followup
All Respondents
(n=7,621)
Physician (n=
1,756)
Non- physician Clinical
Staff (n=4,568)
All Respondents
(n=2,414)
Physician (n=455)
Non- physician Clinical
Staff (n=1,536)
Section B: Teamwork and Training Percent Reporting Agreeing or Strongly Agreeing to Statement
1. When someone in thisfacility gets really busy, others help out.
89% 97% 87% 90% 96% 89%
2. Staff who are new tothis facility receive adequate orientation.
84% 96% 80% 83% 94% 80%
3. Staff feel pressured todo tasks they haven’t been trained to do.
8% 3% 9% 7% 5% 8%
4. Doctors and staffclearly understand each other’s roles and responsibilities.
86% 98% 84% 87% 96% 86%
5. We get the on-the-jobtraining we need in this facility.
87% 96% 85% 88% 94% 87%
6. Our facility allowsdisrespectful behavior by those working here.
14% 5% 17% 14% 5% 16%
7. Staff get the refreshertraining they need. 81% 94% 79% 83% 93% 81%
8. We work together asan effective team. 91% 99% 89% 91% 98% 91%
Section C: Organizational Learning/Response to Mistakes Percent Reporting Agreeing or Strongly Agreeing to Statement
1. This facility activelylooks for ways to improve patient safety.
93% 98% 91% 93% 97% 92%
2. Staff are treated fairlywhen they make mistakes. 81% 96% 77% 83% 95% 81%
3. We makeimprovements when someone points out patient safety problems.
93% 97% 91% 93% 99% 92%
4. Learning, rather thanblame, is emphasized when mistakes are made.
78% 94% 74% 79% 93% 76%
5. Staff are told aboutpatient safety problems that happen in this facility.
85% 96% 82% 87% 95% 85%
6. We are good atchanging processes to make sure the same patient safety problems don’t happen again.
90% 97% 88% 91% 97% 90%
AHRQ Safety Program for Ambulatory Surgery

Final Report 53
Baseline Followup
All Respondents
(n=7,621)
Physician (n=
1,756)
Non- physician Clinical
Staff (n=4,568)
All Respondents
(n=2,414)
Physician (n=455)
Non- physician Clinical
Staff (n=1,536)
Section D: Near-Miss Documentation Percent Reporting Most of the Time/Always to Statement
1. When somethinghappens that could harm the patient, but does not, how often is it documented in an incident or occurrence report?
87% 95% 84% 90% 96% 87%
Section E: Management Support for Patient Safety Percent Reporting Agreeing or Strongly Agreeing to Statement
1. Managers encourageeveryone to suggest ways to improve patient safety.
87% 96% 84% 88% 95% 87%
2. Management examinesnear-miss events that could have harmed patients but did not.
89% 97% 86% 89% 97% 87%
3. Management providesadequate resources to improve patient safety.
89% 98% 86% 90% 97% 88%
Section F: Overall Rating Percent Reporting Very Good/Excellent to the Statement
1. Please give your facilityan overall rating on patient safety.
89% 98% 85% 90% 98% 88%
Section G: Communication in the Procedure/Surgery Room Percent Reporting Most of the Time/Always to Statement
1. Just before the start ofprocedures, all team members stopped to discuss the overall plan of what was to be done.
91% 97% 87% 92% 98% 89%
2. Just before the start ofprocedures, the doctor encouraged all team members to speak up at any time if they had any concerns.
63% 80% 53% 68% 84% 61%
3. Immediately afterprocedures, team members discussed any concerns for patient recovery.
72% 85% 65% 77% 88% 72%
AHRQ Safety Program for Ambulatory Surgery

Final Report 54
Culture Survey Results Summary
In addition to highlighting interesting results about culture in the ASC environment, the culture survey also proved to be a useful coaching tool. The baseline culture survey results provided a snapshot in time of the ASCs’ culture and served as the spark for initial conversations about QI between QIAs and facility leads. The QIAs coached facility leads to use the culture survey results to tailor aspects of this program’s curriculum to meet the needs of their organization.
The culture survey also served as a marker of engagement in the program. If the facility did not complete the baseline survey, it was typically not engaged throughout the rest of the program. Facility leads reported the following reasons for not completing the followup survey: lack of engagement in the program, too-limited turnaround time between the baseline and followup surveys, and the burden of survey completion. Even among those who did complete the followup survey, it is important to note that this work (improving a culture of safety) is ongoing and that such fundamental, systemic changes take longer than 12 months.
Patient Satisfaction
Patient satisfaction was collected twice during the cohort—upon enrollment and completion. Patient satisfaction was measured at the facility level throughout their participation in the cohort. Patient satisfaction was high across all centers reporting. One hundred thirty-four facilities from Cohorts 1-7 submitted at least one data element for “likelihood to recommend” with an average rate of 96 percent. One hundred ninety-five facilities submitted at least one data element for “Overall Satisfaction” with an average rate of 94 percent.
AHRQ Safety Program for Ambulatory Surgery

Final Report 55
Lessons Learned The national project team (NPT) learned several lessons in doing this work, both through direct experience working over 4 years with 47 States and the District of Columbia as well as through site visit summaries, facility presentations and success stories, and discussions with faculty and program partners.
Site Visits
Performed by Quality Improvement Advisors (QIAs)
The QIAs conducted site visits in five facilities between April and May 2016. The purpose of these site visits was to support ongoing program activities through mutual learning and sharing of best practices and challenges during the implementation of the Ambulatory Surgery Center (ASC) Safety Program initiative. Two objectives of the site visits were to observe procedures and staff interactions within the facility and review ideas for improvement and best practices. Real-time feedback was provided in person and also in a site-visit report afterward to the facilities.
Out of the five facilities the QIAs visited, four were considered “high-performing” centers and one was considered “low-performing” based on culture survey results and self-reported checklist implementation. At the high-performing centers, a strong culture of communication and teamwork was observed. All team members were actively engaged in using the checklist during all three pause points, and there was an atmosphere that allowed for questions or concerns to be raised. The process for walking through each item on the checklist was standardized and consistent, and each team member was responsible for providing or verifying information. At all five of the centers visited, a copy of the checklist (or portions of it) was prominently placed so all team members could refer to it at the beginning and end of cases.
At the low-performing center, across all cases, the common area for improvement was that all team members were not present and engaged in the “Before Skin Incision” portion of the checklist (the timeout). Furthermore, the “Before Patient Leaves the Room” portion (or debriefing) did not take place during any observed cases. The QIA recommended that, prior to the start of the procedure, all activities should cease and all team members should be present, engaged, and actively participating in the discussion. Additionally, the QIA recommended that, at the end of the case, team members should consistently confirm the name of the procedure and specimens collected and discuss any concerns for recovery before the patient leaves the room.
All of the centers visited shared one common area for improvement: None of the physicians were making the statement “If anyone has any questions or concerns at any time, please speak up” prior to skin incision. This notion of the physician explicitly encouraging team members to speak up as a way to set a tone of communication and teamwork was presented frequently on Webinars and coaching calls; however, it was not widely implemented. At the site visits, the QIAs described the rationale behind using this statement and reinforced the message that this is considered best practice.
AHRQ Safety Program for Ambulatory Surgery

Final Report 56
Performed by IHI
The Institute for Healthcare Improvement (IHI) team conducted two site visits to ASCs, spanning 2 days at each center. Before and after the visit, IHI conducted a series of conference calls when they helped the centers test and adapt the recommended management practices into the centers’ daily workflow.
In selecting the sites, the following factors were considered: the desire to engage in sustainability work, staff and clinician engagement in implementation of the surgery checklist, and experience using improvement methods such as the Model for Improvement, or desire to learn such methods.
IHI performed site visits on one large center (eight operating rooms (ORs)) with an established Quality Improvement (QI) department and one small (two ORs, two endoscopy suites) with little QI experience.
IHI site visits resulted in the following findings: the huddle agenda could be accomplished in 5 minutes and consisted of a review of the previous day’s safety issues, anticipation of the current day’s problems, and review and logging of work-related problems for followup. Teams were able to surface and track problems such as missing items in instrument sets and problems with reaching patients for followup. Key metrics such as days since last near miss and surgical timeout compliance could be tracked and monitored, and checklist-driven standard work in preadmission, sterile processing department, pre-op, post-op, and followup formed a continuum of critical safety steps. The surgical timeout was the “last chance” to catch critical concerns, and senior managers had a key role in monitoring and sustaining the huddles. Model success relied on skills of unit managers leading huddles, and skill building was critical.
Success Factors and Lessons Learned
Several factors led to successful implementation of various program elements, including—
Leveraging Existing QI Structure and Resources. Facilities that were already engaged in QI work were able to leverage their prior experiences better than facilities that had little or no formal QI training. For those that had a strong QI culture in place, the NPT and QIAs focused on supplementing and enhancing this work with the program offerings and the use of the Comprehensive Unit-based Safety Program (CUSP) and TeamSTEPPS principles. It is in these facilities that the implementation toolkit and other Web materials are likely to be used most successfully. One-on-one coaching helped the facilities utilize the QI work as part of this program to meet survey requirements and demonstrate improvement to their board or management companies. The QIAs’ effect probably was most pronounced in the facilities with less prior QI experience. In this group of facilities, the NPT believe that the QIAs were integral to teaching facilities basic QI principles that prepared them to do this work.
Coaching Targeted to Specific Areas for Improvement Through Trusted Relationships. Facilities entered this program with highly variable stages of readiness to undertake this QI initiative, and where they started predicted how far they were able to progress in a 12-month period of time. The NPT observed from the implementation pathway that a higher entry score at baseline predicted greater success moving through the pathway. With this understanding, it is unrealistic to expect all facilities to successfully move through all stages in the implementation pathway at the same time.
AHRQ Safety Program for Ambulatory Surgery

Final Report 57
Program QIAs were able to work directly with participating facilities to identify opportunities for improvement using the self-reported demographics data along with results from the culture surveys. Culture surveys proved to be useful coaching tools and were quickly incorporated and used on the coaching calls to initiate discussions about how to address and improve safety culture in each ASC. The QIAs set short-term implementation goals throughout the program to increase accountability and facilitate change in conjunction with existing facility staff.
Sustained engagement in the program was based on the relationship between the QIAs and the facility leads and the ability of the QIA to “meet them where they were” and develop tailored coaching plans to maximize their success implementing the program. The engaged facility leads recognized the value of the QIAs and appreciated the individual focus on adapting the implementation to their particular ASC. These leads often initiated contact in between regularly scheduled calls to solicit advice and guidance on program implementation.
Multiple Opportunities for Participation. Facilities were offered the ability to participate on educational Webinars, national office hours, one-on-one coaching calls with QIAs, learning groups, and on a moderated LISTSERV. Over the course of the program, there were 97 educational Webinars, 122 learning groups, 973 one-on-one coaching calls, and hundreds of LISTSERV messages exchanged between participants.
QIAs were most influential when they employed different strategies to take into consideration each ASC’s particular context including availability and learning styles (e.g., learning groups, one-on-one calls, LISTSERV, and presentations). Every ASC’s availability and willingness to participate in all program-related activities varied, so it was extremely important to have a variety of ways for facility leads to engage and learn throughout the cohort. For example, some facilities participated in every learning group but did not join each one-on-one call. On the other hand, some facilities joined all of the one-on-one calls but did not watch the live Webinars. One of the facility leads from Cohort 4 said, “I would really like to watch the Webinars live, but I do not have a desk or a computer. I’m actually talking to you on a phone in an empty procedure room right now.”
Identifying a Physician Champion. As is the case with any QI initiative in health care, the presence of a physician champion was critical to successful implementation of the safe surgery checklist. This is particularly important in the ambulatory surgery environment. Physician ownership is prevalent in ASCs and having physician ownership engagement is essential.
Leadership Engagement. Successful implementation of program-related goals required leadership engagement, allocation of resources dedicated to implementation, and knowledge about the intervention and how to incorporate it into the workflow. For facilities that did not have leadership support and a physician quality champion, the QIAs and facility leads experienced significant challenges changing practices in the OR and improving the culture of safety. Interestingly, the QIAs reported greater stakeholder involvement in facilities that experienced a recent adverse event, such as a wrong site procedure, that could have been avoided with proper checklist use.
Implementing the Surgical Safety Checklist Is a Complex Task Best Approached in Discrete Sections. Due to the Center for Medicare and Medicaid Services (CMS) requirements, facilities understood the importance of improving the “timeout” portion of the checklist but had a harder time
AHRQ Safety Program for Ambulatory Surgery

Final Report 58
understanding the value or relevance of the other teamwork and communication pause points (briefing and debriefing). The QIAs spent a significant amount of time coaching on the value of the other portions such as the briefing and debriefing but ultimately found that facilities wanted to focus their efforts on improving the “timeout” section first. After hearing this consistent feedback and interest in focusing on the “timeout,” the QIAs worked with the teams to improve this portion of the checklist.
QIAs focused their coaching efforts on identifying concrete steps that would work within their specific clinical setting for improving communication and making sure each team member was involved in the “timeout” conversation. Starting with the “timeout” served as a foundation on which to build and create the necessary starting point and platform for further improvement. This project helped lift the quality of their “timeout” to the place where it should be, and now these facilities are prepared with the tools and implementation path to take it to the next step. The QIAs assessed where facilities were and focused on taking them to a higher level of quality.
Challenges
In addition to observing what assisted facilities with project implementation successes, there were several challenges to successful QI in the ASC setting, including—
Low Data Submission Rates and Lack of Actionable Outcome Data. Low data submission rates and high facility attrition were observed throughout the course of the program. Reported rates for all outcome measures are very low with many at or close to 0 percent. Facilities did not see the benefit in reporting this information to the project for the purposes of monitoring progress, generating reports, or benchmarking against other participating facilities, resulting in substantial attrition in measure reporting throughout the program. This reporting was also duplicative of reporting done by facilities to the CMS ASC Quality Reporting (ASCQR) Program and to the ASC Quality Collaboration (ASC QC).
Lack of Feedback Loop and Data Reporting to ASCs When Adverse Events Occur. Obtaining a true picture of the adverse events proved difficult as patients do not typically return to the ASC environment when an event occurs after leaving the facility. There is not an established or consistent feedback loop from physician offices, hospitals, or urgent care centers to the ASC. Data reporting varies in ASCs on how adverse events are communicated after the initial procedure/surgery, including surgical site infection (SSI) data and other complications.
Lack of Dedicated, Trained QI Staff. Facilities often did not have full-time QI staff or were participating in their first formal QI program, which varies from the hospital environment where typically one or several staff members are responsible for QI within their organization. While they were engaged in this QI program, some facility leads often had little or no formal QI training. This lack of training and dedicated personnel resulted in a steep learning curve, and these ASCs typically were less successful in implementing the program components, including the safe surgery checklist.
ASC program participants had many job responsibilities, with QI sometimes being one of them. They were often involved in more than one QI study in their facility. Participants expressed interest in receiving basic QI education, which the program provided through QI-focused office hours, one-on-one coaching, and guidance on QI studies to meet accreditation standards.
AHRQ Safety Program for Ambulatory Surgery

Final Report 59
Staff Turnover. While the vast majority of the leads remained constant for the year-long engagement, an unexpected departure often created a leadership void and stalled implementation progress within the facility. In a few cases, the QIAs coached and facilitated a transition plan of program duties from an original facility lead to a new one. For many facilities, however, the removal of a lead resulted in all program work’s coming to a halt until a suitable replacement was identified.
Culture Change Is Complex. Changing the culture of an organization takes time and is ongoing. Similar to hospital environments, it is important to note that such fundamental, systemic changes often take longer than 12 months in ASCs.
Recommendations
ASC Data Collection and Reporting Processes. Future work should concentrate on data collection processes that focus on short-term gains that are meaningful to the ASCs. As of April 2016, the CMS Quality Reporting Program has begun publicly reporting ASC outcome measure data on the provider, State, and national levels, so facilities will be able to benchmark against a larger number of other facilities in future work. Standardizing processes around the reporting of SSI and other complications in the ASC environment would be beneficial to decrease the variability that currently exists in the environment.
Improved ASC QI Infrastructure/Training. ASCs who seek accreditation for their center are asked to implement QI studies with benchmarking. QIAs reported vast differences among facility leads in terms of QI training and infrastructure support, including leadership support, dedicated time, and financial resources to properly conduct QI initiatives. Additional QI training would enhance ASCs’ ability to conduct QI studies according to accreditation standards. In response to participants’ questions about how to identify QI study topics, conduct a QI study, and use the results to benchmark against other ASCs, the QIAs developed a QI template to assist participants with basic QI study implementation. Additional training and a supportive infrastructure in place prior to program enrollment is recommended so that facilities would be better prepared and more successful implementing future large-scale initiatives.
Improved Recruitment Process With Participant Understanding of Program Requirements. Many facility leads signed up for the program without full awareness of what the intervention entailed, and many felt that they had already successfully implemented the checklist and that their present practices were “as good as it will get.” Some facility leads lacked sufficient critical thinking skills to fully grasp the program requirements. As a result, they failed to see that there is a better way to approach how they work with the checklist in their ORs.
Transparency and participation comprehension around program requirements should be examined in national implementation programs moving forward to best prevent program withdrawals and maximize participant engagement.
Improved Physician/Leadership Engagement in QI Initiatives. In most centers, the final authority to make changes lay with the physician owners, who were generally not directly engaged in the program. Recruitment efforts tended to focus on the nurse managers and administrative personnel instead of the physician and leadership level. Attempts at recruitment through physicians in this program (orthopaedic
AHRQ Safety Program for Ambulatory Surgery

Final Report 60
cohort) proved challenging. Future implementation programs in ASCs should focus on increased leadership and physician ownership awareness and buy-in at the beginning of the program to assist with greater success in program implementation.
Customized Implementation Coaching and Support. Future programs like this should be designed to recognize and address the variability among facilities with tailored interventions. The use of QIAs to coach facilities is one way to accommodate their unique needs and promote greater progression along the implementation path. Large-scale QI projects, such as this, can achieve better results if some element of coaching is embedded in the program. Large-scale federally funded implementation projects should include, where possible, some element of QI coaching to provide direct support and training to facilities.
AHRQ Safety Program for Ambulatory Surgery

Final Report 61
Conclusion The Agency for Healthcare Research and Quality (AHRQ) Safety Program for Ambulatory Surgery has made progress toward understanding and promoting a culture of safety in the ambulatory surgery center (ASC) environment. Six hundred sixty-five facilities across 47 States had access to the infection prevention and surgical safety checklist curriculum provided by this program, potentially affecting 1,533,425 patient admissions and 2,220,374 procedures nationwide. This broad reach includes a variety of facilities, which presents both a challenge and an opportunity to reach areas of the health care delivery system that previously have not had robust quality improvement (QI) resources. Access to national experts through the program partners and extended faculty network as well as the availability of online resources, including the ASC toolkit, have provided participating facilities with the tools and strategies necessary to effect meaningful change. The changes included:
• adapting and implementing the surgical checklist• focusing on the checklist for the purpose of safety rather than as a simple task to complete• auditing for checklist compliance• improving teambuilding and communication between clinical areas• facilitating briefings and debriefings• using culture survey results to effect change• sharing data with clinical teams and encouraging their involvement in addressing
unfavorable trends• coaching staff to “speak up”• employing tactics to encourage physician engagement
Data from the program leads the national project team to believe that continuous remote coaching is associated with improved checklist implementation. Specifically, the analysis supports that there is a statistically significant correlation between the individual stages in checklist implementation (from checklist preparation to ownership to expansion and to improvement). The data support the notion that numerous interactions with a coach can facilitate movement beyond simple process changes and closer to meaningful checklist use.
Organizational readiness, including leadership engagement, adequate resources, and prior QI experience played a significant part in the quality improvement advisor’s ability to coach the facility leads toward meaningful checklist implementation. In this program, the biggest indicators of engagement and successful implementation were strong leadership support from administrative and clinical leads, protected time and dedicated resources to devote to program activities, and strong physician quality champions. If even one of these things was missing, it was difficult to see any uptake of program-related initiatives. Facilities entered this program with highly variable stages of readiness to undertake this QI initiative, and where they start predicts how far they can go in a 12-month period. Future large-scale quality improvement programs should be designed to recognize and address the variability, potentially with tailored interventions and the use of coaching, to work directly with facilities.
AHRQ Safety Program for Ambulatory Surgery

Final Report 62
References 1. Agency for Healthcare Research and Quality. AHRQ Safety Program for Ambulatory Surgery.
Rockville, MD; December 2014.http://www.ahrq.gov/professionals/haiambsurgery.
2. Lipsitz SR. Methods for estimating the parameters of a linear model for ordered categorical data.Biometrics. 1992 Mar;48(1):271-81. PMID: 1581487.
AHRQ Safety Program for Ambulatory Surgery

Final Report 63
Appendixes
Appendix A: Acronyms and Abbreviations
AAAHC Accreditation Association for Ambulatory Health Care AAOS American Academy of Orthopaedic Surgeons AHA American Hospital Association AHRQ Agency for Healthcare Research and Quality AORN Association of periOperative Registered Nurses APIC Association for Professionals in Infection Control and Epidemiology, Inc. ASC ambulatory surgery center ASC QC ASC Quality Collaboration ASCA Ambulatory Surgery Center Association ASCQR Ambulatory Surgical Center Quality Reporting ASC-SOPS Ambulatory Surgery Center Survey on Patient Safety ASGE American Society for Gastrointestinal Endoscopy
C1 Cohort 1 C2 Cohort 2 C3 Cohort 3 C4 Cohort 4 C5 Cohort 5 C6 Cohort 6 C7 Cohort 7 CI Confidence interval CDS Comprehensive Data System CL consortium lead CMS Centers for Medicare & Medicaid Services CUSP Comprehensive Unit-based Safety Program
ED emergency department EFN extended faculty network
FDF Facility Demographics Form
HAI healthcare-associated infection HOPD hospital outpatient department HRET Health Research & Educational Trust HSPH Harvard T.H. Chan School of Public Health
IHI Institute for Healthcare Improvement
NPT national project team
OR operating room
AHRQ Safety Program for Ambulatory Surgery

Final Report 64
QI quality improvement QIA quality improvement advisor QRP CMS Quality Reporting Program
SSI surgical site infection
WHO World Health Organization
AHRQ Safety Program for Ambulatory Surgery

Final Report 65
Appendix B: ASC Success Stories
Success Story #1
One particularly engaged AAOS Pilot center facility lead embraced the program content and took full advantage of the quality improvement advisor (QIA) support. She sought out not only the typical six one-on-one coaching calls but requested additional ad hoc calls with the QIA for guidance regarding implementation strategy. As a result she has made considerable progress in a few areas. These included creating strong physician buy-in by hosting a physician Webinar series, engaging a multidisciplinary team to modify the checklist currently in use within her system, and initiating small-scale testing of the modified checklist. The QIA joined two of these physician Webinars to cofacilitate and field questions about this work from the attendees. Most recently, the team made an educational video featuring staff members to help spread the word about this project. The QIA built a strong relationship with this facility that extended beyond their time in the cohort.
Success Story #2
One facility lead set a goal of improving his team’s ability to “speak up” in difficult situations. This came about after he reviewed his ambulatory surgery center’s (ASC’s) culture survey results that revealed that staff had difficulty “speaking up” with specific physicians and team members. First, he initiated a one-on-one conversation with a challenging and intimidating surgeon who was not taking the timeout seriously. In this conversation, he told the surgeon that his behavior was negatively affecting their culture of safety. The surgeon was surprised to hear this feedback and agreed to work on improving his attitude and his behavior. According to the lead, this surgeon is now taking the timeout seriously and also setting a positive tone in the operating room (OR). The lead took this one step further and trained his entire staff on speaking up using the CUS (I am Concerned, I am Uncomfortable, this is a Safety issue) materials from TeamSTEPPS.
In addition, the lead and the Medical Director had a meeting with the Medical Executive Team about the importance of the Surgeon Safety statement on the checklist. The team agreed to make the Surgeon Safety statement a facility-wide policy and to encourage all surgeons to actively incorporate this into their practice. This top-down approach, which involved training technicians and registered nurses (RNs) to speak up, proved useful during a case when a shy technician noticed that the tip of an instrument was missing at the end of a case. As the case was ending and the surgeon was removing his gown, the technician spoke up and said a small piece of equipment was missing. They did an X-ray and found the missing tip in the patient’s shoulder. The surgeon was pleased that the technician felt confident enough to say something and, in this instance, protected the patient from harm. The facility team lead reported that he did not think the technician would have had the confidence to speak up if the facility had not implemented these changes.
Success Story #3
One facility lead shared the story of a nurse who faced two challenging situations that required her to speak up to a senior surgeon. On the first occasion, the nurse observed a surgeon as he was about to begin a case, and she suspected that the wrong limb had been prepared for the procedure. Just prior to skin incision she spoke up using the structured language tools taught in the program. Her suspicion
AHRQ Safety Program for Ambulatory Surgery

Final Report 66
turned out to be wrong and the surgeon ridiculed her for interrupting the case and questioning his judgment.
On the second occasion this same nurse found herself working with this surgeon and, once again, just prior to skin incision, she had a similar suspicion that the wrong limb had been prepared. While it clearly would have been easier for her to say nothing, especially given the reception she received the last time she spoke up, she used the training once again to voice her concerns. On this occasion, however, the nurse was correct and the team was about to operate on the wrong limb. This time the surgeon reacted very differently. He was extremely appreciative and thanked the nurse for preventing a wrong-site surgery. He also apologized for his earlier negative reaction to her speaking up and has since become a champion for better communication in the OR.
AHRQ Safety Program for Ambulatory Surgery

Final Report 67
Appendix C: Linear Regression Analysis Demonstrating the Relationship Between the Step Scores and Number of Coaching Calls
Variable Coefficient
95% Confidence Interval
p-value Lower Bounds Upper Bounds
Model: PREPARE score (outcome) = Baseline score
Intercept 2.59 1.91 3.27 <0.0001
Baseline score 0.19 0.10 0.28 0.0053
Model: OWN score (outcome) = Baseline score + PREPARE score
Intercept −0.30 −0.76 0.16 0.1979
Baseline score −0.03 −0.09 0.02 0.2689
PREPARE score 0.29 0.20 0.37 <0.0001
Model: EXPAND score (outcome) = Baseline score + PREPARE score + OWN score
Intercept −0.23 −0.66 0.19 0.2801
Baseline score −0.01 −0.06 0.04 0.7646
PREPARE score 0.15 0.06 0.24 0.0011
OWN score 0.44 0.30 0.58 <0.0001
Model: IMPROVE score (outcome) =
Baseline score+ PREPARE score + OWN score + EXPAND score
Intercept −0.06 −0.34 0.22 0.6720
Baseline score 0.004 −0.03 0.04 0.8019
PREPARE score 0.02 −0.04 0.08 0.5438
OWN score 0.17 0.07 0.27 0.0009
EXPAND score 0.25 0.15 0.34 <0.0001
AHRQ Safety Program for Ambulatory Surgery

Final Report 68
Variable Coefficient
95% Confidence Interval
p-value Lower Bounds Upper Bounds
Model: IMPROVE score (outcome) =
Baseline score+ PREPARE score + OWN score + EXPAND score + # of calls done
Intercept −0.15 −0.43 0.13 0.2932
Baseline score 0.01 −0.02 0.04 0.5750
PREPARE score −0.03 −0.10 0.03 0.3290
OWN score 0.14 0.04 0.24 0.0071
EXPAND score 0.23 0.14 0.33 <0.0001
# of calls done 0.08 0.03 0.13 0.0023
AHRQ Safety Program for Ambulatory Surgery

Final Report 69
Appendix D: Clinical Outcome Measures Currently Collected
Measure Description Specifications/Source (If applicable) Wrong: site, side, patient, procedure, implant *
Percentage of admissions (patients) who experience a wrong site, side, patient, procedure, or implant
CMS Ambulatory Surgical Center Quality Reporting Program ASCQR Specifications, Version 4.0 ASC Quality Collaboration Quality Measures Implementation Guide ASC QC Implementation Guide, Version 3.1
Hospital transfer/admission
Percentage of admissions (patients) who are transferred or admitted to a hospital upon discharge from the facility
ASCQR Specifications, Version 4.0 ASC QC Implementation Guide, Version 3.1
Patient burn * Percentage of admissions (patients) who experience a burn prior to discharge
ASCQR Specifications, Version 4.0 ASC QC Implementation Guide, Version 3.1
Patient fall Percentage of admissions (patients) who experience a fall in the facility
ASCQR Specifications, Version 4.0 ASC QC Implementation Guide, Version 3.1
Hospital admissions within 48 hours **
Percentage of facility admissions with a completed procedure who have an unplanned admission to the hospital within 48 hours of discharge from the facility
Program-defined
ED visits within 48 hours **
Percentage of facility admissions with a completed procedure who visit an emergency department within 48 hours of discharge from the facility
Program-defined
Postoperative bleeding without reoperation within 48 hours **
Percentage of facility admissions with a completed procedure who experience postoperative bleeding within 48 hours of discharge from the facility but do not require a reoperation
Program-defined
Reoperations within 48 hours **
Percentage of facility admissions with a completed procedure who undergo a secondary operation related to the index procedure performed in the facility within 48 hours of discharge from the facility
Program-defined
* Cohort 6 (Endoscopy) is not collecting these measures.
** Cohorts 1 and 2 only
AHRQ Safety Program for Ambulatory Surgery
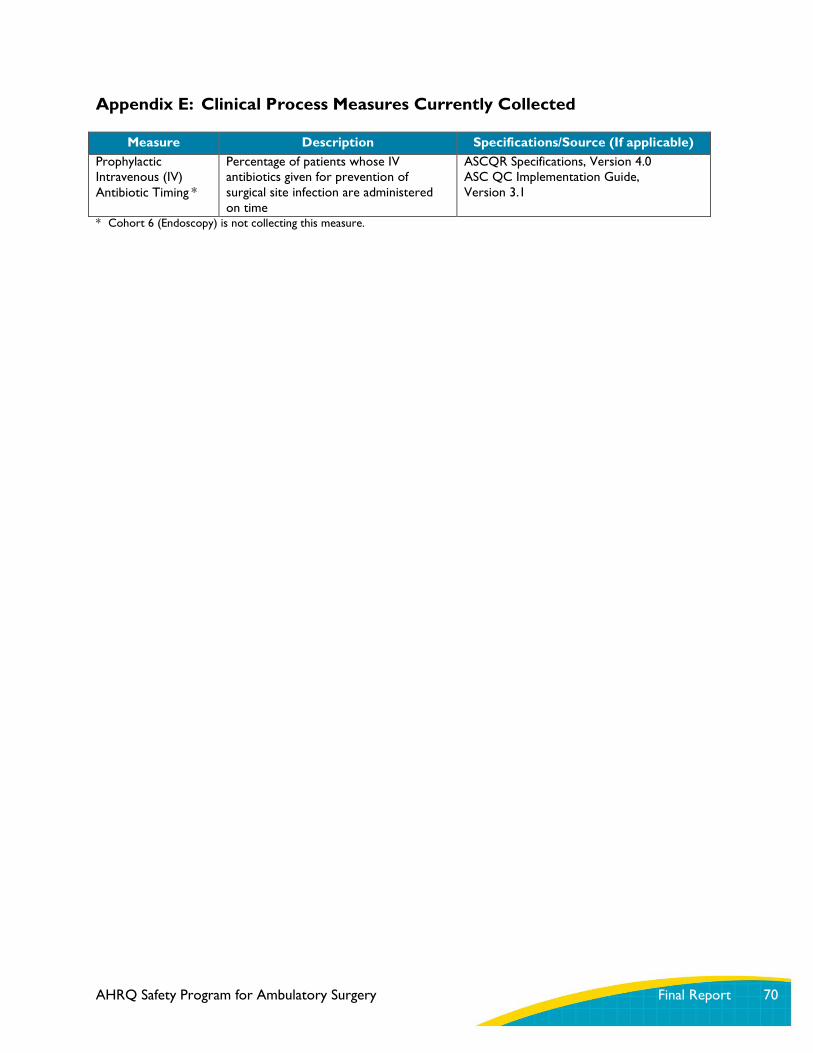
Final Report 70
Appendix E: Clinical Process Measures Currently Collected
Measure Description Specifications/Source (If applicable) Prophylactic Intravenous (IV) Antibiotic Timing *
Percentage of patients whose IV antibiotics given for prevention of surgical site infection are administered on time
ASCQR Specifications, Version 4.0 ASC QC Implementation Guide, Version 3.1
* Cohort 6 (Endoscopy) is not collecting this measure.
AHRQ Safety Program for Ambulatory Surgery

Final Report 71
Appendix F: Demographic, Cultural, Program Participation, and Other Process Elements Collected
Measure Element Description /Source
Demographic Facility type and specialty ASC or HOPD, Single- or Multi-specialty, Specialty(ies)
Demographic Size and staffing Number of operating/procedure rooms, FTEs, number of physicians, and nonphysicians
Demographic Volume Total number of procedures, total number of admissions, and number of procedures by category
Cultural Patient safety culture monitoring practices at the facility Methods and assessments used
Cultural Patient safety culture assessment Assessment based on Ambulatory Procedure/Surgery Survey on Patient Safety Culture, administered to all staff
Program Participation Educational event participation Webinar attendance and archived Webinar download
tracking
Process Clinical measure collection and monitoring processes Measurement methods and frequency, and specifications
Process Post-procedural event monitoring Post-procedure event gathering processes
Process Patient satisfaction monitoring Patient satisfaction measurement processes Process QI practices Staffing and available resources Process Safety checklist use Safety checklist use, components, and administration FTE = full-time employee
AHRQ Safety Program for Ambulatory Surgery

Final Report 72
Appendix G: Cohort Outcome Measure Results
Data is displayed only for months in which 75 percent or more of R1 (first retrospective month) facilities reported
Figure G.1: Cohort 1 Outcome Measure Results
Data as of Aug 1, 2016: Up to 51 facilities reporting in any given month, denominator of 19,000+ admissions/month
* Retrospective data
R1* R2* R3* M1 M2 M3 M4 M5 M6 M7 M8 M9 M10 M11 M12Wrong Site, Wrong Side, Wrong Patient, Wrong
Procedure, Wrong Implant 0.00% 0.01% 0.01% 0.01% 0.01% 0.00% 0.01% 0.01% 0.00% 0.00% 0.00% 0.01% 0.01% 0.01%
Hospital Transfer / Admission 0.16% 0.13% 0.15% 0.11% 0.12% 0.12% 0.14% 0.12% 0.12% 0.13% 0.14% 0.13% 0.10% 0.10%
Patient Burn 0.01% 0.01% 0.00% 0.00% 0.00% 0.02% 0.00% 0.01% 0.00% 0.00% 0.01% 0.00% 0.00%
Patient Fall 0.02% 0.02% 0.02% 0.02% 0.02% 0.04% 0.00% 0.03% 0.03% 0.01% 0.01% 0.01%
0.00%
0.02%
0.04%
0.06%
0.08%
0.10%
0.12%
0.14%
0.16%
0.18%
C1- ASC QC / CMS QRP Outcomes
AHRQ Safety Program for Ambulatory Surgery

Final Report 73
Figure G.2: Cohort 2 Outcome Measure Results
Data as of Aug 1, 2016: Up to 92 facilities reporting in any given month, denominator of 34,000+ admissions/month
* Retrospective data
R1* R2* R3* M1 M2 M3 M4 M5 M6 M7 M8 M9Wrong Site, Wrong Side, Wrong Patient, Wrong
Procedure, Wrong Implant 0.01% 0.00% 0.01% 0.01% 0.01% 0.00% 0.00% 0.01% 0.00% 0.01% 0.00% 0.00%
Hospital Transfer / Admission 0.08% 0.11% 0.11% 0.11% 0.09% 0.15% 0.14% 0.10% 0.12% 0.14% 0.13% 0.08%
Patient Burn 0.01% 0.00% 0.00% 0.00% 0.00% 0.01% 0.00% 0.01% 0.00% 0.00% 0.01% 0.00%
Patient Fall 0.01% 0.01% 0.00% 0.01% 0.02% 0.02% 0.02% 0.01% 0.01% 0.01% 0.01% 0.03%
0.00%
0.02%
0.04%
0.06%
0.08%
0.10%
0.12%
0.14%
0.16%
C2 - ASC QC / CMS QRP Outcomes
AHRQ Safety Program for Ambulatory Surgery

Final Report 74
Figure G.3: Cohort 3 Outcome Measure Results
Data as of Aug 1, 2016: Up to 41 facilities reporting in any given month, denominator of 15,000+ admissions/month
* Retrospective data
R1* R2* R3* M1 M2 M3 M4 M5 M6 M7 M8 M9 M10
M11
Hospital Transfer / Admission 0.16% 0.13% 0.11% 0.14% 0.18% 0.14% 0.15% 0.14% 0.09% 0.16% 0.09% 0.17%
Wrong Site, Wrong Side, Wrong Patient, WrongProcedure, Wrong Implant 0.02% 0.01% 0.00% 0.00% 0.00% 0.00% 0.00% 0.00% 0.01% 0.01% 0.02% 0.00% 0.00% 0.00%
Patient Burn 0.00% 0.00% 0.00% 0.00% 0.01% 0.00% 0.01% 0.00% 0.00% 0.01% 0.00% 0.00% 0.00% 0.00%
Patient Fall 0.01% 0.01% 0.00% 0.01% 0.01% 0.02% 0.01% 0.03% 0.02% 0.01% 0.03% 0.00% 0.01% 0.02%
0.0000%
0.0500%
0.1000%
0.1500%
0.2000%
0.2500%
C3 - ASC QC / CMS QRP Outcomes
AHRQ Safety Program for Ambulatory Surgery

Final Report 75
Figure G.4: AAOS Pilot Cohort Outcome Measure Results
Data as of Aug 1, 2016: Up to six facilities reporting in any given month, denominator of 3,000+ admissions/month
* Retrospective data
R1* R2* R3* M1 M2 M3 M4 M5 M6 M7
Hospital Transfer / Admission 0.11% 0.04% 0.04% 0.20% 0.15% 0.06% 0.11% 0.08% 0.07% 0.07%
Wrong Site, Wrong Side, Wrong Patient, WrongProcedure, Wrong Implant 0.04% 0.00% 0.00% 0.00% 0.04% 0.03% 0.00% 0.04% 0.00% 0.00%
Patient Burn 0.00% 0.00% 0.00% 0.00% 0.00% 0.00% 0.00% 0.00% 0.00% 0.00%
Patient Fall 0.00% 0.04% 0.04% 0.00% 0.00% 0.03% 0.00% 0.04% 0.00% 0.00%
0.0000%
0.0500%
0.1000%
0.1500%
0.2000%
0.2500%
AAOS - ASC QC / CMS QRP Outcomes
AHRQ Safety Program for Ambulatory Surgery

Final Report 76
Figure G.5: Cohort 4 Outcome Measure Results
Data as of Aug 1, 2016: Up to 46 facilities reporting in any given month, denominator of 16,000+ admissions/month
* Retrospective data
R1* R2* R3* M1 M2 M3 M4 M5 M6 M7
Hospital Transfer / Admission 0.11% 0.09% 0.08% 0.11% 0.13% 0.13% 0.13% 0.10% 0.12%
Wrong Site, Wrong Side, Wrong Patient, WrongProcedure, Wrong Implant 0.01% 0.01% 0.00% 0.00% 0.00% 0.00% 0.00% 0.00% 0.02% 0.04%
Patient Burn 0.01% 0.00% 0.01% 0.00% 0.00% 0.01% 0.00% 0.00% 0.00%
Patient Fall 0.02% 0.01% 0.01% 0.03% 0.03% 0.01% 0.02% 0.02% 0.01%
0.0000%
0.0500%
0.1000%
0.1500%
0.2000%
0.2500%
C4 - ASC QC / CMS QRP Outcomes
AHRQ Safety Program for Ambulatory Surgery

Final Report 77
Figure G.6: Cohort 5 Outcome Measure Results
Data as of Aug 1, 2016: Up to 46 facilities reporting in any given month, denominator of 16,000+ admissions/month
* Retrospective data
R1* R2* R3* M1 M2 M3 M4 M5 M6
Hospital Transfer / Admission 0.14% 0.15% 0.09% 0.10% 0.05% 0.17% 0.08% 0.06% 0.09%
Wrong Site, Wrong Side, Wrong Patient, WrongProcedure, Wrong Implant 0.01% 0.01% 0.00% 0.02% 0.00% 0.00% 0.00% 0.00% 0.02%
Patient Burn 0.00% 0.00% 0.01% 0.00% 0.00% 0.00% 0.00% 0.01% 0.01%
Patient Fall 0.01% 0.01% 0.02% 0.01% 0.01% 0.01% 0.02% 0.02% 0.00%
0.0000%
0.0500%
0.1000%
0.1500%
0.2000%
0.2500%C5 - ASC QC / CMS QRP Outcomes
AHRQ Safety Program for Ambulatory Surgery

Final Report 78
Figure G.7: Cohort 6 Outcome Measure Results
Data as of Aug 1, 2016: Up to 59 facilities reporting in any given month, denominator of 30,000+ admissions/month
* Retrospective data
R1* R2* R3* M1 M2 M3 M4 M5 M6 M7
Hospital Transfer / Admission 0.16% 0.10% 0.11% 0.13% 0.15% 0.09% 0.10% 0.12% 0.13% 0.15%
Patient Fall 0.01% 0.02% 0.02% 0.02% 0.01% 0.00% 0.02% 0.01% 0.01% 0.02%
0.0000%
0.0500%
0.1000%
0.1500%
0.2000%
0.2500%
C6 - ASC QC / CMS QRP Outcomes
AHRQ Safety Program for Ambulatory Surgery

Final Report 79
Figure G.8: Cohort 7 Outcome Measure Results
Data as of Aug 1, 2016: Up to 19 facilities reporting in any given month, denominator of 9,000+ admissions/month
* Retrospective data
R1* R2* R3* M1 M2 M3 M4 M5 M6 M7 M8 M9
Hospital Transfer / Admission 0.00% 0.00% 0.17% 0.21% 0.06% 0.05% 0.23% 0.20% 0.00% 0.07% 0.16%
Wrong Site, Wrong Side, Wrong Patient, WrongProcedure, Wrong Implant 0.00% 0.00% 0.02% 0.00% 0.00% 0.01% 0.00% 0.00% 0.00% 0.00% 0.00%
Patient Burn 0.00% 0.00% 0.00% 0.00% 0.00% 0.00% 0.00% 0.00% 0.00% 0.00% 0.00%
Patient Fall 0.00% 0.00% 0.00% 0.00% 0.03% 0.00% 0.00% 0.12% 0.00% 0.00% 0.04% 0.00%
0.0000%
0.0500%
0.1000%
0.1500%
0.2000%
0.2500%
C7 - ASC QC / CMS QRP Outcomes
AHRQ Safety Program for Ambulatory Surgery