Embed Size (px)
DESCRIPTION
agriculture
Citation preview

Publication 424-100$5.00

ii
Introduction
Agronomy is a diverse science that includes field crops, turfgrasses, variety selection, seed science, soilmanagement, nutrient management, and soil suitability for urban purposes. This publication is a source of agro-nomic information that does not change frequently. Pesticide and varietal recommendations change frequentlyand are, therefore, not included. This type of information is published annually in the Virginia Tech Pest Manage-ment Guides and commodity specific publications such as the Virginia Corn Hybrid and Management Trials.Contact your local Extension agent for a copy of the latest publication or visit the Virginia Cooperative Extensionweb page at http://www.ext.vt.edu.
For specific updates on crop production in Virginia, contact your local Extension agent for the latest infor-mation from the Virginia Agricultural Statistics Bulletin or contact the Virginia Agricultural Statistics Service inRichmond, Virginia, directly at (804) 771-2493, or at their website http://www.nass.usda.gov/va/.

Crop Descriptions 1
Virginia Cooperative Extension Agronomy Handbook
PART ICrop Description
Daniel E. Brann, Extension Grains SpecialistA. O. Abaye, Extension Alternative Crop Specialist
Paul R. Peterson, Extension Forage Specialist
This section provides basic, detailed information about most plants used for cropping in Virginia. All values aregeneralizations which may vary with specific conditions. Rates of fertilizer application depend, to a large extent,on initial soil test levels and the productive potential of the soil. The fertilizer recommendations presented assumean average or medium soil test level and soils that are average to above average in productivity. For more specificrecommendations, rely on soil test results. Fertilizer application rates and crop yields in this section areexpressed on a per acre basis.
VIRGINIA POLYTECHNIC INSTITUTEAND STATE UNIVERSITY

2 Crop Descriptions
Agronomy Handbook Virginia Cooperative Extension
Alfalfa – Perennial – (Medicago sativa)
Description: Distinct deep tap root; erect stems 2-3’ tall from woody crown; purple flowers for mostimproved varieties; stem and leaves smooth; leaves arranged alternately on stem; eachleaf has 3 leaflets with smooth edges.
Uses: Hay, pasture, and silageVarieties: Consult varietal information published annually by Virginia Cooperative Extension.Weight per bushel: 60 lbsSeeds per lb: 220,000Germinating time: 7 daysFertilizer: At seeding, Zero N, 110-140 lbs P
20
5, 110-140 lbs K
20 at medium soil test levels. Use
borate fertilizers (2-4 lbs B) annually. For top-dressing 70-90 lbs P20
5 and 220-360 K
20
annually for medium soil test levels. Split application: half in fall and half in spring.Lower levels required for pasture.
pH Range: 6.8-7.0Soil Adaptation: Deep, well drained soils, with sandy clay loam to clay subsoils.Inoculation: Essential. Use commercial inoculants. Cross inoculates with sweet and bur clover.Time of Planting: 30-60 days before first killing frost in fall or 30 days before last killing frost in spring at
15-25 lbs alone, or 10-20 lbs with 3- 5 lbs of orchardgrass.Method of Planting: 6”-8” rows or solid seeded. Conventional seeding – cover no deeper than 1/4” – 1/2”,
preferably with cultipacker. A firm and compact seedbed is essential. No-till seeding(graze or mow to have sod short). Kill all vegetative competition with herbicide, useinsecticide, plant 1/2” – 3/4” deep with no-till drill.
Harvesting: Harvest at late bud to 1/4 bloom, except first cutting. First cutting should be made in(hay or silage) bud stage or when orchardgrass begins to head. Alfalfa may be cut 3-5times/year at 30-40 day intervals, depending upon location in state and average rainfall.Make last cutting 3-4 weeks before average date of first killing frost in fall or in time toallow 6-8” of regrowth. Allow at least one harvest to reach 1/10 bloom to help persis-tence.
Harvesting (pasture): Use grazing-tolerant varieties under continuous stocking. Hay-type varieties should berotationally stocked with 1-7 day grazing periods and 25-40 day rest periods. Avoid bloatby seeding with grass, turning cattle into new paddock only after forage is dry (no dew),and not allowing cattle to get too hungry prior to turn in.
Approximate Yield: 3-6 tons hay/A
Alsike Clover – Perennial – (Trifolium hybridum)
Description: Tillers from crown and stem, leaves smooth; pink or white blooms; stems do not termi-nate in a flower.
Uses: Hay and pasture; however, it does not make sufficient recovery after the first cutting for asecond hay crop.
Weight Per Bushel: 60 lbsSeeds per lb: 680,000Germination time: 7 daysFertilizer: At medium soil test levels apply 40-60 lbs P
20
5 and 85-110 lbs K
20 per season
pH Range: 5.8-6.5Soil Adaptation: Well-drained to somewhat poorly drained soils. More tolerant to a high water table and
acid soils than other clovers.Inoculation: Important. Cross-inoculates with red, crimson, ladino, and white cloverPlanting: 30-60 days before last killing frost in spring, or 30-45 days before first killing frost in fall
at 3-4 lbs in mixtures; 5-8 lbs alone

Crop Descriptions 3
Virginia Cooperative Extension Agronomy Handbook
Alsike Clover – Perennial – (Trifolium hybridum) (cont.)
Harvesting (hay): 1/2 to full bloom about June 1-20Harvesting (seed): When about 3/4 of the heads are ripe. Handle as other clover.Approximate Yield: 1-2 tons hay/A
Austrian Winter Pea – Annual – (Pisum arense)
Description: Winter annual with purple flowers. Plants resemble garden pea.Uses: Forage or cover cropWeight Per Bushel: 60 lbsSeeds per lb: 5,000Germinating time: 8 daysFertilizer: Zero N. Apply 60-80 lbs P
20
5 and 60-90 lbs K
20 on medium testing soils. Adjust rates
based on soil test levels.pH Range: 6.0-6.5Soil Adaptation: Well drained soilsInoculation: Cross inoculates with garden peas, vetch, and Canadian field peas.Planting: Fall, September 15-October 15; Spring, March 1-April 15 in 6-8” rows or solid seeded at
20-30 lbs with small grains; 30-40 lbs alone.Harvesting (hay): When barley or other small grain is in soft dough for silage or in full bloom for hay.
Difficult to cure for hay.Harvesting (seed): When pods begin to turn brown.ApproximateHarvest Dates: Hay- May 1 – June 1Approximate Yield: Hay, 1 1/2 to 2 tons, Silage, 6-9 tons, or Seed, 300-500 lbs./acre
Barley– Annual – (Hordeum vulgare)
Description: Leaves are green with long clasping auricles and a long ligule. Seed usually contains thehusk (lemma and palea) that gives the seed a wrinkled appearance. Newer varieties maybe “hulless” since the lemma and palea are removed at harvest.
Uses: Grain is used for animal feed in Virginia. Also used for silage and in mixtures with othersmall grains for cover crops and winter grazing. Limited use in human food.
Weight Per Bushel: 48 lbs (Hulled); 57.6 lbs (Hulless-for feed); and 60.0 lbs (Hulless-for humanconsumptionion)
Seeds per lb: 13,000Germination Time: 6-7 daysFertilizer: 20 lbs of N in the fall plus 40-80 lbs each of P
20
5 and K
20. Top dress with 80 lbs of
nitrogen in February or early March. These rates assume no carry over N from theprevious crop. In general, a high yielding crop will take up to 20-25 lbs/A fall N plus atleast 80 lbs in the March-May period. For best results the winter–early spring N shouldbe split into an application in February and one in late March.
pH Range: 6.0-6.5. Barley is very sensitive to low pH.Soil Adaptation: Any well drained soil. Barley will not tolerate poor drainage.Time of Planting: About 2 weeks before first average frost in Fall: September 15-October 10 west of the
Blue Ridge and Northern Piedmont; October 1-November 1 in Eastern and SouthernPiedmont Virginia. Aphids should be controlled if they build up in the fall or earlywinter.
Rate of Seeding: 120 lbs/A (Hulled) or approximately 30 seeds/sq ft (18 seeds/drill foot in 7” rows)

4 Crop Descriptions
Agronomy Handbook Virginia Cooperative Extension
Barley– Annual – (Hordeum vulgare) (cont.)
Method of Planting: Planting with a grain drill is best; but broadcast disk-in to a depth of 1-1 1/2 inches canbe successful.
Harvesting: Combine grain when fully ripe and 12-14% moisture. Cut for silage in the soft doughstage or boot stage depending on forage requirements.
ApproximateHarvest Dates: Grain: June 1-June 20; Silage: May 1-June 1Approximate Yields: 80–120 bushels grain or 6-12 tons 35% dry matter silage/acre
Bentgrass – Creeping – Perennial (Agrostis paulustris)
Description: A stoloniferous grass used for golf greens; high maintenance is required; some varietiescan be seeded while others must be vegetatively planted.
Seeds per lb: 7,800,000Rate of Seeding: Seeds 1/2 to 1 lbGermination time: 10-14 dayspH Range: 6–6.5Stolonized Bents: 2-7 bushels of stolons per 1,000 sq ftTime of Planting: Early spring or late summer
Bermudagrass – Perennial – (Cynodon dactylon)
Description: Spreads by soil surface runners (stolons) and underground modified stems (rhizomes);stems 6-12 in tall; flowers are slender spikes, usually with 3 per cluster, similar to crab-grass; ligule a fringe of hairs.
Uses: A warm-season grass which makes most of its growth during June, July, and August inVirginia; pasture, hay, silage, and turf. Greatest forage potential in the Southern Pied-mont and Coastal Plain.
Types and strains: Common-Occurs naturally in Virginia and throughout the South. Propagated by sprigs(rhizome and stolon pieces) and seed. Can be major weed in crop fields. Hybrid ForageTypes-Improved strains which are high yielding, leafy, and cold-tolerant enough for usein Southern Piedmont and Coastal Plain. Midland, Tifton 44, and Quickstand have morecold tolerance then Coastal. All must be established using vegetative sprigs.Fine-Textured Bermudagrass—Developed for athletic fields, lawns, golf greens, fair-ways, etc. All improved varieties propagated by sprigs or sod. Seed is available forcommon bermudagrass.
Seed weightper bushel: 35-36 lbsSeeds per lb: 1,800,000pH Range: 6.0-6.5Soil adaptation: Will grow on all types of soil, but is better suited to sandy and droughty soils than other
grasses. Prefers well drained soils.Time of planting: April 1-June 1Rate of planting: For pasture use 15-20 bushels of sprigs per acre, in rows or 30-40 bu/acre if broadcast.
For turf, use 1 lb of seed, or 2-7 bushels of sprigs per 1,000 sq ftFertilizer: At planting, 70 lbs N, plus 70-90 lbs. P
2O
5, and 70-90 lbs K
2O for medium testing soil.
For turf, see Turfgrass Section. For Hay, 175-300 lbs N, 80 lbs P2O
5 and 80-205 lbs
K2O annually, based on soil test levels . Lower rates required when used as pasture.

Crop Descriptions 5
Virginia Cooperative Extension Agronomy Handbook
Bermudagrass – Perennial – (Cynodon dactylon) (cont.)
Method of planting: Seed broadcast by hand or seeder. Sprigs planted in rows manually or with planter. Maybe broadcast, disked in, and cultipacked. Cover sprigs with 2-4” of soil.
Harvesting (hay): Cut when 8-12” tall before heading, or every 35-45 days.Harvesting (pasture): Can be continuously stocked if grazed no shorter than 2-3”. Rotational stocking is
preferred; turn in at 6-8”; move cattle at 2-3”. Minimize seed production to maintainquality and growth rate. Don’t graze during establishment year; cut for hay instead.
Approximate yield: 4-8 tons hay/AUses: A warm-season grass which makes most of its growth during June, July, and August in
Virginia; pasture, hay, silage, and turf. Greatest forage potential in the Southern Pied-mont and coastal Plain.
Birdsfoot Trefoil – Perennial – (Lotus cornicalatus)
Description: A fine-stemmed legume with a branching taproot. Adapted to higher elevations inVirginia. Grows 12-30” or more in length from a branching crown; flowers are orange-yellow in groups of 4-8 at end of stems; leaves consist of 5 leaflets alternately arranged,two are at the base near the stem; several seed pods attached to a single point giveappearance of bird toes. Short-lived perennial that can reseed.
Uses: Hay or pasture (non-bloating)Varieties: No varieties have been developed for Virginia conditions. The erect or European types
have been most satisfactory. These varieties include Viking, Granger, Cascade, andMansfield. The Empire variety is a decumbent pasture type.
Weight Per Bushel: 60 lbsSeeds Per lb: 375,000Germinating Time: 7 daysFertilizer: Zero N—medium soil test levels; apply 40-70 lbs P
20
5 and 50-80 lbs K
20.
pH Range: 5.8-6.5Soil Adaptation: Does best on well drained soil, but can be grown with impervious subsoils.Inoculation: Essential. Does not cross-inoculate with other legumes.Planting: March 1-April 15 or August 1-September 1. Should be sown with a grass such as
orchardgrass or Kentucky bluegrass. In mixtures 4-8 lbs; alone 8-10 lbs.Method of Seeding: 6-8” rows or solid seeded. Well prepared, compact seedbed is needed. Cover not more
than 1/2” deep. Use cultipacker if surface-seeded. Can also be no-till drilled or frostseeded on killed sod. Poor seedling vigor.
Management: Permit seedlings to become well established before grazing or harvesting. Clip weeds.Use rotational or moderate continuous grazing for pastures.
Harvesting (hay): When in-bloom. Avoid clipping close if extremely dry.
Bluegrass – Kentucky – Perennial (Poa pratensis)
Description: A low-growing, sod-forming, perennial grass that spreads by underground rhizomes; thenarrow leaves have tips shaped like the bow of a boat and reach a length of 7”; sheathflattened; short ligule.
Uses: Permanent pasture and lawns. Requires several years to become well established. Goodearly grazing, goes dormant in summer, revives in fall to furnish good grazing.
Weight Per Bushel: 14 lbSeeds/lb: 2,200,000Germinating Time: 14 days

6 Crop Descriptions
Agronomy Handbook Virginia Cooperative Extension
Bluegrass – Kentucky – Perennial (Poa pratensis) (cont.)
Fertilizer: With white clover at seeding, 20 lbs N; at medium soil test levels apply 90-120 lbs P20
5
and 60-90 lbs K20. For pasture topdressing every 3 or 4 years, 40-125 lbs P
20
5 and 40-
125 lbs K20 at medium soil test levels. For turf, see turfgrass section.
pH Range: 6.0-6.5Soil Adaption: Best suited to fine-textured, well drained soils.Planting: late summer or early spring at 4-5 lbs in mixture for forage.
Bluegrass—Canada-perennial—(Poa compressa)
Description: Sod-forming from underground rhizomes; blue-green foliage; sheath distinctly flattened,with a short, compact seed head; short ligule.
Uses: Pasture, but not recommended for Virginia. Makes very little regrowth when grazed.Weight per bushel: 14 lbSeeds per lb: 2,500,000pH Range: 5.0-6.5Soil adaptation: Best suited to fine-textured, well drained soils. Will dominate Kentucky bluegrass on
acid, droughty or low-fertility soils.
Bromegrass – Smooth – Perennial – (Bromus inermis)
Description: Sod-forming since it spreads by underground rhizomes; leafy and grows to height of 3-4feet; head is an open panicle; stem smooth and round; short ligule, fused leaf sheath.
Uses: Hay and pasture-drought tolerantVarieties: Historically, not well adapted to Virginia because of diseases. However, newer varieties
may have potential.Weight Per Bushel: 14 lbsSeeds Per lb: 137,000Germinating: 14 daysFertilizer: 100-200 lbs N. Lower levels required when used as pasture in split applications, 40-90
lbs P20
5, and 85-185 lbs K
20 annually on soils testing medium.
pH Range: 5.8–6.7Soil adaptation: Well drained, fertile soilsPlanting: Early spring, or with small grain in fall, Seeded at 10 lbs in mixture. Do not seed alone.Harvesting : Early bloom stage. Do not graze or cut during stem elongation.
Buckwheat – Annual – (Fagopyrum esculentum)
Description: Erect plant, 2-4’ tall; single stem may have several branches; flowers light green, pink, orred in color.
Uses: Grain used for livestock, especially poultry; ground into flour (middlings for livestock).Good honey and green manure crop.
Weight per bushel: 48 lbsSeeds /lb: 15,000Germinating time: 6 dayspH Range: 5.5-6.0Fertilizer: 20-30 lbs N, at medium soil test levels apply 40-50 lbs P
20
5 and 40- 50 lbs K
20
Soil adaptation: Any well drained soil. Will grow on infertile, acid soils better than most crops, butresponds well to proper treatment.
Depth of Planting: 1/2”-2”. Do not plant deeper than 2”.Planting: Latter part of May to middle of July. Seeds do not set well in warm weather. Likes cool,
moist climate. Seed at 48-72 lbs in 6-8” rows or solid seeded. No-till can work well.

Crop Descriptions 7
Virginia Cooperative Extension Agronomy Handbook
Buckwheat – Annual – (Fagopyrum esculentum) (cont.)
Harvesting (grain): Combine when the maximum number of seeds have matured and plants have lost most oftheir leaves. Drying may be necessary for safe storage.
Approximateharvest dates: September 1-15Approximate Yield: 20-25 bushels/A
Caucasian Bluestem (Bothriochloa caucasica) Warm-season Perennial
Description: Long lived perennial bunch grass. It is an erect, fine-stemmed, leafy bunch grass whichproduces many seedheads above the leaf base throughout the summer. Begins growthtwo to three weeks later than switchgrass in spring.
Uses: Primarily for pasture, but also for haySeeds Per lb: 1,000,000Germination Time: 3-30 daysFertilizer: Responds to N, apply 60-120 lbs N/A/Yr. in split applications. Maintain P and K at
medium levels.pH Range: 5.5-6.2Soil Adaptation: Adapted to wide range of soils. It performs better on the finer textured soils such as
loams, clay loams, and silty loams but will also grow well on sandy loam soils. Cauca-sian bluestem does not do well on extremely sandy soils, and wetland soils.
Time of Planting: After soil temperature reaches 65˚F in late May or early June.Rate of Planting: 2-3 lbs/A pure live seed.Method of Planting: Plant into a prepared, firm seedbed no deeper than 1/4 inch. However, no-till seeding
can be done if plant residue is not thick enough to prevent seed to soil contact.Harvesting (hay): Harvest in boot stage.Harvest (pasture): Maintain in vegetative stage. Losses palatability after seedhead emergence. Tolerates
close grazing. Rotational stocking best.Approximate Yields: 3-5 tons hay/A
Comfrey, Quaker (also called Russian Comfrey) – Perennial – (Symphytum peregrinum)
Description: Grows to a height of 3-4 feet; very large leaves feel somewhat sticky; large, fleshy rootsthat grow to 8-10 feet deep; purple or red-purple flowers borne in clusters at tips ofstems.
Uses: Green manure-can be fed as forage.Fertilizer: 60 lbs N; Apply 60 lbs P
20
5 and 60 lbs K
20 at medium soil test levels.
pH Range: 6.0-6.5Soil Adaptation: Wide rangePlanting: Fall or early spring. Root cuttings in rows 3 feet apart in prepared seedbed.Harvesting: Cut to a 2” stubble when leaves reach a length of 18-24 inches.Approximate Yield: Hay, 3-5 tons/A
Corn – Field Corn – Annual - (Zea mays)
Description: Often referred to as maize. Leaves are arranged alternately on the stem. The tassel ormale part of the flower is at the top of the plant, and the ear located below the tassel is thefemale portion. Even number of rows of kernels on each ear.
Uses: Grain and silageWeight Per Bushel: Shelled, 56 lbs; ear corn, 70 lbs at 15.5% moisture.

8 Crop Descriptions
Agronomy Handbook Virginia Cooperative Extension
Corn – Field Corn – Annual - (Zea mays)(cont.)
Seeds Per lb: 1,200-1,400Germinating Time: 7 daysFertilizer: For grain, 125-150 lbs N; Apply 40-60 lbs P
20
5 and 40-60 lbs K
20 at medium soil test
levels. For silage, increase the amount of P20
5 applied by 1/3, and double the amount of
K20. Follow soil sample results for zinc and manganese and use tissue analysis to
evaluate other micronutrient needs. Consideration should be given to nitrogen andphosphorus residual from previous crops or organic sources.
pH Range: 5.8 – 6.2Soil Adaptation: Well drained to somewhat poorly drained soilsTime of Planting: Full-season corn should be planted one week before to one week after average date of last
killing frost in spring. Corn will germinate at 50˚F, but growth rate is slow until tempera-tures reach 60˚F. Double-crop corn can be planted up to July 1.
Rate of Planting: On soils with high production potential, where good production practices are followed,plant 22,000 to 26,000 kernels per acre. If planted on droughty soils, the rate of plantingshould be decreased by 10-15%.
Pesticides: Herbicides are used on almost all corn grown in Virginia and insecticides are used onconsiderable acreage. For pesticide recommendations, contact your Extension agent.
Cultivation: Cultivation may aid in weed control and reduce surface compaction on some soils, butmost of the corn currently grown in Virginia is not cultivated.
Reduced-tillage orNo-till Corn: An annual cover such as small grain or permanent sod or a mulch from a previous crop is
important for success with no-till. Herbicides are used to kill existing vegetation andreduce weed competition throughout the season. A specially designed planter is used toplant the corn in the mulch with no soil preparation. Research has shown that yields ofno-till corn average higher than corn grown on plowed land. Other advantages are waterconservation and reduction in soil erosion.
Harvesting (silage): Hard dough stage when kernels are dented and a black layer is formed at their bases;lower leaves and husks are turning brown. Dry matter content should be 35-42%.
Harvesting (grain): Corn is mature at 30-35% moisture. A black layer of cells is formed at the base of thekernel at maturity. If corn is harvested with picker and cribbed, the moisture contentshould be no more than 20%. The optimum moisture for field shelling is between 18%and 26%. It should be dried to 13% moisture before storage.
ApproximateHarvest Dates: Silage, August 15-October 1; Grain, September 1-November 1.Approximate Yields: Silage, 14-25 tons of 35% dry matter; Grain, 75-225 bushels/A
Corn – Popcorn – Annual – (Zea mays everta)
Description: See field cornUses: Confection and mealFertilizer: Same as field cornpH Range: Same as field cornPlanting: 1-2 weeks after date of last killing frost at 22,000-28,000 seeds per A.Seeds Per lb: 3,000-6,000, depending on gradeGerminating Time: 7 daysIsolation: Do not plant where it will cross with other corn. Crossing reduces popping qualities.Harvesting (grain): Yields from 1/3 to 2/3 as much grain per acre as ordinary field corn. Shuck from stand-
ing stalks after it is thoroughly ripe. Do not put in crib until well cured. Maximumpopping expansion is reached when kernel moisture is about 13-14%.
Cultivation: Refer to field corn for information on fertilization and weed control.Rotation: Same as field corn when grown commercially.

Crop Descriptions 9
Virginia Cooperative Extension Agronomy Handbook
Cotton–Annual — (Gossypium hirsutum)
Uses: Grown primarily for fiber; seed used for stock feed, fertilizer, and oil; primarily adaptedto the eastern shore and southeastern area of the state.
Weight Per Bushel: 30 lbsSeeds per lb: 4,800 acid-delintedGerminating time: 12 daysFertilizer: 50-70 lbs N; At medium soil test levels apply 60-120 lbs P
20
5 and 10-80 lbs K
20. Side-
dress with 25-75 lbs N.pH Range: 5.8-6.2Soil Adaptation: Well drained sandy loans and loams, but does well on some fine-textured upland soils.Time of Planting: After soil begins to warm, usually about April 5-May 1
Crimson Clover – Annual – (Trifolium incarnatum)
Description: Central taproot with many fibrous roots; 3 leaflets per leaf; stem and leaves hairy;pointed,conical flower at top of stem is bright crimson color; plants 1-3’ tall.
Uses: Green manure, hay and pasture cropWeight Per Bushel: 60 lbsSeeds Per lb: 150,000Germinating Time: 7 daysFertilizer: Zero N; 40-120 lbs P
20
5 and 60-90 lbs K
20 at medium soil test levels
pH Range: 5.8-6.5Soil Adaptation: Well drained and moderately well drained soils; best suited to the Coastal Plain and
Eastern Piedmont.Inoculation: Important--Cross-inoculates with red, alsike, ladino, and white clovers.Planting: In the fall, 30-60 days before frost. Plant 20-30 lbs hulled seed alone; 15 lbs in mixtures.Harvesting (hay): Cut when most advanced heads are beginning to show faded flowers at base. Dangerous
as horse feed if cut when ripe.Approximate Yield: Hay, 1-2 tons/ASeed Yield: 6-10 bushels; shatters easily when ripeApproximateHarvest Dates: Hay, May 15-June 1; seed June 15-July 1. For green manure, spray or till 20-30 days
before planting succeeding crop
Crownvetch – Perennial – (Coronilla varia)
Description: Creeping underground roots; stems are leafy, hollow, and weak, reaching a height of 2-4’if supported; flowers white with shading to rose or violet; blooms all summer; seed podsbreak apart at maturity.
Uses: Ornamental, erosion control, and stabilization; limited potential for pasture and haybecause of limited regrowth after defoliation.
Weight Per Bushel: 55 lbsSeeds per lb: 110,000Fertilizer: Zero N; 90-120 lbs P
20
5 and 60-90 lbs K
20 at medium soil test levels.
pH Range: 5.5 – 6.5Soil Adaptation: Does best on well drained soils, but will persist on moderately acid, rather infertile soils.Inoculation: Important. Specific inoculum requiredPlanting: Late winter or early spring at 5-10 lbs scarified seed. Plant in rows or solid seeded.
Rhizomes can be planted.
10 Crop Descriptions
Agronomy Handbook Virginia Cooperative Extension
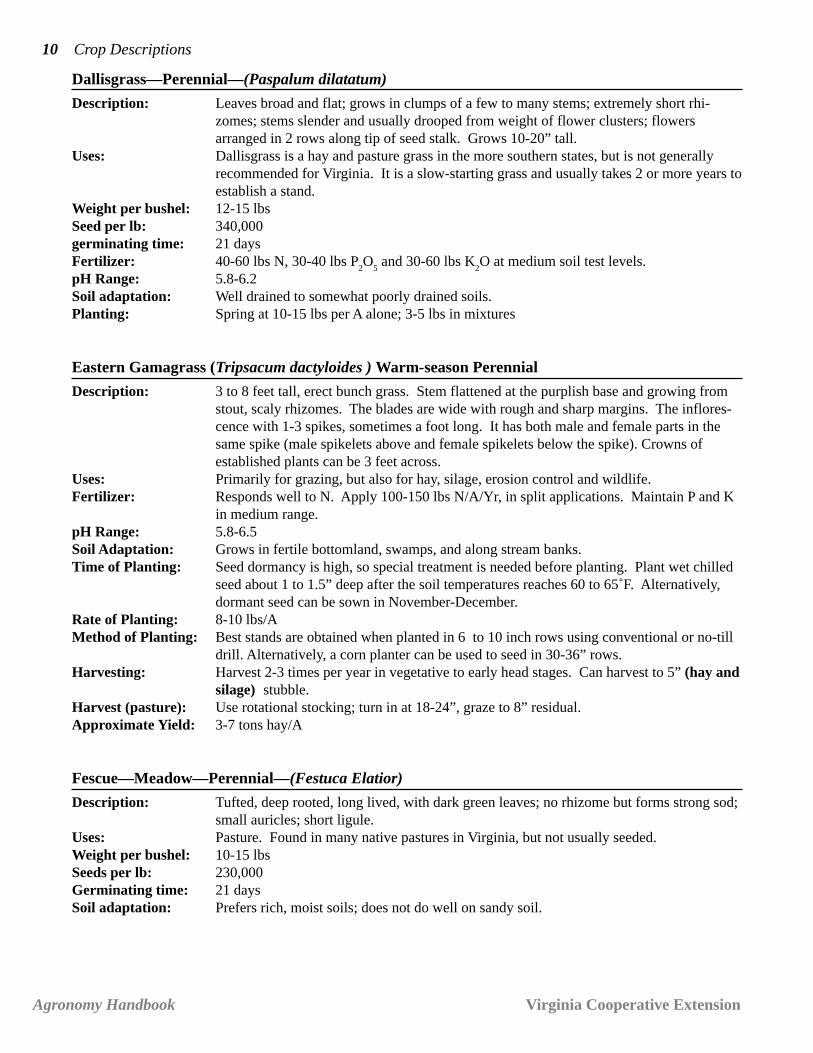
Dallisgrass—Perennial—(Paspalum dilatatum)
Description: Leaves broad and flat; grows in clumps of a few to many stems; extremely short rhi-zomes; stems slender and usually drooped from weight of flower clusters; flowersarranged in 2 rows along tip of seed stalk. Grows 10-20” tall.
Uses: Dallisgrass is a hay and pasture grass in the more southern states, but is not generallyrecommended for Virginia. It is a slow-starting grass and usually takes 2 or more years toestablish a stand.
Weight per bushel: 12-15 lbsSeed per lb: 340,000germinating time: 21 daysFertilizer: 40-60 lbs N, 30-40 lbs P
2O
5 and 30-60 lbs K
2O at medium soil test levels.
pH Range: 5.8-6.2Soil adaptation: Well drained to somewhat poorly drained soils.Planting: Spring at 10-15 lbs per A alone; 3-5 lbs in mixtures
Eastern Gamagrass (Tripsacum dactyloides ) Warm -season Perennial
Description: 3 to 8 feet tall, erect bunch grass. Stem flattened at the purplish base and growing fromstout, scaly rhizomes. The blades are wide with rough and sharp margins. The inflores-cence with 1-3 spikes, sometimes a foot long. It has both male and female parts in thesame spike (male spikelets above and female spikelets below the spike). Crowns ofestablished plants can be 3 feet across.
Uses: Primarily for grazing, but also for hay, silage, erosion control and wildlife.Fertilizer: Responds well to N. Apply 100-150 lbs N/A/Yr, in split applications. Maintain P and K
in medium range.pH Range: 5.8-6.5Soil Adaptation: Grows in fertile bottomland, swamps, and along stream banks.Time of Planting: Seed dormancy is high, so special treatment is needed before planting. Plant wet chilled
seed about 1 to 1.5” deep after the soil temperatures reaches 60 to 65˚F. Alternatively,dormant seed can be sown in November-December.
Rate of Planting: 8-10 lbs/AMethod of Planting: Best stands are obtained when planted in 6 to 10 inch rows using conventional or no-till
drill. Alternatively, a corn planter can be used to seed in 30-36” rows.Harvesting: Harvest 2-3 times per year in vegetative to early head stages. Can harvest to 5” (hay and
silage) stubble.Harvest (pasture): Use rotational stocking; turn in at 18-24”, graze to 8” residual.Approximate Yield: 3-7 tons hay/A
Fescue—Meadow—Perennial—(Festuca Elatior)
Description: Tufted, deep rooted, long lived, with dark green leaves; no rhizome but forms strong sod;small auricles; short ligule.
Uses: Pasture. Found in many native pastures in Virginia, but not usually seeded.Weight per bushel: 10-15 lbsSeeds per lb: 230,000Germinating time: 21 daysSoil adaptation: Prefers rich, moist soils; does not do well on sandy soil.

Crop Descriptions 11
Virginia Cooperative Extension Agronomy Handbook
Fescue—Creeping Red—Perennial—(Festuca rubra)
Description: Narrow leaves that are folded with a very short ligule; base of stem is usually red.Uses: Primarily for lawns in shade. Very similar to sheep’s fescue except leaves are bright
green instead of bluish and it spreads by underground-modified stems (rhizomes).Weight per bushel: 10-15 lbsSeeds per lb: 400,000Germinating time: 14 daysFertilizer: See Turfgrass section.pH Range: 5.0-6.2Soil adaptation: Well drained to moderately well drained soils. Does best on sandy soils. Will tolerate
shade and low pH better than ryegrass or bluegrass.Planting: September or early spring at 3-5 lbs per 1000 sq ft for turf.
Fescue—Sheep’s—Perennial—(Festuca ovina)
Description: A long-lived bunch grass which forms dense turf; numerous stiff, rather sharp, nearlyerect, bluish-gray leaves; a tough grass, eaten eagerly by sheep but to a lesser degree bycattle.
Uses: Pastures, seldom seeded.Weight per bushel: 10-15 lbsSeeds per lb: 530,000Germinating time: 21 daysFertilizer: 40-60 lbs N, 30-40 lbs P
2O
5 and 30-60 lbs K
2O
pH Range: 5.0-6.2Soil adaptation: Most well drained soils. Does better than most grasses on sandy soils.Planting: August or early fall is best, but may be sown in spring at 25 lbs along; 10-12 lbs in
mixtures.
Note: Commercial seed comes from Europe.
Fescue—Tall—Perennial—(Festuca arundinacea)
Description: Long lived, tufted, deep-rooted; noted for early spring and late fall growth; leaves aredark green, shiny, and barbed along the edges, making them feel rough; leaves rolled inbud, very short ligule, sheath reddish pink below ground. Most existing tall fescue standsare infected with a fungal endophyte that induces fescue toxicosis in cattle.Varieties: Endophyte-free varieties are somewhat less hardy than endophyte-infected tallfescue, requiring more careful management. Modern endophyte-free varieties arestronger than earlier varieties. Endophyte-enhanced varieties have potential.
Uses: Pasture, hay, and turf. Excellent when seeded at high rates for turf. Widely used forwinter grazing.
Weight per bushel: 24 lbsSeeds per lb: 220,000Germinating time: 14 daysFertilizer: Establishment – 40 lbs N, 120-140 lbs P
2O
5 and 120-140 lbs K
2O at medium soil test
levels. Pasture topdressing 30 lbs P2O
5 and 30-60 lbs K
2O annually or 40-125 lbs P
2O
5
and K2O every 3-4 years. (For winter grazing, apply 60-75 lbs N in mid-august). Hay
topdressing –120-200 lbs N, 40-90 lbs P2O
5 and 85-185 lbs K
2O. For turf, see Turf
section.

12 Crop Descriptions
Agronomy Handbook Virginia Cooperative Extension
Fescue—Tall—Perennial—(Festuca arundinacea) (cont.)
pH Range: 5.6-6.2Soil adaptation: Adapted to practically all tillable soils. Tolerant to both dry and wet soils.Planting: Early fall or spring at 15-25 lbs when seeded alone, and 6-12 lbs in mixtures for pasture;
4-6 lbs per 1,000 sq ft for turf.Harvesting (hay): 1st cut when heads begin to emerge. Stems and seedheads of endophyte-infected fescue
are Highly Toxic. Approximate yields: 2-6 tons hay/acreHarvesting (seed): When field takes on yellowish-brown cast and heads droop.Harvesting (pasture): Tolerant of continuous stocking. With rotational stocking, turn in at 8”, remove cattle at
2-3”. Keep vegetative to reduce potential problems with endophyte. Remove pregnantmares from endophyte-infected fescue during last 3 months of gestation.
Field Peas — Canadian – Annual — (Pisum arvense)
(See Austrian Winter Pea)
Johnsonsgrass – Perennial – (Sorghum halepense)
Description: A coarse, tall-growing grass of the sorghum group that spreads by seed and strong under-ground stems; used as hay and pasture in some of the southern states, but is considered aserious pest in crop fields in Virginia and most of the eastern U.S.
Grazing precautions: Johnsongrass is considered a NOXIOUS weed in Virginia and is prohibited as a seedcontaminant. It is also against the law to seed this plant. It spreads easily by seeding toother fields. Precautions are similar to sudangrass.
Kudzu– (Perennial) – Pueraria thunbergiana)
Description: Legume, deep-rooted, long lived, coarse-growing vine with runners which often grow 50-100’ per season. Produces few seeds, but once established can be a serious pest.
Uses: For reclaiming gullies and wasteland. Tolerates medium acidity. May be used forpasture and hay.
Fertilizer : At 3-yr intervals, 60-100 lbs P2O
5 and 60-100 lbs K
2O
pH Range: 5.5-6.2Inoculation: Cross-inoculates with cowpeas, peanuts, and lespedezas. Method of planting: Plant
crown in holes or trench 15” deep and 18” wide. On gullied areas, plant in hole 15” deepand 18” wide on 20’ squares. On wasteland, plant in deep furrows 20’ apart and spacecrowns 4’ in furrow.
Lespedeza – Bicolor – Perennial – (Lespedeza bicolor)
Description: Bushy shrub; grows 3-6 ft tall; strongly ridged and grooved stems.Uses: Primarily as food for game birds and for erosion control. Not adapted to high altitudes
because seed will not ripen in short season. Not adapted to wet areas.Weight per bushel: 60 lbsSeeds per lb: 85,000Germination time: 21 days.Fertilizer: Zero N, 60-90 lbs P
2O
5 and 30-60 lbs K
2O
pH Range: 5.5-6.2Planting: In spring after frostRate of Planting: Seed in rows 3’ apart at rate of 10 lbs per A, or set plants 2’ apart in rows spaced 3’ apart.
Use scarified seed.

Crop Descriptions 13
Virginia Cooperative Extension Agronomy Handbook
Lespedeza – Annual – Korean – (Lespedeza stipulaceae) – Common – (Lespedeza striata)
Description: Warm-season reseeding legume. Slender, branched stems; branched taproot; three leafletstipules at base of leaf; stipules very prominent on Korean. Non-bloating.
Uses: Hay, pasture, and wildlife cover. Killed by frost and furnishes poor winter cover. Seed inmixtures with grasses or other legumes; or, if seeded alone, use winter cover crop. Maynot reseed above 2,500’ elevation.
Weight per bushel: Kobe, 30 lbs; Korean, 45 lbsSeeds per lb: Kobe 185,000; Korean 240,000Germinating time: 14 daysFertilizer : At seeding, zero N, 60-90 lbs P
2O
5 and 60-90 lbs K
2O
pH Range: 5.5-6.2Soil adaptation: Will grow on almost any well drained soil. Korean adapted to all areas of Virginia. Kobe
adapted to southeastern section. Tolerant of acidity and low soil P. Cross-inoculates withperennial lespedezas, peanuts, and cowpeas.
Planting: February and March at 15-25 lbs alone; 10 lbs in mixtures. Plant in 6-8” rows or solidseeded in small-grain fields. Harrow grain before seeding if soil is hard on top. Can befrost seeded in late winter.
Harvesting (Hay): Early bloom stageHarvesting (seed): Combine in fall when ripeApproximateharvest dates: Hay: August 1-September 1; seed: September 15-November 1Approximate yield: Hay, 1-2 tons, seed, 200-500 lbs/A
Lespedeza –Sericea– Perennial – (Lespedeza cuneata)
Description: Growth habit similar to alfalfa; stems grow from crown buds in a height of 2-4”; deepbranched taproot. Warm season, drought tolerant, non-bloating.
Varieties: High- and low-tannin types. Low-tannin varieties AV-Lotan and AV-Donnelly morepalatable but less persistent.
Uses: Erosion control, hay, pasture, and cover for wildlife.Weight per bushel: 60 lbsSeeds/lb: 335,000Germination time: 28 daysFertilizer: Zero N, 60-90 lbs P
2O
5 and 30-60 lbs K
2O
pH Range: 5.0-6.2Inoculation: Cross-inoculates with annual lespedezas, cowpeas, and peanuts.Soil adaptation: Will grow on almost any well drained soil. Very tolerant of acid soil and low fertility.Planting: Unhulled seed, late fall or early spring; scarified seed, March or April. Plant unhulled
seed, 30-40 lbs; scarified seed, 15-20 lbs in 6-8” rows or solid seeded. Slow establish-ment.
Harvesting (hay): When plants are about 15-24” tall. High tannin levels drop when harvested for hay,improving palatability and digestibility.
Harvesting (seed): Direct combined. Second growth produces seed more uniformly and is easier to threshthan first crop, but yield of first crop usually higher.
Harvest (pasture): Begin grazing at 8-10”, do not graze lower than 4”.Approximateharvest dates: Hay, June 15-July 1; seed, August 15-September 15.Approximate yield: Hay, 2-3 tons; seed, 300-600 lbs/A

14 Crop Descriptions
Agronomy Handbook Virginia Cooperative Extension
Matua Prairie Grass – (Kunth) – Perennial – (Bromus willdenowii)
Description: Matua, also known as “rescuegrass” is a cool-season, short-lived perennial grass. Matuais an erect growing plant with bunch-type growth habit. It grows up to 2-3 feet, includingthe inflorescence. It looks like orchardgrass except that basal leaf sheaths of prairie grassare densely covered with fine hairs and the ligule is shorter and has no auricles. Addi-tionally, matua grass leaves are light green to green rather than bluish green likeorchardgrass.
Uses: Suited for hay, greenchop, or silage and can be used for dairy or beef pastures underrotational stocking management. It is not suited for continuous grazing.
Seeds per lb: 90,000Fertilizer: Requires high level of nitrogen; 40 lbs N/A at seeding recommended. For high level of
production apply 50-60 lbs N/A following mechanical harvest or 30-40 lbs N/A followingeach grazing. Apply 40-90 lbs P
2O
5/acre and 85-185 lbs K
2O/A annually. Lower P and K
amounts needed on pasture.pH Range: 6.0 to 7.0Soil adaptation: Adapted to well drained, high fertility soils.Planting: May be seeded in the fall or spring when the soil temperatures are at least 55oF. Seed
treatment with fungicide prior to seeding may control head smut.Rate of planting: 25 lbs/acre for drilled plantings; 30-40 lbs/acre for broadcast seeding; and 10-15 lbs/acre
in mixture.Method of planting: No-till or conventional planing methods may be used. Seed must be planted no more
than 1/4-1/2” deep.Harvesting (hay): Mechanical harvest for hay or grazing should begin at the boot stage for best quality,
yield and longevity. A regrowth/rest period of 30-42 days depending on the season isessential. Matua has a yield potential of 3-6 tons/year/acre. One regrowth per year mustbe allowed to set seed to maintain the stand.
Seeds per lb: 335,000Germinating time: 28 days
Millet – Pearl – Annual – (Pennisetum glaucum)
Description: Erect growth habit; thick stems that grow 3’-7’ tall; spike head. Regrows after cutting/grazing.
Uses: Supplemental pasture, hay crop, green chop. Requires 60-70 days to mature.Weight per bushel: 40-55 lbsSeeds per lb: 86,000Germination time: 10 daysFertilizer: At seeding, 60-80 lbs N, 70-90 lbs P
2O
5 and 70-90 lbs K
2O at medium soil test level; after
each cutting, 40-60 lbs NpH Range: 5.5-6.5Planting: May 1-July 1 at 25-40 lbs alone, 15-20 lbs in mixtures in 6-8” rows or solid seeded.Harvesting (hay): Cut when heads begin to emerge from boot or at 30-40”.Harvesting (pasture): Requires high stocking rate, preferably with rotational stocking.Approximatefirst harvest date: July 1-July 15.Approximate yield: Hay, 2-4 tons/A

Crop Descriptions 15
Virginia Cooperative Extension Agronomy Handbook
Millet – Foxtail – Annual – (Setaria italica)
Description: Erect growth; slender, leafy stems 2’-5’ tall; spike-like head.Uses: Supplemental pasture and hay crop, nurse crop for late spring and early summer forage
seedings, smother crop prior to late summer no-till forage seedings. Requires 60-70 daysto mature. Lower yield and regrowth than pearl millet.
Weight per bushel: 40-55 lbsSeeds per lb: 220,000Germinating time: 10 daysFertilizer: 60-80 lbs each of N, P
2O
5 and K
2O, at medium soil test levels.
pH Range: 5.8-6.2Planting: May 1-July 1 at 15-30 lbs along; 15-30 lbs in mixtures in 6-8” rows or solid seeded.Harvesting (hay): Cut at seedhead emergence. Do not feed to horses.Approximate yield: Hay, 1-3 tons/A
Milo
(Please see sorghum, grain)
Oats-Annual – (Auena sativa)
Description: Panicle type head; long ligule, auricles absent; leaf margins are heavy; seed usuallyretains the husk (lemma and palea), which has a very smooth surface; seed color varieswith variety from white, yellow, gray to somewhat red. Winter oats require a period ofcold temperature to initiate heading. Spring oats have no temperature requirement.
Uses: For grain, hay, and grazing. Excellent rotational crop for wheat or barley because it is notsusceptible to the same species of diseases. Does not get “take all”.
Weight per bushel: 32 lbsSeeds per lb: 14,000Germinating time: 10 daysFertilizer: 20 lbs of N in the fall plus 40-90 lbs each of P
2O
5 and K
2O at medium soil test levels.
Topdress with 60-80 lbs of N in February or early March. These rates assume no carryover N from the previous crop.
pH Range: 6.0-6.5Soil Adaptation: Well drained loams and silt loams are best.Planting: Winter oats: (Not recommended west of the Blue Ridge.) Fall, September 25-October
15 in eastern Virginia, and September 1-October 1 in Piedmont; midwinter: February 1-March 1 for the entire State. Spring oats: March 5-April 1 in Piedmont; March 15- April10 west of the Blue Ridge. Spring oats not recommended in eastern Virginia. Plant at65-80 lbs or 12-15 seeds/drill foot in 6-8” rows or solid seeded.
Harvesting (hay): Cut in boot to early dough stage.Harvesting (seed): Combine when fully ripe at 10-15% moisture.Approximateharvest dates: Winter, June 20-July 15, Spring, July 1-July 15Approximate yield: 80-120 bushels or 2 tons hay/A

16 Crop Descriptions
Agronomy Handbook Virginia Cooperative Extension
Orchardgrass – Perennial – (Dactylis glomerata)
Description: Long-lived, deep-rooted bunch grass; leaves light green and folded and flat at the base;tufted seed heads; long ligule. Flowers only in spring. Regrowth is vegetative with nostem or seedhead production.
Uses: Pasture, hay, and silage.Weight per bushel: 14 lbsSeeds per lb: 590,000 unhulled, 625,000 hulledGerminating time: 10 daysFertilizer: At medium soil test levels. Establishment—When seeded alone, 40-50 lbs N, 120-140 lbs
P2O
5 and 120-140 lbs K
2O. Maintenance (hay)—120-200 lbs N applied 1/2 in early
spring and the other 1/2 after 1st cutting plus 40-90 lbs P2O
5 and 85-185 lbs K
2O. When
seeded with clover, nitrogen rate should be reduced to 20 lbs. For maintenance wherethere is more than 35% clover, no nitrogen is needed.
pH Range: 5.8-6.2Soil adaptation: Does best on well drained, loam soil.Planting: In eastern Virginia, seed after first good rain in September and up to October 15, or
during February or early March. In the Piedmont and west of the Blue Ridge, seed afterfirst good rain in August and up to September 15, or from March 1-April 15. Plant 8-12lbs alone; 3-6 lbs in mixtures
Harvesting : Cut in boot to early head stage. Fiber percentage increases rapidly after blooming.(hay and silage)Harvesting (pasture): Do not graze below 3”. Rotational stocking with 1-4 day grazing periods is best.Approximatefirst harvest dates: Hay, May 15-June 1, seed, June 1-July 1Approximate yield: Hay, 2-5 tons/A/year; seed, 200-600 lbs/A
Peanuts – Annual – (Archis hypogeae)
Description: Legume plant native to South America. Growth habit varies from prostrate to upright.Bright yellow flowers on either the main stem or lateral branches. Flowers contain bothmale and female parts and are self-fertile. Following fertilization a “peg” bearing ovariesin its top elongates from the leaf axil and penetrates the soil. The peg then turns horizon-tally and pod and seed formation takes place. Seed per pod varies from 1-5 depending onmarket type. A pod will most often have two seeds.
Uses: Food for humans and livestock.Weight per bushel: 18-22 lbs in shell; 48-52 lbs shelledSeeds per lb: Virginia-type, 500-800; runner-type, 700,000; Spanish-type, 1,000-1,400 lbs in shellGerminating time: 7-10 daysFertilizer: Direct fertilization not recommended. Increase the fertilizer application on the crop that
precedes peanuts in rotation by 50-100 lbs P2O
5 and 10-60 lbs K
2O. Apply 900 lbs
gypsumbroadcast or 600 lbs banded over the row as plants begin to bloom.pH Range: 5.8-6.5Inoculation : Cross-inoculates with lespedezas, cowpeas, and kudzu.Soil adaptation: Best quality peanuts are produced on well drained, light, sandy soils. May be produced
anywhere east of mountains, but yield and quality are usually poor on heavier soils.Rotate peanuts with other non-legume crops.
Planting: April 20-May 10. Soil temperature should be at least 65oF for three consecutive days.Rate of planting: Peanuts should be planted 3-4” apart in 30-36” rows. This requires approximately 75-
175 lbs of shelled nuts, depending on seed size. Plant 1 1/2-2” deep.

Crop Descriptions 17
Virginia Cooperative Extension Agronomy Handbook
Peanuts – Annual – (Archis hypogeae) (cont.)
Weed control: Herbicides and cultivation may be used. Cultivation should be shallow and often enoughto control weeds until pegs enter the ground. Do not cover any portion of the vine withsoil. Rotary hoeing when crust forms can be beneficial.
Harvesting: Dig when about 70% of the shells turn brown on the inside, usually 130-170 days afterplanting.
Approximateharvest date: September 15-November 1Approximate yield: 2,500-5,000 lbs/AStorage: Contain about 50% moisture when dug; must be dried to 10% moisture for storage.
Rape – Annual – (Brassica napus)
Description: Cool-season plant in the mustard family. Closely resembles kale with large, dark greenleaves. At maturity it reaches a height of 3-6’ with brilliant yellow flowers and pods thatproduce 15-40 small black seeds. Winter and spring varieties are available
Uses: Pasture and as oil crop. Usually ready for grazing about 8 weeks after seeding. Some-times causes bloating in sheep.
Weight per bushel: 50 lbsSeeds per lb: 160,000Germinating time: 7 daysFertilizer: 60-80 lbs N, 30-50 lbs P
2O
5 and 30-50 lbs K
2O at medium soil test levels.
pH Range: 5.2-6.2Soil adaptation: Well drained and moderately well drained loams and silt loam soils.Planting: February and March, or August and September at 2-3 lbs in rows; 6-9 lbs broadcast ; 4-6
lbs when seeded with oats.
Red Clover – Perennial – (Trifolium pratense)
Description: Numerous leafy stems arising from a crown growing to a height of about 2’ ; stems andleaves are hairy; flowers reddish purple on heads at tips of branches; branched taproot.Short-lived perennial that often behaves as biennial.
Varieties: New varieties are more persistent.Uses: Hay, pasture, silage, and commercial seed productionWeight per bushel: 60 lbsSeeds per lb: 260,000Germinating time: 7 daysFertilizer: At seeding, 120-140 lbs P
2O
5 and 120-140 lbs K
2O; for topdressing, 40-90 lbs P
2O
5 and
85-185 lbs K2O at medium soil test levels. Lower amounts needed when used as pasture.
pH Range: 5.8-6.5Soil adaptation: Well drained to moderately well drained loams and silt loam soils properly limed and
fertilized.Inoculation: Important. Cross-inoculates with alsike, crimson, ladino, and white clovers.Planting: 45 days before last killing frost in spring, or 30 days before first killing frost in fall. Plant
at 8-10 lbs alone; 2-6 lbs in mixtures. Plant in 6-8” rows or solid seeded usually with agrass. Broadcast or drill on small grain or closely grazed grass pasture in later winter orearly spring.
Harvesting (hay): 1/4-1/3-bloom stage. Early harvesting for hay favors good seed yield by second crop.Second cutting of hay may cause slobbering in livestock.

18 Crop Descriptions
Agronomy Handbook Virginia Cooperative Extension
Red Clover – Perennial – (Trifolium pratense) (cont.)
Harvesting (seed): Cut with combine when heads have turned brown, flowers and stalks are deep yellow,and seeds have begun to show a distinct violet color. Will shatter badly if cut later. Mayuse a dessicant to aid in drying plant.
Approximate first harvest dates: Hay, June 1 – June 20. Seed, August 15-September 1.Approximate yield: Hay 2-4 tons over season. Seed, 120-240 lbs/A
Redtop (Herdsgrass) – Perennial – (Agrostis alba)
Description: Produces numerous stems from a well-developed base; spreads by rhizomes but does notproduce a strong sod; flat, light green, sharp-pointed leaves; lacks leafiness under closegrazing; long prominent ligule.
Uses: Primarily for erosion control and soil stabilization.Seeds per lb: 5,100,000Weight per bushel: 14 lbsGerminating time: 10 daysFertilizer: 40-60 lbs N, 60-100 lbs P
2O
5 and 60-100 lbs K
2O. The N is for annual applications, the
P2O
5 and K
2O are rates for 3-4 years
pH Range: 5.8-6.2Soil adaptation: Well drained and moderately well drained loams and silt loams. Tolerant to wet condi-
tions.Planting: August and September. May be seeded in spring. Plant at 3-5 lbs alone; 3 lbs in mix-
tures. Plant in 6-8” rows or solid seeded.Harvesting (hay): Shortly before full bloom.
Reed Canarygrass – Perennial – (Phalaris arundinacea)
Description: Tall, coarse, sod-forming cool-season grass; grows 2’-5’ tall; spreads underground byshort, scaly rhizomes; semi-dense, spike-like panicle.
Uses: Hay, pasture, and silage. Conservation cover in wet areas and areas irrigated for disposalof liquid wastes.
Weight per bushel: 45 lbsSeeds per lb: 430,000Germinating time: 21 daysFertilizer: Establishment- 50 lbs N, 120-140 lbs P
2O
5 and 120-140 lbs K
2O. Maintenance (pas-
ture)—40-60 lbs N, 30-40 lbs P2O
5, and 30-60 lbs K
2O. Maintenance (hay)—120-200 lbs
N applied 1/2 in early spring and the other 1/2 after 1st cutting plus 40-90 lbs P2O
5 and
85-185 lbs K2O. When seeded with clover-nitrogen rate should be reduced to 20 lbs. For
maintenance where there is more than 35% clover, no nitrogen is needed.pH Range: 5.8-6.2Soil adaptation: Tolerates poorly drained soils. More drought tolerant than many other cool-season
plants.Planting: Early fall or spring. Often slow to establish. Plant 12-14 lbs alone; 6-8 lbs in mixtures.
Plant in 6-8” rows or solid seeded.Harvesting: 1st cut when heads begin to emerge.Approximateharvest dates: Hay, May 15-June 15.Approximate yield: Hay, 2-4 tons/A

Crop Descriptions 19
Virginia Cooperative Extension Agronomy Handbook
Rye – Annual – (Secale cereale)
Description: The most winter-hardy of small grains. Seedings often have a reddish coloration; leaveshave small auricles with short ligules; seeds are round with the germ-end distinctlypointed; seed color varies from greenish gray and tan to dark brown or black.
Varieties: Abruzzi types provide earlier grazing in late winter-early spring.Uses: Cover crop, grain, silage, winter and spring pasture.Weight per bushel: 56 lbsSeeds per lb: 18,000Germinating time: 7 daysFertilizer: 20 lbs of N in fall plus 40-80 lbs each of P
2O
5 and K
2O. Topdress with 60 lbs of nitrogen
in February or early March.pH Range: 5.8-6.2Soil adaptation: Any well drained soil. Will do better on poor soils than wheat, oats, or barley.Planting: 60-90 lbs; 90-100 lbs for grazing. Plant 2 weeks before to 4 weeks after first killing frost.
Plant in 6-8” rows or solid-seeded.Harvesting (yield): Combine when fully ripe at 10-15% moisture. Rye ripens slowly and seed is easily
damaged during harvesting.Harvesting (silage): Harvest at the boot stageHarvesting (pasture): Earlier fall planting allows some late fall grazing. Stock heavily and rotationally to
maintain leafy growth.Approximateharvest date: Grain: June 20-July 10; silage: April 10-May 1Approximate yield: 25-50 bushels grain; 5-8 tons 35%-dry-matter silage/A
Ryegrass – Annual (Italian) – (Lolium multiflorum)
Description: Shiny, smooth leaves rolled in the bud, auricles narrow and long; short ligule; spikeletsedgewise on stem with awns on seed. Bunchgrass
Uses: Grows rapidly and in bunches to height of 3’. Used for hay and pasture, especially as asupplementary pasture mixed with crimson clover and/or small grain. Also used forgreen manure, winter turf and over-seeding bermudagrass. An annual that can volunteerin small-grain fields to become a pest.
Weight per bushel: 24 lbsSeeds per lb: 227,000Germinating time: 7 daysFertilizer: Pasture, 20 lbs N in fall and 30-50 lbs each of P
2O
5 and K
2O. Add 50-70 lbs N top
dressed in spring.pH Range: 5.8-6.2.Soil adaptation: Will grow well on most soils used for crops in Virginia.Planting: August 15 to November 15. Use the earlier seeding date for Northern Piedmont and west
of the Blue Ridge. Plant for pasture, 10-15 lbs in mixtures, 20-30 lbs alone.For turf, 3-5 lbs/1,000 sq ft
Harvesting (pasture): Tolerates close, continuous stocking
.

20 Crop Descriptions
Agronomy Handbook Virginia Cooperative Extension
Ryegrass – Perennial – (English Ryegrass) – (Lolium perenne)
Description: Similar to Italian in use, adaptability, and all other ways, but can be distinguished fromItalian by flowers being awnless and leaves folded in the bud, not rolled. Special variet-ies adapted for turf purposes.
Use: Pasture. High yielding during first year, but decreased yields in subsequent years due topoor persistence.
Planting: In mixtures, 10 lbs; alone, 20-30 lbsApproximate yield: 2-6 tons hay/A
Sorghum, forage – Annual – (Sorghum bicolor)
Description: Sorghum is very similar to corn in the vegetative stage. Leaves tend to be more narrowthan for corn. Heavily covered with a white waxy coating that can be rubbed off the leafsheath. Flowers are perfect in that both male and female parts are produced in a panicletype head on top of the plant. Forage sorghum is 6’-10’ tall with large stem, medium-size grain head.
Uses: silage, hay, grazing.Weight per bushel: 56 lbsSeeds per lb: 13,000-20,000Germinating time: 10 daysFertilizer: 60-80 lbs each of N, P
2O
5 and K
2O
pH Range: 5.8-6.2Soil adaptation: Well drained to somewhat poorly drained soilsPlanting: 1-2 weeks after corn. Soil needs to be warm (at least 60˚ F). Plant 5-20 lbs in rows with
a drill or corn planter.Harvesting: Do not graze until 30” tall. Cut for hay or wilted silage no later than early head emer-
gence. Cut in dough stage for direct ensiling.Approximate yield: Hay or wilted silage, 3-5 tons dry matter. Silage, 14-18 tons 35% dry matter/A
Sorghum, Grain – Annual – (Sorghum bicolor)
Description: See forage sorghum. Same genus and species except plant types that are shorter andproducelighter grain have been bred Plant height 3-5’ with high grain yield. Will recoverfrom high temperature and drought better than corn.
Uses: Grain and silageWeight per bushel: 56 lbsSeeds per lb: 13,000-20,000Germinating time: 10 daysFertilizer: Apply approximately the same amount that would be applied to corn when grown under
comparable conditions.pH Range: 5.8-6.2Soil adaptation: Well drained to somewhat poorly drained soilsPlanting: 1-2 weeks after corn. Early-medium maturing hybrids can be planted following small
grain harvest in eastern Virginia. Plant for grain at 5-7 lbs in rows; forage alone, 7-10lbs. Increase seeding rate 10-20% with late seedings. Grain sorghum should be plantedin rows as narrow as possible. Seed 1-1 1/2” deep.
Harvesting: Harvest grain with combine when seed is mature and shells easily from head. Chop forsilage when grain is in the dough stage. Artificial drying can be a problem because thesmall seed size reduces air flow through the grain.
Approximate yield: Grain, 80-90% of adapted hybrid corn yield. Silage, 11 tons 35% dry matter/A

Crop Descriptions 21
Virginia Cooperative Extension Agronomy Handbook
Sorghum, Sweet– Annual – (Sorghum bicolor var saccharum)
Description: Similar in appearance to forage sorghumUses: SyrupWeight per bushel: 45-60 lbsSeeds per lb: 28,000-40,000Germinating time: 10 daysFertilizer: 30-50 lbs N, 60-90 lbs P
2O
5 and 60-90 lbs K
2O. Side-dress with N to make a total of no
more than 70 lbs N when plants are 25-35 days old.pH Range: 5.8-6.2Soil adaptation: Any well drained soil suited for corn.Planting: 2-4 weeks after corn at 3-5 lbs in rows 30-36” apart. Plant 1-1 1/2” deep.Cultivation: Shallow, level, and often enough to keep down weeds. Chemical control also practiced.Harvesting (syrup): When seeds are in hard-dough stage.Approximateharvest date: September 1-October 1Approximatesyrup yield: 100-300 gallons/A
Soybean – Annual – (Glycine max)
Description: Legume 2-4’ tall. Broad trifoliate leaves with small white or purple flowers. Flowerinitiation is very sensitive to day length, but all plants do not respond the same way.Some cultivars bloom under relatively short days while others bloom under longer days.In Virginia, shorter-day cultivars are classified as maturity group 3 or 4; longer-daycultivars are classified as maturity groups 5 and 6. Two types of growth habit -- determi-nate and indeterminate. Indeterminate cultivar’s terminal bud continue to grow severalweeks after flowering; determinate cultivar’s terminal bud cease to grow when the plantstarts to flower. Tan or brown seedpod contain 2 to 3 round yellow seed. Stems, leaves,and pods are covered with gray or tawny hairs.
Uses: Seed, hay, and silage.Weight per bushel: 60 lbsSeeds per lb: Small-3,600; medium-3,000; large-2,500; extra large-1,600Germination time: 3-6 daysFertilizer: Zero N, 40-60 lbs each of P
2O
5 and K
2O
pH Range: 5.8-6.5Inoculation: Use soybean inoculum where soybeans are not grown regularly. Does not cross-inoculate
with other legumes.Soil adaptation: Well drained to somewhat poorly drained soils. Rotate with other non-legume crops.Planting: Two weeks after corn planting time for the area (full-season); double-cropped with small
grain, generally after June 15. Planting prior to June 10 results in maximum potentialyield. Yield declines rapidly if planted later due to lack of time to develop adequategrowth. Planting in 20-inch rows or less is recommended in order to meet canopyrequirements and maximize yield. No-tillage planting requires the use of a “burndown”herbicide to kill existing vegetation either mixed together with a preemergence herbicideor followed approximately two to three weeks later by a postemergence herbicide.
Pest Management: An integrated approach with cultural, biological, and chemical controls is necessary.Control weeds by three weeks after planting and maintain control until canopy closure.Rotation with non-host crops become necessary to prevent buildup of several nematodespecies.Several insect pest species are occasionally a problem in Virginia. Frequentscouting is needed to detect infestations. Control measures should be implemented whenpests exceed economic thresholds.

22 Crop Descriptions
Agronomy Handbook Virginia Cooperative Extension
Soybean – Annual – (Glycine max) (cont.)
Harvesting: When lower leaves begin to turn yellow and pods are about half-filled.(hay and silage)Harvesting (seed): When leaves have fallen and pods are brown and dry, seed moisture will be 10-15 %.Approximateharvest dates: Hay, August 15-October 1 Seed, September 20-December 1Approximate yield: Hay, 2-4 tons; Seed, 25-70 bushels/A
Sudangrass – Annual – (Sorghum sudanense) or Sorghum—Sudangrass Hybrid—Annual
Description: Smooth, erect stems reach height of 5’-7’; open panicle head; large leavesUses: Supplemental pasture in 40-45 days.Weight per bushel: 25-40 lbsSeeds per lb: Sudangrass, 55,000; Sorghum-Sudangrass hybrids, 20,000Germination time: 10 daysFertilizer: 60-80 lbs each of N, P
2O
5 and K
2O; plus 40-60 lbs N after each cutting
pH Range: 5.8-6.2Soil adaptation: Well drained to somewhat poorly drained soils.Planting: Two weeks after corn. Sudangrass, 25-35 lbs broadcast, 15-20 lbs in rows. Sorghum-
Sudangrass, 30-40 lbs broadcast, 20-30 lbs in rows. Plant in narrow rows or solid seeded.Precaution: Do not graze or harvest for green chop until plants are 24”-30” tall to reduce danger of
prussic-acid poisoningHarvesting (hay): Cut just as heads emerge.Harvesting (silage): Cut direct when grain is in dough stage, or as heads emerge and wilt.Approximateharvest dates: Hay or silage, July 1-July 15Approximate yield: Hay or wilted silage, 2-5 tons dry matter. Silage, 12-15 tons 35% dry matter/A
Sugar Beets – Biennial – (Beta vulgaris)
Description: Same species as the red garden beet but grows much larger. Leaves are large and shiny;white roots averaging 1-3 lbs. Sugar content 14-16%.
Uses: Sugar production and livestock feed.Seeds per lb: 72,000Germination time: 10-14 daysFertilization: 40 lbs N, 100 lbs P
2O
5 and 100 lbs K
2O prior to seeding. An additional 40 lbs N will be
needed 4-6 weeks later. Use a borated fertilizer.pH Range: 6.0-6.5Soil adaptation: Well drained silt or silty loam soil free of stones and roots.Planting: Late winter or early spring. If field is to be thinned, drop one seed per inch of row. Thin
when plants have 4-6 leaves, spacing plants 10-12” apart.Approximateharvest dates: October-December.Approximate yield: 20-30 tons/A

Crop Descriptions 23
Virginia Cooperative Extension Agronomy Handbook
Sunflower – Annual – (Helianthus annus)
Description: Plants with large leaves and bright yellow flowers. Young leaves and flowers tend to facethe sun. Very susceptible to bird damage.
Uses: Oil crop, bird feed, snack food.Weight per bushel: 26-30 lbsSeeds per lb: 5,000-8,000Germination time: 10-14 daysFertilization: 100 lbs of N plus 40-60 lbs each of P
2O
5 and K
2O
pH Range: 5.8-6.0Soil adaptation: Any well drained soilPlanting date: Tolerates freezing temperatures better than most crops. Can plant 2-3 weeks prior to last
killing frost. Because of early maturity, planting can continue until August 1 in easternVirginia.
Planting rate: Plant 19,000-20,000 plants/ACultivation: 1-2 cultivations will usually be necessary to control weeds. Herbicide selection limited.Harvesting: 110-120 days required from planting to harvest. Mature when the backs of heads turn
yellow. Special attachments necessary on small grain combine headers to prevent shatterloss.
Approximate yield: Seed, 1,200-2,000 lbs/A
Sweet Clover – Biennial – (Melilotus alba; Melilotus officinalis)
Description: Erect with many branches; deep taproot; stems grow from crown second year; yellow orwhite flowers; 2-5’ tall, leaflets notched on edges toward tips (unlike alfalfa with smoothedges). Plants and flowers have a sweet vanilla odor.
Varieties: Biennial white sweet clover preferred. Stems of the biennial yellow are finer and plantdoes not grow so high. Yellow blooms 10 days earlier.
Uses: Pasture, hay, and green manure. Poorly cured hay can result in hemorrhaging in livestockdue to accumulation of dicoumarin.
Weight per bushel: 60 lbsSeeds per lb: 250,000Germinating time: 10 daysFertilizer: Zero N, 40-70 lbs P
2O
5 and 50-80 lbs K
2O
pH Range: 6.5-7.0Soil adaptation: Well drained to moderately well drained soils.Inoculation: Important. Cross-inoculates with alfalfa and bur clover.Planting: February, using unhulled seed. Use scarified seed in late March or April. Hulled, 15 lbs;
unhulled, 25 lbs. Drill on grain in February or March, or sow on frozen ground.Harvesting (hay): Cut in bud stage before any bloom appears.Approximateharvest dates: Hay, May 10-June 1Approximate yield: Hay, 2-3 tons/A
Switchgrass – Perennial – (panicum virgatum)
Description: Native warm-season sod-forming tall grass (3-6’) that produces an open panicle seedhead. Scaly creeping rhizomes. Can be identified by the cluster or nest of hair at the baseof the blade where it joins the sheath.
Uses: Summer pasture or hay. Will not persist under close or frequent grazing.Seeds per lb: 330,000

24 Crop Descriptions
Agronomy Handbook Virginia Cooperative Extension
Switchgrass – Perennial – (panicum virgatum) (cont.)
Germinating time: 14-21 daysFertilizer: Generally low fertility requirement. At establishment, zero N, 80 lbs each of K
2O and
P2O
5. Maintain K
2O and P
2O
5 test in the medium soil test range. Apply 40-60 lbs N
annually if legumes are not present.pH Range: 5.5-6.5Soil adaptation: Deep, well drained to moderately well drained soils.Planting: May 15-July 15 using 6-8 lbs pure live seed.Harvesting (hay): Cut prior to seed head emergence.Harvesting (pasture): Begin grazing when 18”-24” tall. Do not graze below 8”.Approximatefirst harvest dates: July 15- August 1.Approximate yield: Hay, 2-5 tons /A
Tall Meadow Oatgrass – Perennial – (Arrhenatherum elatius)
Description: Bunchgrass that grows 3-5’ tall; open panicle head likes oats.Uses: Hay and pasture. Makes early spring growth but very little aftermath growth.Weight per bushel: 10-15 lbsSeeds per lb: 150,000Germinating time: 14 daysFertilizer: 40-60 lbs N, 30-40 lbs P
2O
5 and 30-60 lbs K
2O
pH Range: 5.8-6.2Soil adaptation: Well drained to moderately well drained sandy loam to silt loam soils.Planting: Late summer or fall using 15-20 lbs alone or 10-12 lbs in mixtures.Harvesting (hay): Cut at early heading stage.Approximateharvest dates: Hay, May 15 – June 1Approximate yield: Hay, 1-2 tons/A
Timothy – Perennial – (Phleum pratense)
Description: Semi-bunch grass; erect and dull green leaves gradually tapering to a point; in late spring,the lower joint swells to form a small bulb; spike-like head; shallow fibrous roots; roundstem with prominent ligule.
Uses: Primarily hay; best adapted to the northern United States, but does fairly well in northernPiedmont and western Virginia. Makes very little regrowth after spring cutting comparedto orchardgrass or tall fescue.
Weight per bushel: 45 lbsSeeds per lb: 1,230,000Germinating time: 10 daysFertilizer: 40-60 lbs N, 30-40 lbs P
2O
5 and 30-60 lbs K
2O
pH Range: 5.8-6.2Soil adaptation: Well drained to somewhat poorly drained, fine-textured soils.Planting: 8-10 lbs alone; 2-8 lbs in mixtures. Usually seeded in mixtures with clovers or alfalfa.Harvesting (hay): When alone, in full bloom; in mixtures, when legume is in early bloom.Approximateharvest dates: Hay, June 1-July 1Approximate yield: Hay, 1-3 tons/A

Crop Descriptions 25
Virginia Cooperative Extension Agronomy Handbook
Tobacco– Burley – Annual – (Nicotiana tabacum)
Description: See flue-cured tobacco. Plants typically larger than flue-cured. Stalk and leaf midribsare light green to cream-colored. Typical culture is for 18-22 leaves that are lighter greenthan flue-cured. The crop is grown from transplants historically produced in plant bedsbut now typically produced in greenhouses.
Uses: Primarily cigarette blends with a small amount used in the manufacture of pipe andchewing tobacco products. Approximately 30% is exported.
Seeds per oz: 330,000Germinating time: 7 - 12 daysViability of seed: 6-8 years under proper conditions (temperature in oF and relative humidity should add to
100).Fertilizer: 175-200 lbs of N, 60-120 lbs of P
2O
5 and 150-300 lbs of K
2O per acre. Follow soil test
recommendations.pH range: When checked in the spring, a pH of 5.8-6.2 is preferred. If the pH drops to 4.9 during
the season, there is a danger of manganese toxicity.Soil adaptation: Fertile silt loam soils that have good internal and surface drainage.Planting: Transplant from seed beds May 15 – June 1 using 6,225-8,300 plants per acre in 3.5’
rows with plants spaced 18”-24” in the row.Disease control: The most successful disease management program utilizes multiple control strategies.
Crop rotation and the use of disease resistant varieties should be used in combinationwith chemical control methods.
Weed control: Herbicides alone will not control certain weeds closely related genetically to tobacco.Tobacco benefits from some soil aeration, so always cultivate tobacco at least one time,usually at lay-by time, even though weeds are not a problem.
Insect control: The Integrated Pest Management (IPM) approach to insect control recognizes that acertain amount of insect damage will not reduce tobacco yield or quality enough to payfor the cost of treatment. Natural control should be promoted by delaying insecticideapplications until a pest insect reaches an economic threshold level and by using theinsecticides that are least harmful to beneficial insects.
Sucker control: Top the tobacco when the 50% bloom stage has been reached. Growth of suckers iscontrolled through the use of plant growth regulators. Typical control is through back-pack sprays of maleic hydrazide or a combination of maleic hydrazide and a local sys-temic material.
Method of harvest: Hand-harvest plants by stalk cutting. Spear 5-6 plants onto each stick according to sizeof tobacco. Leave tobacco in the field on standing sticks long enough to wilt sufficientlyto handle without breakage of the leaves.
Method of curing: Air-cure in ventilated barns by placing sticks of speared tobacco 9” apart on the tier rails.Any temperature from 65oF to 95oF is satisfactory as long as the daily average relativehumidity is between 65% and 70%. An alternative curing methods utilizes labor savingfield curing structures covered with black plastic.
Approximateharvest date: August 15-October 1.Approximate yield: 2,400-2,800 lbs/A of cured leaves.
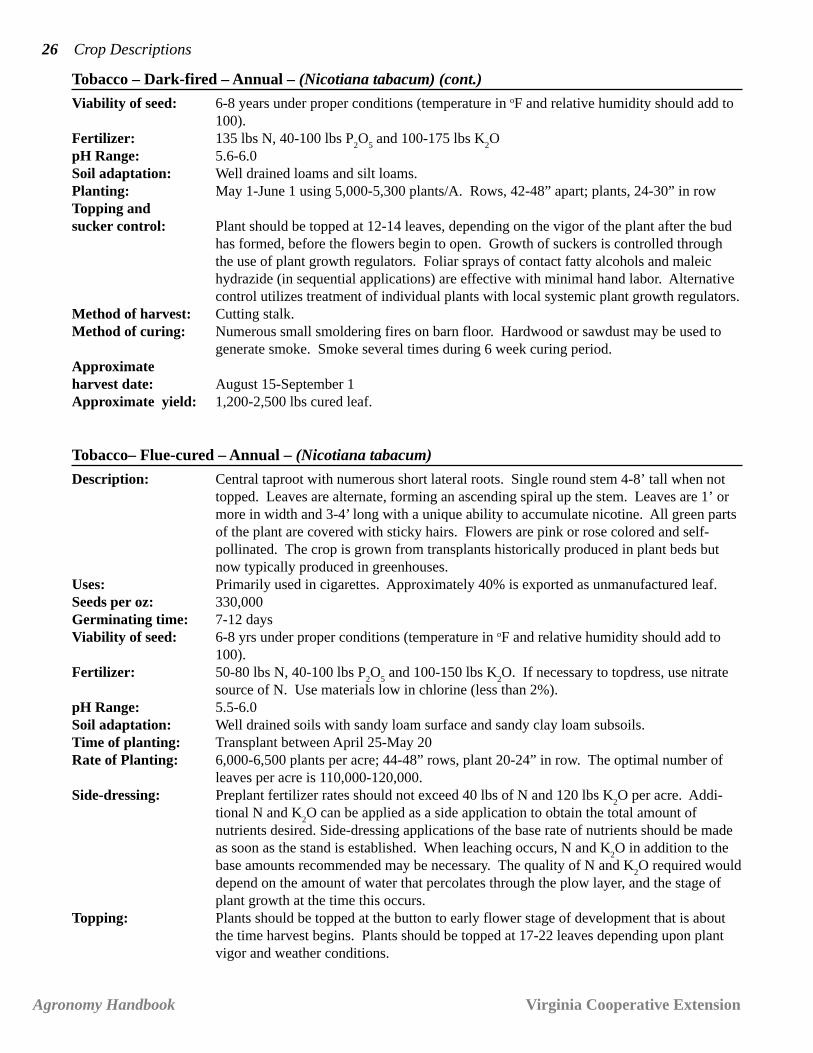
Tobacco – Dark-fired – Annual – (Nicotiana tabacum)
Description: See flue-cured tobaccoUses: The majority is exported for the manufacture of smoking tobacco, chewing tobacco, and
cigars. The domestic use is for dry snuff.Seeds per oz: 330,000Germination time: 7-12 days
26 Crop Descriptions
Agronomy Handbook Virginia Cooperative Extension
Tobacco – Dark-fired – Annual – (Nicotiana tabacum) (cont.)
Viability of seed: 6-8 years under proper conditions (temperature in oF and relative humidity should add to100).
Fertilizer: 135 lbs N, 40-100 lbs P2O
5 and 100-175 lbs K
2O
pH Range: 5.6-6.0Soil adaptation: Well drained loams and silt loams.Planting: May 1-June 1 using 5,000-5,300 plants/A. Rows, 42-48” apart; plants, 24-30” in rowTopping andsucker control: Plant should be topped at 12-14 leaves, depending on the vigor of the plant after the bud
has formed, before the flowers begin to open. Growth of suckers is controlled throughthe use of plant growth regulators. Foliar sprays of contact fatty alcohols and maleichydrazide (in sequential applications) are effective with minimal hand labor. Alternativecontrol utilizes treatment of individual plants with local systemic plant growth regulators.
Method of harvest: Cutting stalk.Method of curing: Numerous small smoldering fires on barn floor. Hardwood or sawdust may be used to
generate smoke. Smoke several times during 6 week curing period.Approximateharvest date: August 15-September 1Approximate yield: 1,200-2,500 lbs cured leaf.
Tobacco– Flue-cured – Annual – (Nicotiana tabacum)
Description: Central taproot with numerous short lateral roots. Single round stem 4-8’ tall when nottopped. Leaves are alternate, forming an ascending spiral up the stem. Leaves are 1’ ormore in width and 3-4’ long with a unique ability to accumulate nicotine. All green partsof the plant are covered with sticky hairs. Flowers are pink or rose colored and self-pollinated. The crop is grown from transplants historically produced in plant beds butnow typically produced in greenhouses.
Uses: Primarily used in cigarettes. Approximately 40% is exported as unmanufactured leaf.Seeds per oz: 330,000Germinating time: 7-12 daysViability of seed: 6-8 yrs under proper conditions (temperature in oF and relative humidity should add to
100).Fertilizer: 50-80 lbs N, 40-100 lbs P
2O
5 and 100-150 lbs K
2O. If necessary to topdress, use nitrate
source of N. Use materials low in chlorine (less than 2%).pH Range: 5.5-6.0Soil adaptation: Well drained soils with sandy loam surface and sandy clay loam subsoils.Time of planting: Transplant between April 25-May 20Rate of Planting: 6,000-6,500 plants per acre; 44-48” rows, plant 20-24” in row. The optimal number of
leaves per acre is 110,000-120,000.Side-dressing: Preplant fertilizer rates should not exceed 40 lbs of N and 120 lbs K
2O per acre. Addi-
tional N and K2O can be applied as a side application to obtain the total amount of
nutrients desired. Side-dressing applications of the base rate of nutrients should be madeas soon as the stand is established. When leaching occurs, N and K
2O in addition to the
base amounts recommended may be necessary. The quality of N and K2O required would
depend on the amount of water that percolates through the plow layer, and the stage ofplant growth at the time this occurs.
Topping: Plants should be topped at the button to early flower stage of development that is aboutthe time harvest begins. Plants should be topped at 17-22 leaves depending upon plantvigor and weather conditions.

Crop Descriptions 27
Virginia Cooperative Extension Agronomy Handbook
Tobacco– Flue-cured – Annual – (Nicotiana tabacum) (cont.)
Suckering: After topping, suckers develop in the leaf axils and should be removed or controlled.Growth and suckers is controlled through the use of plant growth regulators. Foliarsprays of contact fatty alcohols and maleic hydrazide (in sequential applications) areeffective with minimal hand labor. Alternative control utilizes treatment of individualplants with local systemic plant growth regulators.
Method of harvest: Leaves harvested individually by removing or priming as ripening begins at the bottom ofthe stalk and progresses upward.
Method of curing: Typically in bulk curing barns following a schedule lasting 6-7 days regulating tempera-ture and drying rate. Supplemental heat (maximum (165-170oF) is required to firstyellow the leaf, than dry the lamina, and finally dry the leaf midrib.
Approximateharvest date: Typically three harvests or primings as leaves ripen. Harvest period may last 8-12 weeks,
beginning as early as mid-July and ending as late as October.Approximate yield: 2,000–3,000 lbs of cured leaves/A
Tobacco – Sun-cured – Annual – (Nicotiana tabacum)
Description: See Flue-cured tobacco. Smaller plants than flue cured.Uses: Primarily exported for making smoking and chewing tobacco. A small portion is used
domestically for plug chewing tobacco.Seeds per oz.: 330,000Germination time: 7-12 daysViability of seed: 6-8 yrs under proper conditions (temperature in oF and relative humitity should add to
100).Fertilizer: 125 lbs N, 40-100 lbs P
2O
5 and 100-175 lbs K
2O
pH Range: 5.6-6.0Soil adaptation: Well drained loams and silt loams.Planting: May 1 – June 1Rate of planting: 5,000-5,300 plants/A. Rows, 3 1/2’; plants 28-30” in rowTopping andsucker control: Plants should be topped at 12-14 leaves, depending on the vigor of the plant after the bud
has formed, before the flowers begin to open. Growth of suckers is controlled throughthe use of plant growth regulators. Typical control is from hand application of a localsystemic plant growth regulator to individual plants.
Method of harvest: Cutting Stalk.Method of curing: Air-cured in barns constructed to permit good ventilation. Heat needed only in periods of
extremely high humidity.Approximateharvest date: August 15-September 1Approximate yield: 1,000-2,000 lbs/A
Tobacco Greenhouses
Production system: Transplants typically grown in styrofoam plug trays floating in shallow plastic-linedpools containing a nutrient solution. An overhead watered production system utilizingplastic plug trays is an alternative production system.
Plant density: 80-157 plants per sq ft in trays containing 200-392 plants.Seeding time: Seed greenhouse with highest quality pelletized seed approximately 7-8 wks before
expected transplanting.

28 Crop Descriptions
Agronomy Handbook Virginia Cooperative Extension
Tobacco Greenhouses (cont.)
Fertilization: Use a complete (N-P2O
5-K
2O) water-soluble fertilizer. Greater than 50% of fertilizer
nitrogen should be derived from nitrate nitrogen. Fertilizer is added to the nutrientsolution at a concentration of 100-150 ppm N.
Clipping: Clipping with a rotary mower is used to increase transplant uniformity, remove excessoliage, and regulate seedling growth. clipping should begin when seedlings are 2-2 1/2inches tall to the bud and clip 1-1 1/2 inches above bud. Clip 4-6 times before trans-planting, raising blade height with successive clippings. Proper sanitation is critical fordisease prevention.
Tobacco Plant Beds
Seeding: Use 1/8-1/6 oz. of seed per 100 sq yds of bed.Plant bed space: 75-100 sq yds/A to be transplantedFertilizer: 1/2-3/4 lb of 12-6-6 to each sq ydSoil adaptation: Locate beds near a source of clean water on well drained sandy loams or loams. Do not
locate beds in a shady area or in low lying areas along creeks or rivers.
Vetch – Hairy – Annual – (Vicia villosa)
Description: Semi-viney legume with tendrils; plants hairy; stems 3-5’ long; flowers bluish violet andwhite.
Uses: Hay, pasture and winter cover. Sometimes called winter vetch. Because of the hardnessof the seed, it often becomes a weed in small grain crops that follow.
Weight per bushel: 60 lbsSeeds per lb: 21,000Germinating time: 14 daysFertilizer: 90-120 lbs P
2O, and 60-90 lbs K
2O
pH Range: 6.0-6.5Inoculation: Important. Cross-inoculates with garden peas and field peas.Soil adaptation: Well drained to moderately well drained sandy loams to clay loams.Planting: August 1 – November 1, depending upon location. Plant 20-30 lbs alone; 10-15 lbs in
mixtures; usually mixed with 1/2-1 bushel of small grain. Plant in 6-8” rows with smallgrains or solid seeded.
Harvesting (hay): When seeds in lower half of the plants are half developed.Harvesting (seed): Cut when first pods are well developed.Approximateharvest dates: Hay, May 1-June 1Approximate yield: Hay 1-2 tons or seed, 200-600 lbs/A
Weeping Lovegrass – Perennial – (Eragrostis curvula)
Description: A warm season perennial bunchgrass. Long slender drooping leaves that grow to a heightof 2’-5’ but usually do not remain upright. Seed head is an open pannicle 6”-10” long.Produces relatively poor quality pasture and hay. Several varieties available. Virginia isnorthern limit of adapted area.
Uses: Limited hay and pasture, relatively low in palatability. Its primary use in Virginia is forsoil stabilization and critical areas.
Seeds per lb: 1,500,000Germination time: 14 daysFertilizer: 40-50 lbs N, 60-70 lbs P
2O
5 and 40-50 lbs K
2O
pH Range: 4.5-6.2. Tolerance to low pH enhances its value for soil stabilization.Soil adaptation: Best adapted to sandy soils, but will grow in heavier soil types.

Crop Descriptions 29
Virginia Cooperative Extension Agronomy Handbook
Weeping Lovegrass – Perennial – (Eragrostis curvula) (cont.)
Planting: April 15-June 1 is best but can also be seeded June 1-August 15, 1-2 lbs in rows, 2-3 lbssolid seeded.
Harvesting: Cut for hay before seed head forms. For grazing, stock at high rates to utilize all forageand then rotate as needed.
Wheat – Annual – (Triticum aestivum)
Description: Dark green leaves with short hairy auricles and long ligule. Seeds thresh free of theirhusks and are caramel colored with smooth surface and a whitish brush on the endopposite the germ. Soft red wheat is the traditional class of wheat grown in Virginia.
Uses: Grain, grazing, and cover crops.Weight per bushel: 60 lbsSeeds per lb: 13,000-16,000Germinating time 7 days at 65oF. 14 days at 50oFFertilizer: 20 lbs of N in the fall plus 40-80 lbs each of P
2O
5 and K
2O at medium soil test levels.
Topdress with 30-50 lbs of N in February if the stand is thin or shows obvious nitrogendeficiency. Additional nitrogen should be applied in late March (40-80 lbs).
pH Range: 5.8-6.2Soil adaptation: Any moderately well drained or well drained soil.Planting: One week before to one week after the first killing frost, October 15-November 15 in
eastern Virginia; October 1-November 1 in the Piedmont; October 1-October 25 west ofthe Blue Ridge. Plant 120-150 lbs per acre (36 seeds per sq ft or 20 seeds per drill ft in7” rows). Plant in 6-8” rows or solid seeded.
Harvesting: Combine when fully ripe at 10-15 % moisture. Cut for silage in the soft dough stage.Approximateharvest dates: June 20-July 10Approximate yield: 50-100 bushels grain; 8-12 tons 35% dry matter silage/A
White Clover – Common – Perennial – (Trifolium repens)
Description: Low growing, short-lived legume; smooth leaves with 3 leaflets; shallow rooted; spreadsby soil surface stolons that root at nodes; white flower.
Uses: Pastures, especially with bluegrass. Tolerates close, continuous grazing.Weight per bushel: 60 lbsSeeds per lb: 700,000Germinating Time: 10 daysFertilizer: With bluegrass at seeding, 0-20 lbs N, 90-120 lbs P
2O
5 and 60-90 lbs K
2O. For
topdressing, 60-100 lbs each of P2O
5 and K
2O every 3-4 years.
pH Range: 5.8-6.5Inoculation: Cross-inoculates with alsike, crimson, ladino, and red clover.Soil adaptation: Well drained and moderately well drained loams and silt loams.Planting: 45 days before last killing frost in spring or 30 days before first killing frost in fall using
1-2 lbs in mixtures.
White Clover –- Ladino – Perennial – (Trifolium repens latum)
Description: Giant variety of white clover which resembles white clover in every respect except size.Uses: Primarily for pasture with tall growing grasses such as orchardgrass. May be used for
silage and hay, but hay is difficult to cure. Less persistent and grazing tolerant thancommon white clover.

30 Crop Descriptions
Agronomy Handbook Virginia Cooperative Extension
White Clover –- Ladino – Perennial – (Trifolium repens latum) (cont.)
Weight per bushel: 60 lbsSeeds per lb: 700,000Germinating Time: 10 daysFertilizer: Alone at seeding, zero N, 90-120 lbs P
2O
5 and 60-90 lbs K
2O. Topdressing, no N, 30-40
lbs P2O
5 and 30-60 lbs K
2O annually.
pH Range: 6.0-6.5Soil adaptation: Well drained and moderately well drained loams and silt loams.Inoculation: Important. Cross-inoculates with alsike, crimson, red and white clovers.Planting: 30-60 days before average date of the first killing frost in fall or 30-45 days before the
average date of the last killing frost in spring. Fall seedings are preferred, especially inthe Tidewater area. Plant 1-2 lbs with grasses. May be seeded alone at rate of 3-5 lbswhen usedfor hog or poultry pasture.
Zoysia – Perennial — Japanese lawn grass – Zoysia japonica Steud.) – Korean or Matrella lawngrass – (Zoysia matrella L.)
Description: Closely resembles bermudagrass. Spreads by stolons and short rhizomes. Turns brownwith frost but greens up earlier than bermuda in the spring. Ligule is a fringe of hairswith some hairs found on upper surface of leaf blade. Forms a dense turf with leavesupright, which provides more cushion than bermuda. Flower is a weak spike and seldombranched.
Uses: General lawn areas. Sometimes used for lawns, athletic fields, and play areas.Growth habit: Often sod-forming with both stolons and rhizomes. Slow growing, particularly in areas
having cold nights. Matrella similar to Japonica except finer texture.Climatic adaptation: Both species have low moisture requirements. Japonica adapted best intermediate zone
between cool humid and warm humid regions. Matrella is a warm season grass bestadapted to warmer sections of warm humid regions. Severely injured by cold weather.Becomes dormant early in fall and starts late in spring.
Soil adaptation: Grows best on soils of medium or good fertility. Will survive at low fertility levels.Tolerates medium acidity, but needs good drainage. Moderately shade-tolerant.
Fertilizer: For fertilizer and other management practices, see Turfgrass section.Method ofestablishment: Sod, sprigs, and plugs. The latter two are slow to establish, usually requiring at least 2
seasons.Planting: Spring: 4-7 bu/100 sq ft from May 15-July 1 in Northern Piedmont and mountains, and
April 30-July 15 in Coastal Plains and Southern Piedmont. Plugs: 4,000 on 6” centers/1000 sq ft. Plant from May 1-July 15 in Northern Piedmont and mountains, and April 15-August 1 in Coastal Plains and Southern Piedmont.

Forage Crops 31
Virginia Cooperative Extension Agronomy Handbook
PART II Forage Crops
Paul R. Peterson, Extension Forages SpecialistDaniel E. Brann, Extension Grains Specialist
Pastures
Pastures are the backbone of Virginia’s beef and sheep industries and are of increasing importance to the dairyindustry. The over 2 million acres of pasture in Virginia provide feed for grazing livestock with minimal require-ments for labor and equipment. Pasture plants growing in areas inaccessible to machinery and equipment or onsoils unsuitable for cropping serve as a feed for livestock in the production of meat and fiber for human use.Forage crops can be grown successfully throughout Virginia if species and management are tailored to match thesoils and climate in that region of the state.
Year-round grazing
Year-round grazing should be an objective of most pasture-based livestock systems. Utilizing combinations ofplant species which make their growth at different times of the year is key to successful year-round grazingprograms.
Seeding
Pasture seeding recommendations are dependent upon the types of pasture already available in the system, the usefor which it is intended, the type of soil, climatic conditions, and the intended management. Details given in the“Pasture Seedings” table will be helpful in selecting the mixture for individual needs. Seeding may be done inseedbeds prepared by plowing, disking, and firming with cultipacker or roller. New stands may also be establishedusing no-till seeding equipment and management techniques. Before seeding, consult an Extension Agent who isfamiliar with local growing conditions and can provide specific recommendations for pasture establishment.
Seed after the first good rain in August or September or between February 15 and April 15, depending on the areaof the state. Generally, moving from west to east, seeding can be done later in the fall and earlier in the spring. Areliable rule to follow is to seed 30-40 days before the first killing frost in the fall or 30 days before the last frostin the spring.
Figure 1. Seasonal Growth of Forage Species and Mixtures
December-March are the traditional winter feeding months. Most plants make little or no growth when temperature is much below 50oF.Small grains and rye will grow anytime the average temperature is above 32oF. Plan to feed hay or silage for 60 to 120 days. Small grains and stockpiled tallfescue for pasture help reduce the need for harvested feeds.April, May, and June are the surplus grass months. Save excess growth by making silage or hay.July and August are the critical pasture months. Make definite plans for these months.
JAN. FEB MAR APR MAY JUNE JULY AUG. SEPT. OCT. NOV. DEC.
1
2
3
4
5
6
7
8
9
1. Bermudagrass
2. KY BluegrassWhite clover
3. Orchardgrass,Ladino clover
4. Tall Fescue,Ladino Clover
5. Orchardgrass Lespedeza
6. Sorghum sudan, or pearl millet
7. Small grains or ryegrass
8. Alfalfa Orchardgrass
9. Red Clover

32 Forage Crops
Agronomy Handbook Virginia Cooperative Extension
Managing pastures
Pastures can be limed and fertilized, according to soil test results, any time of the year, but late summer and fallapplications are preferred. Tall-grass pastures should be fertilized every year. Native pastures are normally fertil-ized every three years.
High quality pastures will consist of 25-40% clover. Significant improvement in animal performance is realizedwhen clover is present in a grass-based stand of forage. Because of clover’s ability to fix nitrogen into the soil, nosupplemental nitrogen is required for grass-clover pastures with significant clover content.
Overseeding clover is an excellent procedure for establishing clover in grass sods. Graze or mow the sod veryclosely by late February, then broadcast the seed on the soil surface. Freezing and thawing of the soil, plus trafficand early spring grazing by livestock, should result in good seed to soil contact for clover establishment.
The goal in grazing pastures is to utilize the forage that is produced without injuring the sod. Undergrazingproduces high rates of gain per animal but low animal production per acre. Overgrazing results in low gains peranimal and per acre. The challenge is to maintain optimal animal performance without compromising plant vigor.
Harvest excess pasture growth, especially in the spring, for hay. Graze only those pastures that livestock will keepgrazed down. When growth slows during the summer, make more pasture acreage available.
Occasional clipping of pastures helps to remove tough, mature plant growth and prevents seed production byweeds. Mid June and late August are the most critical times for clipping. Proper grazing management helps tominimize the need for clipping.
When a pasture is grazed to a height of 2-3 inches, rotate livestock to another pasture. Plan pasture rotations sothat young, growing livestock have access to the highest quality grazing. For example, permit steers to graze lushpastures first, then let the cows remove what is left. Plan to have calves “creep graze” high-quality pasture byplacing small openings in the fence so they can leave their mothers to graze an adjacent pasture or hay field.Winter grazing can be obtained by grazing or clipping tall fescue stands in August, fertilizing with 70-80 lbsnitrogen per acre, then permitting plant growth to accumulate through late fall. One acre of “stockpiled” growthcan provide 120 days of winter grazing for a beef cow.
An animal unit (AU) is usually defined as a 1000 lb cow and her calf, two 500 lb steers, or five ewes with lambs.Generally, one acre of excellent pasture is required to carry an AU through the grazing season, or 1.5 acres ofgood pasture per AU, or 3.0 acres of average pasture per AU, or 6.5 acres of poor pasture per AU. An animal unitmonth (AUM) is defined as the amount of pasture (400 lb TDN) required to provide adequate grazing for an AUfor one month.
Refer to the Recommendations for Pasture Seedings in Virginia Table on the following page.
Hay
Red clover, alfalfa, orchardgrass, and tall fescue are the most widely grown hay crops in Virginia. However, anyplant that can be cut, dried, and stored can be utilized for hay. The following table provides details on the mostcommonly used mixtures.
Crushing stems (conditioning) at the time of mowing will permit the stems to dry at nearly the same rate as theleaves. Curing time is decreased by about one day for large-stemmed plants. Raking while hay is moist (about40% moisture) and baling before hay is crisp (16 -20% moisture) reduces field losses.
Refer to the Recommendations for Hay and Haylage Seedings in Virginia Table on the following page.

Forage Crops 33
Virginia Cooperative Extension Agronomy Handbook
Rec
omm
enda
tions
for
Pas
ture
See
ding
s in
Virg
inia
See
ding
Rat
eU
seS
peci
es(I
b/ac
re)
Soi
l Ada
ptat
ion
Man
agem
ent T
ips
Fro
st s
eedi
ng le
gum
eR
ed c
love
r3-
6A
ny m
ediu
m to
hea
vy te
xtur
ed s
oil
Gra
ze g
rass
sod
clo
sely
by
Feb
ruar
y th
enin
gra
ss p
astu
reW
hite
or
Ladi
no c
love
r1-
2w
ith p
H >
5.8
and
med
ium
or
bette
rbr
oadc
ast s
eed
and
allo
w c
attle
to tr
ead
orfe
rtili
ty fo
r cl
over
s. A
nnua
l les
pede
zath
e se
ed in
to th
e gr
ound
for
1 w
eek.
Ann
ual l
espe
deza
10-1
5fo
r ac
id, l
ower
fert
ility
soi
lsF
rost
see
d ev
ery
2-3
year
s. U
se to
add
.le
gum
e to
thin
ning
alfa
lfa p
astu
re.
Con
tinuo
us S
tock
ing
Tall
fesc
ue (
E+
or
E-)
*10
- 15
Bro
ad d
rain
age
tole
ranc
e w
ith p
HS
houl
d br
oadc
ast r
ed c
love
r ev
ery
2-3
Whi
te c
love
r1-
2>
5.8
.ye
ars
in la
te w
inte
r. E
+ ta
ll fe
scue
will
Red
clo
ver
3-5
pers
ist b
ette
r th
an E
- bu
t will
pro
vide
low
er a
nim
al p
erfo
rman
ce.
Use
mor
egr
azin
g pr
essu
re o
n E
+ ta
ll fe
scue
to k
eep
vege
tativ
e.
Con
tinuo
us S
tock
ing
Alfa
lfa (
graz
ing
10-1
5W
ell d
rain
ed, d
eep,
fert
ile s
oils
with
E+
will
per
sist
bet
ter
than
E-
but w
ill p
ro-
tole
rant
var
iety
)pH
> 6
.5.
vide
low
er a
nim
al p
erfo
rman
ce.
Use
Whi
te c
love
r1-
2m
ore
graz
ing
pres
sure
on
E+
tall
fesc
ueTa
ll fe
scue
(E
+ o
r E
-)*
6- 1
0to
kee
p ve
geta
tive.
Rot
atio
nal S
tock
ing
Alfa
lfa10
-15
Wel
l dra
ined
, dee
p, fe
rtile
soi
ls w
ithG
raze
whe
n al
falfa
is b
ud to
ear
ly b
loom
and
pH >
6.5
dow
n to
2-3
" re
sidu
al to
red
uce
gras
sO
rcha
rdgr
ass
3-6
com
petit
iven
ess.
Gra
zing
per
iods
<7
oror
days
, res
t per
iods
25-
40 d
ays.
Mai
ntai
nM
atua
bro
meg
rass
10-1
5P
and
K in
hig
h ra
nge
to m
aint
ain
alfa
lfa.
oror
Be
care
ful o
f blo
at if
alfa
lfa is
pre
dom
inat
e.Ta
ll fe
scue
(E-)
*6-
10A
llow
Mat
ua m
ixtu
re 4
5 da
ys in
late
sum
mer
to r
esee
d.
Rot
atio
nal S
tock
ing
Orc
hard
gras
s8-
12W
ell d
rain
ed to
som
ewha
t poo
rlyTu
rn in
at 6
-10”
and
gra
ze to
3”
crop
hei
ght.
Red
Clo
ver
3-5
drai
ned
soils
with
mod
erat
e or
bet
ter
Ladi
no C
love
r2
fert
ility
and
pH
> 6
.0
Con
tinuo
us o
rB
erm
udag
rass
12-2
0 bu
spr
igs
Any
soi
l. B
erm
udag
rass
pre
fers
ligh
ter
Use
ade
quat
e st
ocki
ng r
ate
to m
aint
ain
Rot
atio
nal
orte
xtur
ed s
oils
. C
auca
sian
nee
ds d
eep
vege
tativ
e st
age
and
pala
tabi
lity.
With
Sto
ckin
g -
Sum
mer
Cau
casi
an b
lues
tem
2-3
PLS
**so
ils w
ith p
H >
5.5
.ro
tatio
n, tu
rn in
at 8
-12”
and
gra
ze to
prod
uctio
n3-
4”.
Bes
t to
graz
e lig
htly
or
hay
durin
ges
tabl
ishm
ent y
ear.
Rot
atio
nal S
tock
ing
-S
witc
hgra
ss7-
10 P
LS**
Any
dee
p so
il. G
ood
flood
ing
tole
ranc
e.Tu
rn in
at 1
8-24
”, g
raze
dow
n to
8-1
0”.
Sum
mer
pro
duct
ion
orB
est t
o gr
aze
light
ly o
r ha
y du
ring
esta
blis
h-R
otat
iona
l Sto
ckin
g-D
war
f, pe
arl m
illet
15-3
0D, 2
5-40
BM
ediu
m to
wel
l dra
ined
soi
ls. P
earl
men
t yea
r. T
urn
in a
t 18-
24”,
“30
” fo
r so
rghu
m-
Sum
mer
oror
mill
et h
ighe
r yi
eldi
ng o
n he
avy-
suda
n an
d gr
aze
to 6
”. A
void
pru
ssic
aci
dS
udan
gras
s15
-20D
,25-
35B
text
ured
soi
ls.
pois
onin
g in
sud
an a
nd s
orgh
um-s
udan
oror
by N
OT
gra
zing
you
ng s
eedl
ings
, you
ngS
orgh
um-S
udan
20-
30D
,30-
45B
regr
owth
, stu
nted
gro
wth
, and
fros
ted
Hyb
rids
plan
ts.
All
can
accu
mul
ate
nitr
ates
durin
g dr
ough
t --
wai
t one
wee
k af
ter
rain
befo
re g
razi
ng.
*E
+=
Hig
h en
doph
yte
D =
Dril
led
E
-=Lo
w e
ndop
hyte
B =
Bro
adca
st**
PLS
= P
ure
live
seed

34 Forage Crops
Agronomy Handbook Virginia Cooperative Extension
Recommendations for Hay and Haylage Seedings in VirginiaSeeding Rate
Species (Ib/acre) Soil Adaptation Management TipsAlfalfa 15-20 Fertile, well drained soils with Cut when alfalfa is bud to earlyOrchardgrass 3-7 pH > 6.5 bloom stage. Allow at least one
harvest to reach early bloom. Takefirst cutting when alfalfa is in budstage.
Alfalfa 18-25 Fertile, well drained soils with Cut when alfalfa is bud to earlypH > 6.5 bloom stage. Allow at least one
harvest to reach early bloom. Takefirst cutting when alfalfa in budstage.
Alfalfa 12-15 Fertile, well drained soils with Timothy and smooth bromegrassand and pH > 6.5 provide little forage after firstMatua bromegrass 10-15 cutting; best adapted west of Blueor or Ridge; avoid cutting during stemTimothy 4-6 elongation to insure persistence.or or Smooth bromegrass is moreSmooth bromegrass 10-12 drought tolerant than Timothy.
Allow > 45 days between cuttings in late summer to allow Matuabromegrass to reseed.
Red clover 5-8 Moderately to poorly drained Cut when grass is in boot stage.and and soils not suitable to alfalfa with Red clover may not persist beyondOrchardgrass 8 -12 pH > 6.0 2-3 years. Thus one should inter-or or seed every 2-3 years to maintainTall fescue (E-)* 8-12 red clover component.Tall fescue (E-)* 20-25 All types of soils with pH > 5.8. Take first cutting before head
emergence; subesequent cuttingsevery 30-40 days; does not produceseedheads after first harvest.
Matua bromegrass 20-30 Any fertile soil. Cut in boot stage. Allow > 45 daysbetween cuttings in late summer toallow reseeding.
Timothy 6-8 Light to medium-textured soils with Cut in boot stage to early heading.or or at least moderate drainage. Avoid cutting during stem elonga-Smooth bromegrass 15-25 tion. Timothy will not persist in
southern Piedmont or CoastalPlain; limited production after firstcutting in most of state. Smoothbromegrass is more drought toler-ant.
Orchardgrass 10-15 Light to medium-textured soils with First cutting at boot to early bloomat least moderate drainage stage. Subsequent regrowth will be
vegetative and can be harvestedevery 30-40 days.
Reed canarygrass 6-8 Very tolerant of flooding and poorly Cut during stem elongation to boot.drained soils. Also most drought Coarse at later maturity. Slowtolerant of cool-season grasses. initial establishment; fills in with timeTolerates pH of 5 to 8. from rhizome spread.
Switchgrass 7-10 PLS** Any deep soil. Good flooding Cut in boot stage. Coarse at lateror or tolerance maturity. Slow initial establishmentEastem Gamagrass 8-10 PLS** fills in with time from rhizome
spread in switchgrass, and crownwidening in gamagrass.
*E+= High endorphyte *E-=Low endophyte **PLS = pure live seed

Forage Crops 35
Virginia Cooperative Extension Agronomy Handbook
Hay storage
Losses in dry matter and quality of hay during storage can be high, particularly with round bales stored outside.On some farms, hay storage and feeding losses combine to account for over 10% of livestock production costs.Producers often do not realize how large their hay losses are or that with relatively little effort and expense theycan be reduced considerably.
When hay is baled above 20% moisture, mold growth and heating occur. Dry matter losses are greater. Safemoisture levels for storage are 20% for rectangular bales, 18% for round bales, and 16% for large rectangularbales. Whereas storage losses are typically around 5% for hay stored inside at safe moisture levels, losses severaltimes higher occur with extremely moist hay. Heating of hay is related to temperature. Peak temperature isusually reached within a week after baling, but with higher moisture hay and conditions which limit heat escape,it may take as much as three weeks.
The extent of weathering damage that occurs with hay stored outside varies with climatic factors, forage species,and bale diameter. Weathering primarily affects hay in the outside circumference of a large round bale. Thepercentage of hay lost decreases as bale size increases because a smaller proportion of the bale volume iscontained in the surface layer. A weathered layer 6" deep on a 5' x 5' bale contains over one-third of the hayvolume, a serious amount of loss. Half of the outside storage losses occur at the bale/soil interface due to the baledrawing moisture from the soil.
Total crude protein declines with weathering, but crude protein percentage may increase since protein is lesssubject than other plant constituents to weathering loss. The proportion of digestible crude protein will decrease,however, if hay undergoes excessive heating. Highly digestible soluble carbohydrates decline in weathered hayresulting in higher ADF concentration and lower digestibility. Losses in quality are usually greater for legumesthan for grasses.
Measuring hay
To find the capacity of a stack, rick, or mow in tons, determine the volume of space occupied by the material incubic feet and divide this volume by the number of cubic feet occupied by one ton of the respective kind of hayor straw.
Determining Storage Space (approximate) Occupied
by One Ton of Hay or Straw
Storage SpaceRequired in Cu Ft
Hay, loose, barn cured 300 to 350Square baled (loose) 200 to 250Square baled (tight) 100 to 150Hay, chopped, barn cured 250 to 325Straw, loose 500 to 600Straw, square baled (tight) 150 to 200Straw, square baled (loose) 250 to 300
Factors that reduce outside storage losses with round bales
1. The denser or more tightly hay is baled, the lower the amount of spoilage as long as hay is baled at or below18% moisture. Bale density is affected by the baling machine, the care/experience of the operator, and foragespecies with fine-stemmed hays naturally producing a tighter bale. The density of round bales should be aminimum of 10 pounds of hay per cubic foot.

36 Forage Crops
Agronomy Handbook Virginia Cooperative Extension
2. Reducing twine spacing reduces storage losses, but increases costs. Net wrap usually reduces storage lossescompared to twine. Although it costs more than twine, it is faster than twine wrap and bales are often betterstabilized, making handling and storage easier.
3. Store bales in well drained upland sites. Hay/soil contact should be avoided if possible. Wooden pallets,telephone posts, scrap pipe, cross ties, and rock pads are all effective.
4. If a multiple-bale cover is NOT being used, bales should be stored in rows with rounded sides at least 3' apart.Flat ends should be firmly butted against one another. Align rows north and south to allow maximum exposureof the rounded sides to the sun. A gently sloping site will allow rapid drainage of rainwater. Bales should beoriented up and down the slope near the top of slope, preferably with southern exposure. Never store balesunder trees.
5. Place three or five rows of bales in triangular stacks under a tarp or plastic sheet that is secured firmly. Insidestorage is the best way to ensure low storage losses. The more valuable or porous the hay, the higher and/ormore frequent the rainfall, and/or the longer the period of storage, the more easily barn construction can bejustified. For example, with an estimated construction cost of $7.50 per square foot, it pays to build a barn tostore hay valued at $60 per ton that otherwise would experience losses of 20% or more when stored outside.Hay valued at $100 per ton justifies barn construction if outside storage losses approach 15%.
Silage
Most crops grown for livestock feed can be allowed to ferment and be fed as silage. Handling of the crop forsilage should always favor proper fermentation. Figure 2 below describes what actually occurs in the silo.
Figure 2. Changes in Bacteria Concentrations, pH, and Temperature During the Ensiling Process
The quantity and quality of siage varies with crop species. The following table gives generally expected yields,crude fiber and acid detergent fiber.
PHASE 1. Plant material is put in silo.Plant cells continue to respire.Oxygen is consumed.Carbon Dioxide and heat are produced.Temperature of silage increases.
PHASE 2. Acetic acid is produced.pH changes from 6.0 to 4.2
PHASE 3. Lactic acid formation beginson the third day.Acetic acid formation declines.
PHASE 4. Lactic acid formation continuesfor about two more weeks.Temperature gradually declines.Bacteria action stops aspH approaches 4.0
69˚ F90˚ F
Temperature Change84˚ F
6.0
4.2
4.03.8
pH Change
Acetic AcidBacteria
Lactic AcidBacteria
1 2 3 4 7 12 20
Age of Silage (days)
PHASE 5. If everything has goneproperly, silage remains constant.If insufficient lactic acid was formed,butyric acid production begins.Protein may be broken down andspoilage may occur.

Forage Crops 37
Virginia Cooperative Extension Agronomy Handbook
Silage Statistics
Dry matter content 32-42%Moisture content 68-58%Length of cut 1/4-3/4 inchTime required for complete fermentation 14 daysDensity in upright silo 40-45 lbs/cu ftDensity in wagon, freshly chopped 20-25 lbs/cu ft
Approximate Capacity for Corn Silage in Trench or Bunker Siloswith Sides Sloped Outward 1 1/2” for Each Foot of Depth*
Bottom Approximate tons per foot of length width Depth -- feet (feet) 8 10 12 16 20
20 3.1 4.030 4.6 5.9 7.1 9.640 6.1 7.7 9.3 12.6 16.050 7.6 9.6 11.6 15.6 19.860 11.5 13.8 18.6 23.670 16.1 21.6 27.480 18.3 24.6 31.0100 30.6 38.6
*Iowa State University Pm-417.
Direct cut vs. wilted silage
The grain-crop silages such as corn, barley, wheat, oats, and grain sorghum are normally choppeddirectly as they stand in the field when the grain reaches the dough stage. The relatively high dry mattercontent of the grain in such silage, plus the drying effects of advancing maturity, results in silage withinthe desirable dry matter range (35-42%).
When these same crops are harvested at a less mature stage, or when the traditional hay crops arehandled as silage, it is necessary to partially dry or “wilt” the plants in the field before ensiling. Suchwilting usually requires about one day under favorable drying conditions. Crushing the stems with aconditioner hastens the drying process.
Annual Yield and Composition of Silage CropsYield, Tons/Acre Dry Matter Basis
Crop Stage 35% Dry Matter % Crude Protein % Acid Detergent Fiber
Corn Hard Dough 15-25 8 28
Grain Sorghum Dough 10-15 9 42
Forage Sorghum Early Head 10-15 11 29
Sorghum Sudan Early Head 7-15 12 45
Barley Dough 7-15 9 36
Wheat Dough 7-15 9 36
Oats Dough 5-10 10 38
Rye Boot 4-6 13 40
Alfalfa (4x) Late Bud-Early Bloom 10-12 18 33
Red Clover Early Bloom 7-8 12 43

38 Forage Crops
Agronomy Handbook Virginia Cooperative Extension
Experience and good judgement are needed to determine when the crop is wilted to the proper dry-matter level. The “grab test” is useful as a guide to the dry matter content of forage. Squeeze verytightly for 90 seconds a fistful of finely chopped forage. Then observe the condition of the ball:
Approximate DryDescription of the Forage Ball Matter Content
Holds its shape but has considerable
free juice Less than 25%
Holds its shape, hand is moist, but
there is very little free juice 25-30%
Expands slowly, with no free juice 30-40%
Springs out and falls apart rapidly More than 40%
High moisture corn and earlage
Harvesting the entire corn plant for silage makes full utilization of the corn plant. In some instances, harvesting aportion of the corn acreage by chopping only the ears for ensiling provides a source of grain for balancing theration. Another variation is to shell the grain and allow it to ferment. These procedures provide grain storagewithout the costs of drying. Such high-moisture material can be easily mixed and fed with silage. Fewer harvestlosses from shattering occur, and harvesting can be done 2-3 weeks earlier than dry corn, thus reducing lodginglosses some years and providing additional time for establishing cover crops.
High-moisture shelled corn and earlage should be harvested when the ear reaches physiological maturity. At thisstage, kernels are well dented and those near the center of the ear show the typical black layer at the base wherethey are attached to the cob.
Conventional concrete stave silos or oxygen-limiting units are an effective means for storing high-moistureshelled corn or earlage. If stored in concrete stave silos higher than 60 to 70 feet, placing extra hoops around thebottom 30 feet of the silo is suggested. Fermentation is complete in 15-20 days. The suggested moisture level forstoring high-moisture shelled corn is 28%, with a range between 25-30%. It should be ground or rolled beforebeing fed.
In earlage, the moisture range of the kernel is 28-30%, with 28% considered ideal. At this point, the cob willcontain 40-50% moisture, making the moisture content of the ear corn silage about 32%. Earlage must be groundbefore it is stored. The main objective is to break the kernels, so fine grinding is not necessary. Holes in thescreens of hammer mills or recutters range in size from 1/2 to 1 inch.
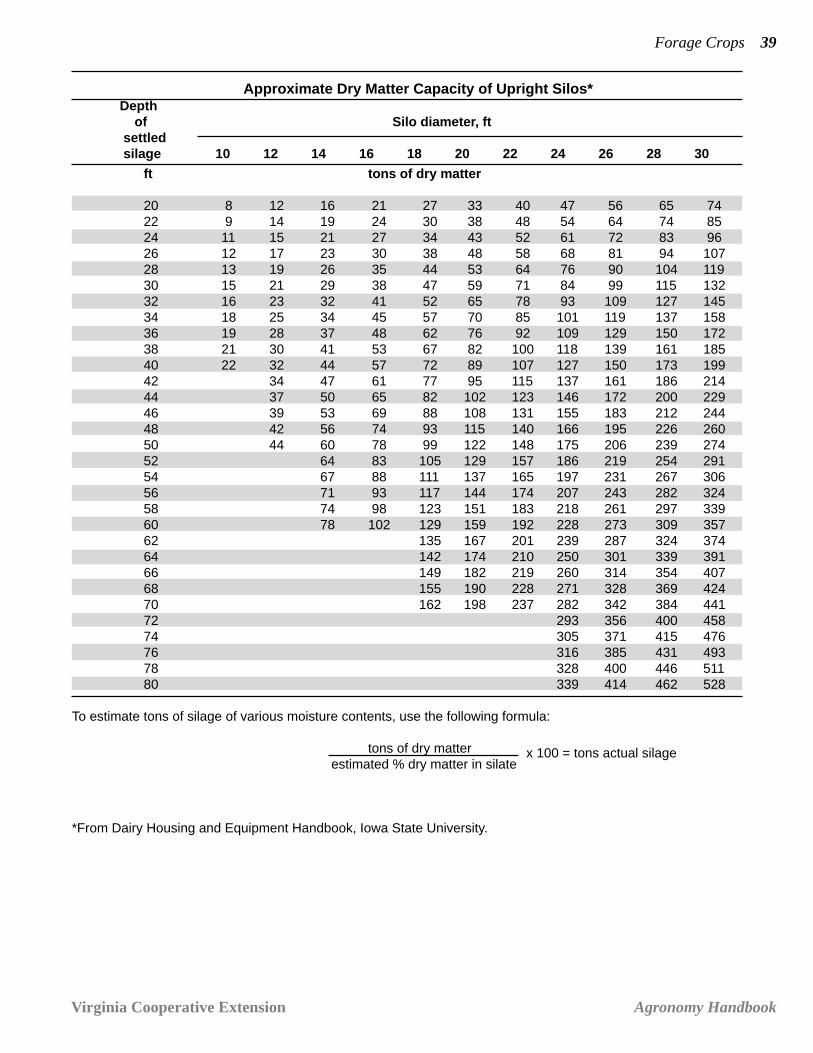
Forage Crops 39
Virginia Cooperative Extension Agronomy Handbook
Approximate Dry Matter Capacity of Upright Silos*Depth of Silo diameter, ft settled silage 10 12 14 16 18 20 22 24 26 28 30
ft tons of dry matter
20 8 12 16 21 27 33 40 47 56 65 7422 9 14 19 24 30 38 48 54 64 74 8524 11 15 21 27 34 43 52 61 72 83 9626 12 17 23 30 38 48 58 68 81 94 10728 13 19 26 35 44 53 64 76 90 104 11930 15 21 29 38 47 59 71 84 99 115 13232 16 23 32 41 52 65 78 93 109 127 14534 18 25 34 45 57 70 85 101 119 137 15836 19 28 37 48 62 76 92 109 129 150 17238 21 30 41 53 67 82 100 118 139 161 18540 22 32 44 57 72 89 107 127 150 173 19942 34 47 61 77 95 115 137 161 186 21444 37 50 65 82 102 123 146 172 200 22946 39 53 69 88 108 131 155 183 212 24448 42 56 74 93 115 140 166 195 226 26050 44 60 78 99 122 148 175 206 239 27452 64 83 105 129 157 186 219 254 29154 67 88 111 137 165 197 231 267 30656 71 93 117 144 174 207 243 282 32458 74 98 123 151 183 218 261 297 33960 78 102 129 159 192 228 273 309 35762 135 167 201 239 287 324 37464 142 174 210 250 301 339 39166 149 182 219 260 314 354 40768 155 190 228 271 328 369 42470 162 198 237 282 342 384 44172 293 356 400 45874 305 371 415 47676 316 385 431 49378 328 400 446 51180 339 414 462 528
To estimate tons of silage of various moisture contents, use the following formula:
tons of dry matter estimated % dry matter in silate
*From Dairy Housing and Equipment Handbook, Iowa State University.
x 100 = tons actual silage

40 Forage Crops
Agronomy Handbook Virginia Cooperative Extension

Turfgrass 41
Virginia Cooperative Extension Agronomy Handbook
PART III Turfgrass
David R. Chalmers, Extension Turf SpecialistDavid L. Whitt, Extension Seed Programs Leader
Current publications on turfgrass management and other turfgrass industry related information can be found in theVirginia Tech Turfgrass Science World Wide Web Home Page at the following website location: http://sudan.cses.vt.edu/html/Turf/turfhome.htm
Turfgrass Establishment
Steps involved in successful establishment of turfgrasses:
Submit a soil test sample to the Virginia Tech Soil Testing Laboratory and determine lime and fertilizer needs.
Control any perennial grass or broadleaf weeds present.
Where soil compaction is severe, phosphorus or lime needs to be incorporated, or significant surface re-grading isrequired, complete soil tilling will be necessary. On other areas, light surface tillage will suffice.
Grade the area to establish surface drainage. Save the topsoil by moving it to the side if extensive grading orinternal drainage is required.
Apply the recommended lime and soil amendments. Apply 2/3 of the establishment fertilizer recommended bysoil test.
Till above materials into a depth of 4-6”
Finish grade by fine raking.
Apply the remaining 1/3 of the establishment fertilizer and rake into the surface inch.
Seed, sod, sprig, or plug the area.
If seeding, rake the area very lightly to incorporate the seed in the surface 1/4 - 1/2”
Roll the area with a moderately heavy roller.
If seeding in the spring, apply Siduron preemergence herbicide for crabgrass control. Follow label recommenda-tions closely. Siduron should not be used on bermudagrass.
Uniformly mulch the area (1 1/2 - 2 bales of weed-free straw per 1000 sq ft) if frequent and uniform irrigation isunavailable. Other mulching solutions could include granular-type products made from shredded newsprint orother recycled paper fiber. Some mulch products are suitable to be applied as a hydromulch using a hydroseeder.
Keep the seed zone moist. New seedings may require several shallow waterings per day to insure rapid germina-tion. Only the top 1/4 - 1/2” needs to be kept moist. Sprigs easily desiccate without frequent daily irrigationimmediately after planting. Sod and plugs also require frequent, sometimes daily irrigation in the first three tofour weeks after planting.
After seed germination, maintain moisture in the soil to a depth of 4 - 6” until plants are well established.
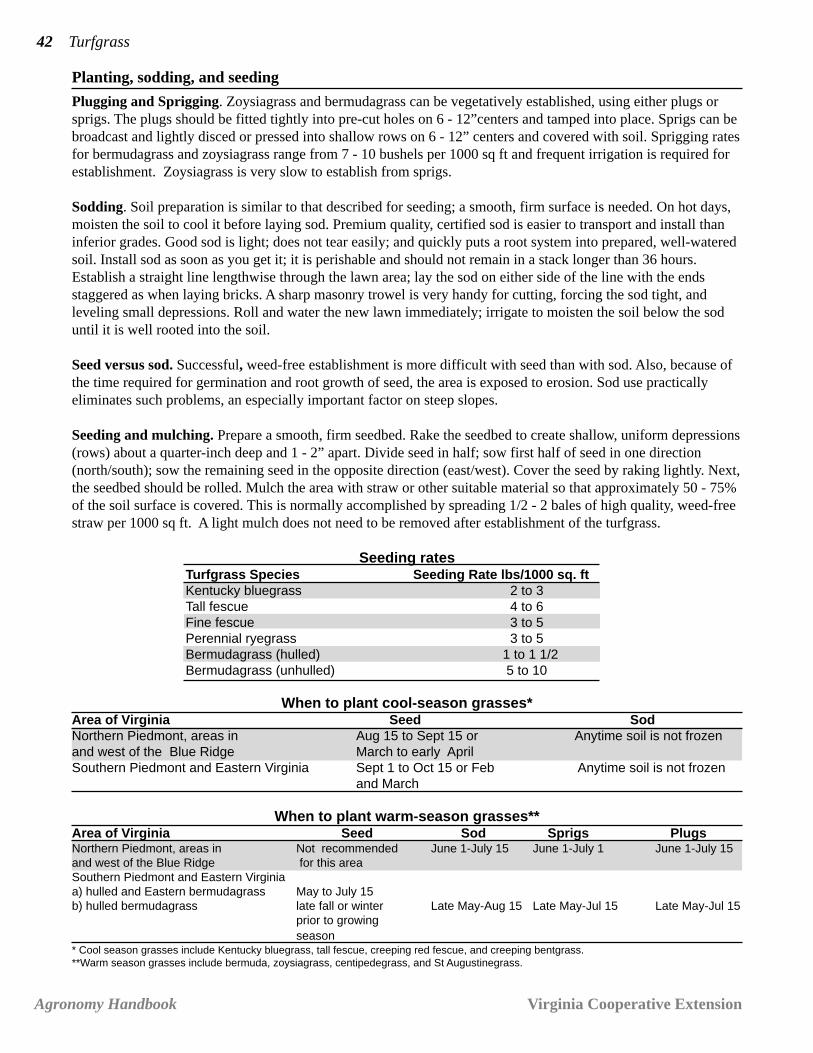
42 Turfgrass
Agronomy Handbook Virginia Cooperative Extension
Planting, sodding, and seeding
Plugging and Sprigging. Zoysiagrass and bermudagrass can be vegetatively established, using either plugs orsprigs. The plugs should be fitted tightly into pre-cut holes on 6 - 12”centers and tamped into place. Sprigs can bebroadcast and lightly disced or pressed into shallow rows on 6 - 12” centers and covered with soil. Sprigging ratesfor bermudagrass and zoysiagrass range from 7 - 10 bushels per 1000 sq ft and frequent irrigation is required forestablishment. Zoysiagrass is very slow to establish from sprigs.
Sodding. Soil preparation is similar to that described for seeding; a smooth, firm surface is needed. On hot days,moisten the soil to cool it before laying sod. Premium quality, certified sod is easier to transport and install thaninferior grades. Good sod is light; does not tear easily; and quickly puts a root system into prepared, well-wateredsoil. Install sod as soon as you get it; it is perishable and should not remain in a stack longer than 36 hours.Establish a straight line lengthwise through the lawn area; lay the sod on either side of the line with the endsstaggered as when laying bricks. A sharp masonry trowel is very handy for cutting, forcing the sod tight, andleveling small depressions. Roll and water the new lawn immediately; irrigate to moisten the soil below the soduntil it is well rooted into the soil.
Seed versus sod. Successful, weed-free establishment is more difficult with seed than with sod. Also, because ofthe time required for germination and root growth of seed, the area is exposed to erosion. Sod use practicallyeliminates such problems, an especially important factor on steep slopes.
Seeding and mulching. Prepare a smooth, firm seedbed. Rake the seedbed to create shallow, uniform depressions(rows) about a quarter-inch deep and 1 - 2” apart. Divide seed in half; sow first half of seed in one direction(north/south); sow the remaining seed in the opposite direction (east/west). Cover the seed by raking lightly. Next,the seedbed should be rolled. Mulch the area with straw or other suitable material so that approximately 50 - 75%of the soil surface is covered. This is normally accomplished by spreading 1/2 - 2 bales of high quality, weed-freestraw per 1000 sq ft. A light mulch does not need to be removed after establishment of the turfgrass.
Seeding ratesTurfgrass Species Seeding Rate lbs/1000 sq. ftKentucky bluegrass 2 to 3Tall fescue 4 to 6Fine fescue 3 to 5Perennial ryegrass 3 to 5Bermudagrass (hulled) 1 to 1 1/2Bermudagrass (unhulled) 5 to 10
When to plant cool-season grasses*Area of Virginia Seed SodNorthern Piedmont, areas in Aug 15 to Sept 15 or Anytime soil is not frozenand west of the Blue Ridge March to early AprilSouthern Piedmont and Eastern Virginia Sept 1 to Oct 15 or Feb Anytime soil is not frozen
and March
When to plant warm-season grasses**Area of Virginia Seed Sod Sprigs PlugsNorthern Piedmont, areas in Not recommended June 1-July 15 June 1-July 1 June 1-July 15and west of the Blue Ridge for this areaSouthern Piedmont and Eastern Virginiaa) hulled and Eastern bermudagrass May to July 15b) hulled bermudagrass late fall or winter Late May-Aug 15 Late May-Jul 15 Late May-Jul 15
prior to growingseason
* Cool season grasses include Kentucky bluegrass, tall fescue, creeping red fescue, and creeping bentgrass.**Warm season grasses include bermuda, zoysiagrass, centipedegrass, and St Augustinegrass.
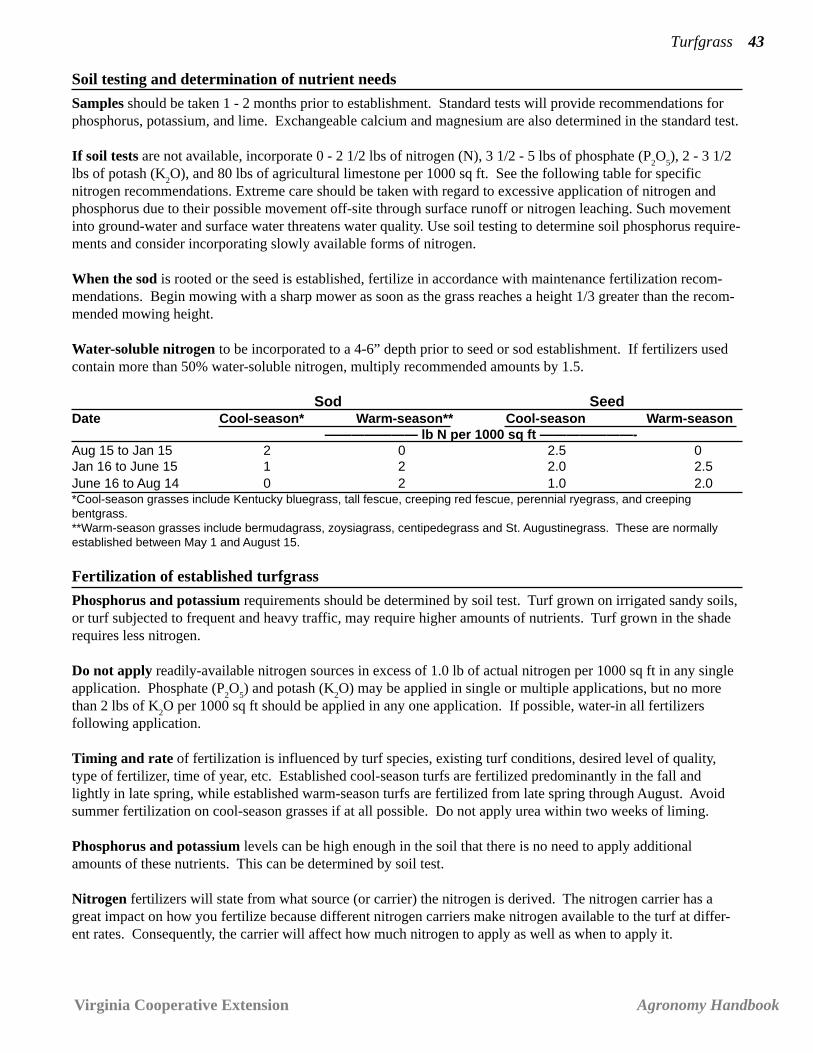
Turfgrass 43
Virginia Cooperative Extension Agronomy Handbook
Soil testing and determination of nutrient needs
Samples should be taken 1 - 2 months prior to establishment. Standard tests will provide recommendations forphosphorus, potassium, and lime. Exchangeable calcium and magnesium are also determined in the standard test.
If soil tests are not available, incorporate 0 - 2 1/2 lbs of nitrogen (N), 3 1/2 - 5 lbs of phosphate (P2O
5), 2 - 3 1/2
lbs of potash (K2O), and 80 lbs of agricultural limestone per 1000 sq ft. See the following table for specific
nitrogen recommendations. Extreme care should be taken with regard to excessive application of nitrogen andphosphorus due to their possible movement off-site through surface runoff or nitrogen leaching. Such movementinto ground-water and surface water threatens water quality. Use soil testing to determine soil phosphorus require-ments and consider incorporating slowly available forms of nitrogen.
When the sod is rooted or the seed is established, fertilize in accordance with maintenance fertilization recom-mendations. Begin mowing with a sharp mower as soon as the grass reaches a height 1/3 greater than the recom-mended mowing height.
Water-soluble nitrogen to be incorporated to a 4-6” depth prior to seed or sod establishment. If fertilizers usedcontain more than 50% water-soluble nitrogen, multiply recommended amounts by 1.5.
Sod SeedDate Cool-season* Warm-season** Cool-season Warm-season
——————— lb N per 1000 sq ft ———————-Aug 15 to Jan 15 2 0 2.5 0Jan 16 to June 15 1 2 2.0 2.5June 16 to Aug 14 0 2 1.0 2.0*Cool-season grasses include Kentucky bluegrass, tall fescue, creeping red fescue, perennial ryegrass, and creepingbentgrass.**Warm-season grasses include bermudagrass, zoysiagrass, centipedegrass and St. Augustinegrass. These are normallyestablished between May 1 and August 15.
Fertilization of established turfgrass
Phosphorus and potassium requirements should be determined by soil test. Turf grown on irrigated sandy soils,or turf subjected to frequent and heavy traffic, may require higher amounts of nutrients. Turf grown in the shaderequires less nitrogen.
Do not apply readily-available nitrogen sources in excess of 1.0 lb of actual nitrogen per 1000 sq ft in any singleapplication. Phosphate (P
2O
5) and potash (K
2O) may be applied in single or multiple applications, but no more
than 2 lbs of K2O per 1000 sq ft should be applied in any one application. If possible, water-in all fertilizers
following application.
Timing and rate of fertilization is influenced by turf species, existing turf conditions, desired level of quality,type of fertilizer, time of year, etc. Established cool-season turfs are fertilized predominantly in the fall andlightly in late spring, while established warm-season turfs are fertilized from late spring through August. Avoidsummer fertilization on cool-season grasses if at all possible. Do not apply urea within two weeks of liming.
Phosphorus and potassium levels can be high enough in the soil that there is no need to apply additionalamounts of these nutrients. This can be determined by soil test.
Nitrogen fertilizers will state from what source (or carrier) the nitrogen is derived. The nitrogen carrier has agreat impact on how you fertilize because different nitrogen carriers make nitrogen available to the turf at differ-ent rates. Consequently, the carrier will affect how much nitrogen to apply as well as when to apply it.

44 Turfgrass
Agronomy Handbook Virginia Cooperative Extension
Nitrogen fertilizers are generally broken down into two categories: those with readily-available (RA) nitrogenand those with slowly-available (SA) nitrogen. Nitrogen fertilizers that are readily-available have all of theirnitrogen immediately available for plant use. After 3 - 6 weeks, this type of nitrogen is used up by the turfgrassesand results in short periods of turfgrass response. Slowly-available nitrogen, however, can last from 8 - 12 weeksor more.
Some of the nitrogen in slow-release fertilizers can be water-insoluble nitrogen (WIN). The percent WIN isusually stated on the fertilizer container. The fraction of nitrogen not listed as WIN should be regarded as readily-available nitrogen. To effectively gauge the type of plant response from using slow-release fertilizers, calculatethe percent of the total nitrogen in the container that is WIN by the following example:
Fertilizer label 16-4-8: Total Nitrogen……………………16.00%5.6% water insoluble nitrogen or WINAvailable phosphoric acid (P
2O
5)...4.00%
Sulfate of potash (K20)……………8.00%
To find % of N that is WIN, 5.6% WIN x 100use the following calculation: 16.0% Total N x 100 = 35% WIN
In this example, 35% of the nitrogen is WIN while the other 65% of the nitrogen is considered readily-availablenitrogen. In using such a fertilizer, one could expect to get an immediate response due to the high amount ofreadily-available nitrogen. As a general guideline, if the fertilizer you are using has 50% or less WIN or otherslowly available N sources, it should be used in the same manner as a readily-available nitrogen source in fertil-izer programs. If the fertilizer has greater than 50% WIN or other slowly available N sources, it should be used infertilizer programs as a slowly-available form of nitrogen.
Typical nitrogen carriers, along with their inherent characteristics, are listed in the table shown below.
Nitrogen Fertilizers Commonly Used On TurfNitrogen Common Lbs Needed for Nitrogen Foliar Burn Acidifying Cold WaterCarrier Abbreviation % Nitrogen 1 lb of Nitrogen Availability Potential Effect 1 Solubility 2
Ammonium (NH4)NO
3 33.0 3.0 Fast Very High 1.8 710
nitrate
Ammonium (NH4)
2SO
4 20.5 4.8 Fast High 5.3 1810
sulfateSodium nitrate NaNO
3 16.0 6.2 Fast Very High 1.8B 876
(nitrate of soda)Calcium nitrate Ca(NO
3)
2 15.5 5.9 Fast Very High 1.3B 1212
Urea CO(NH2)
2 45.0 2.2 Fast High 1.8 780
Urea UF 38.0 2.6 Slow* Low - SVformaldehydeIsobutylidene IBDU 31.0 3.2 Slow** Low - SS diureaSulfur-coated SCU 32.0 3.1 Mod*** Low - SR ureaMethylene urea - Var - Moderate Low - SVMethylol urea - Var - Fast Low - SV1=Pounds of pure lime CaCO3 equivalent needed to neutralize the acidifying effect per 1 lb of applied actual nitrogen.2=Expressed in grams/liter.SS=Slightly soluble.SR=Slowly released.SV=Solubility varies with formulation.*=Release is dependent upon microbial activity and factors that affect it (i.e. temperature, soil, pH, aeration, moisture, etc.).**=Release rate is dependent upon moisture availability, particle size, and soil pH.***=Release rate is dependent upon particle size, soil temperature, soil moisture, mechanical breakage, and thickness of the sulfur coating.

Turfgrass 45
Virginia Cooperative Extension Agronomy Handbook
Calculating how much fertilizer to purchase
In deciding what type of fertilizer to purchase, it is usually helpful to first look at the Virginia Tech recommendat-ions for fertilizer programs that best fit your situation (grass species and location). Recommendations are com-monly made on the basis of the number of lbs of actual nitrogen (N) per 1000 sq ft of lawn area. To convert lbs/1000 sq ft to lbs/acre, just multiply the lbs N/1000 sq ft by 43.5 (which is the number of 1000 sq ft units in oneacre).
The amount of fertilizer to be purchased for any one application will depend upon the percent of nitrogen (N)contained in the fertilizer. For example, to apply 1 lb N/1000 sq ft from ammonium nitrate (33% N), divide thedesired application rate by the analyses (1 lb N/0.33 N = 3 lbs of ammonium nitrate fertilizer are needed to apply1 lb N/1000 sq ft). The total quantity of fertilizer material needed for an area is calculated by multiplying 3 lbs ofmaterial by the number of 1000 sq ft units of lawn area to be fertilized. For example, if a homeowner had 8500 sqft of lawn area and wanted to use a 46-0-0 (46% N) fertilizer to apply 1.25 lbs of actual nitrogen per 1000 sq ft oflawn, he would make the following calculations:
= 2.72/1000 sq ft
2.72 lbs of fertilizer per 1000 sq ft x 8.5 units of 1000 sq ft = 23.12 lbs of fertilizer needed /8500 sq ft lawn
Applying the right amount of fertilizer
Getting the most out of every fertilizer dollar involves knowing how to accurately apply fertilizer to your lawn.Most lawn fertilizers are usually applied by the homeowner as dry granules using either a drop-type or spinner-type fertilizer spreader. Each fertilizer spreader will have a dial to adjust the spreader openings that determinehow much fertilizer is applied as the spreader travels across the lawn. Changing to a fertilizer of different granulesize or weight and varying speed of spreader operation can alter application rates. Therefore, homeowners shouldbe able to calibrate or adjust their fertilizer application.
Calibrating a drop-type spreader
1. Attach a pan, bag, bucket, or other apparatus to the spreader to collect the fertilizer during operation.2. Fill the spreader.3. Determine the width of spreader application.4. Operate the spreader to cover 435.6 sq ft. NOTE: for a spreader 18” wide, the distance should be
= 290.4 ft
5 . Weigh the amount of fertilizer collected.6. Multiply the weight collected by 2.3 to calculate fertilizer applied per 1000 sq ft.7. If a per acre delivery rate is desired, multiply the weight collected by 100 to calculate fertilizer applied peracre.8. Repeat this procedure and continue by trial and error adjusting the applicator dial each time until the desiredapplication rate is reached.
Calibrating a spinner-type spreader
The procedure and calculations are the same as the drop-type spreader except the width of the fertilizer throw isused as the spreader width.
Example: If a spinner spreader has an application width of 5 ft,then the operating distance would be:
1.250.46
435.6 sq ft 1.5 ft
435.6 sq ft 5 feet
= 87 ft

46 Turfgrass
Agronomy Handbook Virginia Cooperative Extension
This type of applicator gives the best results when half of the desired fertilizer application rate is applied travelingin one direction while the other half is applied in a direction at a 90 degree angle (right angle) to the first in acrisscrossing pattern. This ensures more uniform coverage by minimizing the effect of leaving too much spacebetween swaths. However, when using this half plus half crisscrossing method, be sure to calibrate the spreadertoapply half of the fertilizer to the 435.6 sq ft area because the lawn area will be covered twice.
Spreader calibration without a collection device:
Method A: The procedure and calculations are the same except the fertilizer material is repeatedly applied ontowrapping paper or a smooth concrete floor until an area of 435.6 sq ft is covered. The material is then swept upand weighed to determine the application rate per 435.6 sq ft.
Method B: A quantity of fertilizer is weighed and then put in the spreader. The spreader is operated over a 435.6sq ft lawn area (this fertilizer material cannot be recovered) and the fertilizer remaining in the spreader is thenweighed. Subtracting the weight of the remaining fertilizer from the weight you started with will equal thefertilizer application rate per 435.6 sq ft.
Applying at the proper time
Proper timing of nitrogen applications is different for warm-season and cool-season turfgrasses because of theirdifferent growth cycles. The following four charts show the recommendations for pounds of actual nitrogen per1000 square feet of established lawn area using both quick release and slow release nitrogen sources for bothwarm- and cool-season grasses. The charts can be used to determine the most effective times of application fordifferent levels of turfgrass quality.
Programs for Cool-season grasses. The best time to fertilize cool-season grasses, including Kentucky bluegrass,tall fescue, perennial ryegrass, and fine fescue (creeping red fescue, hard fescue, sheep fescue, and chewingsfescue), in Virginia is from August 15 through November. Excessive spring application of nitrogen to cool-seasongrasses in Virginia leads to excessive leaf growth at the expense of stored food reserves and root growth, increas-ing injury to lawns from summer disease and drought.
Program 1. Nitrogen Fertilization of Cool-season Grasses Using Quickly Available NitrogenFertilizers (less than 50% slowly available nitrogen)
Nitrogen Application by Month - lbs N/1000 sq ft Acceptable Quality Sept Oct Nov May 15-June 15 Low 0 1 0 0 - 1/2 Med 1 1 0 0 - 1/2 High 1 1 1 0 - 1/2
Program 2. Nitrogen Fertilization of Cool-season Grasses Using Slowly Available Fertilizers (50% or more slowly available nitrogen or WIN)
Nitrogen Application by Month - lbs N/1000 sq ft Acceptable Quality Aug 15 to Sept 15 Oct 1 to Nov 1 May15 to June 15 Low 1.5 0 0 Med 1.5 1.5 0 High 1.5 to 2 1.5 0 to 1.5Important comments about Programs 1 and 2.1. Fine fescue performs best at 1 - 2 lbs of nitrogen per 1000 sq ft per year.2. Applications in successive months should be approximately four weeks apart3. Natural organic and activated sewage sludge products should be applied early in the application periods in Program 2 to maximize their
effect.4. One lb of nitrogen in Program 1, and up to 1.5 lbs of nitrogen in Program 2, may be applied per 1000 sq ft in the May 1 - June 15 period if
nitrogen was not applied the previous fall, or to help a new lawn get better established.

Turfgrass 47
Virginia Cooperative Extension Agronomy Handbook
Fertlizer Programs for Warm-Season Grasses. Warm-season grasses, including bermudagrass, zoysiagrass, St.Augustinegrass and centipedegrass, perform best when fertilized between April 1 and August 15 in Virginia.
Program 3. Nitrogen Fertilization of Warm-season Grasses Using Quickly Available NitrogenFertilizers (less than 50% slowly available nitrogen)
Nitrogen Application by Month - lbs N/1000 sq ft Acceptable Quality April May June July/Aug
Low 1 1 0 0
Med 1 1 1 0
High 1 1 1 1
Program 4. Nitrogen Fertilization of Warm-season Grasses Using Predominantly SlowlyAvailable Nitrogen Fertilizers (50% or more slowly available nitrogen or WIN)
Nitrogen Application by Month - lbs N/1000 sq ft
Acceptable Quality April/May June/July
Low 2.0 0
Med 1.5 1.5
High 2.0 2.0Important notes about Programs 3 and 4:1. If overseeded for winter color add 1/2 to 1 lb of readily available nitrogen per 1000 sq ft in October and November.2. Applications in successive months should be approximately four weeks apart.3. Centipedegrass and mature zoysiagrass perform best at 1 to 2 lbs of nitrogen per 1000 sq ft per year.4. Improved winter hardiness on bermudagrass will result from the application of potassium in late Aug. or Sept.
Description of cool-season grasses used in Virginia
Kentucky Bluegrass is a medium textured turfgrass best suited to well-drained soils and moderate to high levels ofsunlight and management. It can be established from seed or sod. Mixtures or blends of 3 or 4 Kentucky bluegrassvarieties are recommended in Virginia since they are more likely to provide good quality turf over the wide rangeof management conditions. Kentucky bluegrass is best suited for full sun or moderate sunlight conditions underhigh levels of maintenance in the central and northern Piedmont and areas in and west of the Blue Ridge moun-tains in Virginia.
Tall Fescue is well adapted throughout Virginia. It has a somewhat coarser texture than Kentucky bluegrass and iswell suited for many different turf situations. Varieties of tall fescue have been especially developed for turf.These varieties have come to be called “turf-type” tall fescues. The main management problem with tall fescue isthe summer occurrence of Rhizoctonia brown patch disease. It is not uncommon for tall fescue sod to contain upto 10 percent Kentucky bluegrass
Fine Fescue— For use in low maintenance areas or in partial to full shade. Summer quality can be poor in opensun and under close summer mowing. Limited research does not indicate any advantage to blending or mixingvarieties from the different fine fescues (e.g.; creeping red fescue, chewings fescue, hard fescue or sheep fescue).Fine fescues are best adapted in the Northern Piedmont and areas in and west of the Blue Ridge Mountains inVirginia. Fine fescues sometimes are mixed with Kentucky bluegrass to provide a seed mixture that will performwell in shade and open sun.

48 Turfgrass
Agronomy Handbook Virginia Cooperative Extension
Turf
gras
s M
anag
emen
t Tab
le B
ased
Upo
n U
se A
nd L
ocat
ion
In V
irgin
ia
A
dapt
atio
n1
N
orth
ern
S
outh
ern
Fer
tiliz
atio
n R
equi
rem
ents
2
Pie
dmon
t & P
iedm
ont &
lbs
nutr
ient
s/ 1
000
sq ft
/yr
Ove
rsee
ding
Gra
ss S
peci
es &
Are
as W
est o
f
E
aste
rnN
itrog
enP
hosp
hate
Pot
ash
Mow
ing
Rat
e4
Rec
omm
ende
d U
seT
he B
lue
Rid
geV
irgin
ia A
reas
(
N)
(
P2O
5) (
K2O
) H
eigh
t3lb
s/10
00 s
q ft
Ber
mud
agra
ss 5,
6
Law
nsN
AA
2-4.
50-
31-
31
1/2-
1”2-
10A
thle
tic F
ield
sS
A*
A2.
5-4.
00-
30-
31/
2-1
1/2”
5-10
Fai
rway
sS
A*
A2.
5-4.
00-
30-
41/
2-3/
4”2-
7Te
esS
A*
A3.
0-6.
00-
30-
41/
2”5-
10G
reen
sN
AS
A*
7.0-
10 1
/20-
30-
41/
4” o
r le
ss40
-50
Zoy
siag
rass
5,
6
Law
nsA
*A
*1-
2.0
0-3
1-3
3/4-
1”2-
10Te
esA
*A
*2-
4.0
0-3
1-3
1/2-
3/4”
5-10
Ken
tuck
y B
lueg
rass
Law
nsA
NA
1-4.
50-
30-
31
1/2-
2 1/
2”A
thle
tic F
ield
sA
NA
3-5.
00-
30-
31
1/2-
2 1/
2”F
airw
ays
AN
A2-
4.0
0-3
0-3
3/4-
1 1/
4”Te
esA
NA
3-5.
00-
30-
33/
4-1
1/4”
Tall
Fes
cue
Law
nsA
A1-
4.5
0-3
0-3
2-3”
+A
thle
tic F
ield
sA
A3-
4.5
0-3
0-3
1 3/
4-2
1/2”
+F
ine-
leaf
fesc
ues
(Red
, che
win
gs,
hard
and
she
ep fe
scue
)S
hade
d la
wns
and
low
mai
nten
ance
are
asA
SA
1-2
0-3
0-3
1 1/
2-3”
Cre
epin
g be
ntgr
ass
Tees
A*
A*
3-5.
50-
30-
41/
4”G
reen
sA
*A
*2.
5-6
0-3
0-4
3/16
”or
less
Per
enni
al r
yegr
ass
7
Law
nsS
AN
A1-
4.5
0-3
0-3
1 1/
2-2”
+A
thle
tic F
ield
sS
AN
A3-
5.0
0-3
0-3
1 1/
4-2”
+F
airw
ays
SA
NA
2-4.
00-
30-
33/
4-1”
+Te
esS
AN
A3-
5.0
0-3
0-3
3/4”
+S
t. A
ugus
tineg
rass
5
Law
nsN
AS
A*
2-5
0-3
0-3
2-2.
5”C
entip
edeg
rass
5
Law
nsN
AS
A1-
2‘0
0-3
0-3
1-2”
Buf
falo
gras
s5
Law
nsN
AN
A2-
30-
30-
31.
5-2.
5”A
= A
dapt
ed.
SA
= S
emi-a
dapt
ed (
may
not
per
sist
und
er n
orm
al m
anag
emen
t).
NA
= N
ot a
dapt
ed (
bette
r gr
ass
spec
ies
are
avai
labl
e fo
r th
at u
se).
1 =
Tur
fgra
ss s
peci
es m
ay b
ecom
e m
ore
adap
tive
to a
clim
ate
thro
ugh
incr
ease
d m
anag
emen
t (i.e
., irr
igat
ion,
var
iety
sel
ectio
n, fu
ngic
ide
appl
icat
ions
, tra
ffic
cont
rol,
prop
er fe
rtili
zatio
n, p
rope
r m
owin
g,an
d su
pple
men
tal c
ultu
ral p
ract
ices
).2
= F
ertil
izat
ion
requ
irem
ent w
ill d
epen
d up
on g
eogr
aphi
cal l
ocat
ions
and
man
agem
ent l
evel
, nitr
ogen
sou
rce,
and
soi
l tes
t res
ults
.3
= T
he a
bilit
y of
a s
peci
fic tu
rf s
peci
es to
tole
rate
a p
artic
ular
mow
ing
heig
ht is
dep
ende
nt u
pon
the
varie
ty a
nd ti
me
of th
e ye
ar. R
aisi
ng th
e m
owin
g he
ight
tow
ard
the
high
end
of t
he r
ange
dur
ing
sum
mer
stre
ss w
ill h
elp
cool
sea
son
gras
s to
lera
nce
to h
eat a
nd d
roug
ht s
tres
s. N
ever
rem
ove
mor
e th
an 1
/3 o
f the
leaf
tiss
ue in
any
one
mow
ing.
4 =
Mon
o-st
ands
or
blen
ds o
f per
enni
al r
yegr
ass
varie
ties
are
satis
fact
ory
for
win
ter
over
seed
ing
of la
wns
, ath
letic
fiel
ds, f
airw
ays,
and
tees
at t
hose
rat
es li
sted
. H
owev
er, a
mix
ture
of 6
5% p
eren
nial
ryeg
rass
, 30%
fine
fesc
ue, a
nd 5
% b
entg
rass
will
pro
duce
sup
erio
r qu
ality
on
gree
ns a
nd th
e ra
te li
sted
for
gree
ns is
for
usin
g th
is m
ixtu
re o
nly.
Zoy
siag
rass
, St.
Aug
ustin
egra
ss a
nd c
entip
edeg
rass
are
typi
cally
not
win
ter
over
seed
ed.
5 =
All
varie
ties
of th
ese
spec
ies
go o
ff-co
lor,
turn
ing
brow
n at
the
first
fros
t and
rem
aini
ng d
orm
ant u
ntil
sprin
g.6
= T
he y
early
nitr
ogen
req
uire
men
t will
dep
end
upon
whe
ther
the
turf
is o
vers
eede
d in
the
fall
for
win
ter
turf
.7
= N
ot r
ecom
men
ded
for
plan
ting
as m
ono-
stan
ds e
xcep
t und
er s
peci
al c
ircum
stan
ces.
* =
Req
uire
s hi
gh le
vels
of m
anag
emen
t and
app
ropr
iate
var
iety
sel
ectio
n.+
= M
ay n
eed
to b
e pe
riodi
cally
ove
rsee
ded
to m
aint
ain
adeq
uate
den
sity
, to
repa
ir da
mag
ed a
reas
, or
to m
ake
up fo
r th
e la
ck o
f per
sist
ence
from
yea
r to
yea
r.

Turfgrass 49
Virginia Cooperative Extension Agronomy Handbook
Ryegrass is available in two types, perennial and annual. Annual (Italian) ryegrass will provide rapid germinationand fast growth but will live only 1 year. This, along with poor persistence under adverse conditions, makesannual ryegrass only suitable where a temporary turf is desired. However, there are a number of good perennialryegrasses available for lawn use. Perennial ryegrass lawns perform best at the higher elevations ( >1000 ft) inVirginia. The best use for the perennial ryegrasses for Virginia is in a mixture with Kentucky bluegrass where theperennial rye-grass component is less than 15% by weight. A pure ryegrass lawn is not recommended sincesummer quality often declines in July and August due to its lack of drought tolerance and susceptibility to heatstress and fungal diseases.
Description of warm-season grasses used in Virginia
Bermudagrass is a warm season turfgrass that is best adapted in eastern Virginia. It does best in open sun and isnot shade tolerant. Some varieties do not produce viable seed and are therefore only vegetatively established usingsprigs, plugs or sod. Commonly used varieties that are vegetatively propagated include Vamont, Midiron,Midlawn, Tifway, and Tufcote. Typically, seeded-type varieties have had the greatest persistence in easternVirginia while the more cold hardy varieties (Midiron, Vamont, and Midlawn) have been established on athleticfields and golf course fairways as far west as Roanoke and Charlottesville. Varieties vary greatly in cold toler-ance, texture and color. Bermudagrass is sometimes overseeded with perennial ryegrass in early autumn toprovide winter color while dormant. However, spring transition back to bermudagrass can be hindered by spring-summer conditions that favor perennial ryegrass growth and delay bermudagrass spring regrowth.
Zoysiagrass is a warm season grass that can be used on lawns, golf course fairways and areas that do not receiveconcentrated traffic. Zoysiagrass is very suited as a low maintenance turf; it grows slowly and does not recoverquickly from severe damage. There are varieties that can only be vegetatively propagated by using sod or plugs.Sprigging zoysiagrass is difficult due to its slow rate of establishment. The more cold hardy varieties like Meyerare adapted from just east of the Blue Ridge mountains to eastern Virginia.
St. Augustinegrass and centipedegrass are both lawn grasses that grow best in the Hampton Roads area of Vir-ginia, benefiting from the coastal climate. Both are vegetatively propagated (stolons, plugs or sod) whilecentipedegrass can also be established from seed. St. Augustinegrass requires more management and highernitrogen levels than does centipedegrass. However, these grasses are not as common to coastal Virginia as theywould be in more southern states.
Mixtures versus single species or variety
The individual species and the conditions under which they are grown determine whether a pure species, varietyor mixture of species or varieties are preferred. Under Virginia conditions these general rules have given bestresults.
1. Mixtures or blends of adapted Kentucky bluegrass varieties have been superior to single varieties grown alone.2. In shady areas, adding an adapted variety of creeping red fescue improves the turf.3. Tall fescue may be grown alone or in mixtures with Kentucky bluegrass, but in mixtures 90% or more of the
mixture should be tall fescue.4. Single varieties grown alone are preferred for all warm season grasses.
When purchasing turfgrass seed, it is extremely important to buy quality seed. Consumer protection programshave been devised to identify quality seed of the varieties recommended by Virginia Cooperative Extension.
Purchasing quality turfgrass seed
The purchase of lawn seed is a long-term investment, because the seed you buy will greatly influence whether yousucceed in developing a beautiful lawn that is perennial in nature. It is not possible to evaluate the quality of seedby looking at it. However, information printed on seed packages can help you make a wise choice when buyingturfgrass seed.

50 Turfgrass
Agronomy Handbook Virginia Cooperative Extension
There are large differences in lawn seed, and it pays to compare. The price you pay for the seed is only a smallportion of the total cost of planting, fertilizing, mowing, etc. Don’t let low cost be the only factor you use whenselecting lawn seed. Choose those varieties that have been tested and have proven to be best suited for your areaof Virginia.
Certified seed
The best guarantee of varietal purity is to purchase CERTIFIED SEED. Such seed will contain fewer weed andother crop seed contaminants and will be free of unneeded inert filler. Certified seed of single grass varieties andcertain grass mixtures and blends are available in Virginia. Even with uncertified seed, it is still very important tobuy seed by variety name. Varietal purity would not be certain, but there would be an indication that a percentageof the seed is of the variety claimed. When seed is purchased by kind (species) only (e.g., Kentucky bluegrass, redfescue, tall fescue, etc.) you have no indication as to variety adaptation or expected performance. Purchasingturfgrass seed without some assurance that it contains adapted varieties should be avoided except where thequality or persistence of the turfgrass stand is unimportant.
Purchasing quality turfgrass seed
When purchasing turfgrass seed there are several questions you need to consider. The following list is offered toassist you in making the best choice of grass for your location:
1. Most types of turfgrass are perennials and are expected to grow back year after year. When you select andpurchase grass seeds consider it a long term investment. You usually get what you pay for so consider purchas-ing a recommended variety that has been tested in Virginia.
2. Deal with a reliable retail store that can answer your questions and provide good information and advice.3. Factors such as temperature, moisture, and light determine the kinds of grasses that are adapted to your loca-
tion.
In order to make the best selection, take the time to consider a few basic questions such as:1. In what temperature zone or region of the state will the grass be grown? Examples: Eastern, Northern Pied-
mont, Southern Piedmont, or Western Virginia.2. Under what moisture conditions will the grass be grown?
Examples: irrigated or non-irrigated with light sandy well drained soil, loamy deep medium texture soil, or heavyclay soil.3. Is the area to be planted an open area with full sun, partially shaded or heavily shaded?4. What type of use will the area have, and how much traffic and maintenance will it receive?
Examples: home lawn with low or high maintenance, commercial business with high visibility, athletic field, orother use.
After gathering this information, consult with a knowledgeable garden center or Extension Service professionaland review your turfgrass options.
Over the past several years many new turfgrass varieties have been introduced in the Virginia market. The Univer-sity of Maryland, USDA, and VA Tech conduct extensive turfgrass variety trials to identify which varietiesperform well in the different regions of the state. Performance data from these trials, along with seed quality arereviewed and published annually, and the varieties that have the best performance are recommended. The Vir-ginia Turfgrass Variety Recommendations list is available through your local Extension Service office.
The best way to insure you are purchasing quality turfgrass seed is to ask for blue tag certified. This insures thatthe seed has been inspected by an independent third party and has met established standards of quality.

Turfgrass 51
Virginia Cooperative Extension Agronomy Handbook
VIRGINIA CROPIMPROVEMENTA S S O C I AT I O NBLACKSBURG, VIRGINIA
CERTIFIED TURFThe tu r f accompany ing th is invo ice is represented by theproducer to be part of the lot that has been officially field inspectedand has met the requirements for “Certified Turf” under the rules andregu la t ions o f the Vi rg in ia Crop Improvement Assoc ia t ion
No. 255
Purchasing quality sod in Virginia
There are several types of sod being grown in Virginia. The basic types are Kentucky bluegrass blends, Kentuckyblue grass mixtures, tall fescue Kentucky bluegrass mixtures, bermudagrass, and zoysiagrass. Each of these typesof sod is best suited to particular uses and geographic areas of Virginia. Some sod producers grow sod in theVirginia Crop Improvement Association (VCIA) certified sod program, which means that the sod produced mustmeet established standards of quality.
VCIA certified sod is of high quality, meeting rigid standards requiring pre-planting field inspections, prescribedvarieties and mixtures, periodic production inspections, and a final preharvest inspection. This program serves asa marketing tool and provides the consumer with guaranteed standards of quality. Consumers purchasing VCIAcertified turf will receive a blue certified turf label as proof of purchase.
VCIA certified turf label (Blue)
High-quality sod is also available outside of the VCIA certified sod program. When purchasing this sod, theconsumer is encouraged to be aware of factors which are important in determining sod quality. High-quality sodwill contain the best varieties and be free of serious disease, insect, or weed problems. It will be dense, have goodcolor, and hold together well.

52 Turfgrass
Agronomy Handbook Virginia Cooperative Extension
Seed Facts 53
Virginia Cooperative Extension Agronomy Handbook
PART IV Seed Facts
David L. Whitt, Extension Seed Programs Leader
Seed inoculation
Legumes have the ability to gather available nitrogen from the air and utilize it for their growth. Grasses growingin association with legumes, or following legumes in rotation, also benefit. Legumes are able to accomplish thisthrough the presence of nitrogen-fixing bacteria that form colonies on the legume roots.
Most soils contain native strains of nitrogen fixing bacteria (rhizobia), but these are often not efficient in fixingnitrogen. Whenever a legume is seeded, especially in soil where that legume has not been grown in the previous 2or 3 years, commercial strains of bacteria should be included with the seed to “inoculate” the soil and the plantroots. This insures that bacteria of a productive strain are present in sufficient quantities to fix nitrogen for theplant.
The rhizobia are usually mixed with black peat that serves as the carrier for the bacteria. This black “inoculum” ismixed with the seed just prior to seeding. It may be mixed thoroughly with dry seed, but better seed contact isobtained by slightly moistening the seed with sugar water or a commercial sticker before adding the inoculum.Pre-inoculated seed, which is coated with the appropriate rhizobia by the seed company, is also available.
When the seed germinates in the soil, the rhizobia bacteria invade the root hairs of the seedlings and begin tomultiply to form nodules. A symbiotic relationship exists between the bacteria in these nodules and the plant. Theplant provides food and a supply system for the bacteria and, in return, the bacteria convert atmospheric nitrogeninto ammonia nitrogen which the plant utilizes.
Well nodulated plants have large nodules that are pink or red inside. Ineffective bacteria produce small nodulesthat are white, gray, or green inside. Nodules should be present by about four weeks after seed germination. If theplants are not properly nodulated, emergency inoculum can be applied to the soil surface by broadcasting orspraying in rainy weather. Under hot and dry conditions, it is necessary to drill the inoculum into the soil.
There are several different strains of rhizobia. It is important to use the correct strain to inoculate thelegume being seeded. The table below indicates those groups of legumes or individual legumes requiringspecific strains.
Precautions in utilizing inoculum:1. Use the correct strain for each legume.2. Use fresh inoculum - check the expiration date on the bag.3. Remember that the bacteria in the inoculum are living organisms and must be kept alive. Store at tem-
peratures between 40˚ and 70˚F.4. Inoculate seed immediately before planting, especially if the seed is treated with a pesticide.5. Prevent exposure of inoculum to direct sunlight.6. Do not mix fertilizer with inoculated seed.
Certified seed
The use of viable seed of adapted varieties is an essential part of successful crop production. Like livestock, seedare living bodies subject to the influences of weather, disease, and breeding. It is not enough that the seed producea plant, it must also contain the genes which will enable the plant to resist disease, produce high yields, and utilizehigh levels of soil fertility.

54 Seed Facts
Agronomy Handbook Virginia Cooperative Extension
Certifying agencyThe Virginia Crop Improvement Association has been designated as the official seed certifying agency in Virginiaby the State Certified Seed Council. The Association is an incorporated non-profit organization of seed growers.
The Virginia Crop Improvement Association works in cooperation with seed growers, seedsmen, research, exten-sion, and teaching divisions of Virginia Polytechnic Institute and State University, the Virginia Department ofAgriculture and Consumer Services, and the United States Department of Agriculture.
Purpose of certificationThe purpose of certification is to reproduce and make available to the public, through certification, high-qualityseed and propagating material of superior plant varieties grown and distributed as to insure genetic purity and aminimum of seed-borne diseases. The word seed, or seeds, includes all propagating material that may be certified.
Classes and sources of certified seedFour classes of seed shall be recognized in seed certification; namely, (a) Breeder, (b) Foundation, (c) Registered,(d) Certified.
CROSS-INOCULATION OF LEGUMES
Bur clover + + + +Alfalfa + + + +Sweet clover + + + +Black medic + + + +Red clover + + + + +White clover + + + + +Ladino clover + + + + +Alsike clover + + + + +Crimson clover + + + + +Hairy vetch + + + +Garden pea + + + +Canada field pea + + + +Austrian winter pea + + + +Birdsfoot trefoil +Crown vetch +Garden bean +Soybean +Cowpea + + + + +Partridge pea + + + + +Peanut + + + + +Lespedeza + + + + +Kudzu + + + + +
(Note: Cross marks indicate which legumes are inoculated by bacteria from other legumes. For example, alfalfa isinoculated by bacteria from bur clover, sweet clover, and black medic.)
Bur
clo
ver
Alfa
lfa
Sw
eet c
love
r
Bla
ck m
edic
Red
clo
ver
Whi
te c
love
r
Ladi
no c
love
r
Als
ike
clov
er
Crim
son
clov
er
Hai
ry v
etch
Gar
den
pea
Can
ada
field
pea
Aus
tria
n w
inte
r pe
a
Bird
sfoo
t tre
foil
Cro
wn
vetc
h
Gra
den
bean
Soy
bean
Cow
pea
Par
trid
ge p
ea
Pea
nut
Lesp
edez
a
Kud
zu

Seed Facts 55
Virginia Cooperative Extension Agronomy Handbook
Breeder seed is seed or vegetive propagating material directly controlled by the originating or sponsoring plantbreeder or institution, and which provides the source for the initial increase of foundation seed. Breeder seed isnot available for commercial distribution.
Foundation seed is seed stock that is so handled as to most nearly maintain specific genetic identity and purity.Production must be carefully supervised and approved by the certifying agency and/or the agricultural researchstation.
Registered seed is the progeny of foundation or registered seed that is so handled as to maintain satisfactorygenetic identity and purity and a minimum of seed-borne diseases, and that has been approved and certified by anofficial certifying agency.
Certified seed is normally the progeny of foundation or registered seed. However, when foundation or registeredclasses of a variety are not available, certified seed may be produced from certified seed that was grown under thesupervision of the certifying agency and so handled as to maintain genetic identity, purity, and a minimum ofseed-borne diseases.
Application for certificationApplication for inspection of a crop for certification may be made on an official Association application blank thatmay be obtained from Extension agents, vocational teachers, or by writing to the Association office. The applica-tion must be properly filled out and mailed to the Virginia Crop Improvement Association, 9142 Atlee StationRoad, Mechanicsville, VA 23116 (804) 746-4884.
Field inspectionAt least one field inspection is made at a time most appropriate to determine compliance with certification re-quirements. All inspections are performed by individuals who have been trained for the job.
Sampling of seedBefore sampling, seed lots should be cleaned and ready for sale, except for labeling. A representative sampleshould be taken from the entire lot.
A 1.5 lb sample is required for small grains, soybeans, and peanuts needing germination and purity tests. A 0.5 lbsample is needed for grasses and small seeded legumes.
Samples may be sent to:State Seed Testing Laboratory l North 14th Street Richmond, VA 23219
Sources of SeedThe VCIA distributes spring and fall certified seed directories which list sources of registered and certified seedgrown in Virginia. The Foundation Seed Farm is located at P.O. Box 78, Mt. Holly, VA 22524 and is responsiblefor increasing seed of new varieties and maintaining commercially important varieties that have been developedby public institutions.
A quick method for estimating the pounds of seeds broadcast per acre:
After planting, place a sheet of 8 1/2” x 11” paper over the planted area and make an outline in the soil. Removethe paper and count the seeds in the marked area. In Column A, find the number counted. The other columns showpounds of seed per acre. Measure several different areas and take an average. This method could be modified byplacing a large cover on the ground before planting to make the small seed more visable.
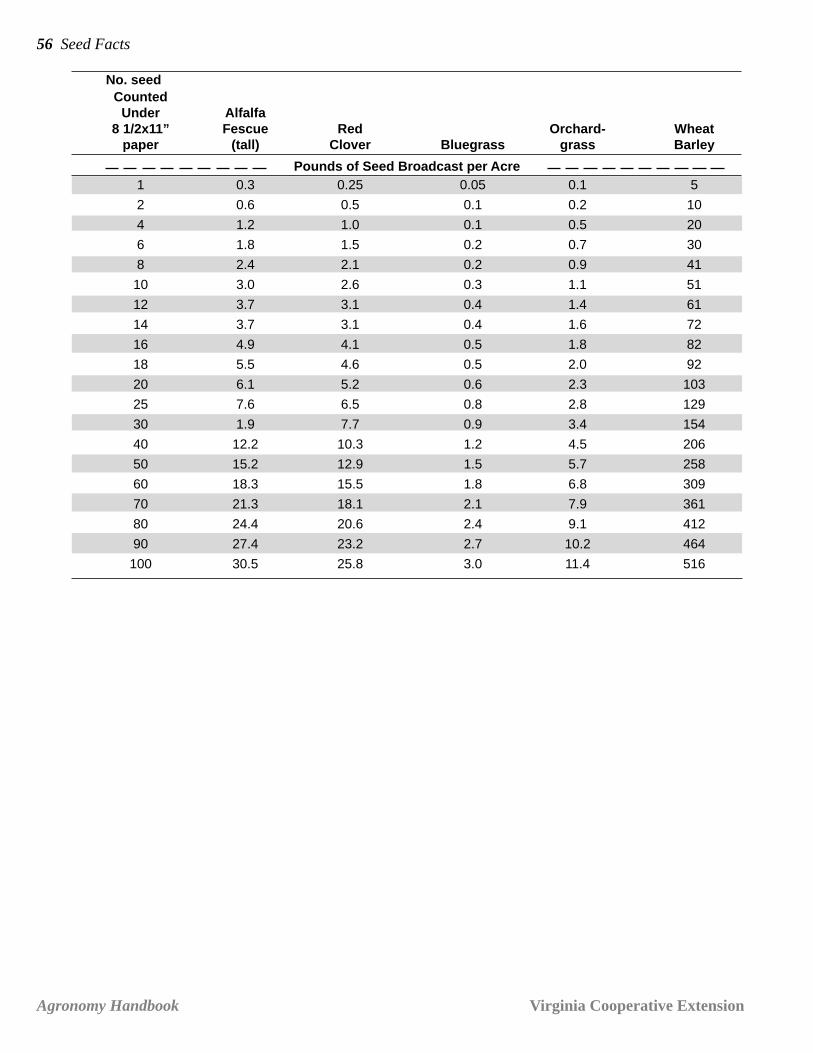
56 Seed Facts
Agronomy Handbook Virginia Cooperative Extension
No. seedCounted
Under Alfalfa8 1/2x11” Fescue Red Orchard- Wheat
paper (tall) Clover Bluegrass grass Barley
Pounds of Seed Broadcast per Acre1 0.3 0.25 0.05 0.1 5
2 0.6 0.5 0.1 0.2 10
4 1.2 1.0 0.1 0.5 20
6 1.8 1.5 0.2 0.7 30
8 2.4 2.1 0.2 0.9 41
10 3.0 2.6 0.3 1.1 51
12 3.7 3.1 0.4 1.4 61
14 3.7 3.1 0.4 1.6 72
16 4.9 4.1 0.5 1.8 82
18 5.5 4.6 0.5 2.0 92
20 6.1 5.2 0.6 2.3 103
25 7.6 6.5 0.8 2.8 129
30 1.9 7.7 0.9 3.4 154
40 12.2 10.3 1.2 4.5 206
50 15.2 12.9 1.5 5.7 258
60 18.3 15.5 1.8 6.8 309
70 21.3 18.1 2.1 7.9 361
80 24.4 20.6 2.4 9.1 412
90 27.4 23.2 2.7 10.2 464
100 30.5 25.8 3.0 11.4 516

Seed Facts 57
Virginia Cooperative Extension Agronomy Handbook
See
d P
opul
atio
n at
Pla
ntin
gR
ow S
paci
ngS
eeds
Per
Acr
e4"
6"8"
10"
14"
16"
18"
20"
22"
24"
26"
28"
30"
32"
34"
36"
38”
Inch
es B
etw
een
See
ds4,
000
392
261
195
156
111
9887
7871
6560
5652
4946
4341
6,00
026
217
413
110
475
6658
5248
4440
3735
3331
2926
8,00
019
613
198
7856
4944
3936
3330
2826
2523
2221
10,0
0015
710
478
6345
3935
3129
2624
2221
2019
1716
12,0
0013
187
6552
3733
2926
2422
2019
1716
1514
13
14,0
0011
275
5645
3228
2522
2019
1716
1514
1312
11
16,0
0098
6549
3928
2522
2018
1615
1413
1211
1010
18 0
0087
5843
3525
2219
1716
1513
1212
1110
9.7
9.2
20 0
0078
5239
3122
2017
1614
1312
1111
9.8
9.2
8.7
8.2
22,0
0071
4736
2820
1816
1513
1211
109.
58.
98.
47.
97.
5
24,0
0065
4333
2619
1615
1312
1110
9.3
8.7
8.2
7.7
7.3
6.9
26,0
0060
4030
2417
1513
1211
109.
38.
68.
17.
57.
16.
76.
3
28 0
0056
3728
2216
1412
1110
9.3
8.6
8.0
7.5
7.0
6.6
6.2
5.9
30 0
0052
3426
2115
1312
109.
58.
78.
07.
47.
06.
56.
25.
85.
5
35,0
0045
2922
1813
1110
8.9
8.2
7.5
6.9
6.4
6.0
5.6
5.3
5.0
4.7
40,0
0039
2620
1611
9.8
8.7
7.8
7.1
6.5
6.0
5.6
5.2
4.9
4.6
4.4
4.1
50,0
0031
2116
138.
97.
87.
06.
35.
75.
24.
84.
54.
23.
93.
73.
53.
3
60 0
0026
1713
107.
46.
65.
85.
24.
84.
44.
03.
73.
53.
33.
12.
9
2.7
70 0
0022
1511
8.9
6.4
5.6
5.0
4.5
4.1
3.7
3.4
3.2
3.0
2.8
2.6
2.5
2.4
80,0
0020
1310
7.8
5.6
4.9
4.4
3.9
3.6
3.3
3.0
2.8
2.6
2.4
2.3
2.2
2.1
90,0
0017
128.
76.
95.
04.
43.
93.
53.
22.
92.
72.
52.
32.
22.
11.
91.
8
100
000
1610
7.8
6.2
4.5
3.9
3.5
3.1
2.9
2.6
2.4
2.2
2.1
2.0
1.8
1.7
1.6
125
000
138.
46.
25.
03.
63.
12.
82.
52.
32.
11.
91.
81.
71.
61.
51.
41.
3
150,
000
127.
05.
24.
23.
02.
62.
32.
11.
91.
71.
61.
51.
41.
31.
21.
21.
1
200,
000
7.8
5.2
3.9
3.1
2.2
2.0
1.7
1.6
1.4
1.3
1.2
1.1
1.0
1.0
0.9
0.9
0.8
250,
000
6.2
4.2
3.1
2.5
1.8
1.6
1.4
1.3
1.1
1.0
1.0
0.9
0.8
0.8
0.7
0.7
0.7
300,
000
5.2
3.5
2.6
2.1
1.5
1.3
1.2
1.0
1.0
0.9
0.8
0.7
0.7
0.7
0.6
0.6
0.5
500,
000
3.1
2.1
1.5
1.2
0.9
0.8
0.7
0.6
0.6
0.5
0.5
0.4
0.4
0.4
0.4
0.3
0.3
1 00
0,00
01.
51.
00.
80.
60.
40.
40.
30.
30.
30.
30.
20.
20.
20.
20.
20.
20.
2
1 50
0,00
01.
00.
70.
50.
40.
30.
30.
20.
20.
20.
20.
20.
10.
10.
10.
10.
10.
1

58 Seed Facts
Agronomy Handbook Virginia Cooperative Extension

Seeds and Stored Grains 59
Virginia Cooperative Extension Agronomy Handbook
PART VSeeds and Stored Grains
Glenn F. Chappell II, Extension Agent, Agriculture, Prince George County, D. Ames Herbert, Jr., Extension Entomologist
Sam McNeill, Assistant Extension Professor, Biosystems and Agriculture Engineering, University of KentuckyResearch and Education Center
Managing stored grains and seed requires the use of various techniques to ensure the quality of the productentering the storage facility does not deteriorate over time. These techniques include: the use of sanitation, storingsound, dry grain, managing temperature and aeration, using chemical protectants, regular sampling, and the use offumigation. Bin and storage facilities also play an important role in determining the quality of the stored grain.Storage facilities should be inspected regularly for deterioration of any type.
Proper storage moisture varies depending on type of seed, length of storage and storage conditions. Seed mois-ture content changes until equilibrium is established with the surrounding environment. The equilibrium moistureis different for each kind of seed. High oil content seeds (soybeans, peanuts, sunflowers) will not absorb as muchmoisture as seed with a high starch content (wheat, barley, corn, sorghum). Oil does not absorb water; therefore,in a seed with 40% oil the seed moisture will be concentrated in the other 60%. The time to reach equilibriumwill vary from days to months depending on the kind of seed, humidity and temperature. When there are largedifferences in seed moisture and the surrounding environment the initial change is rapid and slows as equilibriumtemperature/moisture is approached.
Over 60 species of insects infest stored grains. Lesser grain borer, rice weevils, maize weevils, cadelle beetles,flat grain beetles, rusty grain beetles, sawtoothed grain beetles, foreign grain beetles, mealworm beetles, red flourbeetles, confused flour beetles, Indian meal moths, book lice and grain mites are considered the main pests. Ofthose listed, Indian meal moths are the most commonly encountered. Damage by stored grain insects can gounnoticed until the grain is removed from the storage facility. Regular monitoring will ensure that the quality ofthe grain will be maintained at the highest level possible. Scouting should not be limited to the field. A regularmonitoring program should be continued until the grain leaves the storage facility.
Microorganisms are another important consideration when storing seeds or grain. The two major microorganismsinvolved in seed molds are aspergillus and penicillin. As molds develop in stored grains, temperatures rise result-ing in “hot spots”. In these spots, temperatures can reach as high as 125oF. Mold growth is retarded as tempera-tures increase; seed vigor and germination are also reduced with increased temperatures.
Bin facilities (bulk storage)
Bin facilities should be weather tight, rodent proof, steel, and on a moisture proof concrete base. Bins should beequipped with a perforated-floor aeration system and weather proof-roof vent. All bins should be inspected on aregular basis to guard against leaks and deterioration of any kind. Once filled, attempt to seal the bottom andsides of the bin so insects and rodents can only enter the top of the facility. Do not seal roof aeration exhaust orinlet vents except during fumigation so the top of the bin can be easily sampled and top dressings applied ifnecessary.
Sanitation
Before adding grain to a storage facility, make sure it is clean and free of old grain, trash and insects. Be sure thewalls, ceiling, sills, ledges, floors and the ventilation system (under perforated floors, ducts and fan system) areclean. The area outside the bin should also be free of insects, weeds and grain products. Insects can breed and
60 Seeds and Stored Grains
Agronomy Handbook Virginia Cooperative Extension
persist in these areas and infest new grain when placed in the bin. It is best to clean and treat bins at least twoweeks prior to adding new grain.
Most insect infestations in stored grain originate in the immediate area of the storage facility. Area sanitation isimportant since many of the commonly stored grain pests can fly and may move from one bin to another.
Grain moisture
As a general rule, grain should be stored at no more than 12% moisture. Insects and fungi do not develop well ingrain with moisture content of 12% or below. For seed to be stored for long periods of time, the maximum safemoisture content is about 2% below the safe storage moisture of the grain. Refer to Table 1 for recommendedstorage moistures for grains and seed at various storage temperatures. Seed can be stored for 3-5 years in sealedcontainers at 65–75oF if dried to 5 – 8% moisture. For longer storage periods under these conditions, seed shouldbe dried to 2.5–5% moisture before placing in a sealed container. Seed moisture content can be increased as thetemperature is reduced below 60oF. Avoid storing seed in environments that will expose them to high tempera-tures or humidity. Dry, cold storage is ideal; therefore, a freezer is excellent for seed storage.

Seeds and Stored Grains 61
Virginia Cooperative Extension Agronomy Handbook
1 Safe storage depends on many factors such as temperature, humidity, kind and variety of seed, quality, damage, microor-ganisms, length and kind of storage. Stored grains and seed should be inspected frequently for changes in temperature andmoisture as well as pest infestations.
2 Ventilated cribs 6-8’ wide.
Table 1. Suggested Maximum Safe Moisture Storage For Grain and Seed 1
Grain and SeedLong-term Storage Temperature
Seed 2 months 6 months Storage Should be Below oF
Maximum Grain Moisture (%)
Barley — 13.4 11.9 77Buckwheat — 13.9 12.4 77Corn, grain 14.8 14.0 12.4 77Corn, grain 15.2 14.2 12.6 60Corn, grain 17.7 15.5 13.9 40Corn, ear2 — 20.0 — 50Oats — 12.8 11.4 77Millet — 10.0 9.0 70Peanuts, unshelled 11.2 9.6 8.4 70Peanuts, unshelled 12.0 10.3 8.9 50Peanuts, shelled 8.8 7.7 6.7 70Peanuts, shelled 9.1 8.1 7.2 50Rye — 13.9 12.3 77Soybeans 15.8 12.0 9.7 77Soybeans 16.1 12.4 10.1 60Soybeans 16.5 12.9 10.4 40Sunflowers, oil — 9.6 8.6 77Sunflowers, non-oil — 10.0 9.0 77Sorghum 14.7 13.5 12.4 90Sorghum 15.2 14.0 13.0 60Wheat, soft red winter 15.6 13.6 12.1 77Wheat, soft red winter 15.8 14.0 12.4 70Wheat, soft red winter 16.0 14.4 13.1 40Alfalfa — — 7.8 73KY bluegrass — — 11.3 73Clover, red — — 9.1 73Clover, white — — 8.7 73Crown vetch — — 9.4 73Tall fescue — — 12.1 73Orchardgrass — — 11.0 73Ryegrass — — 12.8 73Timothy — — 12.5 73

62 Seeds and Stored Grains
Agronomy Handbook Virginia Cooperative Extension
Temperature and aeration
A combination of low seed temperature and low moisture aid in insect control. Insect reproduction is reduced attemperatures below 60oF and as the moisture content of the seed is reduced. These conditions do not provideenough heat and water to meet the needs of the insects. Grains harvested and stored in the hottest part of the yearhave a greater chance of becoming infested, since insects reproduce rapidly at temperatures in the range of 60-90oF. Farm stored wheat, rye, barley or oats are more likely to have insect problems than corn or soybeans whichare harvested during the cooler months of the year. Aeration during times of low outside temperature and humid-ity is suggested to reduce temperature and moisture. In the southern United States, it is recommended to maintainwarm temperatures and low humidity until cooler temperatures arrive and then cool the grain to 55-65oF or loweras soon as possible. The amount of air required for good aeration is relatively low, but it should be at least 0.10cubic foot per minute per bushel.
Resistance to Low Temperatures of Various Insects that Attack Stored Grain and Grain Products
Days Exposure Required to Kill All Stages at 1
Insect 0 o-5oF 5o-10oF 10o-15oF 15o-20oF 20o-25oF 25o-30oF 30o-35oFRice weevil 1 1 1 3 6 8 16
Granary weevil 1 3 — 14 33 46 73
Saw-toothed grain beetle 1 1 3 3 7 23 26Confused flour beetle 1 1 1 1 5 12 17Red flour beetle 1 1 1 1 5 8 17
Indian-meal moth 1 3 5 8 28 90 —Mediterranean flour moth 1 3 4 7 24 116 —
1 Storage of Cereal Grains and Their Products, J. A. Anderson and A. W. Alcock, American Association of Cereal Chemist,St. Paul, Minnesota, 1954.
Several practices should be followed when filling bins to permit even aeration of the grain mass. The uppersurface of the grain mass should be level or slightly inverted to permit even aeration. The use of a grain spreaderwill help prevent the accumulation of fines (broken grain, weed seed, dust and debris) in the center when fillingbins. If not spread evenly, this material will accumulate in the center of the bin preventing even aeration andproviding an excellent environment for insects and fungi to develop.
Load
FINE
S
Load
Unload Unload
Figure 1 Figure 2

Seeds and Stored Grains 63
Virginia Cooperative Extension Agronomy Handbook
The accumulation of fines in the center of the bin can be greatly reduced by removing a portion of the grain massafter the facility is filled or several times during the loading process. Removing the core from the bottom with thecentrally located unloading auger or conveyer will remove the column of fines and invert the peaked grain in thetop of the tank (Figure 2). After this process is completed the grain can be left alone or leveled. This processcalled "coring" will increase aeration efficiency and reduce problems with insects, fungi and hotspots. For grainstored through the winter, aeration in the fall can deter moisture migration in the bin. Moisture migration is causedby differential temperatures in the grain mass resulting in convective flow of air through the grain. The convec-tive flow of air can result in accumulating moisture condensation in the upper center of the grain mass. Thesefactors will contribute to the development of molds and insects. Attempt to maintain grain temperature within10˚F of the average outside air temperature. Depending on the year and the conditions several aeration eventsmay be required to correct temperature differences. Aeration is very important in grain bins containing 2,000bushels or more.
Empty bin sprays
Empty bin sprays are recommended for summer stored grain, difficult to clean bins or when there is a history ofinsect problems. After bins have been properly cleaned and inspected and prior to adding new grain, spray theempty bin with a labeled insecticide. Spray to run-off the inside surface, and as much of the outside including thenearby ground surfaces, aeration ducts, and grain handling equipment, as possible. Sprays should be concentratedon cracks, crevices and areas difficult to clean. Applications should be made at least two weeks prior to addingnew grain. Allow 24 hours for sprays to dry. These sprays provide a barrier for insects that may be attracted tothe storage facilities and also provide control of the insects not removed during the cleaning operation.
Bacillus thuringiensis grain products
Bacillus thuringiensis (Bt) is a biological insecticide that has activity on some moth larvae. This insecticide hasbeen genetically engineered into many of the grain crops currently produced in the United States. In many ofthese newer engineered crops, the Bt gene is expressed in the grain as well as other parts of the plant thus provid-ing the grain with protection from larval feeding. Although no research has been conducted to determine theeffectiveness of Bt grains in storage, protection should be equal to or superior to the Bt products available forstored product treatments. The expression of the Bt toxin in every grain should provide a level of protectiongreater than any Bt topical, bin or grain treatment. Until research has been conducted to determine the effective-ness of the Bt gene under storage conditions, sample grain regularly. Bt products will not control weevils or otherbeetles.
Chemical grain protectents
A grain protectant may be added when the bin is being filled to guard against insect damage. Protectants may alsobe added to the upper surface of the grain in the bin to protect against damage from moths and other insectsentering the top of the storage facility. Protectants will not eliminate existing infestations. Protectants are recom-mended if grain is going to be stored for extended periods, in flat structures, under circumstances that favor pestdevelopment, or in facilities with a history of insect damage. The combination of high grain moisture and hightemperatures will shorten the residual life of grain protectants. Use only labeled products at the approved ratesand check with your miller or buyer before using an insecticide on stored products.
Top dressing and pest strips
It may be necessary to mix an insecticide with the top 4 inches of the grain to deal with an infestation of primarilymoths. Moths tend to attack the upper surface of the grain mass. The Indian meal moth is the most commoninsect to attack stored grain and, unfortunately, it already has resistance to some insecticides.
Resin strips (dichorvos or DDVP) may also be hung in the air space in the top of the bin to help control adultmoths. For this treatment to be effective, the top of the bin must be temporarily sealed including the roof vent.Aeration will disrupt this treatment. Remember to open the roof vent before aerating.

64 Seeds and Stored Grains
Agronomy Handbook Virginia Cooperative Extension
Insect Sampling
Bins should be inspected on a regular basis for insects, hot spots, mold growth or any "off odor.” As a generalguideline, bins should be sampled twice a month under warm conditions and once a month under cool conditions.Regular inspections will reduce the chances of pests becoming established. Take all necessary safety precautions.Bins should be easily accessible and all unloading equipment should be turned off. Be aware of any pesticidesapplied to the grain, undissipated fumigants, bridged grain, grain dusts, and high temperatures. WORKING INTEAMS IS THE BEST POLICY WITH AT LEASTONE PERSON ON THE OUTSIDE OF THE STOR-AGE FACILITY.
Samplers should be alert for:• Off odors• Crusting• Temperature differences > 10˚F• Visible water vapor• Sprouting grain• Exterior bin conditions and signs• Uneven snow melt or frosting• Condensation• Discoloration• Fecal matter (birds, rodent and insect)• Birds (insect feeders)
Use a probe (Figure 4) or scoop to collect thesamples. Take five to ten, one-pint samples fromvarious areas over the grain surface. Using a com-partmentalized grain trier will allow the sampler todetermine differences in grain moisture, insect popula-tions, temperature and grain quality at different depthsin the grain mass. Label samples so problem areaswithin the bin can be identified. Sampling at differentdepths will greatly increase the chances of findingtrouble spots before a large area of grain is damaged.
Grain temperature should be determined as soon aspossible after the sample is taken to achieve the mostaccurate results. Temperature differences in the range10 - 15˚F indicate a potential problem. Usuallyaeration will correct the temperature difference. Aftercorrective measures are taken, further sampling is suggested to ensure the problem has been corrected.
When sampling for insects in cool grain, samples should be warmed. Warming will increase the activity of theinsects allowing the sampler to easily spot the pests and determine if the insects are alive. Individual samples canbe placed in labeled plastic bags to guard against contamination. Each sample should be placed on a sieve, whichwill hold the grain while allowing the pieces (fines), insects and small debris to pass through. If insects arepresent, save them for identification, estimate the abundance and determine the distribution. Pest identification iscrucial when selecting a control measure. For example, several species of insects feed on fungi. Their presenceindicates a moisture problem. Control of the insects with pesticides can be achieved without correcting theprimary problem.
Figure 4. Grain Trier Figure 3. Probe Trap

Seeds and Stored Grains 65
Virginia Cooperative Extension Agronomy Handbook
Another method of sampling involves using a grain probe trap. (Figure 3) This trap consists of a perforatedplastic tube with a funnel collector on the bottom. Traps are inserted in the grain mass and marked with coloredstring which allows them to be retrieved. Traps are retrieved after 24 hours and are more efficient than probingand sieving for beetles, but they do not adequately detect moth larvae.
Trouble spots can also be identified using a metal rod. Insert the rod into the grain and allow it to remain forabout 10 minutes. Hot spots can be detected by running your hand down the rod after removing it from the grain.If temperature differences are sensed, investigate these areas further to determine the reason for the difference ingrain temperature.
Accurate records should be kept so changes over time can be detected. Records can be used to refine a manage-ment strategy for your individual operation.
Generally, it is suggested to treat grain to control insects:
If Wheat, Rye, or Triticale have one live insect per quart sample
If Corn, Sorghum, Barley, Oats or Soybeans, have one live weevil or five other insects per quart sample
If these thresholds are exceeded, fumigation is suggested. However, if temperatures are below manufacturersuggested levels, fumigation should be delayed. Fumigation effectiveness is greatly reduced under cool condi-tions. For conditions that do not favor fumigation, the grain mass should be cooled to below 60˚F if possible. Attemperatures below 60˚F, insects are for the most part inactive. When temperatures permit, fumigation should beconsidered.
Primary grain insects
Primary grain insects refer to a group of insects that attacks whole, undamaged grain. The immature stages ofthese insects occur on the inside of the grain where detection is more difficult. The damage from these insectsresults in an Insect Damaged Kernels (IDK) sample grade classification. Examples of primary insects include therice weevils, bean weevils and lesser grain borer.
Secondary grain insects
This group refers to a complex of insects that feeds on fragments of grain and cereals. They can also be referredto as bran bugs. They include various grain moths, mites, psocids and various beetles. Examples of secondaryinsects include flour beetles, sawtoothed grain beetles, rusty grain beetles and Indian meal moths.
Fumigation
Fumigation should be conducted only by trained, experienced, registered applicators. If insects are found abovethe suggested thresholds, fumigation is suggested. The goal of fumigation is to maintain a toxic concentration ofgas long enough to kill the target pest population. The toxic gasses penetrate into cracks, crevices, the commodityand the facility treated. Fumigants provide no residual protection. Fumigants come in several forms and formu-lations. All label instructions and precautions should be read and carefully followed.
Fumigant selection should be based on the following factors: pest susceptibility, volatility, penetrability, corro-siveness, safety, flammability, residues, odors, application method, required equipment, and economics. There aretwo products labeled for treating stored products – methyl bromide and phosphine producing materials such asmagnesium phosphide and aluminum phosphide.

66 Seeds and Stored Grains
Agronomy Handbook Virginia Cooperative Extension
Phosphine fumigants
Phosphine has no adverse affects on seed germination when applied according to label directions and at labeledrates. Phosphine does react with certain metals such as copper, brass, bronze, gold and silver. Reactions result indiscoloration and corrosion. This is a problem with electrical and mechanical systems that utilize these metals.This problem apparently only occurs when there are high concentrations of phosphine in combination with highhumidity and temperature.
If the liberation of hydrogen phosphide occurs in a confined area an explosion or fire may result. Aluminumphosphide has been formulated with ammonium carbamate or aluminum stearate and calcium oxide to control therelease and lower the combustibility. In addition to controlling the reaction, formulations that contain ammoniumcarbamate release a garlic odor that serves as a warning odor. The time required for phosphine release is shorterunder warm, humid conditions and longer under cool and dry conditions. Since the gas diffuses through the grainrapidly, structures must be sealed properly, especially under cooler conditions.
Methyl bromide fumigants
Under most conditions, fumigation with methyl bromide will not harm germination. However, high doses (gener-ally used for insects) for more than 24 hours coupled with temperatures above 85˚F and moisture greater than12% can negatively impact seed germination. Methyl bromide does not harm electronic equipment and wiring,requires less time to kill insects when compared to phosphine but does give certain products containing sulfur,rubber (foam and sponge rubber also), feathers, hairs, and cinder blocks an odor. For other products affected bythe methyl bromide refer to the product label. When using methyl bromide at temperatures below 60˚F, thedosage of the fumigant should be increased to compensate for the cooler conditions.
Methyl bromide is 3.27 times heavier than air, causing it to fall when released. Because of the density of thefumigant, grain leveling is important. Unleveled grain results in the fumigant settling to low areas in the grainresulting in poor fumigation of the peaked grain. Recirculation is often used to ensure even distribution of thefumigant.
Methyl bromide comes in small cans or can be obtained in large cylinders. Small cans require special puncturetype openers to release the gas. The cans are generally used where small structures and transportation containersrequire fumigation. Cylinders are primarily used for larger facilities. The cylinders are connected to the binfacility with brass fittings and polyethylene tubing. The end of the tubing is usually placed in the headspace ofthe bin with a plastic pan or tray under the end of the tube to catch any moisture. The amount of fumigant re-quired is determined based on the size of the structure and environmental conditions present. The cylinder isplaced on a set of scales and the weight determined. The valve is opened and then closed once the proper amountof the fumigant has been released.
Grain storage space, capacities and weights
Bushels of grain can be determined either on a weight basis or on a volume basis. Grain test weight can be usedto convert from one to the other.
Volume bushels
1.0 bushel shelled grain = 1.25 cubic feet1.0 cubic foot = 0.8 bushel shelled grain
1.0 bushel ear corn = 2. 5 cubic feet1.0 cubic foot = 0.4 bushel ear corn
2.0 bushels of ear corn = 1.0 bushel of shelled corn

Seeds and Stored Grains 67
Virginia Cooperative Extension Agronomy Handbook
Bin Storage capacity in bushels(approximate)
Rectangular bins = length x width x height x 0.8 bu.Round bins = Diameter2 x height x 0.628 bu.
Weight of Grain Per Bushel at Various Moisture Levels
Lbs. Grain toMake 60 lbs.
Moisture % Shelled lbs. Ear lbs. Harvest Moisture % Bu at 14%10.0 52.6 62.5 10.0 57.612.0 53.8 64.7 11.0 58.214.0 55.0 66.9 12.0 58.815.5 56.0 68.4 13.0 59.418.0 57.7 71.3 14.0 60.020.0 59.1 74.0 15.0 60.622.0 60.6 76.8 16.0 61.224.0 62.2 79.8 17.0 61.826.0 63.9 82.8 18.0 62.428.0 65.7 85.6 19.0 63.030.0 67.6 88.5 20.0 63.632.0 69.6 91.4 21.0 64.234.0 71.7 94.3 22.0 64.8
References
Management of Stored Grain Insects, Part I: Facts of Life. Kansas State Cooperative Extension Service Publica-tion MF-726.Management of Stored Grain Insects, Part II: Identification and Sampling of Stored Grain Insects. Kansas StateCooperative Extension Service Publication MF-916.Management of Stored Grain Insects, Part III: Structural Sprays, Pest Strips, Grain Protectents, and SurfaceDressings. Kansas State Extension Publication MF-917.Stored Product Management. Oklahoma Cooperative Extension Service Circulation Number E-912.
Corn Soybeans

68 Seeds and Stored Grains
Agronomy Handbook Virginia Cooperative Extension

Soils of Virginia 69
Virginia Cooperative Extension Agronomy Handbook
PART VI Soils of Virginia
James C. Baker, Extension Soils and Land Use Specialist
There are more than 600 soil series mapped in Virginia. These soils show great ranges in properties and thus intheir suitability for different uses. Much of the difference in soils relates to the geologic parent materials fromwhich they have formed as well as the local topography. The diverse nature of the parent materials is seen in thePhysiographic and Soil Parent Material Map of Virginia (Figure 1).
Major soil divisions
A. Appalachian division.The soils in this area have formed in materials deposited beneath ancient seas. These deposits became sedi-mentary rocks of which primary types are limestone, shale, sandstone, and conglomerate.
Soils formed from limestone are found primarily in valley areas. In the past, most limestone derived soil areashave been farmed and remain some of the most agriculturally important soils of the region. They are perme-able and usually well drained although the major land use problem with these soils is the variation of depth ofsoil above bedrock. In addition, the subsoils commonly have high contents of clay and some sites haveeroded.
Soils formed from shales usually occur on more sloping landscapes in the valleys and along the bases ofmountains. These soils commonly range from shallow to moderately deep to bedrock and may contain manyshale fragments throughout the soil profile.
Soils formed from sandstone and conglomerates occur along the major ridges and mountains. These soils areusually shallow, sandy, and often stony or gravelly.
In addition to major characteristics discussed above, soils formed in transported materials by gravity (collu-vium) and water (alluvium) are common in lower landscape positions and are important agriculturally. Soilsformed from colluvium commonly have compacted subsoil layers (called fragipans), high seasonal watertables, and may be stony. Soils formed in alluvium are generally the most productive soils of the region. Someare on floodplain positions and as such may be subject to stream overflow. Those on non-overflow positions,such as stream terraces, are usually well suited to many uses although some have seasonally high water tables.
B. Blue Ridge division.The soils of this area are formed from a combination of sedimentary rocks, igneous rocks formed from moltenmagma, and metamorphosed rocks formed by heat and/or pressure alteration of other rocks. The igneous andmetamorphosed rocks are termed crystalline rocks on the soil parent material map.
In general, the sedimentary rocks are on western slopes of the Blue Ridge and the crystalline rocks are on theeastern slopes. The overriding soil use constraints in the Blue Ridge region are steep slopes, stoniness, andshallow soil over bedrock. The steep slopes associated with much of the area demand that careful attention begiven to any activity, either cultivation or construction, that leaves the soil bare. It is imperative to minimizeerosion hazards.
The soils derived from sedimentary rocks occur predominantly on steep slopes and are shallow to bedrock.The soils formed from crystalline rock may be on steep slopes but also occur on more gently sloping highlandareas along the Blue Ridge. To the north of Roanoke, these gently sloping ridges are narrow, thus limitinguses to forestry and recreation. To the south of Roanoke, the Blue Ridge Highland area is gently sloping and

70 Soils of Virginia
Agronomy Handbook Virginia Cooperative Extension
FIGURE 1. PARENT MATERIAL MAP

Soils of Virginia 71
Virginia Cooperative Extension Agronomy Handbook
several miles wide. This area is intensively used for agriculture and is dominated by deep, well drained soilssuitable for many uses. As with all regions where steep slopes may occur, care must be taken to controlerosion. Some regions also have locally important areas of soils formed from colluvium which in this regionis quite variable in texture and drainage.
C. Piedmont divisionThis is the largest physiographic region in Virginia. It occurs between the Blue Ridge and a line runningbetween Arlington and Emporia. The Piedmont region is dominated by igneous and metamorphic rocks withimportant areas of sedimentary rocks in some counties.
The predominant parent material rocks are gneiss, schist, and granite, of which quartz, feldspar, and mica arethe dominant primary minerals. Soils developed from these rocks and minerals form acid, infertile soils, withsandy loam surfaces. Many of the clayey subsoils are red or yellowish red due to the oxidized iron weatheredfrom the primary minerals. Natural fertility is low; however, these soils respond well to liming and fertiliza-tion. Depth to bedrock varies but in most places, these soils are deeply weathered for several feet. Some areasin this region have particularly high aluminum in the subsoil, which can be an agronomic problem for somecrops. Liming is necessary on such soils. Historically, much of the Piedmont region was cleared and farmedintensively, causing extreme erosion over much of the region. Before modern soil fertility and managerialpractices were adapted to these soils, agricultural production diminished and most farms reverted back toforests. Over two thirds of this region is wooded today. The best soils are still agriculturally productivethrough well managed soil fertility and erosion control plans.
Other soils formed in the region were formed from igneous and metamorphic rocks with a high base contentof calcium and magnesium. Soils formed from such minerals tend to be more fertile but in some instancesthey form clayey subsoils with very high capacity to shrink and swell on wetting and drying. Where such soilsare eroded this condition poses a particular set of managerial challenges to farmers and even more to develop-ers. Where uneroded, most of these soils are moderately well suited to lawns and gardens if properly man-aged. The depth to bedrock is generally two to six feet.
Scattered throughout the Piedmont are other soil areas formed from sandstone and shale which were geologicsediments deposited in Triassic age basins. These ancient basins are oriented in a northeast to southwestdirection, roughly paralleling the Blue Ridge. The region to the north and east of Charlottesville have shallowto deep soils which can be quite productive when depth to bedrock is not a problem. To the south and east ofCharlottesville, such soils may have high clay content, with high water tables and very high aluminum levels.On such soils, it is difficult to establish high productivity for crops, lawns, or gardens. Some soils in thisregion have high shrink-swell clays which pose severe stability problems for urban uses and tillage and rootpruning problems for agricultural uses. Depth to bedrock varies from two to ten feet.
D. Coastal Plains divisionSoils of this region are formed from unconsolidated sediments deposited when the ocean level was muchhigher than at present. As sea levels lowered, many of these deposits were reworked by meandering rivers andstreams that originated in the western part of the state and flowed to the east.
In general, the closer to the coast, the nearer the water table to the soil surface.
Soils in the coastal plain are acid, infertile, highly weathered, and vary from sandy textures to very clayeytextures. Many of the soils have thick sandy surfaces which make them susceptible to summer droughts. Mostlandscapes are nearly level to gently sloping and because of this feature the soils are not as susceptible toerosion.
These soils and landscapes, commonly coupled with larger field sizes, accommodate more efficient farmingpractices. This region has the highest percentage of row crop agriculture. Modern soil fertility/liming manage-

72 Soils of Virginia
Agronomy Handbook Virginia Cooperative Extension
rial practices, high capacity farm implementation, and other production technologies make the more suitablesoils of this region competitive with any other part of the state.
There are still significant acres of poorly drained soils with high water tables in the coastal plains region.Many of these areas are in woodland or exist as jurisdictional wetlands which are protected from drainage bycurrent law. These wetland areas provide the essential mechanisms necessary to slow water movement fromuplands to estuaries and bays of eastern Virginia, thus serving to maintain high water quality and a sustainablebiodiversity for the region.
Soils in natural landscapes and soil surveys.
The discussion above is intended only as a general guide to major land resource areas in Virginia. It must beremembered that drastically different soils may occur within the same landscape. Soils within similar landscapesare somewhat variable in properties, much of this being due to local variations of parent materials. Several soilsmay occur together within a field of a few acres. Usually, soil bodies are related to landscape positions. The shapeof the landscape configuration has a direct effect on soil drainage and soil type. Concave shaped positions arecollectors of water while convex positions divert water and thus are usually better drained.
The Virginia Cooperative Soil Survey has produced detailed soil survey maps for nearly 90% of the state. Thesesoil survey maps show the geographic locations of different soil bodies on the landscape. The use of the mapswith soil descriptions and interpretative guides provides a means of estimating the suitability of an area for aparticular land use. Soil surveys should be available at the local Virginia Tech Extension office or Natural Re-sources Conservation Service office.
Soils for homesites
The homeowner should be aware of the following soil/site features: 1 ) surface drainage and permeability, 2)erodibility, 3) presence of expansive clays, 4) relief and soil depth, and 5) if a septic tank and drainfield system isplanned, the soil must “perc.”
Drainage and permeabilitySurface drainage and internal soil drainage relate to the shedding of water from a site by surface overflow and theremoval of excess soil water to give the soil aeration. Well drained soils are not saturated for significant periods oftime and the depth of seasonally high water tables is usually greater than 6 feet. Well drained soils are generallythe most suitable for building sites and most types of plantings. Poorly drained soils may have water at or near theground surface during wet periods of the year.
All regions of Virginia have both well drained and poorly drained soils and everything in between these extremes.In some areas of Virginia, over 90 percent of the soils have potential wetness problems. These wet areas presentspecial problems for landscaping, yard drainage, and maintenance of a dry basement.
Permeability is the rate that a soil will transmit water through the profile. This varies from rapid to very slow.Water movement is aided by a network of interconnected pores that extend throughout the soil. Where soil poresare small and total pore space is limited, such as in poorly aggregated subsoils with high clay content, or wherecompacted layers exist, permeability will be slow to very slow. Layers of expansive clays and compacted layersrestrict downward movement or percolation during wet periods and may result in temporarily perched watertables.
In many cases, wetness problems in basements or around footings can be overcome with proper surface drainageby diverting excess water away from problem areas. For new construction, the use of footing drains along withproper grading and surface water control is recommended to reduce the potential for wetness problems. Footingdrains installed at construction time are relatively inexpensive but are very costly to install later when a problemarises.

Soils of Virginia 73
Virginia Cooperative Extension Agronomy Handbook
ErodibilityThe susceptibility of a home site to soil erosion depends on the kinds of soil but also on the grading andland-forming done by the contractor during development. In many cases, especially on small lots, the natural soilshave been completely removed, or at least disturbed, by cutting and filling. The original surface soil on the lot islikely to have been removed from the site or lost during construction, although some contractors make an attemptto reapply the topsoil to the finished grade. The erodibility therefore depends on characteristics of the slope andsoil material. Vegetation should be established as soon as possible on any bare soil areas. Any kind of plant debris(straw, grass, mulch) or commercial cloth mesh that covers the ground will help reduce soil erosion until perma-nent vegetation or sod is in place.
Expansive claysSoils with a high content of expansive clays will change volume on wetting and drying. These expansive soilsmay cause severe damage to foundations and footings of buildings, sidewalks, roads, and other structures. Wheresuch clays are at or near the soil surface, severe root pruning of plant seedlings may occur. Where such soils areencountered or expected, an on-site evaluation by a qualified soil scientist is recommended. If construction isplanned on such soils, it may be advisable to remove the expansive material from the site. In some instances,special designs, such as rebar reinforcement may be necessary. In other instances it may be advisable to seek analternative site. In any case, planning ahead of construction is far less costly than remediation of a site onceexpansive soils have caused building damage.
Relief and soil depthHome sites with excessive relief (steep slopes) may impose restrictions on basic construction and force othercompromises relative to access and maintenance of public utilities. Locating lawns, gardens, play areas, and septicdrainfields is difficult on steep slopes. There must be adequate soil depth for growing the kinds of plants desired.Steep slopes or shallow to bedrock conditions are severe limitations.
Managing septic tank drainfield systems
Houses constructed where there are no public sewer systems will have an individual subsurface sewage disposalsystem. The system is most commonly a septic tank drainfield system. The drainfield will usually be within anarea less than 50’ by 100’ in size. The purpose of the system is to carry all the waste water from the house andallow its absorption into the subsoil. Soil areas used for this purpose in Virginia must pass strict evaluations andtesting procedures, commonly described in real estate ads as “perced...”. In order to pass this test, soils must bewell drained, have good permeability, and be higher in elevation than adjacent drainage ways. The septic tankdrainfield system absorbs hundreds of thousands of gallons of sewage effluent and will last many years if the soilis suitable and the system is correctly installed and properly maintained.
Drainfield maintenance
Plantings - A cover of grass should be maintained over the system. It is important to eliminate any erosion sincethe drainfield lines are often within two feet of the land surface. The species of grass is not as important as themaintenance of a healthy cover. Do not locate trees or shrubs on or near the drainfield since roots may eventuallydamage and block the distribution lines. Heavy traffic over the drainfield should be avoided.
Cleaning - It is advisable to have the septic tank pumped and cleaned every 3 to 6 years. Contact your local HealthDepartment for recommendations concerning maintenance, cleaning, or any alterations on any part of the septicdrainfield system.
Soil water use
A yearly water budget diagram offers a way to show where soil water is being utilized (depleted) and where soilwater is being recharged. The diagram (Figure 2) shows an average water budget for three climatic recordingstations in eastern Virginia. The left vertical scale is in inches of water. The bars show the difference between

74 Soils of Virginia
Agronomy Handbook Virginia Cooperative Extension
precipitation (P) and water usage (ET). Evapotranspiration (ET) is the total of water loss from the soil (evapora-tion) and the water used or lost from plants (transpiration). A positive number indicates there was an excess insoil water for that month. For months where the average precipitation (P) was less than usage (ET) the number onthe left vertical scale is negative. This indicates the soil must have the capacity to supply stored water in order forplants to continue to grow at the maximum rate.
Thus for summer months (mid point of the growing season) there was a deficit for each of the months of June,July, August, and September. The soil has to hold this total amount of water for continued plant growth. The bestsoils will store about seven inches of water in the upper three feet of soil. This would be enough to make up forthe expected water deficit in a climatic setting described by the water budget diagram in (Figure 2).
Soil water recharge
In Virginia, the normal climatic pattern has periods of water excess (where ET is less than P) and this is during theperiod of October to May. This excess precipitation over ET, will recharge the soil with water, month by month,until the soil is fully recharged. The data indicate this recharge would be complete sometime in January of thefollowing year. Now the soil is fully recharged.
Leaching
After recharge is complete, before the growing season starts, the soil will have excess water. At this point, whenprecipitation events occur, excess water will: 1) run off the soil surface, promoting erosion, or 2) push existingsoil water through the soil, causing leaching and percolation losses. This is the time most likely for nitrogen andother chemicals to enter ground waters. This will continue until the growing season begins and plant use of waterincreases. Maximum leaching and maximum runoff will occur on average during this period when the soil isrecharged and before plants begin to use it in the early growing season. This leaching potential will continue untilabout June, where once again, the soil will give up stored water to maintain maximum growth potential for thecrop. Thus to minimize leaching, applications of nitrogen or other soluble fertilizers should be applied as near toplanting time as practical and/or added in split applications over the growing season.
Figure 2
Note: Evapotranspiration (ET) is the total of water loss from the soil (evaporation) and the water usedor lost from plants (transpiration).
-1
0
1
2
3
4
5
6
7
-2
-3
Jan Feb Mar Apr May Jun Jul Aug Sep Oct Nov Dec
Water
ET
Precipitation
- -
Inches of water
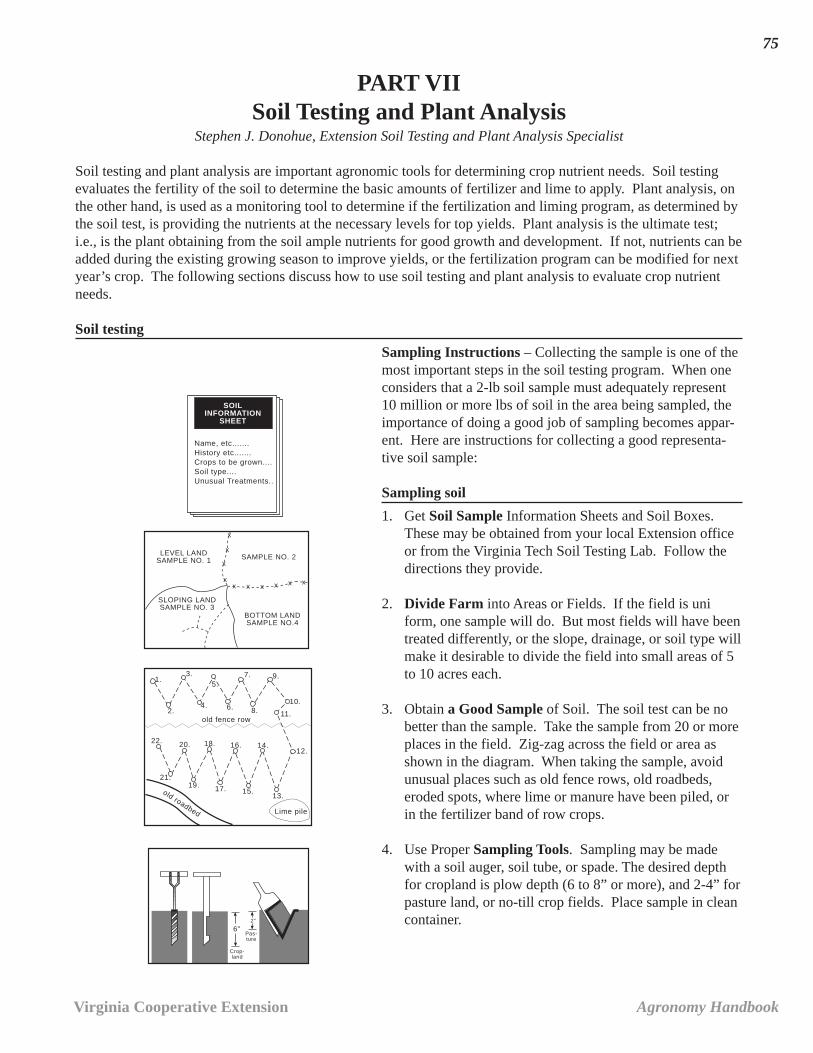
Soil Testing & Plant Analysis 75
Virginia Cooperative Extension Agronomy Handbook
PART VIISoil Testing and Plant Analysis
Stephen J. Donohue, Extension Soil Testing and Plant Analysis Specialist
Soil testing and plant analysis are important agronomic tools for determining crop nutrient needs. Soil testingevaluates the fertility of the soil to determine the basic amounts of fertilizer and lime to apply. Plant analysis, onthe other hand, is used as a monitoring tool to determine if the fertilization and liming program, as determined bythe soil test, is providing the nutrients at the necessary levels for top yields. Plant analysis is the ultimate test;i.e., is the plant obtaining from the soil ample nutrients for good growth and development. If not, nutrients can beadded during the existing growing season to improve yields, or the fertilization program can be modified for nextyear’s crop. The following sections discuss how to use soil testing and plant analysis to evaluate crop nutrientneeds.
Soil testing
Sampling Instructions – Collecting the sample is one of themost important steps in the soil testing program. When oneconsiders that a 2-lb soil sample must adequately represent10 million or more lbs of soil in the area being sampled, theimportance of doing a good job of sampling becomes appar-ent. Here are instructions for collecting a good representa-tive soil sample:
Sampling soil
1. Get Soil Sample Information Sheets and Soil Boxes.These may be obtained from your local Extension officeor from the Virginia Tech Soil Testing Lab. Follow thedirections they provide.
2. Divide Farm into Areas or Fields. If the field is uniform, one sample will do. But most fields will have beentreated differently, or the slope, drainage, or soil type willmake it desirable to divide the field into small areas of 5to 10 acres each.
3. Obtain a Good Sample of Soil. The soil test can be nobetter than the sample. Take the sample from 20 or moreplaces in the field. Zig-zag across the field or area asshown in the diagram. When taking the sample, avoidunusual places such as old fence rows, old roadbeds,eroded spots, where lime or manure have been piled, orin the fertilizer band of row crops.
4. Use Proper Sampling Tools. Sampling may be madewith a soil auger, soil tube, or spade. The desired depthfor cropland is plow depth (6 to 8” or more), and 2-4” forpasture land, or no-till crop fields. Place sample in cleancontainer.
Name, etc.......History etc.......Crops to be grown....Soil type....Unusual Treatments..
SOILINFORMATION
SHEET
LEVEL LANDSAMPLE NO. 1 SAMPLE NO. 2
SLOPING LANDSAMPLE NO. 3
BOTTOM LANDSAMPLE NO.4
x
x
x
xx x x x x x
old roadbed
old fence row
1.
2.
3.
4.
5.
6.
7.
8.
9.
10.
11.
12.
13.
14.
15.
16.
17.
18.
19.
20.
21.
22.
Lime pile
6”
Crop-land
2”
Pas-ture
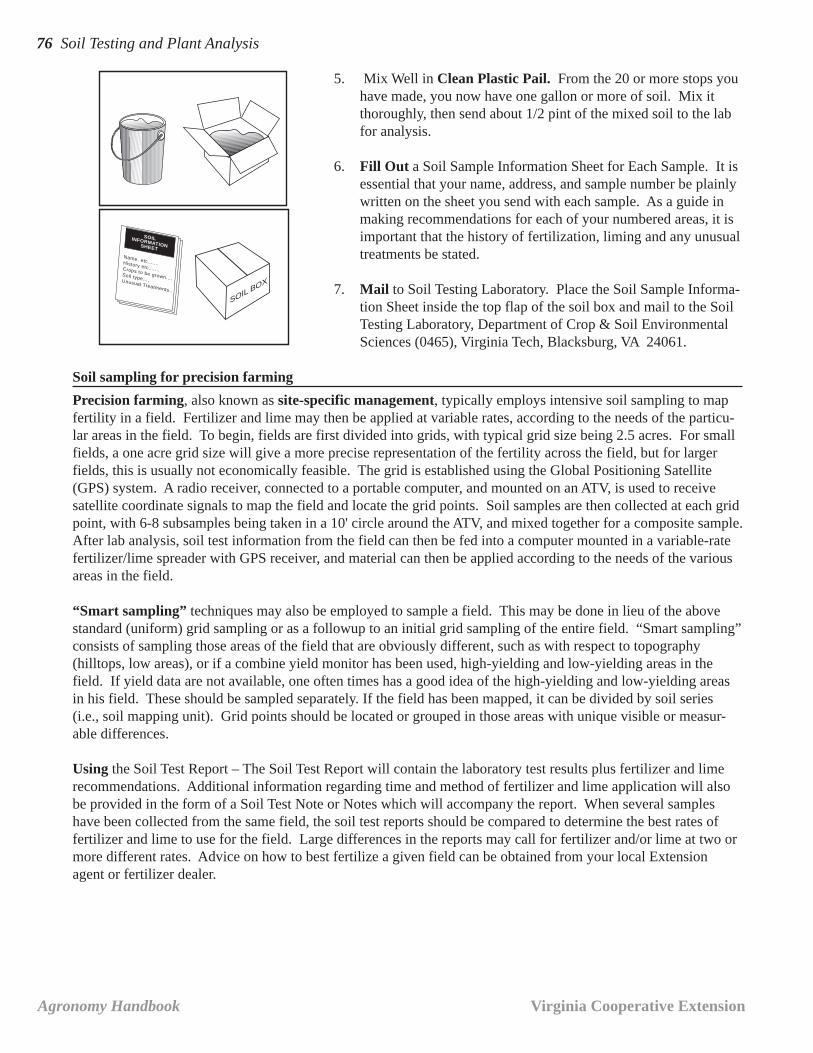
76 Soil Testing and Plant Analysis
Agronomy Handbook Virginia Cooperative Extension
SOIL BOX
Name, etc.......History etc.......Crops to be grown....Soil type....Unusual Treatments..
SOILINFORMATIONSHEET
5. Mix Well in Clean Plastic Pail. From the 20 or more stops youhave made, you now have one gallon or more of soil. Mix itthoroughly, then send about 1/2 pint of the mixed soil to the labfor analysis.
6. Fill Out a Soil Sample Information Sheet for Each Sample. It isessential that your name, address, and sample number be plainlywritten on the sheet you send with each sample. As a guide inmaking recommendations for each of your numbered areas, it isimportant that the history of fertilization, liming and any unusualtreatments be stated.
7. Mail to Soil Testing Laboratory. Place the Soil Sample Informa-tion Sheet inside the top flap of the soil box and mail to the SoilTesting Laboratory, Department of Crop & Soil EnvironmentalSciences (0465), Virginia Tech, Blacksburg, VA 24061.
Soil sampling for precision farming
Precision farming, also known as site-specific management, typically employs intensive soil sampling to mapfertility in a field. Fertilizer and lime may then be applied at variable rates, according to the needs of the particu-lar areas in the field. To begin, fields are first divided into grids, with typical grid size being 2.5 acres. For smallfields, a one acre grid size will give a more precise representation of the fertility across the field, but for largerfields, this is usually not economically feasible. The grid is established using the Global Positioning Satellite(GPS) system. A radio receiver, connected to a portable computer, and mounted on an ATV, is used to receivesatellite coordinate signals to map the field and locate the grid points. Soil samples are then collected at each gridpoint, with 6-8 subsamples being taken in a 10' circle around the ATV, and mixed together for a composite sample.After lab analysis, soil test information from the field can then be fed into a computer mounted in a variable-ratefertilizer/lime spreader with GPS receiver, and material can then be applied according to the needs of the variousareas in the field.
“Smart sampling” techniques may also be employed to sample a field. This may be done in lieu of the abovestandard (uniform) grid sampling or as a followup to an initial grid sampling of the entire field. “Smart sampling”consists of sampling those areas of the field that are obviously different, such as with respect to topography(hilltops, low areas), or if a combine yield monitor has been used, high-yielding and low-yielding areas in thefield. If yield data are not available, one often times has a good idea of the high-yielding and low-yielding areasin his field. These should be sampled separately. If the field has been mapped, it can be divided by soil series(i.e., soil mapping unit). Grid points should be located or grouped in those areas with unique visible or measur-able differences.
Using the Soil Test Report – The Soil Test Report will contain the laboratory test results plus fertilizer and limerecommendations. Additional information regarding time and method of fertilizer and lime application will alsobe provided in the form of a Soil Test Note or Notes which will accompany the report. When several sampleshave been collected from the same field, the soil test reports should be compared to determine the best rates offertilizer and lime to use for the field. Large differences in the reports may call for fertilizer and/or lime at two ormore different rates. Advice on how to best fertilize a given field can be obtained from your local Extensionagent or fertilizer dealer.

Soil Testing & Plant Analysis 77
Virginia Cooperative Extension Agronomy Handbook
Plant Analysis
Sampling Instructions
1. Avoid submitting sample tissue that is contaminated with dust or soil. If tissue is dusty or dirty, remove asmuch of it as you can by shaking, brushing, or washing the tissue in gently-flowing water.
2. Do not sample disease, insect, or mechanically damaged plant tissue.3. Place the plant tissue in a clean paper bag. Do not use plastic bags. If the sample is wet or succulent, let it
air-dry in the open for one day before sending it to the laboratory. Identify each sample by number and cropname.
4. When using tissue analysis in the diagnosis of crop productions problems, take one sample from the problemarea in the field and one from an area where plants appear normal.
5. When sampling, both the time (growth stage) and plant part collected are important. Be sure to sample atthe recommended time and collect the proper plant part.
6. If you do not have specific sampling instructions for the crop you wish to have analyzed, a good rule ofthumb is to sample mature leaves that are representative of the current season’s growth during the mid periodof the growth cycle or just prior to seed set.
7. Submit samples to recommended labs for testing. Virginia Tech does not run tissue analysis.
Interpreting the Laboratory Results – The Plant Analysis Report will contain the tissue test results plus theoptimum nutrient ranges for the crop sample. Note whether levels are deficient, borderline, or adequate for goodcrop growth. Also, make comparisons in soil nutrient levels between problem versus normal areas, noting anydifferences and whether they are small or large. Depending on what nutrient or nutrients are deficient and thestage of growth of the crop, it may or may not be worthwhile making additional fertilizer applications for thepresent crop. If trace element deficiency is noted and it is early enough in the growing season, a foliar applicationof the trace element can be applied to correct the problem. Following harvest, a more lasting soil application canbe made for the next crop in the rotation. If low magnesium and phosphorus plant tissue levels are observed andthe corresponding Soil Test Report indicates that the pH is low, it may not be possible to correct the problem forthe present crop. Lime needs to be in the root zone to correct the problem and this can be a difficult thing to do ifit is not possible to till the lime into the soil. However, remedial action can and should be taken to ensure that theproblem does not arise in future crops. The actual treatment needed will depend on the nature and severity of theproblem and the economics involved. In most cases, it is usually worth the cost and effort to correct the problem.
Table 1. Sampling Instructions for Field Crops
Crop Time Plant Part to Sample No. of Plants to Sample
Alfalfa Early bloom Top 4-6” of plant 30Bermudagrass Optimum time for maximum quality hay Upper half of plant 50Corn Prior to 4th leaf stage Whole plant, cutting at ground level 30
Prior to tasseling Entire leaf immediately below whorl, 20removing at stalk
At silk when silks are still green Entire ear leaf, removing at stalk 20Cotton At full bloom Youngest recently mature leaves on 25
main stem, collecting 2 leaves per plantPeanut At bloom stage Last fully mature leaves at top of the 25
plant, collecting 3 leaves per plantSmall Grains Prior to jointing Whole plant above ground, 50
remove dead leavesJointing to heading Uppermost fully developed leaf 50
Soybeans Prior to or at initial bloom Uppermost fully developedtrifoliate leaf set (composed of 3 leaflets)per plant. Remove leaf stem (petiole) 25
Tobacco Prior to or at bloom Entire 4th leaf from the top of the plant 15
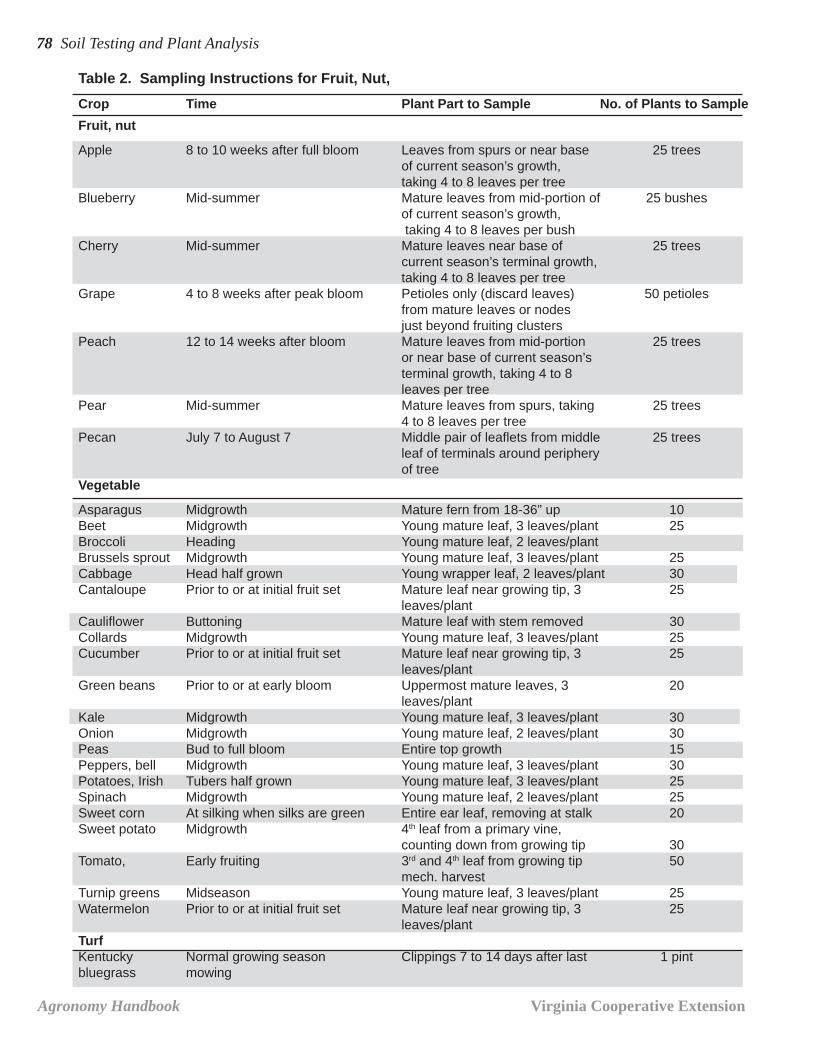
78 Soil Testing and Plant Analysis
Agronomy Handbook Virginia Cooperative Extension
Table 2. Sampling Instructions for Fruit, Nut,
Crop Time Plant Part to Sample No. of Plants to Sample
Fruit, nut
Apple 8 to 10 weeks after full bloom Leaves from spurs or near base 25 treesof current season’s growth,taking 4 to 8 leaves per tree
Blueberry Mid-summer Mature leaves from mid-portion of 25 bushesof current season’s growth, taking 4 to 8 leaves per bush
Cherry Mid-summer Mature leaves near base of 25 treescurrent season’s terminal growth,taking 4 to 8 leaves per tree
Grape 4 to 8 weeks after peak bloom Petioles only (discard leaves) 50 petiolesfrom mature leaves or nodesjust beyond fruiting clusters
Peach 12 to 14 weeks after bloom Mature leaves from mid-portion 25 treesor near base of current season’sterminal growth, taking 4 to 8leaves per tree
Pear Mid-summer Mature leaves from spurs, taking 25 trees4 to 8 leaves per tree
Pecan July 7 to August 7 Middle pair of leaflets from middle 25 treesleaf of terminals around peripheryof tree
Vegetable
Asparagus Midgrowth Mature fern from 18-36” up 10Beet Midgrowth Young mature leaf, 3 leaves/plant 25Broccoli Heading Young mature leaf, 2 leaves/plantBrussels sprout Midgrowth Young mature leaf, 3 leaves/plant 25Cabbage Head half grown Young wrapper leaf, 2 leaves/plant 30Cantaloupe Prior to or at initial fruit set Mature leaf near growing tip, 3 25
leaves/plantCauliflower Buttoning Mature leaf with stem removed 30Collards Midgrowth Young mature leaf, 3 leaves/plant 25Cucumber Prior to or at initial fruit set Mature leaf near growing tip, 3 25
leaves/plantGreen beans Prior to or at early bloom Uppermost mature leaves, 3 20
leaves/plantKale Midgrowth Young mature leaf, 3 leaves/plant 30Onion Midgrowth Young mature leaf, 2 leaves/plant 30Peas Bud to full bloom Entire top growth 15Peppers, bell Midgrowth Young mature leaf, 3 leaves/plant 30Potatoes, Irish Tubers half grown Young mature leaf, 3 leaves/plant 25Spinach Midgrowth Young mature leaf, 2 leaves/plant 25Sweet corn At silking when silks are green Entire ear leaf, removing at stalk 20Sweet potato Midgrowth 4th leaf from a primary vine,
counting down from growing tip 30Tomato, Early fruiting 3rd and 4th leaf from growing tip 50
mech. harvestTurnip greens Midseason Young mature leaf, 3 leaves/plant 25Watermelon Prior to or at initial fruit set Mature leaf near growing tip, 3 25
leaves/plantTurfKentucky Normal growing season Clippings 7 to 14 days after last 1 pintbluegrass mowing

Soil Testing & Plant Analysis 79
Virginia Cooperative Extension Agronomy HandbookTabl
e 3.
Pla
nt N
utrie
nt S
uffic
ienc
y R
ange
s fo
r F
ield
, For
age,
Fru
it, a
nd N
ut C
rops
*
Cro
p**
N
P
K
Ca
M
g
Mn
F
e
B
Cu
Z
n M
o—
——
——
——
——
——
——
——
%—
——
——
——
——
——
——
——
——
——
——
——
——
——
——
ppm
——
——
——
——
——
——
—F
ield
, For
age
Alfa
lfa4.
50-5
.00
0.35
2.20
0.80
0.40
2530
157
150.
5
Ber
mud
agra
ss2.
00-3
.00
0.20
-0.5
01.
50-2
.50
0.25
-0.7
50.
15-0
.50
50-2
5050
-300
5-20
6-20
20-5
0-
Cor
n-up
3.50
-5.0
00.
30-0
.50
3.00
-4.0
00.
30-0
.70
0.20
-0.6
030
-300
50-2
504-
253-
2020
-60
0.2
to 1
2” ta
ll
Cor
n-ea
r3.
00-3
.50
0.25
-0.4
52.
00-2
.75
0.25
-0.8
00.
20-0
.50
30-2
0050
-300
3-20
3-20
20-6
00.
2le
af a
t silk
or
leaf
bel
ow w
horl
Cot
ton
3.50
-4.5
00.
30-0
.50
2.00
-3.0
02.
25-3
.00
0.50
-0.9
050
-350
50-2
5020
-60
8-20
20-6
0—
Pea
nut
3.50
-4.5
00.
25-0
.50
2.00
-3.0
01.
25-2
.00
0.30
-0.8
050
-350
50-3
0025
-60
-20
-50
0.5
Sm
all g
rain
s4.
00-5
.00
0.20
-0.4
01.
50-3
.00
0.20
-0.5
00.
15-0
.50
25-1
0025
-100
3-20
5-25
20-7
0—
Soy
bean
s4.
25-5
.00
0.30
-0.5
01.
75-2
.50
0.50
-1.5
00.
25-0
.80
20-2
0050
-300
25-6
06-
3020
-50
0.5
Toba
cco
3.50
-4.2
50.
25-0
.50
2.50
-3.2
01.
50-3
.50
0.20
-0.6
530
-250
50-2
0020
-50
15-6
020
-80
—
Fru
it, N
utA
pple
2.00
-3.0
00.
15-0
.50
1.25
-3.0
01.
00-2
.00
0.20
-0.5
020
-200
50-4
0020
-60
5-20
15-5
0—
Blu
eber
ry1.
80-2
.00
0.10
-0.2
00.
40-0
.60
0.30
-0.7
50.
20-0
.30
20-2
0060
-150
10-5
010
-20
10-5
0—
Che
rry
2.00
-3.0
00.
15-0
.50
1.25
-2.5
01.
50-2
.50
0.20
-0.5
020
-200
50-4
0020
-60
5-20
15-5
0—
Gra
pe0.
80-1
.00
0.20
-0.5
01.
50-2
.50
1.75
0.40
-0.8
030
-200
3040
-60
5-20
20-5
0—
Pea
ch2.
75-3
.50
0.25
-0.5
01.
20-2
.50
1.50
-2.5
00.
20-0
.50
20-2
0060
-400
20-1
005-
2015
-50
—
Pea
r2.
20-3
.00
0.15
-0.5
01.
00-3
.00
1.00
-2.0
00.
20-0
.50
20-2
0050
-400
20-6
05-
2015
-50
—
Pec
an2.
50-3
.90
0.12
-0.3
01.
00-1
.50
0.70
-1.5
00.
30-0
.60
100-
800
50-3
0020
-45
10-3
050
-100
—
*In
gene
ral,
if le
af c
ompo
sitio
n is
less
than
the
low
er v
alue
, yie
lds
may
be
redu
ced
and
defic
ienc
y sy
mpt
oms
may
be
visi
ble.
Whe
n le
af c
ompo
sitio
n va
lues
are
grea
ter
than
the
uppe
r va
lue,
in s
ome
case
s yi
elds
may
be
redu
ced
and
toxi
city
sym
ptom
s m
ay b
e vi
sibl
e. I
t sho
uld
be n
oted
that
tem
pera
ture
, moi
stur
e, a
ndot
her
fact
ors
also
influ
ence
pla
nt n
utrie
nt le
vels
and
som
etim
es m
ake
the
inte
rpre
tatio
n of
res
ults
diff
icul
t. W
here
pos
sibl
e, ti
ssue
ana
lysi
s re
sults
sho
uld
beco
mpa
red
betw
een
prob
lem
and
nor
mal
gro
wth
are
as a
nd a
lso
com
pare
d w
ith s
oil t
est r
esul
ts b
efor
e a
diag
nosi
s is
mad
e. I
nfor
mat
ion
on c
rop
man
agem
ent
(pla
ntin
g tim
e, d
epth
, etc
.) s
houl
d al
so b
e in
clud
ed in
the
diag
nosi
s.**
Suf
ficie
ncy
rang
es a
re o
nly
appl
icab
le to
the
plan
t par
t and
tim
e of
sam
plin
g sp
ecifi
ed in
Tab
les
1 an
d 2.
The
se v
alue
s do
not
app
ly to
oth
er p
lant
part
s or
tim
es o
f sam
plin
g.

80 Soil Testing and Plant Analysis
Agronomy Handbook Virginia Cooperative Extension
Tabl
e 4.
Com
mon
Pla
nt N
utrie
nt R
ange
s F
ound
in V
eget
able
Cro
ps a
nd T
urf
Cro
p*
N
P
K
Ca
Mg
M
n
Fe
B
Cu
Zn
Veg
etab
le—
——
——
——
——
——
——
—%
——
——
——
——
——
——
——
——
——
——
—pp
m—
——
——
——
——
——
Asp
arag
us2.
4-3.
80.
30-0
.35
1.5-
2.4
0.40
-0.5
00.
15-0
.20
10-1
60-
50-1
00-
20-6
0
Bee
t3.
5-5.
00.
20-0
.30
2.0-
4.0
2.5-
3.5
0.30
-0.8
070
-200
-60
-80
-15
-30
Bro
ccol
i3.
2-5.
50.
30-0
.70
2.0-
4.0
1.2-
2.5
0.23
-0.4
025
-150
100-
300
30-1
001-
545
-95
Bru
ssel
s sp
rout
2.2-
4.2
0.26
-0.4
52.
4-3.
40.
3-2.
20.
23-0
.40
--
30-4
0-
-
Cab
bage
3.0-
4.0
0.30
-0.5
03.
0-4.
01.
5-3.
50.
25-0
.45
-30
-60
30-6
0-
20-3
0
Can
talo
upe
2.0-
3.0
0.25
-0.4
01.
8-2.
55.
0-7.
01.
0-1.
5-
-30
-80
-30
-50
Cau
liflo
wer
3.0-
4.5
0.54
-0.7
23.
0-3.
70.
72-0
.79
0.24
-0.2
6-
--
-43
-59
Col
lard
s4.
0-5.
00.
30-0
.60
3.0-
4.0
3.0-
4.0
--
-50
-80
--
Cuc
umbe
r-
--
--
--
50-8
0-
20-4
0
Gre
en b
eans
3.0-
6.0
0.25
-0.5
01.
8-2.
50.
8-3.
00.
25-0
.70
30-3
0030
0-45
040
-60
15-3
030
-60
Kal
e4.
0-5.
00.
30-0
.60
3.0-
4.0
3.0-
4.0
--
-50
-80
--
Oni
on1.
5-2.
50.
25-0
.40
--
--
-30
-45
-10
-15
Pea
s3.
1-3.
60.
30-0
.35
2.2-
2.8
1.2-
1.5
0.27
-0.3
5-
-20
-60
--
Pep
pers
, bel
l3.
0-4.
50.
30-0
.70
4.0-
5.4
0.4-
0.6
1.0-
1.7
--
40-1
0010
-20
-
Pot
atoe
s, Ir
ish
3.0-
5.0
0.20
-0.4
04.
0-8.
02.
0-4.
00.
5-0.
830
-50
70-1
5030
-40
-20
-40
Spi
nach
4.0-
6.0
0.30
-0.5
03.
0-4.
00.
6-1.
01.
6-1.
830
-60
220-
245
40-6
05-
750
-75
Sw
eet c
orn-
ear
2.6-
3.5
0.20
-0.3
01.
8-2.
50.
15-0
.30
0.20
-0.3
0-
-20
-30
--
leaf
at s
ilk
Sw
eet p
otat
o3.
2-4.
20.
20-0
.30
2.9-
4.3
0.75
-0.9
50.
40-0
.80
40-1
00-
--
-
Tom
ato,
mec
h.
harv
est
3.0-
6.0
0.50
-0.8
02.
5-4.
00.
6-0.
960
-100
-40
-80
4-8
15-3
0
Turn
ip g
reen
s3.
5-4.
50.
35-0
.60
-3.
0-5.
0-
60-8
0-
30-6
0-
-
Wat
erm
elon
2.0-
3.0
0.20
-0.3
02.
5-3.
52.
5-3.
50.
6-0.
8-
--
4-8
-
Turf
KY
blu
egra
ss2.
2-3.
80.
30-0
.55
1.8-
3.0
0.75
-1.3
50.
25-0
.50
150-
400
100-
200
10-3
010
-20
35-4
5
*Nut
rient
ran
ges
appl
y on
ly to
the
plan
t par
t and
tim
e of
sam
plin
g sp
ecifi
ed in
Tab
le 2
. T
hese
val
ues
do n
ot a
pply
to o
ther
pla
nt p
arts
or
times
of s
ampl
ing.

Soil Testing & Plant Analysis 81
Virginia Cooperative Extension Agronomy Handbook
Nutrient Removal By Crops
Crop Plant part Acre yield N P as P 2O5 K as K 2O Ca Mg S Cu Mn Zn———————————————————————————lbs——————————————————Row CropsBarley grain 80 bu 70 30 20 2 4 6 0.06 0.06 0.12Barley straw 2 ton 30 10 60 16 4 8 0.02 0.64 0.10
Total 100 40 80 18 8 14 0.08 0.70 0.22Corn grain 150 bu 135 53 40 2 8 10 0.06 0.09 0.15Corn stover 4.5 tons 100 37 145 26 20 14 0.05 1.50 0.30
Total 235 90 185 28 28 24 0.11 1.59 0.45Cotton seed and lint 1500 lbs 40 20 15 2 4 3 0.06 0.11 0.32Cotton stalks, leaves 2000 lbs 35 10 35 28 8 15 - - -
Total 75 30 50 30 12 18Oats grain 80 bu 50 20 15 2 3 5 0.03 0.12 0.05Oats straw 2 tons 25 15 80 8 8 9 0.03 - 0.29
Total 75 35 95 10 11 14 0.06 - 0.34Peanuts nuts 1.25 tons 90 10 15 1 3 6 0.02 0.01 -Peanuts vines 4500 lbs 105 25 95 - - - - - -
Total 195 35 110Sorghum grain 60 bu 50 25 15 4 5 5 0.01 0.04 0.04Sorghum stover 3 tons 65 20 95 29 18 - - - -
Total 115 45 110 33 23 - - - -Soybeans grain 40 bu 150 35 57 7 7 4 0.04 0.05 0.04Soybeans straw 30 10 25 - - - - - -
Total 180 45 80Tobacco leaves 2000 lbs 75 15 120 75 18 14 0.03 0.55 0.07Tobacco stalks 35 15 50 - - - - - -
Total 110 30 170Wheat grain 80 bu 100 45 49 2 16 8 0.06 0.18 0.28Wheat straw 2.0 tons 34 9 113 12 8 12 0.02 0.32 0.10
Total 134 54 162 14 24 20 0.08 0.50 0.38
HayAlfalfa 4 tons 180 40 180 112 12 19 0.06 0.44 0.42Bluegrass 2 tons 60 20 60 16 7 5 0.02 0.30 0.08Coastal bermudagrass 8 tons 300 70 270 59 24 35 0.21 - -Red clover 2.5 tons 100 25 100 69 17 7 0.04 0.54 0.36Soybean 2 tons 90 20 50 40 18 10 0.04 0.46 0.15Timothy 2.5 tons 60 25 95 18 6 5 0.03 0.31 0.20
Fruits, VegetablesApples 500 bu 30 10 45 8 5 10 0.03 0.03 0.03Cabbage 20 tons 130 35 130 20 8 44 0.04 0.10 0.08Grapes fruit 5 tons 15 10 25 - - - - - -Grapes leaves & wood 20 5 20 - - - - - -
Total 35 15 45 - - - - - -Muskmelon fruit 7 tons 30 11 60 - - - - - -Muskmelon vines 1.5 tons 20 5 30 - - - - - -
Total 50 15 90 - - - - - -Peaches 600 bu 35 20 65 4 8 2 - - 0.01Potatoes tubers 400 bu 80 30 150 3 6 6 0.04 0.09 0.05Sweet roots 300 bu 45 15 75 4 9 6 0.03 0.06 0.03potatoesTomatoes fruit 20 tons 120 40 160 7 11 14 0.07 0.13 0.16

82 Soil Testing and Plant Analysis
Agronomy Handbook Virginia Cooperative Extension
General Crop Nutrient Deficiency Symptoms
Nutrient Deficiency Symptoms*Nitrogen (N) Restricted growth of tops and roots; growth upright and spindly; leaves pale and yellowish-
green in early stages, more yellow and even orange or red in later stages; deficiency shows upfirst on lower leaves.
Phosphorus (P) Restricted growth of tops and roots; growth is upright and spindly; leaves bluish-green inearly stages with green color sometimes darker than plants supplied with adequate phospho-rus; more purplish in later stages with occasional browning of leaf margins; defoliation ispremature, starting at the older leaves.
Potassium (K) Browning of leaf tips; marginal scorching of leaf edges; development of brown or lightcolored spots in some species which is usually more numerous near the margins; deficiencyshows up first on lower foliage.
Calcium (Ca) Deficiency occurs mainly in younger leaves near the growing point; younger leaves distortedwith tips hooked back and margins curled backward or forward; leaf margins may be irregu-lar and display brown scorching or spotting.
Magnesium (Mg) Interveinal chlorosis with chlorotic areas separated by green tissue in earlier stages giving abeaded streaking effect; deficiency occurs first on lower foliage.
Sulfur (S) Younger foliage is pale yellowish-green, similar to nitrogen deficiency; shoot growth some-what restricted.
Zinc (Zn) Interveinal chlorosis followed by die back of chlorotic areas.
Manganese (Mn) Light green to yellow leaves with distinctly green veins; in severe cases, brown spots appearon the leaves and the leaves are shed; usually begins with younger leaves.
Boron (B) Growing points severely affected; stems and leaves may show considerable distortion; upperleaves are often yellowish red and may be scorched or curled.
Copper (Cu) Younger leaves become pale green with some marginal chlorosis.
Iron (Fe) Interveinal chlorosis of younger leaves.
Molybdenum (Mo) Leaves become chlorotic, developing rolled or cupped margins; plants deficient in thiselement often become nitrogen deficient.
Chlorine (Cl) Deficiency not observed under field conditions.
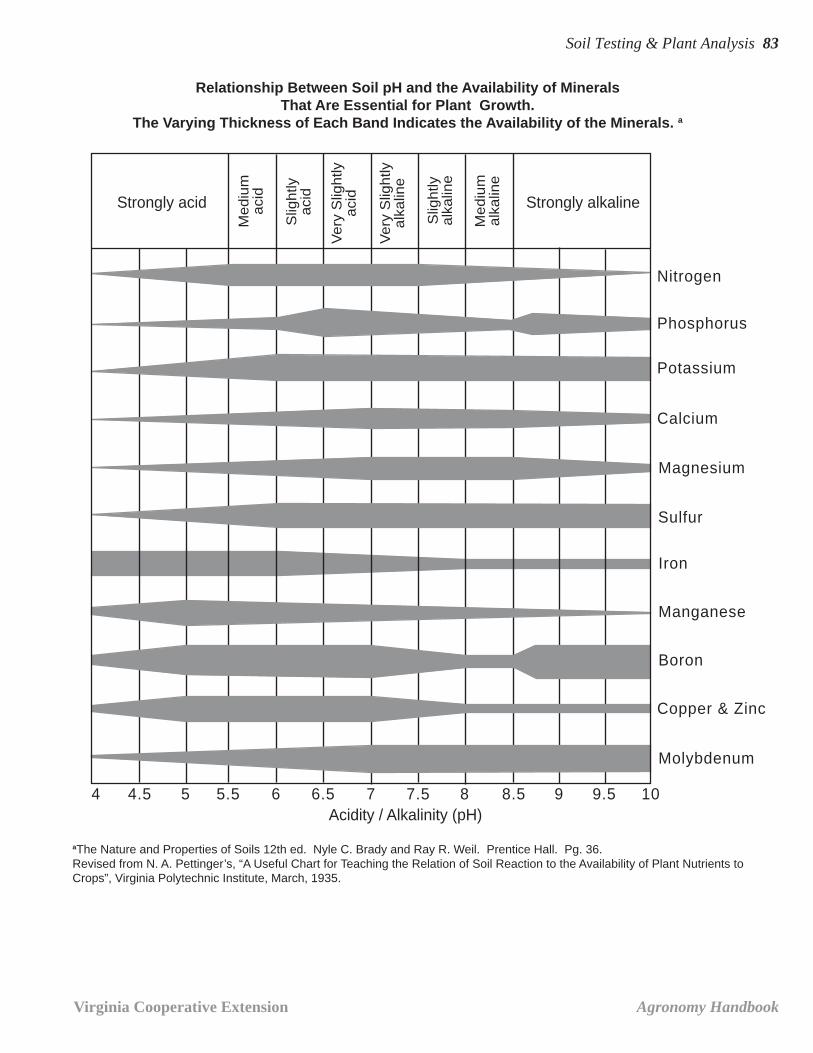
Soil Testing & Plant Analysis 83
Virginia Cooperative Extension Agronomy Handbook
Relationship Between Soil pH and the Availability of MineralsThat Are Essential for Plant Growth.
The Varying Thickness of Each Band Indicates the Availability of the Minerals. a
aThe Nature and Properties of Soils 12th ed. Nyle C. Brady and Ray R. Weil. Prentice Hall. Pg. 36.Revised from N. A. Pettinger’s, “A Useful Chart for Teaching the Relation of Soil Reaction to the Availability of Plant Nutrients toCrops”, Virginia Polytechnic Institute, March, 1935.
Nitrogen
Phosphorus
Potassium
Calcium
Magnesium
Sulfur
Iron
Manganese
Boron
Copper & Zinc
Molybdenum
4 4.5 5 5.5 6 6.5 7 7.5 8 8.5 9 9.5 10
Strongly alkalineStrongly acid
Me
diu
ma
cid
Slig
htly
aci
d
Ve
ry S
ligh
tlya
cid
Me
diu
ma
lka
line
Ve
ry S
ligh
tlya
lka
line
Slig
htly
alk
alin
e
Acidity / Alkalinity (pH)

84 Soil Testing and Plant Analysis
Agronomy Handbook Virginia Cooperative Extension
Soil Testing Lab Conversion Factors
Periodically we in Extension receive requests for information on interpretation of soil test results from labora-tories which use procedures that are different than ours. Very simply, different procedures usually extract differ-ent amounts of nutrients from the soil. However, any good soil testing procedure, when properly correlated withplant growth, can be used as a basis for making fertilizer recommendations. In the Virginia Tech Soil TestingLaboratory, we use the Mehlich 1 (0.05N HCl + 0.025N H
2SO
4) soil test procedure to extract both phosphorus and
potassium since we have done considerable research to correlate test results obtained by this method with plantgrowth. Other procedures, however, may extract more or less nutrients than the Mehlich 1 procedure does, andtherefore, values obtained by these other methods cannot be used directly to make fertilizer recommendations.They must first be converted to equivalent Virginia Tech test levels.
The following are conversion factors for converting private and other state lab phosphorus and potassium testresults to Virginia Tech test values. The conversion factors are approximate values only and they vary dependingon soil type, type of clay, past fertilization, etc. However, they should put one in the “ballpark” with respect toVirginia Tech test levels.
1. Converting Bray P1 (Weak Bray) Phosphorus to Virginia Tech Mehlich 1 Phosphorus
pH < 5.6 Weak Bray P, ppm x 0.6 = Virginia Tech P, ppmWeak Bray P, ppm x 1.2 = Virginia Tech P, lb/A
pH 5.6 – 6.2 Weak Bray P, ppm x 0.7 = Virginia Tech P, ppmWeak Bray P, ppm x 1.4 = Virginia Tech P, lb/A
pH 6.3 – 6.9 Weak Bray P, ppm x 0.8 = Virginia Tech P, ppmWeak Bray P, ppm x 1.6 = Virginia Tech P, lb/A
pH > 6.9 Weak Bray P, ppm x 1.2 = Virginia Tech P, ppmWeak Bray P, ppm x 2.4 = Virginia Tech P, lb/A
2. Converting Ammonium Acetate Potassium to Virginia Tech Mehlich 1 Potassium
Ammonium Acetate K, ppm x 0.67 = Virginia Tech K, ppm
Ammonium Acetate K, ppm x 1.33 = Virginia Tech K, lb/A
3. Converting Mehlich 3 Phosphorus to Virginia Tech Mehlich 1 Phosphorus
Preliminary research indicates that, for Mid-Atlantic soils, the Mehlich 3 phosphorus procedure extracts approxi-mately the same amount of phosphorus as the Bray P
1 (Weak Bray) procedure. Therefore, use the same conver-
sion factor as given for Bray P1 to convert Mehlich 3 phosphorus to Virginia Tech phosphorus.
4. Converting Mehlich 3 Potassium to Virginia Tech Mehlich 1 Potassium
Preliminary research indicates that, for Mid-Atlantic soils, the Mehlich 3 potassium procedure extracts approxi-mately the same amount of potassium as the ammonium acetate procedure. Therefore, use the same conversionfactor as given for ammonium acetate to convert Mehlich 3 potassium to Virginia Tech potassium.

Soil Testing & Plant Analysis 85
Virginia Cooperative Extension Agronomy Handbook
5. Calibration of Phosphorus (P) and Potassium (K) Tests, Virginia Tech Soil Testing Laboratory
Soil Test P lb/A P-ppm
L- 0-3 0-2L 4-8 2-4
L+ 9-11 5-6M- 12-20 6-10M 21-30 11-15
M+ 31-35 16-18H- 36-55 18-28H 56-85 28-43
H+ 86-110 43-55VH 110+ 55+
Soil Test K lb/A K-ppm
- 0-15 0-8L 16-55 8-28+ 56-75 28-38
M- 76-100 38-50M 101-150 51-75
M+ 151-175 76-88H- 176-210 88-105H 211-280 106-140
H+ 281-310 141-155VH 310+ 155+
6. Other Useful Conversion Factors
P x 2.3 = P2O5
P2O5 x 0.44 = PK x 1.2 = K2OK2O x 0.83 = Kppm x 2.0 = lbs/Albs/A x 0.5 = ppm

86 Soil Testing and Plant Analysis
Agronomy Handbook Virginia Cooperative Extension

Fertilizers 87
Virginia Cooperative Extension Agronomy Handbook
PART VIIIFertilizers
Marcus M. Alley, Extension Soil Fertility and Crop Management Specialist
Composition of Principle Fertilizer Materials
Nitrogen (N) Phosphate (P 2O5) Potash (K 2O) Physical State
Material Supplying % % %NitrogenAmmonium nitrate 33-34 0 0 solidAnhydrous ammonia 82 0 0 gasAmmonium thiosulfate 12 - 26 liquidCalcium nitrate 15 0 0 solidSodium nitrate 16 0 0 solidUrea-ammonium nitrate 28-32 0 0 liquidAmmonium sulfate 21 0 0 solidUrea 45-46 0 0 solid
Phosphorus
Ammonium 10 34-37 0 liquid polyphosphate (APP)Diammonium 18-21 46-53 0 sold phosphate (DAP)Ground bone (raw) 2.5 to 4 20-25 0 solidGround rock phosphate 0 25-40 0 solid
(14-65% avail.)Monammonium 11-13 48-62 0 solid phosphate (MAP)Steamed bone meal 1 to 2.5 22-30 0 solidSuperphosphate, normal 0 16-22 0 solidSuperphosphate, triple 0 44-53 0 solid
Potassium
Muriate of potash 0 0 60-62 solid (potassium chloridePotassium nitrate 13 0 44 solidPotassium sulfate 0 0 50-53 solidPotassium thiosulfate - 0 25 liquidPotassium orthophosphate - 30-50Potassium magnesium sulfate 0 0 22 solid

88 Fertilizers
Agronomy Handbook Virginia Cooperative Extension
Sources of calcium, magnesium, sulfur, and micronutrientsCalcium sources
Material Chemical Formula % CaCalcitic lime CaCO3 31.7Calcium nitrate Ca(NO3)2 19.4Dolomitic lime CaCO3+MgCO3 21.5Gypsum CaSO4• 2H20 22.5Hydrated lime Ca(OH)2 46.1Marl CaCO3 24.0Superphosphate, normal Ca(H2PO4)2 20.4Superphosphate, triple Ca(H2PO4)2 13.6Sulfur sourcesMaterial Chemical Formula % SAmmonium sulfate (NH4)2SO4 24Gypsum CaSO4• 2H20 16.8K-Mg-sulfate K2SO4• 2MgSO4 22.0Sulfur, elemental S 32-33Potassium thiosulfate (NH4)2S2O3 17Ammonium thiosulfate K2S2O3 26Boron sourcesMaterial Chemical Formula % BBoron frits Frit 10-17Borax Na2B4O7• 10H2O 11Boric acid H3BO3 17Sodium pentaborate Na2B10O16• 10H2O 18Sodium tetraborateFert. borate-46 Na2B4O7•5H2O 14Fert. borate-65 Na2B4O7 20Solubor Na2B10O16• 10H2O
+ Na2B4O7• 5H2O 20Molybdenum sourcesMaterial Chemical Formula % MoAmmonium molybdate (NH4)6Mo7O24• 2H2O 54Molybdenum trioxide MoO3 66Molybdenum frit Frit 1-30Sodium molybdate Na2MoO4• 2H2O 39Copper sourcesMaterial Chemical Formula % CuCopper ammonium phosphate Cu(NH4)PO4• H2O 32Copper chelates Na2CuEDTA 13
NaCuHEDTA 9Copper frits Frit 40-50Copper sulfate CuSO4• 5H2O 25Magnesium sourcesMaterial Chemical Formula % MgDolomitic lime MgCO3+CaCO3 11.4Epsom salt MgSO4• 7H2O 9.6Magnesia MgO 55.0Potassium- magnesium sulfate K2SO4• 2MgSO4 11.2Manganese sourcesMaterial Chemical Formula % MnManganese chelate MnEDTA 12Manganese sulfate MnSO4• 4H2O 26-28Manganese frit Frit 35Manganese oxide MnO 41-68Zinc sourcesMaterial Chemical Formula % ZnZinc carbonate ZnCO3 52Zinc chelates Na2ZnEDTA 14
NaZnHEDTA 9Zinc oxide ZnO 78Zinc sulfate ZnSO4• H2O 35Iron sourcesMaterial Chemical Formula % FeIron sulfate FeSO4• 7H2O 19Iron ammonium phosphate Fe(NH4)PO4• H2O 29Iron ammonium polyphosphate Fe(NH4)HP2O7 22Iron frits Frit 30-40Iron chelates NaFeEDTA 5-14
NaFeDTPA 10NaFeEDDHA 6

Fertilizers 89
Virginia Cooperative Extension Agronomy Handbook
Conversion factors
Converting the percentage of one material to percentage of another may be done easily with a conversion factor,some of which are listed below. For example, to convert the percentage of K to K
2O, multiply the percentage of
K by 1.2051; in like manner, the percentage of K2O may be converted to K by multiplying the percentage of K
2O
by 0.8301.
K to K2O multiply K by 1.2051
K2O to K multiply K
2O by 0.8301
KCl to K multiply KCl by 0.5244
KCl to Cl multiply KCl by 0.4756
K2SO
4 to K multiply K
2SO
4by 0.4487
Mg to MgO multiply Mg by 1.6578
MgO to Mg multiply MgO by 0.6032
MgCO3 to MgO multiply MgCO
3by 0.4782
MgO to MgCO3
multiply MgO by 2.0913
MgSO4 to Mg multiply MgSO
4by 0.2020
MgCO3 to CaCO
3multiply MgCO
3by 1.1867
CaO to Ca multiply CaO by 0.7147
Ca to CaO multiply Ca by 1.3992
CaCO3 to MgCO
3multiply CaCO
3by 0.8426
CaCO3 to CaO multiply CaCO
3by 0.5603
K2SO
4 to S multiply K
2SO
4by 0.1840
CaSO4 to Ca multiply CaSO
4by 0.2938
CaSO4 to S multiply CaSO
4by 0.2350
SO4 to S multiply SO
4by 0.3339
S to SO4
multiply S by 2.9963
NaCl to Cl multiply NaCl by 0.6066
N to NH3
multiply N by 1.2158
N to KNO3
multiply N by 7.2162
NH3 to N multiply NH
3by 0.8225
N to (NH4)
2SO
4multiply N by 4.7160
(NH4)
2SO
4 to N multiply (NH
4)
2SO
4by 0.2120
(NH4)
2SO
4 to S multiply (NH
4)
2SO
4by 0.2427
N to NH4NO
3multiply N by 2.8571
NH4NO
3 to N multiply NH
4NO
3by 0.3500
P to P2O
5multiply P by 2.2910
P2O
5 to P multiply P
2O
5by 0.4365

90 Fertilizers
Agronomy Handbook Virginia Cooperative Extension

Lime 91
Virginia Cooperative Extension Agronomy Handbook
PART IX Lime
Marcus M. Alley, Extension Soil Fertility and Crop Management Specialist
Liming materials
The quality of agricultural lime is determined by its purity and fineness of grind, or mesh size. Purity affects theamount of aglime required per acre in adjusting soil pH to a given level. Mesh size affects the rate of reaction oflime in neutralizing soil acidity. For example, pulverized lime more coarse than 20 mesh has little value as anaglime material because of its very slow rate of reaction in the soil.
The calcium carbonate equivalent (CCE) of agricultural lime is directly related to its purity. Pure calcite, whichis 100 percent calcium carbonate (CaCO
3), has a CCE value of 100; whereas pure dolomite (CaCO
3•MgCO
3) has
a CCE of 108. The CCE and chemical composition of several common liming materials are shown in the follow-ing table. Equivalent amounts of different liming materials can be determined by using the neutralizing value(NV). For example, if 2 tons of calcitic lime with a CCE of 100 are recommended, and marl with a CCE of 75 isto be used, the CCE of calcitic lime (100) divided by the CCE of marl (75) times the recommended rate per acreof calcitic lime equals 2.66 tons. This is the amount of marl that would need to be applied to equal the acidneutralizing potential of two tons of calcitic lime. The lime recommendations of soil testing laboratories aregenerally based on liming materials which have a CCE of 100 and an assumed plowing depth of 6 inches. Anychanges in the CCE of liming material and/or plowing depth will necessitate a recalculation of lime requirement.
Chemical Composition and Calcium Carbonate Equivalent of Certain Liming Materials
Lime material Calcium carbonate equivalentCalcitic lime CaCO3 (pure) 100
Dolomitic lime CaCO3•MgCO3 (pure) 108
Burned lime CaO 150-175
Hydrated lime CaOH2 110-135
Marl CaCO3 70-90
Slags CaSiO3 60-90
Liming materials marketed in Virginia
Companies marketing agricultural liming materials in Virginia must be registered with the Virginia Departmentof Agriculture and Consumer Services, PO Box 1163, Richmond, VA 23209 (804-786-3511). Further, the limingmaterials sold must pass the specifications stipulated in the Virginia Agricultural Liming Materials Law.
The two types of agricultural limestone, differing in mesh screen analysis, sold in Virginia are described in thefollowing table. Mesh size is a measure of the number of openings in one square inch of screen. A 20-meshscreen contains 400 openings per square inch, whereas a 100-mesh screen contains 10,000 openings. Crushedlimestone material passing a 100-mesh screen is finer and therefore reacts with soil acidity more rapidly than 20-mesh material. Pulverized limestone is, therefore, more reactive than ground limestone. However, reactivity ratedoes not increase greatly for particle sizes smaller than 100 mesh.

92 Lime
Agronomy Handbook Virginia Cooperative Extension
Mesh Screen Analysis of Agricultural Limestone Marketed in Virginia 1
Mesh screen size Percent guaranteed to pass (5% Tolerance)1. Ground limestone 20 90
60 50100 30
2. Pulverized limestone 20 95100 70
1Minimum calcium carbonate equivalent of not less than 85%.
In addition to lime types based on mesh screen fractions, there are lime types based on kind of limestone, i.e.,calcitic and dolomitic. In Virginia, agricultural limestone that contains 85% or more of the total neutralizing valuein the calcium carbonate form is classified as calcitic, whereas limestone that contains 15% or more of the totalcarbonate content as magnesium carbonate is classified as dolomitic. Both are excellent liming materials; how-ever, dolomitic lime should be used on soils testing low in magnesium.
When buying lime, one must be aware of the cost per unit of calcium carbonate equivalency. Neutralizationpotential increases with the increase in calcium carbonate equivalency value. In reality, aglime users are buyingacid neutralizing potential that is associated with both calcium carbonate equivalence and fineness of grind.

Nutrient Management 93
Virginia Cooperative Extension Agronomy Handbook
PART XNutrient Management
Gregory K. Evanylo, Extension Waste Management, Soil and Water SpecialistGregory L. Mullins, Extension Nutrient Management Specialist
Purpose of nutrient management planning
In 1983, a $27 million, six-year study by the U.S. EPA (1983) revealed that runoff from farmland is contributingto water quality decline in the Chesapeake Bay. Agricultural practices can adversely affect groundwater as well assurface water. Nutrients, particularly nitrogen (N) and phosphorus (P), are a major component of this form ofpollution, termed nonpoint source (NPS) pollution. Life within rivers, streams, lakes and bays could not existwithout nutrients, but an excess of nutrients can harm aquatic life.
It is estimated that 67% of the nitrogen and 39% of the phosphorus entering the Bay originate from non-pointsources, with cropland agriculture contributing 60% of the nitrogen and 27% of the phosphorus entering the Bay.Nonpoint source pollution loadings from agriculture to the Bay must be reduced and managed in concert withother pollution reduction strategies if the degradation that the Bay and other water sources has undergone is goingto be reversed.
Nutrient management involves the implementation of practices that permit efficient crop production and protectwater quality from nutrient pollution. A nutrient management plan is a site-specific plan that addresses theseissues. The goal of farm nutrient management planning is to minimize adverse environmental effects, primarilyupon water quality, while optimizing farm profits. It should be recognized that some level of nutrient loss to theenvironment will occur even when the best nutrient management practices are employed; however, these lossesshould be lower than what would occur without nutrient management.
Fate and transport of nutrients of concern
NitrogenNitrogen is an essential element for plant growth and animal nutrition and is the nutrient taken up in the largestamount by crops. Nitrate (NO
3-), the major inorganic form of nitrogen in most soils, is quite mobile and moves
freely with soil water. Nitrogen application to soils beyond that required for plant uptake will generally lead tonitrate leaching and long term groundwater degradation.
Elevated levels of nitrate in drinking water may lead to methemoglobinemia in infants, the formation of carcino-genic nitrosamines in the human stomach, and hypertension. A recent national groundwater study by the UnitedStates-Environmental Protection Agency (1990) found detectable nitrate in 52% of the 94,600 community watersystems tested, indicating widespread movement to groundwater on a national scale. Movement of excessiveamounts of nitrogen to surface waters can result in a number of undesirable effects such as eutrophication (nutri-ent enrichment) and associated algal blooms and oxygen depletion.
PhosphorusPhosphorus, another major essential plant element, differs considerably from nitrate nitrogen in its water solubil-ity and mobility. Phosphorus is very immobile in soil and seldom migrates downward to any great extent with soilwater because it is strongly bound by and/or precipitated as highly insoluble soil minerals. Much of the fertilizerphosphorus applied to soils is retained in the near-surface layer in various inorganic precipitates and organicallycombined forms that prevent it from leaching.
While the risk of groundwater contamination by phosphorus from crop production systems is limited, the solidforms of phosphorus that accumulate in surface soil are subject to loss via erosion, the major water quality riskfrom phosphorus. Where erosion risk increases, such as for annual crops with conventional tillage, the total-P lossincreases greatly as the phosphorus is moved in solid particulate form with the eroding soil.

94 Nutrient Management
Agronomy Handbook Virginia Cooperative Extension
Because phosphorus is strongly bound by soils, phosphorus runoff from permanently vegetated areas (e.g.,perennial sods or forests) is minimal and largely occurs as traces of orthophosphate (H
2PO
4- or HPO
42-) ions in
solution. Phosphorus in runoff can become a potential surface water quality problem where organic wastes (e.g.,manures and biosolids) have been applied to supply crop nitrogen needs over long time periods. In these cases,high phosphorus concentrations may develop in the soil because the relative amounts of nitrogen and phosphorusapplied in organic wastes are similar, but crops do not deplete soil phosphorus as rapidly as nitrogen. A portion ofthis phosphorus will occur as water soluble P, which is immediately available for biological uptake. Elevatedphosphorus loadings lead to algal blooms and mats, heavy growth of aquatic plants and weeds, deoxygenation,and occasional problems with drinking water taste and odor.
Components of a nutrient management plan
Nutrient management plans must be developed on a site-specific basis and must be carefully tailored to specificsoils and crop production systems. The following steps will generally be essential:
1. Obtain accurate soil information for each field or management unit, and analyze representative soil samplesfrom each management unit. This may require a new farm soil map or a revision of existing United StatesDepartment of Agriculture-Natural Resources Conservation Service (USDA-NRCS) mapping coverage.
2. Determine the crop yield potential for each field, based on the known productivity of the soils coupled with theintended management practices.
3. Identify the total plant nutrient needs to achieve this expected yield potential.
4. Determine the plant-available nutrients in manures or biosolids to be used, considering the type of organicmaterial to be used and its method of application.
5. Estimate the nutrient contribution that can be expected from residual effects or carryover from previousfertilizer, manure or biosolid applications.
6. Include credit for nitrogen supplied to row crops following a previous legume.
7. Recommend application rates for manure, other organic sources, and/or commercial fertilizers to supply theneeded nutrients at the appropriate time for optimal crop production.
This process must be followed for all fields and production systems within a given planning area. The nutrientplanning process is totally dependent upon the synthesis of information and data on the soils, cropping systems,manures, and management practices being employed over time. Therefore, care should be taken to ensure that theinformation used to specify the nutrient management plan is current and accurate.
Recognizing environmentally sensitive sites
The potential for plant nutrients (particularly N and P) to migrate to surface and groundwater is largely dependentupon soil and site conditions. An important part of nutrient management planning for agriculture is the recogni-tion and delineation of environmentally sensitive sites and conditions and the development of specific manage-ment practices (Best Management Practices, BMP) to avoid detrimental effects. The soils and landscapes ofVirginia vary greatly, but the following soil/landscape features and properties are particularly conducive to theloss of nutrients from agricultural practices:
1. Soils with high leaching potentials: This includes soils with very coarse textures and those where the watertable is at or near the surface during the winter. If accurate soil survey information is available, the leachingindex for a given soil can be obtained by following the procedures outlined in the USDA-NRCS Field OfficeTechnical Guide (USDA Soil Conservation Service, 1990).

Nutrient Management 95
Virginia Cooperative Extension Agronomy Handbook
2. Lands with karst (sinkhole) drainage regimes: Sinkholes are landscape features commonly found in areasunderlain by limestone bedrock or other highly soluble carbonate bearing parent materials. These areas mainlyoccur in the Valley and Ridge physiographic province but may also occur in the lower Coastal Plain. Sinkholesare formed by the long term dissolution of carbonates underlying the surface that eventually leaves a cavitythat collapses over time. Sinkholes form a direct connection between surface water and groundwater and dyetracer tests have shown that water entering a sinkhole can contaminate nearby drinking wells within hours.
If a sinkhole is located in an isolated high area of a field, a grassed buffer should be placed around it. If thesinkhole occurs on a sideslope or below a cropped field, significant runoff may drain into the sinkhole. Thefield area draining into the sinkhole would be best used for hay crops, pasture, or trees to reduce runoff. If thearea is cropped, nutrient management practices should be intensive.
3. Shallow soils over fractured bedrock: Soils that are shallow (< 40 in.) to bedrock that is fractured should bemanaged like soils with a high leaching index. Although many of these soils are not highly leached, the waterand any dissolved nutrients can move rapidly to groundwater once the soil water percolates to the fracturedrock. Lists of shallow soils in each state can be obtained from the NRCS and by reviewing county soil sur-veys. Nutrient management should include such practices as split applications of nitrogen on crops and the useof winter cover crops to scavenge residual soil nitrogen in fields containing significant areas of these soils.
4. Tile drained lands: Fields that have been artificially drained should be treated as environmentally sensitive dueto the direct connection of the tile outlets to surface watersheds. These lands are typically drained because theyhave a high seasonal water table, which can potentially pollute both the surface water with their drainagedischarge and the local water table if nutrients are over-applied relative to crop uptake.
5. Irrigated lands: Fields receiving irrigation, because of the increased input of water, are prone to runoff andleaching of water and nutrients. The leaching index approach cannot be used on these areas since it wouldunderestimate the actual leaching potential. To maximize water use efficiency and minimize leaching andrunoff, irrigation scheduling methods should be used. These include the use of gypsum blocks, tensiometers,or computerized systems. When these indicators show the need for irrigation, rates and amounts of watershould be based upon the soil type and water holding capacity to further reduce water and nutrient losses.
6. Excessively sloping lands: Lands with steep (i.e., >12 to 15 percent) and long slopes pose a high risk for thesurface loss of applied nitrogen and phosphorus. Significant amounts of nutrients bound to sediment can belost during heavy rainfall events if tillage is employed to incorporate nutrients. Manure applications on suchslopes should be limited by P soil test needs or crop uptake estimates. Injection is the preferred manure appli-cation method. Soil conservation measures should be practiced on highly erodible lands.
7. Floodplains and other lands near surface waters: Agricultural land close to surface water can have a more directimpact on surface water quality. Surface flow of runoff water has little chance to be filtered before dischargeinto adjacent waters if channelized flow develops. Subsurface flow in groundwater can also directly seep intothe adjacent surface water body. Wetlands can also reduce the potential for nitrogen contamination of surfacewaters by identifying nitrate contaminated water that enters the wetland. If manure or biosolids must beapplied to a floodplain, incorporation or injection application methods should be used to minimize losses ifflooding occurs.
The list of environmentally sensitive sites given above is not all-inclusive, but does include most of the majortypes of land with these concerns in Virginia. Appropriate setback or buffer areas should be established betweenthese areas and any field receiving nutrient applications, and intensive nutrient management practices should beemployed on any lands adjacent to sensitive areas.
96 Nutrient Management
Agronomy Handbook Virginia Cooperative Extension
On-farm Nutrient management planning
Nutrient cycles and management on different farm typesConsidering some representative farm types and the management consequences of the nutrient cycles on each ishelpful in understanding nutrient management planning. Nutrients come to a modern cash-crop farm in fertilizersand other materials applied directly to the fields (Figure 1a). Crops harvested from the fields remove a fraction ofthe applied nutrients which leave the farm when the crops are sold. Improper management of nutrients can resultin significant losses other than removal in cash crop and negative economic consequences for the farmer; there-fore, the cost of practices that reduce nutrient losses on a cash-crop farm can be at least partially offset by de-creased costs in purchased fertilizer.
On farms with livestock (e.g., a dairy), a large proportion of the plant nutrients that were in the crops produced asfeed for the animals are returned to the fields in manure from the animals (Figure 1b). Supplementing on-farmcrop production with fertilizer, off-farm feeds or other animal inputs is more likely on a modern crop and livestockfarm with ruminant animals than on traditional self sufficient crop and livestock farms. Thus, the manure producedby the animals is no longer spread on the fields where the crops were produced. The plant nutrients in the feedinputs can offset the nutrients removed from the farm as sold animal products.
Feed inputs enable farms to have more animals on fewer acres. Sometimes, these off-farm feed nutrients canexceed what is needed for crops grown on-farm and result in excessive manure nutrients that can be potentialsources of water contamination. All sources of plant nutrients being applied to fields must be determined to protectthe environment from negative impacts associated with the over-application of nutrients to crop fields.
Trends in animal housing and the success of crop production on cash-crop farms in specialized geographic regionshave made it possible to concentrate large numbers of animals, such as poultry and swine, on small land areas.Most, if not all, of the feed necessary for these animals can be economically transported to the farm where theanimals are housed (Figure 1c). Although poultry and swine farms may produce crops for off-farm sale, the landareas involved can be quite limited because the focus of the management activity is on animal production. Thecash-crop farm and the intensive, modern livestock farm are connected by the flow of feed; however, nutrients inthis flow often do not cycle back to their original locations. The application of nutrients to the fields on thesefarms is not closely related to the major production activity of the farm (i.e., selling animals or animal products).This will usually result in levels of nutrients in excess of the crop needs on the farm and a high potential forenvironmental problems.
Field-based agronomic practices may be of limited effectiveness in assimilating the total quantity of nutrients onintensive livestock farms because of the small land area on the farm. It is unlikely that environmental quality canbe protected on poultry and swine farms solely by recycling nutrients for crop production. Successful managementof nutrients to protect the environment will depend on support from off-farm people and organizations.
Animal density and nutrient balanceAnimal density and the proportion of feed coming from off the farm are important features in determining thenutrient status of a farm. On low animal density farms (<1.25 animal equivalent units [AEU’s] per acre) or thosewhere little feed (<50%) comes from off the farm, manure nutrients produced on the farm will not meet total cropnutrient needs. In this group an appropriate management objective would be to maximize nutrient use efficiencyon the farm. The environmental impact of these operations can be minimal if sound nutrient management prin-ciples are applied. Management decisions should be made based on expected crop response to nutrients (i.e.,increasing yields or decreasing purchased inputs). Plans should utilize soil tests and manure analysis to assuredistribution and timing of manure applications to maximize nutrient availability from the manure and minimizepurchase of commercial fertilizer. Examples of practices that would be appropriate on this group of farms include:spring application of manure, immediate incorporation of manure, use of cover crops to scavenge nutrients, nomanure spread on legumes, and efficient manure storage.

Nutrient Management 97
Virginia Cooperative Extension Agronomy Handbook
Farms with medium animal density (1.25 - 2.25 AEU’s/acre;50-80% feed from off farm) supply manure nitrogen roughlyequivalent to total crop needs, but excessive phosphorussupply is likely. An appropriate management objective forthese farms would be to maximize environmentally safenutrient use on the farm. Nutrient use efficiency will likely bea secondary concern if there is enough or more than enoughnutrients on the farm to meet crop requirements. The majorconcern will be safely using all of the manure produced.There is good potential for environmental benefits fromimproved management on these farms. Changes in the overallfarm management, such as altering the cropping system, maybe necessary on this group of farms. A detailed manuremanagement plan, based on nutrient balance rather than cropresponse, will probably be necessary on these farms.
On high intensity farms (>2.25 AEU’s/acre; >80% feed fromoff farm), livestock manure production often significantlyexceeds total crop nutrient needs. On these farms, the man-agement objective will be to use every available means toremove excess manure not needed for crop production.Alternative off-farm uses for the manure will need to beexplored. Often, this will mean locating a market for themanure and arranging the logistics of transportation andappropriate application. The on-farm plans for this group offarms will involve determining the maximum amount ofmanure that can be safely applied on the farm and the appro-priate timing of application to minimize environmentalimpact. High intensity farms have the highest potential tonegatively impact the environment. In many cases, unless afavorable marketing arrangement can be developed, imple-menting improved nutrient management on this group offarms will have a negative economic impact on the farm.
References
U.S.D.A. Soil Conservation Service. 1990. Field OfficeTechnical Guide. Section II-iii-L, Water Quantity and Qual-ity. Soil Ratings for Nitrate and Soluble Nutrients. Publica-tion No. 120-411.
U.S. EPA. 1990. National pesticide survey, Phase I report.EPA 570/9-90-015, U.S. Gov. Print. Office, Washington, DC.
U.S. EPA. 1983. Chesapeake Bay program: Findings andrecommendations. United States Environmental ProtectionAgency, Philadelphia, PA. 48 p.
CropFert. Crop
Fert.
CropMilk.
a. Cash Crop Farm
b. Dairy Farm
c. Intensive Swine Farm
Crop
Fert.Crop
Crop
Crop
Manure
Manure
Feed
Feed
Figure 1. Nutrient Cycles on DifferentTypes of Farms

98 Nutrient Management
Agronomy Handbook Virginia Cooperative Extension

Nutrient Management 93
Virginia Cooperative Extension Agronomy Handbook
PART XNutrient Management
Gregory K. Evanylo, Extension Waste Management, Soil and Water SpecialistGregory L. Mullins, Extension Nutrient Management Specialist
Purpose of nutrient management planning
In 1983, a $27 million, six-year study by the U.S. EPA (1983) revealed that runoff from farmland is contributingto water quality decline in the Chesapeake Bay. Agricultural practices can adversely affect groundwater as well assurface water. Nutrients, particularly nitrogen (N) and phosphorus (P), are a major component of this form ofpollution, termed nonpoint source (NPS) pollution. Life within rivers, streams, lakes and bays could not existwithout nutrients, but an excess of nutrients can harm aquatic life.
It is estimated that 67% of the nitrogen and 39% of the phosphorus entering the Bay originate from non-pointsources, with cropland agriculture contributing 60% of the nitrogen and 27% of the phosphorus entering the Bay.Nonpoint source pollution loadings from agriculture to the Bay must be reduced and managed in concert withother pollution reduction strategies if the degradation that the Bay and other water sources has undergone is goingto be reversed.
Nutrient management involves the implementation of practices that permit efficient crop production and protectwater quality from nutrient pollution. A nutrient management plan is a site-specific plan that addresses theseissues. The goal of farm nutrient management planning is to minimize adverse environmental effects, primarilyupon water quality, while optimizing farm profits. It should be recognized that some level of nutrient loss to theenvironment will occur even when the best nutrient management practices are employed; however, these lossesshould be lower than what would occur without nutrient management.
Fate and transport of nutrients of concern
NitrogenNitrogen is an essential element for plant growth and animal nutrition and is the nutrient taken up in the largestamount by crops. Nitrate (NO
3-), the major inorganic form of nitrogen in most soils, is quite mobile and moves
freely with soil water. Nitrogen application to soils beyond that required for plant uptake will generally lead tonitrate leaching and long term groundwater degradation.
Elevated levels of nitrate in drinking water may lead to methemoglobinemia in infants, the formation of carcino-genic nitrosamines in the human stomach, and hypertension. A recent national groundwater study by the UnitedStates-Environmental Protection Agency (1990) found detectable nitrate in 52% of the 94,600 community watersystems tested, indicating widespread movement to groundwater on a national scale. Movement of excessiveamounts of nitrogen to surface waters can result in a number of undesirable effects such as eutrophication (nutri-ent enrichment) and associated algal blooms and oxygen depletion.
PhosphorusPhosphorus, another major essential plant element, differs considerably from nitrate nitrogen in its water solubil-ity and mobility. Phosphorus is very immobile in soil and seldom migrates downward to any great extent with soilwater because it is strongly bound by and/or precipitated as highly insoluble soil minerals. Much of the fertilizerphosphorus applied to soils is retained in the near-surface layer in various inorganic precipitates and organicallycombined forms that prevent it from leaching.
While the risk of groundwater contamination by phosphorus from crop production systems is limited, the solidforms of phosphorus that accumulate in surface soil are subject to loss via erosion, the major water quality riskfrom phosphorus. Where erosion risk increases, such as for annual crops with conventional tillage, the total-P lossincreases greatly as the phosphorus is moved in solid particulate form with the eroding soil.

94 Nutrient Management
Agronomy Handbook Virginia Cooperative Extension
Because phosphorus is strongly bound by soils, phosphorus runoff from permanently vegetated areas (e.g.,perennial sods or forests) is minimal and largely occurs as traces of orthophosphate (H
2PO
4- or HPO
42-) ions in
solution. Phosphorus in runoff can become a potential surface water quality problem where organic wastes (e.g.,manures and biosolids) have been applied to supply crop nitrogen needs over long time periods. In these cases,high phosphorus concentrations may develop in the soil because the relative amounts of nitrogen and phosphorusapplied in organic wastes are similar, but crops do not deplete soil phosphorus as rapidly as nitrogen. A portion ofthis phosphorus will occur as water soluble P, which is immediately available for biological uptake. Elevatedphosphorus loadings lead to algal blooms and mats, heavy growth of aquatic plants and weeds, deoxygenation,and occasional problems with drinking water taste and odor.
Components of a nutrient management plan
Nutrient management plans must be developed on a site-specific basis and must be carefully tailored to specificsoils and crop production systems. The following steps will generally be essential:
1. Obtain accurate soil information for each field or management unit, and analyze representative soil samplesfrom each management unit. This may require a new farm soil map or a revision of existing United StatesDepartment of Agriculture-Natural Resources Conservation Service (USDA-NRCS) mapping coverage.
2. Determine the crop yield potential for each field, based on the known productivity of the soils coupled with theintended management practices.
3. Identify the total plant nutrient needs to achieve this expected yield potential.
4. Determine the plant-available nutrients in manures or biosolids to be used, considering the type of organicmaterial to be used and its method of application.
5. Estimate the nutrient contribution that can be expected from residual effects or carryover from previousfertilizer, manure or biosolid applications.
6. Include credit for nitrogen supplied to row crops following a previous legume.
7. Recommend application rates for manure, other organic sources, and/or commercial fertilizers to supply theneeded nutrients at the appropriate time for optimal crop production.
This process must be followed for all fields and production systems within a given planning area. The nutrientplanning process is totally dependent upon the synthesis of information and data on the soils, cropping systems,manures, and management practices being employed over time. Therefore, care should be taken to ensure that theinformation used to specify the nutrient management plan is current and accurate.
Recognizing environmentally sensitive sites
The potential for plant nutrients (particularly N and P) to migrate to surface and groundwater is largely dependentupon soil and site conditions. An important part of nutrient management planning for agriculture is the recogni-tion and delineation of environmentally sensitive sites and conditions and the development of specific manage-ment practices (Best Management Practices, BMP) to avoid detrimental effects. The soils and landscapes ofVirginia vary greatly, but the following soil/landscape features and properties are particularly conducive to theloss of nutrients from agricultural practices:
1. Soils with high leaching potentials: This includes soils with very coarse textures and those where the watertable is at or near the surface during the winter. If accurate soil survey information is available, the leachingindex for a given soil can be obtained by following the procedures outlined in the USDA-NRCS Field OfficeTechnical Guide (USDA Soil Conservation Service, 1990).

Nutrient Management 95
Virginia Cooperative Extension Agronomy Handbook
2. Lands with karst (sinkhole) drainage regimes: Sinkholes are landscape features commonly found in areasunderlain by limestone bedrock or other highly soluble carbonate bearing parent materials. These areas mainlyoccur in the Valley and Ridge physiographic province but may also occur in the lower Coastal Plain. Sinkholesare formed by the long term dissolution of carbonates underlying the surface that eventually leaves a cavitythat collapses over time. Sinkholes form a direct connection between surface water and groundwater and dyetracer tests have shown that water entering a sinkhole can contaminate nearby drinking wells within hours.
If a sinkhole is located in an isolated high area of a field, a grassed buffer should be placed around it. If thesinkhole occurs on a sideslope or below a cropped field, significant runoff may drain into the sinkhole. Thefield area draining into the sinkhole would be best used for hay crops, pasture, or trees to reduce runoff. If thearea is cropped, nutrient management practices should be intensive.
3. Shallow soils over fractured bedrock: Soils that are shallow (< 40 in.) to bedrock that is fractured should bemanaged like soils with a high leaching index. Although many of these soils are not highly leached, the waterand any dissolved nutrients can move rapidly to groundwater once the soil water percolates to the fracturedrock. Lists of shallow soils in each state can be obtained from the NRCS and by reviewing county soil sur-veys. Nutrient management should include such practices as split applications of nitrogen on crops and the useof winter cover crops to scavenge residual soil nitrogen in fields containing significant areas of these soils.
4. Tile drained lands: Fields that have been artificially drained should be treated as environmentally sensitive dueto the direct connection of the tile outlets to surface watersheds. These lands are typically drained because theyhave a high seasonal water table, which can potentially pollute both the surface water with their drainagedischarge and the local water table if nutrients are over-applied relative to crop uptake.
5. Irrigated lands: Fields receiving irrigation, because of the increased input of water, are prone to runoff andleaching of water and nutrients. The leaching index approach cannot be used on these areas since it wouldunderestimate the actual leaching potential. To maximize water use efficiency and minimize leaching andrunoff, irrigation scheduling methods should be used. These include the use of gypsum blocks, tensiometers,or computerized systems. When these indicators show the need for irrigation, rates and amounts of watershould be based upon the soil type and water holding capacity to further reduce water and nutrient losses.
6. Excessively sloping lands: Lands with steep (i.e., >12 to 15 percent) and long slopes pose a high risk for thesurface loss of applied nitrogen and phosphorus. Significant amounts of nutrients bound to sediment can belost during heavy rainfall events if tillage is employed to incorporate nutrients. Manure applications on suchslopes should be limited by P soil test needs or crop uptake estimates. Injection is the preferred manure appli-cation method. Soil conservation measures should be practiced on highly erodible lands.
7. Floodplains and other lands near surface waters: Agricultural land close to surface water can have a more directimpact on surface water quality. Surface flow of runoff water has little chance to be filtered before dischargeinto adjacent waters if channelized flow develops. Subsurface flow in groundwater can also directly seep intothe adjacent surface water body. Wetlands can also reduce the potential for nitrogen contamination of surfacewaters by identifying nitrate contaminated water that enters the wetland. If manure or biosolids must beapplied to a floodplain, incorporation or injection application methods should be used to minimize losses ifflooding occurs.
The list of environmentally sensitive sites given above is not all-inclusive, but does include most of the majortypes of land with these concerns in Virginia. Appropriate setback or buffer areas should be established betweenthese areas and any field receiving nutrient applications, and intensive nutrient management practices should beemployed on any lands adjacent to sensitive areas.

96 Nutrient Management
Agronomy Handbook Virginia Cooperative Extension
On-farm Nutrient management planning
Nutrient cycles and management on different farm typesConsidering some representative farm types and the management consequences of the nutrient cycles on each ishelpful in understanding nutrient management planning. Nutrients come to a modern cash-crop farm in fertilizersand other materials applied directly to the fields (Figure 1a). Crops harvested from the fields remove a fraction ofthe applied nutrients which leave the farm when the crops are sold. Improper management of nutrients can resultin significant losses other than removal in cash crop and negative economic consequences for the farmer; there-fore, the cost of practices that reduce nutrient losses on a cash-crop farm can be at least partially offset by de-creased costs in purchased fertilizer.
On farms with livestock (e.g., a dairy), a large proportion of the plant nutrients that were in the crops produced asfeed for the animals are returned to the fields in manure from the animals (Figure 1b). Supplementing on-farmcrop production with fertilizer, off-farm feeds or other animal inputs is more likely on a modern crop and livestockfarm with ruminant animals than on traditional self sufficient crop and livestock farms. Thus, the manure producedby the animals is no longer spread on the fields where the crops were produced. The plant nutrients in the feedinputs can offset the nutrients removed from the farm as sold animal products.
Feed inputs enable farms to have more animals on fewer acres. Sometimes, these off-farm feed nutrients canexceed what is needed for crops grown on-farm and result in excessive manure nutrients that can be potentialsources of water contamination. All sources of plant nutrients being applied to fields must be determined to protectthe environment from negative impacts associated with the over-application of nutrients to crop fields.
Trends in animal housing and the success of crop production on cash-crop farms in specialized geographic regionshave made it possible to concentrate large numbers of animals, such as poultry and swine, on small land areas.Most, if not all, of the feed necessary for these animals can be economically transported to the farm where theanimals are housed (Figure 1c). Although poultry and swine farms may produce crops for off-farm sale, the landareas involved can be quite limited because the focus of the management activity is on animal production. Thecash-crop farm and the intensive, modern livestock farm are connected by the flow of feed; however, nutrients inthis flow often do not cycle back to their original locations. The application of nutrients to the fields on thesefarms is not closely related to the major production activity of the farm (i.e., selling animals or animal products).This will usually result in levels of nutrients in excess of the crop needs on the farm and a high potential forenvironmental problems.
Field-based agronomic practices may be of limited effectiveness in assimilating the total quantity of nutrients onintensive livestock farms because of the small land area on the farm. It is unlikely that environmental quality canbe protected on poultry and swine farms solely by recycling nutrients for crop production. Successful managementof nutrients to protect the environment will depend on support from off-farm people and organizations.
Animal density and nutrient balanceAnimal density and the proportion of feed coming from off the farm are important features in determining thenutrient status of a farm. On low animal density farms (<1.25 animal equivalent units [AEU’s] per acre) or thosewhere little feed (<50%) comes from off the farm, manure nutrients produced on the farm will not meet total cropnutrient needs. In this group an appropriate management objective would be to maximize nutrient use efficiencyon the farm. The environmental impact of these operations can be minimal if sound nutrient management prin-ciples are applied. Management decisions should be made based on expected crop response to nutrients (i.e.,increasing yields or decreasing purchased inputs). Plans should utilize soil tests and manure analysis to assuredistribution and timing of manure applications to maximize nutrient availability from the manure and minimizepurchase of commercial fertilizer. Examples of practices that would be appropriate on this group of farms include:spring application of manure, immediate incorporation of manure, use of cover crops to scavenge nutrients, nomanure spread on legumes, and efficient manure storage.

Nutrient Management 97
Virginia Cooperative Extension Agronomy Handbook
Farms with medium animal density (1.25 - 2.25 AEU’s/acre;50-80% feed from off farm) supply manure nitrogen roughlyequivalent to total crop needs, but excessive phosphorussupply is likely. An appropriate management objective forthese farms would be to maximize environmentally safenutrient use on the farm. Nutrient use efficiency will likely bea secondary concern if there is enough or more than enoughnutrients on the farm to meet crop requirements. The majorconcern will be safely using all of the manure produced.There is good potential for environmental benefits fromimproved management on these farms. Changes in the overallfarm management, such as altering the cropping system, maybe necessary on this group of farms. A detailed manuremanagement plan, based on nutrient balance rather than cropresponse, will probably be necessary on these farms.
On high intensity farms (>2.25 AEU’s/acre; >80% feed fromoff farm), livestock manure production often significantlyexceeds total crop nutrient needs. On these farms, the man-agement objective will be to use every available means toremove excess manure not needed for crop production.Alternative off-farm uses for the manure will need to beexplored. Often, this will mean locating a market for themanure and arranging the logistics of transportation andappropriate application. The on-farm plans for this group offarms will involve determining the maximum amount ofmanure that can be safely applied on the farm and the appro-priate timing of application to minimize environmentalimpact. High intensity farms have the highest potential tonegatively impact the environment. In many cases, unless afavorable marketing arrangement can be developed, imple-menting improved nutrient management on this group offarms will have a negative economic impact on the farm.
References
U.S.D.A. Soil Conservation Service. 1990. Field OfficeTechnical Guide. Section II-iii-L, Water Quantity and Qual-ity. Soil Ratings for Nitrate and Soluble Nutrients. Publica-tion No. 120-411.
U.S. EPA. 1990. National pesticide survey, Phase I report.EPA 570/9-90-015, U.S. Gov. Print. Office, Washington, DC.
U.S. EPA. 1983. Chesapeake Bay program: Findings andrecommendations. United States Environmental ProtectionAgency, Philadelphia, PA. 48 p.
CropFert. Crop
Fert.
CropMilk.
a. Cash Crop Farm
b. Dairy Farm
c. Intensive Swine Farm
Crop
Fert.Crop
Crop
Crop
Manure
Manure
Feed
Feed
Figure 1. Nutrient Cycles on DifferentTypes of Farms

98 Nutrient Management
Agronomy Handbook Virginia Cooperative Extension

Utilization of Organic Waste 99
Virginia Cooperative Extension Agronomy Handbook
PART XIUtilization of Organic Wastes as
Nutrient Sources and Soil AmendmentsGregory K. Evanylo, Extension Waste Management-Soil and Water Specialist
Gregory L. Mullins, Extension Nutrient Management SpecialistIntroduction
Waste products such as manure, biosolids (municipal wastewater sewage sludge), and industrial sludges supplyorganic matter and nutrients when used as soil amendments. The organic matter in these materials can improvesoil tilth and aeration, increase water infiltration into soil and soil moisture holding capacity, decrease soil erosionpotential, increase soil cation exchange capacity, buffer soil pH, and promote the growth of beneficial soil organ-isms. Some of all of the essential plant elements are contained in these materials, but they rarely occur in theproportion required for balanced plant nutrition.
The nutrient and heavy metal contents of organic wastes are highly variable, and analysis of individual wastesmust be performed to certify quality and to ensure appropriate application rates. The major environmental con-cerns associated with the land application of organic wastes are the direct runoff of the organic material and anysoluble constituents (e.g., phosphorus) into surface waters and the leaching of nitrate (NO
3-) to groundwater.
Bioavailability of heavy metals and transport of microbial pathogens can pose additional risks if waste materialquality and proper management is not assured.
Sources of organic wastes
Processes that generate wastesManureLivestock (beef and dairy cattle, swine) and poultry (broilers, layers, turkeys) operations generate animal waste(feces and urine) that must be collected and stored prior to land application. Some animal waste handling systems(e.g., composting, anaerobic lagoons) are designed to treat the waste by reducing pathogens, odors, and nitrogencontent and increasing organic matter stability, but most systems are simply collection and storage facilities.Descriptions of manure types associated with beef and dairy cattle, swine, and poultry are presented in Table 1.
Table 1. Manure Collection Systems (Source: Evanylo, 1994)
Type Description Animal Type
Solid without bedding Feedlot, scraped Beef and dairy cattle, swineSolid with bedding Tramp shed Beef and dairy cattleAnaerobic lagoon Solids settled on bottom Beef and dairy cattle, swineAnaerobic lagoon sludge Supernatant of a non-agitated waste lagoon Beef and dairy cattle, swine,
poultryCompost Controlled aerobic decomposition Beef and dairy cattle, swine,
poultryLiquid manure slurry Pit storage of wash waters Beef and dairy cattle, swine,
poultryDeep pit Two-story poultry house; manure falls through Poultry
the caged 2nd floors to 1stSolid without litter Manure collection gutters under poultry are Poultry
scraped each weekHouse litter Manure falls onto bedding and is removed Poultry
after one or more flocksStockpiled litter Same as house litter, but stockpiled until Poultry
needed

100 Utilization of Organic Waste
Agronomy Handbook Virginia Cooperative Extension
BiosolidsBiosolids are municipal wastewater sewage sludges that have been treated to permit their safe and beneficialapplication to soil for agricultural purposes. Biosolids are the materials remaining after treatment facilities purifywastewater from homes, businesses and industries. In some communities, runoff from roads, lawns and fields isalso included. Biosolids are composed of inorganic constituents, such as macro- and micro-nutrients and non-nutrient trace elements, organic compounds, and microorganisms, including pathogens and parasites.
With minor exceptions, such as pretreatment required by industrial wastewater and sewer ordinances, treatmentplants have little control over the material they process. They must accept all incoming wastewater and purify itbefore discharging the effluent back into the environment. The wide variety of incoming wastewater and availabletreatment technologies determines the volume and composition of wastewater treatment plant biosolids.
Figure 1 illustrates a generalized wastewater treatment process used to produce biosolids. As wastewater entersthe plant, a screen removes large objects and a settling chamber removes grit. The wastewater then travels throughthe primary sedimentation basin where much of the solid matter is separated from the liquid. The secondarytreatment process removes additional solids and some dissolved nutrients from the liquid. Advanced treatmentfurther removes dissolved nutrients, then filters and disinfects the wastewater. Solids are combined, thickened,and stabilized. The stabilization process reduces pathogen numbers and the properties that attract vectors (i.e.,disease-spreading animals) and readies the biosolids for dewatering. Once dewatered, the biosolids are ready to beland applied.
The State Department of Health is responsible for administering and enforcing the Biosolids Use Regulations (12VAC 5-585, 32.1-164.5 of the Code of Virginia), under which most land application programs operate in Virginia.Further details regarding wastewater and biosolids treatment processes, regulations, and agricultural land applica-tion practices can be found in the Virginia Cooperative Extension Publication 452-301 through 452-304, a serieson agricultural land application of biosolids in Virginia (Evanylo, 1999).
Figure 1. Schematic of Typical Wastewater Treatment Process.

Utilization of Organic Waste 101
Virginia Cooperative Extension Agronomy Handbook
Industrial sludgeMany industries produce wastewater that is processed in the same manner as municipal wastewater. The solidsremoved from these industrial wastewaters can be land applied if they meet the same stringent standards forbiosolids. Some of the industries whose solids are often beneficially recycled onto land include textile mills(textile scrubber wastes), fermentation (brewery wastes containing yeast), and wood processing (paper millsludge). The Virginia Department of Environmental Quality issues permits to applicators of industrial wastes.
Waste characteristicsManureAnimal manure is a mixture of metabolic products such as urea and uric acid, living and dead organisms, andpartially decomposed residues from the original feed. Nutrient content of manure varies with: (1) animal type andage, (2) composition of the feed, (3) amount of bedding and water added or lost, (4) method of manure collectionand storage, and (5) length of time the manure is stored before field application. On a typical livestock farm about75% of the nitrogen (N), 60-70% of the phosphorus (P), and 80-85% of the potassium (K) fed to animals areexcreted in the manure. Examples of nutrient contents in fresh manures are presented in Table 2. The averageconcentrations of N, P, and K in poultry manures are higher than in other livestock wastes. The relative proportionof N:P in all fresh manures is generally about 3:1 to 4:1.
Table 2. Manure Production and Nutrient Content (Source: Barker, 1980)Animal Fresh Nutrients in Fresh ManureWeight Manure N P K
Animal Lbs lbs/yr ————— ——lbs/ton———-————
Dairy 640 37,400 12 3 12Beef 440 24,200 12 3 8Swine 45 3,080 12 3 5
Caged layer 2 100 28 9 10Dry litter: Broiler 1 15 52 18 28 Turkey 7 48 36 14 12
The greatest impact on nitrogen content of manures is loss of ammonia (NH3) through volatilization during
handling and storage. As much as 50-60% of the original nitrogen may be lost during handling and storage (Table3). Generally, more atmospheric nitrogen loss will occur the longer the manure is stored. Nitrogen loss frommanure reduces the ratio of N:P in manure to be applied to land to about 1:1 to 1.5:1 because phosphorus isconserved in manure during collection and storage. The consequence of this is that higher amounts of phosphorusthan required by crops are supplied when manures are applied at rates that supply the necessary amounts ofnitrogen.
Table 3. Nitrogen Loss and Retention From Manure Storage and Handling Systems(not including loss from field application) (Vanderholm, 1975)
Storage and handling system Amount Lost (%) Amount Remaining (%)1. Manure liquids and solids hauled daily 15-25 75-852. Manure liquids and solids held in a 20-30 70-80
covered, essentially watertight structure3. Manure liquids and solids held in an 30-40 60-70
uncovered, essentially watertight structure4. Manure liquids and solids held in a storage 30-40 60-70
pond; contents are agitated before spreading5. Manure and bedding held in roofed storage 30-40 60-706. Manure without bedding held in unroofed 45-55 45-55
storage; leachate is lost; solids are spread7. Manure stored on open feedlot surface; 50-60 40-50
only the solids are spread8. Poultry layer manure stored in roofed 30-40 60-70
shallow pit cleaned every 3 to 6 months9. Broiler manure on sawdust or shavings in warm, 45-55 45-55
humid climate; house cleaned every 4 months10.Poultry layer manure in cool humid climate; 50-60 40-50
stored in roofed, fan-ventilated pits cleaned yearly

102 Utilization of Organic Waste
Agronomy Handbook Virginia Cooperative Extension
Table 4 shows the wide range in nutrient composition of manures sampled from numerous farms in Virginiafollowing the effects of considerable collection and storage losses of nitrogen. It is not advisable to use averagenutrient contents when determining manure application rates because of the great variability in the values. Themost accurate way to determine nutrient content of manure is by laboratory analysis. The minimum analysisshould include: percent dry matter, ammonium nitrogen (NH
4-N), total Kjeldahl nitrogen (TKN), phosphorus (as
P or P2O
5) and potassium (as K or K
2O). Organic nitrogen can be calculated as the difference between total
Kjeldahl nitrogen and ammonium nitrogen (i.e., TKN - NH4-N). Nitrate nitrogen is normally so low in manure
that its concentration is not determined.
BiosolidsBiosolids vary widely in their chemical, biological, and physical properties. The determining factors include thesource and composition of the sewage, the treatment system, the extent to which the material is digested andstabilized, and the handling method between processing and application to the soil.
Nineteen studies of municipal biosolids from 45 sites in seven southern states demonstrated enormous variabilityin composition (Table 5). Because composition varies greatly, each type of biosolid intended for use on agricul-tural land must be analyzed separately. The concentrations of nitrogen and phosphorus in biosolids are similar tothose in animal manures, while potassium in biosolids is much lower than those in most animal wastes.
Although the source of the biosolids affects its nitrogen content, the type of biosolids treatment may be just asimportant a determining factor. Median total nitrogen concentrations in biosolids subject to various types oftreatment were 4.8% for aerobic digestion, 4.2% for anaerobic digestion, and 1.8% for combined lagooned,primary, tertiary, and other unspecified processes (Sommers et al., 1977).
Most biosolids contain both organic and inorganic forms of nitrogen. Inorganic nitrogen is normally present aseither ammonium (NH
4+) or nitrate (NO
3-), with the proportion of each being dependent on the waste treatment
process employed. Aerobic digestion results in mineralization of organic N to NH4+ and nitrification of NH
4+ to
NO3-. In contrast, only NH
4+ is present in anaerobically digested biosolids. In anaerobically digested biosolids,
about 20 to 50% or more of the N is NH4-N, with very little NO
3-N. If wastes are stored in a lagoon before
application, inorganic N can be lost through ammonia (NH3) volatilization and denitrification.
In contrast to nitrogen, most of the phosphorus in biosolids is in the inorganic form. The inorganic phosphoruscontent of eight biosolids analyzed by Sommers et al. (1976) averaged 73% of the total P content. Biosolids aregenerally considered poor sources of plant available potassium, primarily due to the low concentrations of potas-sium in biosolids. Potassium is a soluble constituent in wastewater sewage and is largely lost in the treated anddischarged effluent.
Table 4. Mean, Minimum and Maximum Amounts of NITROGEN, PHOSPHORUS, AND POTASSIUM inManure from Various Animal Types and Handling Systems Tested by the Virginia Tech WaterQuality Laboratory, January 1989 to November 1992. (Source: E.R. Collins)
Manure Type TKN NH 4-N P2O5 K2O
(No. of samples) Mean Range Mean Range Mean Range Mean Range
Liquid:Dairy (434)a 22.6 1.0-52.5 9.6 0.0-44.6 12.1 0.0-37.2 18.9 0.0-48.8Swine (109)a 10.0 0.6-58.5 5.3 0.3-25.8 5.7 0.4-61.5 5.7 0.1-23.5Poultry (14)a 51.1 4.5-89.1 33.0 0.6-66.3 41.0 0.6-100.3 30.5 2.0-53.4Semi-solid:Dairy (46) 10.5 3.4-23.6 3.2 0.1-7.8 6.1 2.2-19.1 8.7 2.0-16.0Beef (18) 12.8 7.8-23.9 2.6 0.2-15.5 6.7 2.5-14.6 11.8 4.4-30.9Dry:Broiler Litter (254) 62.6 5.7-99.5 11.8 0.2-25.8 62.1 22.7-119.4 28.6 3.3-53.3Layer/breeder (54) 36.5 9.1-110.6 9.0 0.2-29.6 65.1 9.8-149.7 24.2 4.8-50.2a Values presented in lbs/1000 gals. All other values in lbs/ton.

Utilization of Organic Waste 103
Virginia Cooperative Extension Agronomy Handbook
Table 5. Properties of Municipal Biosolids from Several Southern States (King et al., 1986)
Number of samples Range Mean Median a
Solids content ofliquid biosolids (%) 13 0.6-7.1 3.8 4.4
Ash (% of solids) 16 19-59 43.0 47.0
pH 8 5.4-7.0 6.1 5.9
Total N of solids (%) 21 0.6-7.5 3.0 2.6Total Na of liquidfraction (mg/L) 13 7-730 280 290
Total P of solids (%) 40 0.4-5.3 1.8 1.6
Total K of solids (%) 40 < 0.1-1.0 0.2 0.2
Total Ca of solids (%) 39 < 0.1-6.0 1.5 1.3
Total Mg of solids (%) 39 0.1-0.5 0.2 0.2a Predominantly NH4-N.
Industrial sludgeData on solids, ash, and macronutrients in sludges generated by textile mills, fermentation processing, and woodprocessing are summarized in Table 6. The nitrogen content of textile and fermentation wastes is generallycomparable to that of municipal biosolids, but the nitrogen content of wood processing wastes is usually muchlower. The concentrations of other macronutrients are generally low compared to manures and biosolids.
Factors that affect nutrient availability
The availabilities of nutrients in organic wastes are due to differences in composition and form of nutrients. Thefollowing sections on specific nutrients are generally true for all organic wastes.
NitrogenNitrogen occurs primarily in two forms in organic wastes - inorganic N, largely as ammonium (NH
4+), and organic
N. The ammonium nitrogen is immediately available to crops, but it can readily be converted to ammonia (NH3),
which is easily lost to the atmosphere. Organic nitrogen must be mineralized to ammonium by soil microorgan-isms before it can become available for uptake by plants.
Table 6. Properties of Industrial Wastes from Several Southern States (King et al, 1986)
Textile mill sludge Fermentation sludge Paper mill sludgeMedian Range Median Range Median Range
Solids content ofliquid wastes (%) 6.9 0.6-13.5 19 13-54 12.4 ——
Ash (% of solids) 43 14-76 49 37-66 45 6-67
Total N of solids (%) 2.8 1.0-7.9 3.5 2.0-7.0 0.4 0.3-2.3
Total Na of liquidfraction (mg/L) 22 16-112 340 19-680 —— ——
Total P of solids (%) 0.9 0.3-2.0 0.2 0.1-0.7 0.1 <0.1-0.30
Total K of solids (%) 0.2 0.1-0.3 0.1 <0.1-0.2 0.1 <0.1-9.3
Total Ca of solids (%) 0.5 0.1-0.8 5.2 <0.1-9.8 0.8 0.3-9.8
Total Mg of solids (%) 0.2 0.1-0.4 <0.1 <0.1-0.2 0.1 <0.1-0.7a Predominantly NH4
+-N

104 Utilization of Organic Waste
Agronomy Handbook Virginia Cooperative Extension
Nitrate (NO3-) concentrations in manure and biosolids are usually low and contribute little to the immediately
available plant nitrogen pool; however, nitrate-N is rapidly produced by the microbial process of nitrification fromammonium either added directly to the soil or mineralized from organic nitrogen. The resulting inorganic nitrogenis available to the crop as ammonium and nitrate.
In summary, factors that determine the rate and timing of nitrogen availability to crops from organic wastesinclude:1. Amount of NH
4-N in the manure;
2. Application method and resulting atmospheric loss of NH3; and
3. Rate of mineralization of organic N to plant available forms.
Organic wastes should not be applied in excess of the agronomic N rate, which is the rate required to supply thenitrogen needs of the target crop. Therefore, the application rate should be based on the amount of plant availableN in the waste unless another constituent (e.g., P, lime equivalent) limits the application rate to a greater extent.
Ammonia (NH3) is extremely volatile. Its loss during storage and from the soil surface after application may be as
great as 70% of the total amount of manure or biosolids nitrogen. All of the ammonium is immediately availablefor plant utilization. The value and amount of nitrogen utilized by the crop will depend on how much ammoniahad been conserved during handling. The values in Table 7 and 8 provide estimates on what fractions of ammo-nium in organic wastes are available for plant uptake under different incorporation timing schemes.
Table 7. Fraction of Ammonium Nitrogen in Animal Manure Considered to be Available for PlantUptake (Source: Virginia Department of Conservation and Recreation, 1995)
LiquidMethod of Semi-solid Manure Lagoon Dryapplication manure slurry liquid litter
Fraction of available N
Injection ——- 0.95 0.95 ——-
Broadcast withimmediateincorporation 0.75 0.75 0.90 0.90
Incorporatedafter 2 days 0.65 0.65 0.80 0.80Incorporatedafter 4 days 0.40 0.40 0.60 0.65Incorporatedafter 7 days 0.25 0.25 0.45 0.50Irrigationwithoutincorporation ——- 0.20 0.50 ——
Table 8. Fraction of Ammonium Nitrogen (NH 4-N) in Biosolids Considered to be Available forPlant Uptake (Source: Virginia Department of Health, 1997)
Management practice Biosolids pH<10 Biosolids pH>10
Fraction of available N
Injection below surface 1.00 1.00Surface application with:Incorporation within 24 hours 0.85 0.75Incorporation within 1-7 days 0.70 0.50Incorporation after 7 days 0.50 0.25

Utilization of Organic Waste 105
Virginia Cooperative Extension Agronomy Handbook
Mineralization of organic nitrogen to a plant-available form occurs in two phases. The first phase includes the lessresistant organic nitrogen, which mineralizes during the first year of application. The second phase includes themore resistant residual organic nitrogen, which mineralizes very slowly in future years. Repeated yearly applica-tions to the same field result in an accumulation of a slow-release (residual) manure or biosolids nitrogen sourcefrom present and past applications.
Available nitrogen from mineralization of organic nitrogen can be estimated using coefficients determined fromexperimentally-derived decay series. The fractions listed in Tables 9 and 10 are for the mineralization of manuresand biosolids. As an example, the decay series of 0.35-0.12-0.05 for dairy manure means that 35 percent of theorganic nitrogen is mineralized during the year applied, 12 percent of the initial organic nitrogen remaining afterthe first year is mineralized during the second year, and 5 percent of the initial organic nitrogen remaining afterthe second year is mineralized during the third. The nitrogen remaining after the first year that will becomeavailable for plant use in subsequent years is called residual nitrogen.
There are no universal decay series across the United States because the rate of microbial breakdown dependsprimarily upon soil characteristics and climatic conditions. The decay series is for the stable organic nitrogen onlyand does not include ammonium, which is 100% available.
Table 9. Available Fractions of Remaining Organic Nitrogen During the Three Years afterApplication of Various Animal Manures (Source: Virginia Department ofConservation and Recreation, 1995)
Year Year YearAnimal Type One Two Three
Fraction of Available N
Dairy & Beef 0.35 0.12 0.05
Swine 0.50 0.12 0.05
Poultry 0.60 0.12 0.05
Table 10. Available Fractions of Remaining Organic N During the Three Years After Applicationof Variously Treated Biosolids (Source: Virginia Department of Health, 1997)
Year Year YearOne Two Three
Fraction of Available N
Primary 0.30 0.15 0.07
Waste activated 0.40 0.20 0.10
Aerobically digested 0.30 0.15 0.08
Anaerobically digested 0.20 0.10 0.05
Lime stabilized 0.30 0.15 0.08
Composted 0.10 0.05 0.03
Calculations of plant available nitrogen (PAN) from organic waste will include the portion of the ammo-nium that is not lost by volatilization and a portion of the stable organic nitrogen. The amount of PAN inorganic wastes can be estimated by:
PAN =NO3-N + x (NH
4-N) + y (Organic N).
Where x is the fraction of NH4-N that does not volatilize (values found in Tables 7 and 8) and y is the
fraction of organic N expected to mineralize (values found in Tables 9 and 10).

106 Utilization of Organic Waste
Agronomy Handbook Virginia Cooperative Extension
Phosphorus and potassiumManure and biosolids are excellent sources of phosphorus (P). Much of the phosphorus in manure may be organi-cally-complexed and, like organic nitrogen, must mineralize before it is available for utilization by plants. Organicphosphorus in wastes mineralizes rapidly and is readily plant-available. The phosphorus in biosolids, which existslargely in inorganic forms complexed by iron compounds, may be somewhat less plant-available than the phos-phorus in manures. Ultimately, the plant availability of phosphorus from organic wastes is controlled by soilchemical reactions in the same way that soil chemistry controls the availability of phosphorus from inorganicfertilizer. The availabilities of phosphorus in manure and biosolids are estimated as 90 to 95% and 50 to 95% offertilizer phosphorus, respectively.
Manure potassium (K), chiefly present in the urine as inorganic potassium, is chemically equivalent to fertilizerpotassium (i.e., it is available for plant growth in the year it is applied). Biosolids are generally poor sources ofplant available potassium due to its presence in low concentrations; however, potassium in biosolids is normallyassumed to be 100% plant available.
Essentially all of the potassium and most of the phosphorus supplied in organic wastes is plant-available. Theamount of manure required to meet crop phosphorus and potassium requirements can be calculated by using acombination of soil testing and manure analysis.
Secondary and micronutrientsManures and biosolids contain secondary macronutrients (i.e., calcium, magnesium and sulfur) and micronutrients(i.e., manganese, iron, copper, zinc, boron, molybdenum) which are not commonly applied in commercial fertil-izer unless specifically recommended. Organic wastes provide some insurance against yield reductions due toinsufficient secondary and trace nutrients when the cost of applying such nutrients in commercial fertilizer cannotbe justified because of the lack of evidence of a consistent yield response.
Some trace elements may accumulate to concentrations in the soil that are phytotoxic (e.g., zinc, copper, nickel)or in plants that are toxic to livestock (e.g., molybdenum) or humans (e.g., arsenic, cadmium) if organic wastescontaining high concentrations of these trace elements are applied. The permissable concentrations of these traceelements in biosolids and industrial sludges are strictly regulated. Concentrations of these elements in manure donot normally pose health, environmental, or agronomic risks, but their soil accumulation and bioavailabilityshould be monitored where continuous applications of some types of manure have been made.
LimeThe addition of lime in some biosolids stabilization treatment processes can provide calcium carbonate equivalen-cies of 10-50 percent. It is possible that the lime potential of these biosolids can limit waste application rates onpoorly-buffered, coarse-textured (i.e., sandy) soils having a high soil pH. Preventing the pH of these soils fromrising above about 6.8 is necessary to eliminate the risk of inducing micronutrient (e.g., manganese in small grainsand soybean, zinc in corn) deficiencies.
Best management practices
Wastes must be well managed to reap agronomic benefits and to reduce environmental and health risks. Overall,the most important factors in preventing nutrient loss include field application methods, timing of application, andapplication rate.
Application rateWaste application rates should balance nutrient content in the waste with crop nutrient demands based on realisticyield goals. The ratio of N:P
2O
5:K
2O in organic wastes usually does not match the ratio of the nutrients needed by
the crop; however, an appropriate rate can be calculated by basing it on the nutrient that is the most limiting tocrop growth. Generally, the nutrient that determines the overall application rate is nitrogen.

Utilization of Organic Waste 107
Virginia Cooperative Extension Agronomy Handbook
The total phosphorus application rates are generally much higher than crop needs when a waste application rate isbased on plant available nitrogen (PAN). For example, biosolids having 1.3% PAN and 1.0% total P (2.3% P asP
2O
5) applied to supply 150 lbs PAN per acre would also apply 115 lbs P or 265 lbs P
2O
5 per acre. Crop nitrogen
removal is normally two to four times higher than phosphorus removal. Therefore, continuous application ofwastes based on agronomic nitrogen rates will build soil phosphorus concentrations many-fold higher thanrequired. (See Nutrient Removal by Crops table, Part VII Soil Testing & Plant Analysis) Phosphorus runoff fromsoils where continuous applications of organic wastes have built soil phosphorus to excessive levels poses anenvironmental threat to the health of surface waters. It is advisable to apply wastes at rates recommended by themost limiting of soil test P/crop P removal or agronomic N rate.
Application methodSoil incorporation captures more of the NH
4-N than surface application of waste. Research has shown that 20% of
the nitrogen may be lost to the atmosphere in the first six hours after spreading manure on the soil surface, andnearly 50% can be lost after four days (Table 11). Plowing or disking of manure, biosolids, and other sludges intothe soil shortly after application, or injecting the waste into the soil reduces such losses.
Table 11. Relative Effectiveness of Manure in Increasing Crop Yields as Influenced by TimeBetween Spreading and Plowing Under (Salter and Schollenberger, 1939)
Relative value in increasing crop yieldTreatment (Average of 34 experiments)Manure plowed under immediately 100
Manure plowed under 6 hr after spreading 85
Manure plowed under 24 hr after spreading 73
Manure plowed under 4 days after spreading 56
Application timingWastes should be applied as closely as possible to the time of maximum crop nutrient uptake to ensure that thenitrogen will be available to crops rather than lost to surface water, groundwater, or the atmosphere. Fall andwinter applications of biosolids and manures should be avoided unless actively growing winter cover crops arepresent. Without an actively growing crop, nitrate nitrogen may leach to groundwater or be transported to surfacewater. Surface applications of biosolids and manures containing high concentrations of ammonium nitrogenduring hot dry periods can result in large losses of ammonia.
Cropping systemsThe most appropriate crops for the use of manure and biosolids are those that have relatively high nitrogenrequirements (i.e., corn, small grains, pasture grasses). Application of manure and biosolids to legumes such assoybean or alfalfa is generally not an efficient use of nitrogen, since rhizobial bacteria associated with the roots oflegumes fix N from the atmosphere; however, if no other appropriate crop is available, soybean and alfalfa willeffectively use manure nitrogen.
Biosolids and industrial sludges are particularly useful in the reclamation of surface-mined areas, sand tailingspiles, borrow pits, and other disturbed land areas. Soils on these sites lack organic matter and nitrogen, they areusually acid (low pH) and low in available phosphorus and potassium, and have poor physical structure. Thepotential for groundwater pollution from biosolids application may be greater on surface-mined sites than onundisturbed sites, unless a vegetative cover is established, because the soil strata may be disturbed well below thesurface.
Site managementProtection of water resources from nutrients, especially nitrogen and phosphorus, and pathogens must be consid-ered when handling and utilizing manures and biosolids. Drainage from feedlots and storage lagoons should notbe permitted to flow into streams and reservoirs. Proper field management must begin at the unloading site. Soil

108 Utilization of Organic Waste
Agronomy Handbook Virginia Cooperative Extension
compaction may occur due to the weight of the wastes and vehicles transporting the material if soil moisture ishigh.
Steps should be taken to prevent soil erosion as a direct result of land application practices. Detrimental waterquality impacts from manures and biosolids can be avoided by employing conservation tillage practices thatreduce erosion and prevent the movement of sediment and waste constituents to surface water. Water pollutionproblems caused by movement of waste constituents in runoff water can be minimized by use of grassed bufferstrips along waterways adjacent to application sites.
Liquid waste injection practices can affect the amount of soil erosion that occurs. Driving the applicator vehicleacross the slope instead of up and down reduces erosion. Injecting the liquid wastes up and down the slopeprovides channels for water and intensifies erosion potential in the same way as plowing or cultivating up anddown the slope. Using injectors in muddy soils results in much the same type of soil structural damage as plowingwhen the soil is too wet. Clay soils, in particular, become cloddy and adequate seedbed preparation is verydifficult if stirred when wet. Applicator vehicles with high flotation tires reduce compaction damage in the upperzone of wet soils; however, compaction in the 12 to 24 inch depth is a function of total axle weight.
The environment must not be degraded by allowing waste constituents to leave the site by overland flow. Manureor biosolids should not be spread on frozen ground, near sinkholes or rock outcrops, or on steep slopes wherenutrients can leach or runoff into ground- or surface water. Even sites with a very slight slope can cause severerunoff problems from rain or melting snow on top of frozen ground.
In summary, the relative risks of all waste application options must be considered in arriving at policies andpractices to manage their use on land effectively. Awareness of the agricultural, health, and environmental ben-efits, costs, and impacts are critical to developing publicly acceptable management programs.
References
Barker, J.C. 1980. Livestock manure production rates and approximate fertilizer content. North Carolina Agric.Ext. Service Leaflet No. 198. Raleigh, NC.
Evanylo, G.K. 1994. Mineralization and availability of nitrogen in organic waste-amended mid-Atlantic soils.P.77-103. In S. Nelson and P. Elliott (ed.) Perspectives on Chesapeake Bay, 1994: Advances in estuarine sciences.CRC Publication No. 147. Chesapeake Research Consortium, Inc., Edgewater, MD.
Evanylo, G.K. 1999a. Agricultural land application of biosolids in Virginia: Production and characteristics ofbiosolids. Virginia Coop. Ext. Publ. No. 452-301. 6 p.
Evanylo, G.K. 1999b. Agricultural land application of biosolids in Virginia: Regulations. Virginia Coop. Ext.Publ. No. 452-302. 8 p.
Evanylo, G.K. 1999c. Agricultural land application of biosolids in Virginia: Managing biosolids for agriculturaluse. Virginia Coop. Ext. Publ. No. 452-303. 8 p.
Evanylo, G.K. 1999d. Agricultural land application of biosolids in Virginia: Risks and concerns. Virginia Coop.Ext. Publ. No. 452-304. 6 p.
King, L.D., R.W. Taylor, and J.W. Shuford. 1986. Macronutrients in municipal and industrial sludges and cropresponse to sludge additions. p. 11-19. In L.D. King (ed.) Agricultural use of municipal and industrial sludges inthe southern United States. Southern Cooperative Series Bulletin 314. North Carolina State University, Raleigh,NC.

Utilization of Organic Waste 109
Virginia Cooperative Extension Agronomy Handbook
Salter, R.M. and C.J. Schollenberger. 1939. Farm manure. Ohio Agric. Exp. Sta. Bull. No. 605.
Sommers, L.E. 1977. Chemical composition of sewage sludges and analysis of their potential use as fertilizers. J.Environ. Qual. 6:225-239.
Sommers, L.E., D.W. Nelson, and K.J. Yost. 1976. Variable nature of chemical composition of sewage sludges. J.Environ. Qual. 5:303-306.
Vanderholm, D.H. 1975. Nutrient losses from livestock waste during storage, treatment, and handling. In Proceed-ings of the Third International Symposium on livestock wastes. American Society of Agricultural Engineering.
Virginia Department of Conservation and Recreation. 1995. Virginia nutrient management standards and criteria.Richmond, VA. 64 p.
Virginia Department of Health. 1997. Biosolids use regulations. 12 VAC 5-585, 32.1-164.5 of the Code of Vir-ginia. Richmond, VA. 60 p

110 Utilization of Organic Waste
Agronomy Handbook Virginia Cooperative Extension

Herbicide Considerations 111
Virginia Cooperative Extension Agronomy Handbook
PART XIIHerbicide Considerations
E. Scott Hagood, Extension Weed Specialist
Management of herbicide resistant weeds
Since the initial development of selective herbicides in the late 1940’s, farmers have relied heavily on thesematerials to provide effective and economical control of weeds. Herbicide use has allowed tremendous advancesin our agricultural productivity. The relatively recent development of resistance in various weed species to com-monly used herbicides represents one of the most serious threats to profitable agronomic crop production. Manyfactors involving the characteristics of both the target weed and the herbicide determine whether resistance willoccur, and the rate at which resistant species develop. The following is a brief discussion of the factors involved inthe development of herbicide resistance, and appropriate methods for management of resistant weeds.
Resistance, as defined by the Weed Science Society of America, is the naturally occurring inheritable ability ofsome weed biotypes within a population to survive a herbicide treatment that would, under normal conditions ofuse, effectively control that weed population. The genetic change which confers resistance to certain members orbiotypes within a given weed species is naturally occurring, and can allow those weeds to survive a herbicideapplication in a number of distinct ways. The most common mechanism for resistance is alteration of the targetenzyme site of herbicide binding. In the susceptible species, the herbicide would bind to an enzyme in such amanner as to prevent its catalyzation of a necessary metabolic reaction, thereby causing death of the plant. Inweeds with the altered binding site, however, the herbicide cannot bind, and the reaction proceeds without delete-rious effect on the plant. Increased herbicide metabolism also accounts for herbicide resistance in some weeds, inwhich the herbicide is rapidly degraded to nontoxic forms in the resistant biotype but is retained primarily in itstoxic form in the susceptible biotype. A third resistance mechanism involves enzyme amplification or overproduc-tion in the resistant biotype, wherein increased levels of the enzyme allow a requisite reaction to proceed at anormal rate despite the presence of the herbicide.
Many factors determine the likelihood of the development of resistance in a weed species to a specific herbicide.Herbicides with high specificity in mode of action provide a much greater potential for resistance. Where alter-ation of the target site is the mechanism for resistance, and the herbicide is specific to inhibition of a singleenzyme, simple single gene mutations can result in resistant individuals. Conversely, herbicides with broadereffects on multiple sites or functions provide relatively little potential for the development of resistance. Herbicidepersistence also affects the potential for the development of resistance, because the length of time that the selec-tion pressure is present directly influences the likelihood that resistant individuals will be identified. Continueduse of the same herbicide, or herbicides with the same mode of action, also dramatically increases the potential forresistance.
The potential for resistance is also determined by characteristics of the weed species. Species with high seedproduction and rapid turn over of the weed seed bank in the soil are most likely to develop resistance. The rate ofresistance development is also determined by the extent to which a mutation which confers resistance is distrib-uted throughout the population prior to initiation of the selection pressure via the herbicide. Fitness of the resistantindividuals also determines the extent to which this biotype will become a constraint to production, where a lessfit resistant biotype will pose a lesser threat to production than a resistant biotype with fitness similar to or ex-ceeding that of the susceptible biotype.
In Virginia, triazine resistant pigweed is currently the most prevalent herbicide resistant weed species. Thisproblem arose due to an altered target site and reduced susceptibility of this pigweed biotype to triazine herbicidesincluding atrazine, simazine (Princep), and cyanazine (Bladex). The resistant pigweed biotype spread rapidly inwestern and southwestern Virginia due to continuous no-till corn production and continuous use of atrazine plussimazine. The resistant biotype has subsequently spread across Virginia, but this eastward movement was slowedby the fact that the corn/soybean rotation common in eastern Virginia introduced alternative rotational herbicides.Other resistant weed species confirmed in Virginia include triazine resistant common lambsquarters, imazethapyr

112 Herbicide Considerations
Agronomy Handbook Virginia Cooperative Extension
Herbicide resistant weed species must be managed with a combination of herbicidal, cultural, and mechanicalweed control techniques. Crop rotation, where appropriate, is critical to successful resistant weed management, asit may allow the use of a more competitive crop or a crop whose life cycle and associated management andharvest procedures disrupt the life cycle of the resistant species. Most critical to resistant weed management,however, is herbicide rotation. Whether in a continuous crop, or in a crop rotation, herbicide rotation must beemployed to prevent the development of new herbicide resistant weed species or to manage existing weed species.Rotation of herbicides with differing modes of action and with high efficacy on the target species will prevent aresistant biotype from developing to the point that it constrains production. Combination of herbicides within anapplication or within a growing season is also effective for resistant weed management, where combinations ofdiffering modes of actions will control an existing resistant biotype as well as prevent the development of newresistant species. As stated, the use of herbicides with high specificity in terms of mode of action increases thelikelihood of the development of resistance. Herbicide rotations or combinations involving two herbicides withmodes of action with this degree of specificity should be avoided if possible due to the possibility of the develop-ment of resistance to both compounds (multiple resistance).
Chemical combinations or rotations employed without knowledge of the mode of action of the herbicides beingused cannot constitute meaningful resistance management. The Pest Management Guide for Field Crops, VCEPublication 456-016, contains tables which relate the active ingredients in all recommended single ingredient andprepack herbicides for agronomic crops, as well as tables relating the mode of action of each herbicide and itseffectiveness on individual weed species. Taken in total this information can easily be used to formulate effectiveprograms for the management of resistant weed species.
Rainfree Periods for Post Emergence Herbicides
Information as a guide to pre-pack herbicide mixes, guide to single active ingredient herbicides, and herbiciderecommendations are available in The Pest Management Guide for Field Crops, VCE Publication 456-016 which isrevised annually.
The table below is included in this reference publication because rainfall is difficult to predict in our environment,especially in the summer. The table shows the critical time between application and rainfall varies from only 30minutes to eight hours.
Rainfree Periods for Postemergence Herbicides
Herbicide Hours Herbicide Hours
Accent 4 Harmony Extra 3
Aim 1 Hoelon Not specific
Assure II 1 Hornet 4
Ally 4 Laddok S-12 8
Atrazine 1-2 Liberty 4
Banvel 4 Liberty ATZ 4
Basagran 8 Lightning 1
Basis 4 Marksman 6
Basis Gold 4 Northstar 4
Beacon 4 Peak 4
Bladex 1-2 Permit 4Blazer 6 Pinnacle 1
Buctril 1 Poast Plus/Poast 1
(Pursuit) resistant pigweed, diclofop (Hoelon) resistant annual ryegrass, and sethoxydim (Poast Plus) resistantjohnsongrass. It is important to note that these weeds may also exhibit resistance to other herbicides in the samechemical family or in the same mode of action group.
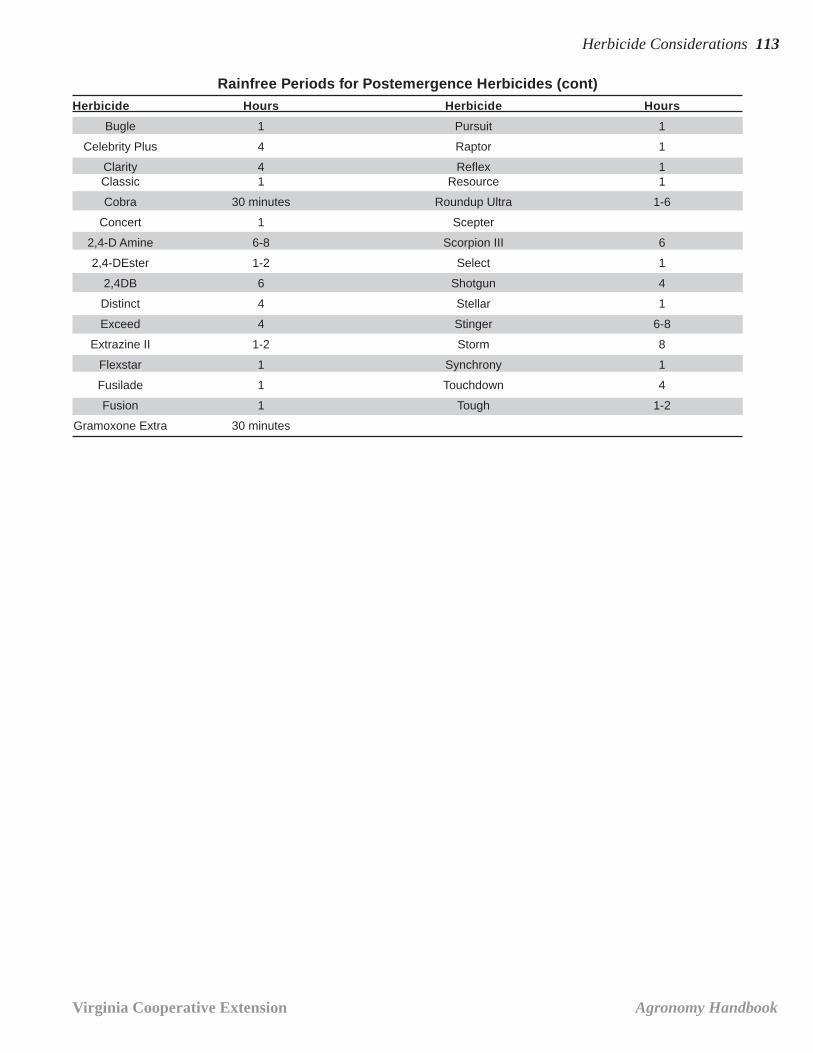
Herbicide Considerations 113
Virginia Cooperative Extension Agronomy Handbook
Rainfree Periods for Postemergence Herbicides (cont)Herbicide Hours Herbicide Hours
Bugle 1 Pursuit 1
Celebrity Plus 4 Raptor 1
Clarity 4 Reflex 1Classic 1 Resource 1
Cobra 30 minutes Roundup Ultra 1-6
Concert 1 Scepter
2,4-D Amine 6-8 Scorpion III 6
2,4-DEster 1-2 Select 1
2,4DB 6 Shotgun 4
Distinct 4 Stellar 1
Exceed 4 Stinger 6-8
Extrazine II 1-2 Storm 8
Flexstar 1 Synchrony 1
Fusilade 1 Touchdown 4
Fusion 1 Tough 1-2
Gramoxone Extra 30 minutes

114 Herbicide Considerations
Agronomy Handbook Virginia Cooperative Extension

General Compositions of Feeds 115
Virginia Cooperative Extension Agronomy Handbook
PART XIIIComposition of Feeds
Daniel E. Brann, Extension Grains SpecialistCharles C. Stallings, Extension Dairy Specialist
Feed composition varies greatly by plant species, stage of growth and environmental conditions. Thefollowing table was modified from Nutrient Requirements of Beef Cattle, National Research Council,7th revised ed., 1996. Terms used in the heading of the table are defined below:
Definition of Terms
b DM % AF: percent dry matter as fedc NDF % DM: neutral detergent fiber concentration as a percentage of dry matterd Lignin % NDF: lignin concentration as a percentage of neutral detergent fiber contente TDN % DM: total digestible nutrient concentration as a percentage of dry matterf ME Mcal/kg: metabolizable energy contentg NEma Mcal/kg: net energy content of feed for maintenanceh NEga Mcal/kg: net energy content of feed for gaini CP % DM: crude protein concentration as a percentage of dry matterj CIP % CP: degraded intake protain concentration as a percentage of crude protein contentk UIP % CP: ungraded intake protein concentration as a percentage of crude protein contentl SolP % CP: soluble protein concentration as a percentage of crude protein cententm NPN % SolP: nonprotein nitrogen concentration as a percentage of soluble protein contentn ADFIP % CP: acid detergent insoluble protein concentration as a percentage of crude protein contento Starch % NSC: starch concentration as a percentage of nonstructural carbohydrate contentp Fat % DM: fat concentration as a percentage of dry matterq Ash % DM: ash concentration as a percentage of dry matter

116 General Compositions of Feeds
Agronomy Handbook Virginia Cooperative ExtensionGra
ins
and
by-p
rodu
ct fe
eds
DM
ND
FLi
gnin
TDN
ME
NE
ma
NE
gaC
PD
IPU
IPS
olP
NP
NA
DFI
PS
tarc
hFa
tA
shC
omm
on N
ame
%A
Fb%
DM
c%
ND
Fd%
DM
eM
cal/k
gfM
cal/k
ggM
cal/k
gh%
DM
i%
CP
j%
CP
k%
CP
l%
Sol
Pm
%C
Pn
%N
SC
o%
DM
p%
DM
q
Bah
iagr
ass
Hay
90.0
072
.00
11.1
151
.00
1.84
1.00
0.45
8.20
63.0
037
.00
25.0
096
.00
6.50
6.00
1.60
11.0
0
Ber
mud
agra
ss L
ate
Vege
tativ
e91
.00
76.6
08.
5749
.00
1.77
0.93
0.39
7.80
85.0
015
.00
25.9
025
.40
8.90
6.00
2.70
8.00
Bro
me
Hay
Pre
-blo
om88
.00
55.0
07.
6960
.00
2.17
1.31
0.74
16.0
079
.00
21.0
025
.00
96.0
06.
506.
002.
6010
.00
Bro
me
Hay
Lat
e-bl
oom
91.0
068
.00
11.1
155
.00
1.99
1.14
0.58
10.0
059
.00
41.0
025
.00
96.0
06.
506.
002.
309.
00
Fesc
ue K
31 H
ay91
.00
62.2
06.
3561
.00
2.21
1.34
0.77
15.0
082
.00
18.0
025
.90
25.4
08.
906.
005.
509.
00
Fesc
ue K
31 H
ay F
ull-b
loom
91.0
067
.00
7.46
58.0
02.
101.
240.
6812
.90
77.0
023
.00
25.9
025
.40
8.90
6.00
5.30
8.00
Fesc
ue K
31 H
ay M
atur
e91
.00
70.0
010
.00
44.0
01.
590.
750.
2210
.80
86.0
014
.00
25.9
025
.40
8.90
6.00
4.70
6.80
Orc
hard
gras
s H
ay, E
arly
-blo
om89
.00
59.6
07.
7065
.00
2.35
1.47
0.88
12.8
077
.00
23.0
025
.00
96.0
05.
706.
002.
908.
50
Orc
hard
gras
s H
ay, L
ate-
bloo
m90
.60
65.0
011
.40
54.0
01.
951.
110.
558.
4064
.00
36.0
025
.00
96.0
06.
106.
003.
4010
.10
Ree
d C
anar
ygra
ss H
ay89
.00
64.0
06.
2555
.00
1.99
1.14
0.58
10.3
071
.00
29.0
025
.00
96.0
06.
106.
003.
1010
.00
Rye
gras
s H
ay88
.00
41.0
04.
8864
.00
2.31
1.44
0.86
8.60
65.0
035
.00
25.0
096
.00
5.70
6.00
2.20
10.0
0
Sor
ghum
Sud
an H
ay91
.00
66.0
06.
0656
.10
2.03
1.18
0.62
11.3
069
.00
31.0
020
.00
95.0
011
.00
10.0
01.
809.
60
Sor
ghum
Sud
an P
astu
re18
.00
55.0
05.
4565
.00
2.35
1.47
0.88
16.8
088
.00
12.0
045
.00
11.1
15.
0090
.00
3.90
9.00
Sor
ghum
Sud
an S
ilage
28.0
068
.00
7.04
55.0
01.
991.
140.
5810
.80
72.0
028
.00
50.0
090
.00
11.0
010
0.00
2.80
9.80
Tim
othy
Hay
Mid
-blo
om89
.00
63.7
07.
4657
.00
2.06
1.21
0.64
9.70
69.0
031
.00
25.0
096
.00
6.10
6.00
2.70
7.00
Tim
othy
Hay
Ful
l-blo
om89
.00
64.2
08.
8256
.00
2.02
1.18
0.61
8.10
62.0
038
.00
25.0
096
.00
6.10
6.00
2.90
5.20
Tim
othy
Hay
See
d S
tage
89.0
072
.00
12.5
047
.00
1.70
0.86
0.32
6.00
50.0
050
.00
25.0
096
.00
6.50
6.00
2.00
6.00
Alfa
lfa H
ay E
arly
-Veg
etat
ive
91.0
033
.00
18.1
866
.00
2.39
1.51
0.91
30.0
090
.00
10.0
030
.00
96.0
010
.00
10.0
04.
0010
.00
Alfa
lfa H
ay L
ate-
Vege
tativ
e91
.00
37.0
018
.92
63.0
02.
281.
410.
8327
.00
89.0
011
.00
30.0
093
.00
10.0
010
.00
3.80
9.00
Alfa
lfa H
ay E
arly
-Blo
om91
.00
39.3
020
.00
60.0
02.
171.
310.
7425
.00
88.0
012
.00
29.0
093
.00
11.0
010
.00
2.90
9.20
Alfa
lfa H
ay M
id-B
loom
91.0
047
.10
22.7
358
.00
2.10
1.24
0.68
22.0
084
.00
16.0
028
.00
93.0
014
.00
10.0
02.
608.
50
Alfa
lfa H
ay L
ate-
Blo
om91
.00
53.0
023
.02
52.0
01.
881.
040.
4917
.00
82.0
018
.00
26.0
092
.00
18.0
010
.00
1.50
8.00
Alfa
lfa S
ilage
Ear
ly-B
loom
35.0
043
.00
23.2
663
.00
2.28
1.41
0.83
19.5
092
.00
8.00
50.0
010
0.00
15.0
010
.00
3.70
9.50
Alfa
lfa S
ilage
Ful
l-Blo
om40
.00
51.0
023
.53
55.0
01.
991.
140.
5816
.00
91.0
09.
0040
.00
100.
0021
.00
10.0
02.
708.
00
Bird
sfoo
t Tre
foil,
Hay
91.0
047
.50
19.1
559
.00
2.13
1.28
0.71
15.9
082
.00
18.0
028
.00
96.0
014
.00
10.0
02.
107.
40
Clo
ver L
adin
o, H
ay89
.00
36.0
019
.44
60.0
02.
171.
310.
7422
.40
86.0
014
.00
30.0
096
.00
10.0
010
.00
2.70
9.40
Clo
ver R
ed H
ay88
.00
46.9
017
.86
55.0
01.
991.
140.
5815
.00
80.0
020
.00
25.0
092
.00
20.0
010
.00
2.80
7.50
Vetc
h H
ay89
.00
48.0
016
.67
57.0
02.
061.
210.
6420
.80
86.0
014
.00
28.0
096
.00
14.0
010
.00
3.00
7.00
Bar
ley
Sila
ge39
.00
56.8
05.
4460
.00
2.17
1.31
0.74
1.90
86.0
014
.00
70.0
010
0.00
6.10
100.
002.
928.
30
Bar
ley
Stra
w91
.00
72.5
013
.75
40.0
01.
450.
600.
084.
4030
.00
70.0
020
.00
95.0
065
.00
100.
001.
907.
50
Cor
n C
obs
Gro
und
90.0
087
.00
7.78
50.0
01.
810.
970.
422.
8022
.00
78.0
025
.00
10.0
010
.00
90.0
00.
601.
80
Par
t XIII
Gen
eral
Com
posi
tions
of F
eeds
a

General Compositions of Feeds 117
Virginia Cooperative Extension Agronomy HandbookGra
ins
and
by-p
rodu
ct fe
eds
DM
ND
FLi
gnin
TDN
ME
NE
ma
NE
gaC
PD
IPU
IPS
olP
NP
NA
DFI
PS
tarc
hFa
tA
shC
omm
on N
ame
%A
F%
DM
%N
DF
%D
MM
cal/k
gM
cal/k
gM
cal/k
g%
DM
%C
P%
CP
%C
P%
Sol
P%
CP
%N
SC
%D
M%
DM
Cor
n S
ilage
25%
Gra
in29
.00
52.0
09.
6268
.00
2.46
1.57
0.97
8.30
76.0
024
.00
55.0
010
0.00
9.00
100.
002.
108.
00
Cor
n S
ilage
35%
Gra
in33
.00
46.0
08.
7069
.00
2.49
1.60
1.00
8.60
77.0
023
.00
50.0
010
0.00
9.00
100.
002.
607.
00
Cor
n S
ilage
50%
Gra
in35
.00
41.0
07.
0075
.00
2.71
1.79
1.16
8.00
75.0
025
.00
45.0
010
0.00
7.88
100.
003.
504.
20
Cor
n S
ilage
Imm
atur
e (n
o ea
rs) 2
5.00
60.0
05.
0065
.00
2.35
1.47
0.88
9.00
78.0
022
.00
45.0
010
0.00
4.50
100.
003.
1011
.00
Cor
n S
ilage
Sta
lkla
ge30
.00
68.0
010
.29
55.0
01.
991.
140.
586.
3068
.00
32.0
045
.00
100.
004.
5010
0.00
2.10
9.00
Cor
n S
talk
s G
razi
ng50
.00
65.0
010
.00
65.8
52.
381.
500.
916.
5069
.00
31.0
020
.00
95.0
013
.57
10.0
02.
107.
20
Oat
Sila
ge D
ough
36.4
058
.10
16.0
759
.00
2.13
1.28
0.71
12.7
085
.00
15.0
050
.00
100.
0010
.00
100.
003.
1210
.10
Oat
Stra
w92
.20
74.4
020
.00
45.0
01.
630.
790.
254.
4055
.00
45.0
020
.00
95.0
065
.00
5.00
2.22
7.80
Oat
Hay
91.0
063
.00
9.09
53.0
01.
921.
070.
529.
5068
.00
32.0
030
.00
93.0
010
.00
90.0
02.
407.
90
Gra
in S
orgh
um S
ilage
30.0
060
.80
9.38
60.0
02.
171.
310.
749.
3973
.00
27.0
045
.00
100.
005.
0010
0.00
2.64
5.00
Whe
at S
ilage
Dou
gh35
.00
60.7
014
.81
57.0
02.
061.
210.
6412
.50
81.0
019
.00
45.0
010
0.00
8.00
100.
002.
507.
50
Whe
at S
traw
89.0
078
.90
16.4
741
.00
1.48
0.64
0.11
3.50
31.0
069
.00
0.00
95.0
065
.00
100.
002.
007.
50
Bar
ley
Gra
in H
eavy
88.0
018
.10
10.5
384
.00
3.04
2.06
1.40
13.2
066
.93
33.0
717
.00
29.0
05.
0090
.00
2.20
2.40
Bar
ley
Gra
in L
ight
88.0
028
.00
10.3
677
.00
2.78
1.85
1.22
14.0
066
.93
33.0
717
.00
29.0
05.
0090
.00
2.30
4.00
Cor
n H
omin
y90
.00
23.0
03.
6491
.00
3.29
2.27
1.57
11.5
047
.49
52.5
118
.00
78.0
05.
0090
.00
7.30
1.00
Cor
n G
rain
Cra
cked
88.0
010
.80
2.22
90.0
03.
252.
241.
559.
8044
.67
55.3
311
.00
73.0
05.
0090
.00
4.06
1.46
Cor
n D
ry E
ar 5
6 lb
/bu
87.0
028
.00
7.10
82.0
02.
962.
001.
359.
0046
.03
53.9
716
.00
69.0
03.
0090
.00
3.70
1.90
Cor
n G
roun
d G
rain
56
lb/b
u88
.00
9.00
2.22
88.0
03.
182.
181.
509.
8057
.37
42.6
311
.00
73.0
05.
0090
.00
4.30
1.60
Cor
n G
rain
Fla
ked
86.0
09.
002.
2293
.00
3.36
2.33
1.62
9.80
43.0
456
.96
8.00
73.0
05.
0090
.00
4.30
2.00
Cor
n H
M E
ar 5
6 lb
/bu
72.0
028
.00
7.10
85.0
03.
072.
091.
429.
0062
.05
37.9
530
.00
80.0
08.
2810
0.00
3.70
1.90
Cor
n H
M G
rain
56
lb/b
u72
.00
9.00
2.22
93.0
03.
362.
331.
629.
8067
.82
32.1
840
.00
100.
005.
3010
0.00
4.30
1.60
Cot
tons
eed
Bla
ck W
hole
92.0
040
.00
37.5
095
.00
3.43
2.38
1.67
23.0
069
.56
30.4
440
.00
2.50
6.00
90.0
017
.50
5.00
Cot
tons
eed
Hig
h Li
nt92
.00
51.6
034
.04
90.0
03.
252.
241.
5524
.00
69.5
630
.44
40.0
02.
506.
0090
.00
17.5
04.
16
Cot
tons
eed
Mea
l-mec
h92
.00
28.0
021
.43
78.0
02.
821.
881.
2444
.00
57.0
043
.00
20.0
040
.00
8.00
90.0
05.
007.
00
Cot
tons
eed
Mea
l-Sol
41%
CP
92.0
028
.90
23.0
875
.00
2.71
1.79
1.16
46.1
057
.00
43.0
020
.00
40.0
08.
0090
.00
3.15
7.00
Cot
tons
eed
Mea
l-Sol
43%
CP
92.0
028
.00
25.0
075
.00
2.71
1.79
1.16
48.9
057
.00
43.0
020
.00
40.0
08.
0090
.00
1.70
7.00
Mol
asse
s B
eet
77.9
00.
000.
0075
.00
2.71
1.79
1.16
8.50
100.
000.
0010
0.00
100.
000.
000.
000.
0011
.40
Mol
asse
s C
ain
74.3
00.
000.
0072
.00
2.60
1.70
1.08
5.80
100.
000.
0010
0.00
100.
000.
000.
000.
0013
.30
Oat
s 32
lb/b
u91
.00
42.0
09.
5273
.00
2.64
1.73
1.11
13.6
076
.55
23.4
553
.00
19.0
05.
0090
.00
4.90
5.00
Oat
s 38
lb/b
u89
.00
29.3
09.
3877
.00
2.78
1.85
1.22
13.6
083
.00
17.0
053
.00
19.0
05.
0090
.00
5.20
3.30
Ric
e G
rain
Gro
und
89.0
016
.00
13.0
079
.00
2.86
1.91
1.27
8.90
69.8
530
.15
40.0
050
.00
2.70
90.0
01.
905.
00
Rye
Gra
in88
.00
19.0
05.
3084
.00
3.04
2.06
1.40
13.8
078
.99
21.0
153
.00
19.0
04.
0090
.00
1.70
2.00

118 General Compositions of Feeds
Agronomy Handbook Virginia Cooperative ExtensionGra
ins
and
by-p
rodu
ct fe
eds
DM
ND
FLi
gnin
TDN
ME
NE
ma
NE
gaC
PD
IPU
IPS
olP
NP
NA
DFI
PS
tarc
hFa
tA
shC
omm
on N
ame
%A
F%
DM
%N
DF
%D
MM
cal/k
gM
cal/k
gM
cal/k
g%
DM
%C
P%
CP
%C
P%
Sol
P%
CP
%N
SC
%D
M%
DM
Sor
ghum
, Dry
Gra
in89
.00
13.3
06.
0976
.00
2.75
1.82
1.19
11.6
050
.76
49.2
412
.00
33.0
05.
0090
.00
3.10
2.00
Sor
ghum
, Rol
led
Gra
in90
.00
16.1
06.
0982
.00
2.96
2.00
1.35
12.6
043
.00
57.0
012
.00
33.0
05.
0090
.00
3.03
1.87
Sor
ghum
, Ste
am F
lake
d70
.00
23.0
06.
0988
.00
3.18
2.18
1.50
12.0
056
.40
43.6
012
.00
33.0
05.
0010
0.00
3.10
2.00
Whe
at G
roun
d89
.00
11.8
06.
2588
.00
3.18
2.18
1.50
14.2
077
.00
23.0
030
.00
25.0
02.
0090
.00
2.34
2.01
Whe
at M
iddl
ings
89.0
035
.00
5.95
83.0
03.
002.
031.
3718
.40
77.1
522
.85
40.0
075
.00
3.00
90.0
03.
202.
40
Whe
at G
rain
Har
d re
d sp
ring
88.0
011
.70
6.25
84.0
03.
042.
061.
4014
.20
73.9
526
.05
30.0
073
.00
2.00
90.0
02.
002.
00
Whe
at G
rain
Sof
t whi
te90
.00
9.70
4.29
85.0
03.
072.
091.
4911
.30
73.9
526
.05
30.0
073
.00
2.00
90.0
01.
902.
00
Bre
wer
s G
rain
21%
Dry
Mat
ter
21.0
042
.00
9.52
70.0
02.
531.
631.
0326
.00
40.8
659
.14
8.00
50.0
010
.00
100.
006.
5010
.00
Bre
wer
s G
rain
Deh
ydra
ted
92.0
048
.70
13.0
466
.00
2.39
1.51
0.91
29.2
034
.12
65.8
84.
0075
.00
12.0
010
0.00
10.8
04.
00
Can
ola
Mea
l92
.00
27.2
012
.76
69.0
02.
491.
601.
0040
.90
67.8
532
.15
32.4
065
.00
6.38
90.0
03.
477.
10
Cor
n G
lute
n Fe
ed90
.00
36.2
02.
2280
.00
2.89
1.94
1.30
23.8
075
.00
25.0
049
.00
100.
002.
0010
0.00
3.91
6.90
Cor
n G
lute
n M
eal
91.0
037
.00
2.70
84.0
03.
042.
061.
4046
.80
38.0
861
.92
4.00
75.0
02.
0010
0.00
2.40
3.00
Cor
n G
lute
n M
eal 6
0% C
P91
.00
8.90
7.14
89.0
03.
222.
211.
5266
.30
41.0
059
.00
4.00
75.0
02.
0010
0.00
2.56
2.86
Dis
tille
rs G
r.+ s
olub
les
25.0
046
.00
9.09
88.0
03.
182.
181.
5029
.50
27.1
972
.81
19.0
089
.00
21.0
010
0.00
10.3
05.
00
Dis
tille
rs G
r. D
ehy.
—Li
ght
91.0
046
.00
10.0
088
.00
3.18
2.18
1.50
30.4
027
.97
72.0
36.
0067
.00
13.0
010
0.00
9.80
4.00
Dis
tille
rs G
r. D
ehy.
—In
ter.
91.0
046
.00
10.0
088
.00
3.18
2.18
1.50
30.4
026
.35
73.6
56.
0067
.00
18.0
010
0.00
10.7
04.
60
Dis
tille
rs G
r. D
ehy.
—D
ark
91.0
046
.00
10.0
088
.00
3.18
2.18
1.50
30.4
025
.92
74.0
86.
0067
.00
21.0
010
0.00
9.80
4.00
Dis
tille
rs G
r. so
lubl
es d
ehy.
91.0
023
.00
4.35
88.0
03.
182.
181.
50
Dis
tille
rs G
r. W
et25
.00
40.0
010
.00
90.0
03.
252.
241.
5529
.70
45.0
954
.91
44.0
010
0.00
13.0
010
0.00
9.20
8.00
Lupi
ns90
.00
33.0
010
.00
78.0
02.
821.
881.
2426
.00
33.4
066
.60
25.0
068
.00
12.0
010
0.00
9.90
4.00
Pea
nut M
eal
92.4
014
.00
10.0
077
.00
2.78
1.85
1.22
34.2
069
.20
30.8
026
.00
23.0
03.
0090
.00
5.50
5.10
Soy
bean
Mea
l—44
89.0
014
.90
2.14
84.0
03.
042.
061.
4052
.90
80.0
020
.00
33.0
027
.00
1.00
90.0
02.
306.
30
Soy
bean
Mea
l—49
90.0
07.
792.
5087
.00
3.15
2.15
1.47
49.9
065
.00
35.0
020
.00
55.0
02.
0090
.00
1.60
7.20
Soy
bean
Who
le90
.00
14.9
01.
5494
.00
3.40
2.35
1.65
54.0
065
.00
35.0
020
.00
55.0
02.
0090
.00
1.10
6.70
Soy
bean
Who
le R
oast
ed90
.00
13.4
010
.00
94.0
03.
402.
351.
6540
.34
75.0
025
.00
44.0
022
.73
3.00
90.0
018
.20
4.56
Sun
flow
er S
eed
Mea
l90
.00
40.0
030
.00
65.0
02.
351.
470.
8842
.80
38.3
161
.69
5.70
100.
007.
2990
.00
18.8
05.
80
Ure
a99
.00
0.00
0.00
0.00
0.00
0.00
0.00
25.9
080
.00
20.0
030
.00
18.2
030
0.00
30.0
05.
0020
0.00
App
le P
omac
e22
.00
41.0
02.
0068
.90
2.49
1.60
1.00
0.00
0.00
100.
000.
000.
000.
000.
000.
0010
0.00
Bak
ery
Was
te92
.00
18.0
05.
5689
.00
3.22
2.21
1.52
5.40
48.2
151
.79
11.0
010
0.00
31.5
010
0.00
4.70
5.00
Soy
bean
Hul
ls91
.00
66.3
02.
9980
.00
2.89
1.94
1.30
0.00
100.
000.
000.
000.
000.
0010
0.00
7.90
10.0
0
a Nut
rient
Req
uire
men
ts o
f Bee
f Cat
tle, N
atio
nal R
esea
rch
Cou
ncil,
Sev
enth
Rev
ised
Edi
tion
1996
.

Diagnostic Laboratory Services 119
Virginia Cooperative Extension Agronomy Handbook
PART XIVDiagnostic Laboratory Services
Steven H. Umberger, Associate Director, Virginia Cooperative Extension, Agriculture and Natural Resources
NOTE: Access to the following laboratory services may be obtained through your local Virginia Coopera-tive Extension Office.
Manure testing
Funded through the Virginia Department of Conservation and Recreation (DCR), manure samples are sent to alaboratory at the University of Maryland for testing. Samples are analyzed for ammonia, copper, manganese,nitrogen, phosphate, potash, sulfur, zinc, and moisture content. Containers, sample forms, and instructions formailing can be obtained from a local Extension office. An agricultural Extension Agent or DCR nutrient manage-ment specialist should be consulted for interpretation of the results.
Charge – none
Pre-sidedress nitrate soil test for corn
Funded through the Virginia Department of Conservation and Recreation (DCR), field test kits are available formeasuring soil nitrate concentrations. These tests should be conducted on corn fields with a history of manure orbiosolids application within the previous three years, or on fields that received applications of commercial fertil-izer nitrogen of 30 pounds or less in a starter band, or less than 40 pounds broadcast at planting. Test results areused to determine the most appropriate level of nitrogen to be applied as a sidedress on corn. An Extension Agentor DCR nutrient management specialist should be contacted to assist with the test.
Charge - none
Soil testing
Soil samples are analyzed for specific soil nutrients to determine proper application rates of fertilizer and lime foroptimum plant growth. Routine analysis includes soil pH, P, K, Ca, Mg, Zn, Mn, Cu, Fe, and B. Soluble Saltsand Organic Matter tests are also available. Completed soil test results, along with a recommendation on fertiliza-tion and liming, are mailed to the client. Sampling and mailing instructions are found on the sample boxes andforms, which should be sent directly to the lab with the soil sample and payment.
Charges per sample: In-State Out-of-StateRoutine analysis (No charge for commercial farm samples ) $7.00 $10.50Soluble salts $3.00 $ 4.50Organic matter $3.00 $ 4.50FAX results $1.00 $ 1.50
Insect identification
Insect samples and insect damaged plant material are handled and processed through the insect identificationlaboratory. Insects from any structural, plant, or animal hosts are accepted. Insects are identified to the lowesttaxonomic level needed for control decisions. Control recommendations accompany insect identification results,which are sent back electronically to each Virginia Cooperative Extension office. Virginia Cooperative Extensionoffices are supplied with alcohol vials and mailing tubes for specimen shipment. Samples should not be submit-ted before reviewing instructions on the back of the insect identification submission form 444-113.
Charge – none

120 Diagnostic Laboratory Services
Agronomy Handbook Virginia Cooperative Extension
Plant disease and plant identification
The Plant Disease Clinic offers plant diagnostic services for diseases caused by fungi, bacteria, viruses, andnematodes, in addition to abiotic problems, such as environmental stress, herbicide injury, and air pollution injury.Both predictive and diagnostic nematode assay services are offered. Predictive assays monitor nematode popula-tions in soil where no plant problem has been observed, whereas diagnostic assays determine whether nematodefeeding is the cause of observed plant damage. The Clinic also performs plant and mushroom identifications,although weed identifications are done by the Weed Clinic. The local Extension office should be contacted forinformation on proper sampling technique and submission of samples. Submit plant samples for disease diagnosiswith submission form 450-097. Refer to the back of the form for information on proper sampling techniques.Submit soil samples for predictive nematode assays with submission form 450-098 and soil samples for diagnos-tic assays with submission form 450-901. Samples should be submitted early in the week to avoid weekend mail.
Charges -No charge for routine plant disease diagnosis, plant or mushroom identification, or diagnostic nematodeassays. A fee is charged for plants requiring virus detection. Charges vary, depending upon the number of anti-body tests conducted for virus identification.
The fee for predictive nematode assays is $11.00 for each soil sample submitted for routine analysis, and $19.00per soil sample submitted for routine analysis plus cyst counts.
Also see: http://www.ppws.vt.edu/~clinic
Weed identification
Weed samples submitted to the Plant Disease Clinic are processed and transferred to the Weed IdentificationClinic for identification and control recommendations. If possible, weed samples should include leaves, stems,roots, flowers, and seed. Samples should be accompanied by the Weed Identification submission form 450-138.
Charge –none
Also see: http://www.ppws.vt.edu/~clinic/weedid.html
Forage testing
Basic analysis results for forage, silage, and complete feed samples submitted to the Forage Testing Laboratoryinclude dry matter, crude protein, acid detergent fiber (ADF), and estimates of total digestible nutrients, netenergy, and digestible protein. In addition to the basic analysis, other analyses that may be conducted, includemacro minerals, trace minerals, nitrates, fat (ether extract), soluble protein, lignin, and neutral detergent fiber(NDF). Whole corn stalks or cobs must be pre-chopped before shipping.
Charges Per SampleBasic Analysis $10.00Macro minerals (Ca, P, Mg, K, Na, and S) $ 7.00Macro + trace minerals (Ca, P, Mg, K, Na, S, Zn, Cu, Mn, and Fe) $10.00Nitrates $ 5.00Fat $ 7.00Soluble protein $ 4.00Lignin $ 7.00Neutral detergent Fiber (NDF) $ 4.00
Toxicology
The Toxicology Laboratory has the capability to conduct analyses for heavy metals, minerals (deficiencies andpoisonings), Vitamins A and E, pesticides, rodenticides, mycotoxins, nitrate, and cyanide. The majority ofsamples submitted to the laboratory deal with forage and feed analyses for mycotoxins, nitrate, and cyanide.

Diagnostic Laboratory Services 121
Virginia Cooperative Extension Agronomy Handbook
Mycotoxins are typically not a problem in hay or haylage. Individuals unsure of the appropriateness of a sampleshould contact the toxicologist before sending the sample. A representative sample of at least one pound isadequate for feed and forage tests. A history, including feed type, type of animal, and clinical sign, should besubmitted with each sample.
Charge per sample
Aflatoxin (semi-quantitative) $20.00Zearalenone (semi-quantitative) $20.00Vomitoxin (semi-quantitative) $20.00Mycotoxin Screen for aflatoxin, zearalenone, and vomitoxin (semi-quantitative) $30.00Fumonisin – moldy corn poisoning of horses (semi-quantitative) $25.00Nitrate $14.00Cyanide – prussic acid (sample must be frozen) $15.00
Pesticide residues
The Pesticide Residue Laboratory conducts analyses of pesticides in soil, water, animal, and plant tissue samplesreferred through Virginia Cooperative Extension. Multi-residue pesticide analyses and pesticide-specific analysesassist in evaluating existing, or potential problems with field or ornamental crops, household water supplies,pesticide spills, and fish and wildlife poisonings. Analysis is dependent upon obtaining proper analytical method,having a standard of the pesticide in question, and having the instrumentation required for the analysis. Thelaboratory should be contacted before samples are collected and sent. A cover letter should accompany samples.The letter should contain the following information: sample identification, tests requested, and any other informa-tion that may add to optimizing the laboratory analysis.
Charge per sample:
Water scan minimum of $35.00Soil scan minimum of $45.00Plant scan minimum of $45.00Animal scan minimum of $45.00Individual pesticide analysis minimum of $25.00
Virginia Tech does not run plant tissue samples.

122 Diagnostic Laboratory Services
Agronomy Handbook Virginia Cooperative Extension

Commonly Used Weights & Measures 125
Virginia Cooperative Extension Agronomy Handbook
12 inches 14,520 yards = 43,560 feet20 inches 8,712 yards = 26,136 feet24 inches 7,260 yards = 21,780 feet30 inches 5,808 yards = 17,424 feet36 inches 4,840 yards = 14,520 feet40 inches 4,356 yards = 13,069 feet42 inches 4,149 yards = 12,446 feet
Mass and WeightUnit Number of Grams Approximate U.S. EquivalentMetric ton 1,000,000 1.1 tonsQuintal 100,000 220.46 poundsKilogram 1,000 2.2046 poundsHectogram 100 3.527 ouncesDecagram 10 0.353 ounceGram 1 0.035 ounceDecigram 0.10 1.543 grainsCentigram 0.01 0.154 grainMilligram 0.001 0.015 grain
Metric System - LengthUnit Number of Meters Approximate U.S. EquivalentMyriameter 10,000 6.2 milesKilometer 1,000 0.62 milesHectometer 100 109.36 yardsDecameter 10 32.81 feetMeter 1 39.37 inchesDecimeter 0.1 3.94 inchesCentimeter 0.01 0.39 inchMillimeter 0.001 0.04 inch
Metric system - AreaUnit Number of Square Meters Approximate U.S.EquivalentSquare kilometer 1,000,000 0.3861 square mileHectare 10,000 2.4700 acresAre 100 119.6000 square yardsCentare 1 10.7600 square feetSquare centimeter 0.0001 0.15500 square inch
Metric System - VolumeUnit Number of Cubic Meters Approximate U.S.EquivalentDecastere 10 13.100 cubic yardsStere 1 1.310 cubic yardsDecistere 0.10 3.530 cubic feetCubic centimeter 0.000001 0.061 cubic inch
Row Length/AcreRow Spacing Total Length

126 Commonly Used Weights & Measures
Agronomy Handbook Virginia Cooperative Extension
Metric System - CapacityApproximate U.S. Equivalent
Unit Number of Liters Cubic Dry Liquid
Kiloliter 1,000 1.31 cubic yards
Hectoliter 100 3.53 cubic feet 2.84 bushels
Decaliter 10 0.35 cubic feet 1.14 pecks 2.64 gallons
Liter 1 61.02 cubic inches 0.908 quart 1.057 quarts
Deciliter 0.10 6.10 cubic inches 0.18 pint 0.210 pint
Centiliter 0.01 0.60 cubic inches 0.338 fluid ounce
Milliliter 0.001 0.06 cubic inch 0.27 fluid dram
Energy Values
One horse power = 746 watts = force required to raise 33,000 lbs one ft per min
British thermal unit (BTU) = 252 calories
Calorie = the amount of heat needed to raise thetemperature of one gram of water, onedegree centigrade
One watt = the power developed in a circuit by a currentone ampere flowing through a potentialdifference of one volt - 1/746 horse power

Calibration of Sprayers 129
Virginia Cooperative Extension Agronomy Handbook
1 68 136 205 2 34 68 102 3 23 46 68 4 17 34 51 5 14 27 41 6 11 23 34 7 10 20 29 8 9 17 26 9 8 15 23 10 7 14 21
PART XVICalibration of SprayersDaniel E. Brann, Extension Grains Specialist
Be sure to calibrate your sprayer properly. Using too much pesticide may injure your crop; using too little mayresult in little or no pest control. Apply all pesticides at the recommended rate. Never exceed the labeled rate.Pressure, nozzle size, spacing of nozzles, and speed of the application all affect the application rate.
Large-Area Method of Calibration
1. Adjust tractor speed, pressure, and oriface size according to manufacturer’s directions.2. Measure and stake off one acre (43,560 sq ft) in the field to be treated.3. Fill tank on sprayer with water.4. Maintain constant pressure and speed in spraying the acre. Mark pressure, throttle, and gear settings.5. Remember -- the amount of water necessary to refill the tank is equal to gallons per acre.6. Make up the spray solution with the correct amount of chemical in the amount of water applied per acre.7. Make the application at pressure, throttle, and gear settings used in calibrating.
Short-Course Method of Calibration
1. Measure off a course of 163 1/3 feet in the field to be treated.2. Adjust tractor speed, pressure, and orifice size according to manufacturer’s directions.3. Spray over the measured course, catching the discharge from one nozzle.4. Measure discharge with a standard measuring cup.5. Number of cups x 200
Nozzle spacing in inches6. Make up spray solution with the correct amount of chemical in the amount of water that will be applied to
each acre.7. This procedure may also be used in calibrating for band treatments. For band applications, substitute band
width for nozzle spraying.Calibration Tables and Information
Travel Speed ChartTime Required in Seconds to Travel
Miles per Hour 100 ft 200 ft 300 ft
1 mph = 88 feet per minute1 mph = 1.466 feet per secondSpeed in mph = No. 35 inch steps per minute/30
= gallons/A

www.ext.vt.eduProduced by Communications and Marketing, College of Agriculture and Life Sciences, Virginia Polytechnic Institute and State University, 2009
Virginia Cooperative Extension programs and employment are open to all, regardless of race, color, national origin, sex, religion, age, disability, political beliefs, sexual ori-entation, or marital or family status. An equal opportunity/affirmative action employer. Issued in furtherance of Cooperative Extension work, Virginia Polytechnic Institute and State University, Virginia State University, and the U.S. Department of Agriculture cooperating. Rick D. Rudd, Interim Director, Virginia Cooperative Extension, Virginia Tech,
Blacksburg; Alma C. Hobbs, Administrator, 1890 Extension Program, Virginia State, Petersburg.