Embed Size (px)
Citation preview

EARSeL eProceedings 11, 2/2012 132
AGRICULTURAL CROP CHANGE DETECTION BY MEANS OF HYBRID CLASSIFICATION AND HIGH RESOLUTION IMAGES
Eva Savina Malinverni1, Michele Rinaldi2,3, and Sergio Ruggieri2
1. D.I.C.E.A, Engineering Faculty, Università Politecnica delle Marche, Ancona, Italy; email: e.s.malinverni(at)univpm.it
2. Consiglio per la Ricerca e la Sperimentazione in Agricoltura – Unità di Ricerca per i Sistemi Colturali degli Ambienti caldo-aridi, Bari, Italy; email: michele.rinaldi,sergio.ruggieri(at)entecra.it
3. Present address: Consiglio per la Ricerca e la Sperimentazione in Agricoltura – Centro di Ricerca per la Cerealicoltura, Foggia, Italy
ABSTRACT
The most widespread application of remote sensing technology is regarding Land Use/Land Cover (LULC) automatic map production to optimize land monitoring and management. These tasks rep-resent new challenges. The improved performances of automatic classification approaches be-come a fast and accurate tool for a reliable GIS decision support system.
The main aims of this work were i) to test the ability of using multispectral variability and high spa-tial information from different remote sensing images to recognize land use changes by means of a new hybrid classification method and ii) to quantify and evaluate the temporal variation of main crop rotations.
The test area covered the 132 square kilometres of the Capitanata plain in Southern Italy (Apulia Region), including mostly agricultural landscape (wheat, sugar beet, asparagus, vineyard, olive grove). The comparison was made between a land use classification with a series of SPOT 5 im-ages acquired in May 2007 and a set of WorldView-2 images acquired in April and July 2010. This new data set underlined better performances in terms of ground (2 m) and spectral resolution (eight bands: Blue, Coastal (blue), Green, Yellow, Red, Red edge, NIR 1, NIR 2).
The approach was based on a hybrid classification implemented in T-Map software by the spin-off company SI2G. The results showed an overall accuracy of more than 82%, were displayed on maps and used to calculate some indicators of crop sequences: This allowed of a quantification of more frequent rotation types (monoculture, rotations every 2 or 3 years) to promote ways of man-aging crop sequences compatible with environmental protection. Another indicator was the water requirement. According to the crops and the fields cropped, the total yearly average irrigation re-quirement was evaluated to correctly plan the irrigation water distribution.
INTRODUCTION
Land cover provides fundamental information for supporting a correct agricultural management. Qualitative and quantitative information on permanent crops and different field crops are essential for organizations making decisions about land management.
The crop rotation, the sequence of different crops on the same field year after year, is an important issue in agronomy, because a correct change of crop can help to maintain soil fertility and reduce pathogen load levels (1,2). On the other hand, economic reasons can induce farmers to adopt dif-ferent crop rotations with negative consequences (i.e. monoculture of grain cereals, short rotation of vegetables).
There are many methods for Land Use/Land Cover (LULC) mapping, from field surveys to conven-tional visual interpretation of aerial photographs. But in these past three decades, new solutions based on automatic procedures have been developed to extract the appropriate information for land use thematic maps useful in an efficient GIS decision support system. Technical innovations

EARSeL eProceedings 11, 2/2012 133
in the sensor acquisition and automatic classification methods, have completely changed the solu-tions, providing new opportunities for in-depth LULC mapping at very fine scales and in short time, reducing the high costs of photo-interpretation. However, these automatic approaches require so-phisticated digital image processing and computer vision techniques that raise several challenges, especially because their performances strongly depend on many factors, such as remote sensing data quality, landscape complexity, training data collection, classification method, etc. (3,4).
Automatic classification can be usually carried out according to two approaches: a pixel-based and an object-based method (5,6). Pixel-based classification aims to identify the classes by means of the spectral information provided by each pixel belonging to the original bands and/or other infor-mation obtained by means of a spectral band calculation (ratio, NDVI and so on). The object-based approach operates on sets of pixels (objects/regions) grouped together by means of an image segmentation technique. Furthermore, shape characteristics and neighbourhood relationships can be added to spectral/textural information to improve the classification. Both approaches have some disadvantages: the object-based approach is heavily influenced by the quality of segmentation results, while the pixel-based approach, which can exploit only spectral features, might result in errors when the same land cover type does not have unique spectral characteristics and, on the other hand, the same spectral response is found with other natural objects as well.
A recent review about the development of object-based image analysis for remote sensing (OBIA or GEOBIA) delineates that the object-oriented approach can contribute to a powerful automatic and semi-automatic analysis utilizing spectral and contextual information in an integrated way (7). For this reason, different solutions can be used to obtain an object oriented classification. For ex-ample, Definiens’ eCognition software produces a thematic map derived by a multi-resolution seg-mentation at different scales and an object-based classification in terms of several categories of characteristics in a strong hierarchical network. But there are also some approaches which inte-grate object-based and pixel-based classifications (hybrid approach), to improve the accuracy of automatic classification.
The paper presents the results of a research project applying the hybrid approach, implemented in the T-MAP software (SI2G, a spin-off of the Università Politecnica delle Marche, Italy), to WorldView-2 images. This hybrid approach joins the advantage of a single definition of the attribute on a pixel with the count of this information inside each segment defining the percentages of the-matic presences (WTA approach) (8,9). It is based on an AdaBoost supervised classifier that inte-grates pixel-based results in a segmented object map, in order to obtain a final GIS-ready classifi-cation. Another major contribution of this hybrid method is the accuracy assessment by means of a stability map that, in addition to the well known confusion matrix, helps the users to recognize re-gions where the classification result should be verified before being used (10).
Drawing on this automatic solution, the main aims of this work were i) to test the capability of the information extracted from different remote sensing images with visible sensors, to recognize land use changes and ii) to quantify and evaluate the main crop rotations diffusion in the following years.
The paper is organized as follows: The next section introduces the object-based classification con-cepts. Then, the case study area is described as well as the available data set imagery and the training/control data collection and organization. Thereafter, every stage of the supervised hybrid classification methodology is illustrated and the results are evaluated to use them in a correct way in the AQUATER decision support system (11).
IMAGE ANALYSIS BY MEANS OF OBJECT-ORIENTED APPROACHES
The development and use of several high-resolution sensors have continuously increased the im-portance of object classification algorithms. A recent overview about the object-based image anal-ysis is given by Blaschke (7). The importance of this new approach is clear if compared with the pixel-based supervised approaches. In fact, the spectral responses of single pixels provide “salt and pepper” effects in the classification map most of the time. Moreover, this is not a GIS-ready product. For this reason, new approaches are required in order to perform a segmentation algo-

EARSeL eProceedings 11, 2/2012 134
rithm which correctly defines the entities corresponding to real objects.
Landscape objects include natural and man-made features that are not always treated separately during the segmentation and classification processes. The algorithms that perform automatic seg-mentation of an image into polygons often produce oversegmentation or undersegmentation, which only partially reflects the reality. In this case, the image scale and the final map scale are the two reference points to be taken into account for choosing the segmentation method. A hierarchical solution can usually provide good results but not always improves the following classification step. Often, a process not so simple to drive is required for a good product, because it is necessary to select, every time, different parameters according to specific input/output data. The parameters for the multi-resolution segmentation must be accurately chosen to define each multi-scale level. De-fining the supervised classification functions becomes more complicated and requires different solutions every time. Furthermore, the legend structure can be very complex when the level of de-tail is very high, thus requiring more knowledge in both the software component tools and the ob-jects to be classified.
In order to define the objects with a greater accuracy, the OBIA (Object-based Image Analysis) methods have taken into account important spatial dimensions (distances, neighbourhood, topolo-gies, etc.) in addition to spectral information (mean, median, minimum and maximum values, mean ratios, variance etc.) in recent works.
Another important issue is the task of image segmentation. It produces a set of non-overlapping segments (polygons). This step can be separated from the classification process or integrated in a single one. In every case, the expectation of a segmentation algorithm is to separate the image into homogeneous and semantically significant groups of pixels which correspond to meaningful objects. The object-oriented method aims to overcome a land cover map with a purely descriptive categorisation of the object spectral characteristics and to introduce the combination of spectral and spatial (contextual) information in a set of rules, thus yielding an accurate definition of the segments.
In fact, the final aim of OBIA applications is focused on developing a geographic-based intelligence system, incorporating contextual information of objects to drive the classification stage. This step involves different scale resolutions related to the real object, such as different crop patterns, single trees, permanent crops, single houses, or water bodies, moreover in relation to image resolution. In this case, it is important to aggregate pixels into segments to define a pure object, but it is also fundamental to distinguish the right cover, considering that the landscape complexity can lead to a large heterogeneity also within-patch. The potentiality of high-resolution images is the high defini-tion of each pixel that cannot always be related to vegetation physiognomy as a whole, but some-times shows heterogeneity as the result of irregular shadows or shades (12). When this irregularity indicates different uses of the landscape, it must be considered important for the definition of the segment complexity and for the cover assignment. The knowledge of this information stored in a GIS can be used for other purposes, related to agricultural land management as shown below.
AREA TEST AND DATA SET COLLECTION
The site location
The study area is located in the Capitanata plain, in Southern Italy (Apulia Region); the second largest plain in Italy (about 4,000 square kilometres) and one of the most important areas for the Italian agriculture. The test site was defined in the framework of a national research project (AQUATER, 2005-2011) (13) funded by the Italian Ministry of Agriculture, Food and Forest Poli-cies. The site chosen for the experiment is an agricultural area of 132 square kilometres, close to Foggia (41°33’N, 15°30’E, 76 m a.s.l) (Figure 1).
The area has a flat topography and is mainly dedicated to durum wheat cultivation. According to the local crop management scheduling, durum wheat is usually sown between November and the end of December and harvested at mid-June. Other annual main crops of the region are: sugar beet (sown in autumn and harvested in July), and tomato (sown in April and harvested in August-
EARSeL eProceedings 11, 2/2012 135
September). Permanent crops with a significant presence in the area are vineyards and olives.
The climate is typically semi-arid with temperatures that may fall below 0°C in winter and rise above 40°C in summer. Annual rainfall (avg. 550 mm/year) is unevenly distributed throughout the year, being mostly concentrated during the winter months.
In the test area, the irrigation water is provided by the “Consorzio per la Bonifica della Capitanata” and also from private wells for the irrigation of both herbaceous (tomato, sugar beet, asparagus, artichokes,..) and tree crops (olive groves, vineyards, peaches, etc.).
In the past seven years, the CRA-SCA of Bari (Research Unit for Cropping Systems in Dry Envi-ronments of Agricultural Research Council) in this area, located between San Severo and Foggia cities, has carried out studies and research projects about land use, plant and soil measurements through satellite remote sensing in order to estimate indicators of the soil water and crop conditions
Figure 1: The study area: Capitanata plain and the WorldView-2 strip location.
Training and control data set definition
In the area of interest, a ground truth data set collection was made available by field surveys orga-nized yearly by the “Consorzio per la Bonifica della Capitanata” of Foggia in the months of April and July. Furthermore, these data were integrated by GIS analysis based on aerial and satellite orthoimages. The crop classes were identified in trees (olives and vineyard) and field crops (wheat, tomato, sugar beet, asparagus).
Starting from the localization of the sample points we generated the region of interests (ROI ) use-ful as training and control data set by means of a circular buffer of 450 m2, except the “mask” class, easily derived by few polygons of artificial water reservoirs (Figure 2). Both training and control data set were prepared taking into account the seasonal rotation of some agricultural land covers. Their presence or absence change the aspect of the landscape and also the spectral response of the satellite images.

EARSeL eProceedings 11, 2/2012 136
Figure 2: Ground truth sample set localization on satellite image: training (yellow circles) and con-trol (red circles). This picture represents only a part of the sampled area.
The amount of the samples and their cover area are shown in Table 1. The total area for the train-ing sample (652,498 m2) was half of the control sample (1,303,488 m2) and in percentage, with respect to the test area, covers only about the 0.005%.
Table 1: Ground truth sample set distribution
CLASS Training Area (m²) Control Area (m²) Total Samples Description
CL. 1 25 11250 22 9900 47 Asparagus
CL. 2 41 18450 45 20250 86 Sugar beet
CL. 3 204 91800 209 94050 413 Wheat
CL. 4 109 49050 109 49050 218 Tomato
CL. 5 32 18336 26 11700 58 Olives
CL. 6 48 21600 47 21150 95 Vineyards
CL. 13 5 6003 3 5360 10 Photovoltaic
CL. 20 1 436009 2 1092028 3 Mask
Remote Sensing imagery
The LULC data are among the most frequently requested information to formulate strategies for landscape sustainable management and to monitor the dynamics of a territory. During the AQUATER project, in relation to the area under investigation, a land use classification was carried out using SPOT 5 images, acquired in 2007 (14).
Successively two WorldView-2 images were acquired in 2010. Digital Globe's WorldView-2 Satel-lite (WV2), launched on 8th October 2009 and operating at an altitude of 770 kilometres, provides a half-metre panchromatic resolution and 1.8 metre multispectral resolution. The multispectral bands are 8: four standard colours (Red, Green, Blue and Near-infrared 1) and four new bands (Coastal, Yellow, Red edge and Near-infrared 2). This data set of imagery is very suitable for enhanced spectral analysis, mapping and monitoring applications, land use planning, accurate change detec-tion, visualization - simulation environments and so on.

EARSeL eProceedings 11, 2/2012 137
The available strips for the test application cover an area of about 132 km2 and are referred to two periods: 30th April 2010 and 2nd July 2010 (Figure 3).
Figure 3: The WorldView-2 strips: 30th April 2010 (left), 2nd July 2010 (right).
METHODOLOGICAL APPROACH APPLIED IN T-MAP SOFTWARE
The methodological innovative hybrid approach is implemented in T-MAP software, produced by SI2G, a spin-off company of the Università Politecnica delle Marche (Italy).
It is developed in the uDiG GIS environment and organized into a user friendly modular structure that allows us to enhance and extend its performance with respect to the traditional expensive and time-consuming visual interpretation process. T-MAP supports a GIS interoperability, too.
The different tools included in the software allow us to solve pre-processing steps such as training and control data set organization, filter processing to perform new texture features and image segmentation. The classification is based on an AdaBoost supervised classifier yielding pixel-based results to be integrated in the segmented object map to obtain a finally object-based classi-fication. This last process is performed using the Winner Takes All (WTA) algorithm. Another major contribution of this hybrid method is the accuracy assessment by means of a stability map where the correctness of the single polygon thematic description can be verified.
The modular structure of the process used in this research project is illustrated in Figure 4.

EARSeL eProceedings 11, 2/2012 138
Figure 4: T-MAP tools.
Addition of new texture images to improve the agricultural pattern recognition
To improve the per pixel classification usually based on spectral information, we added other tex-ture images to the original bands. In some cases, the land pattern referring to particular agricultural crops can be displayed very well by using textural images which can help to give a better classifi-cation. Starting from the choice of original bands to be processed, different texture features can be generated according to different approaches: Grey Level Co-occurrence Matrix (GLCM), Gabor Wavelet`s energy, NDVI and Ratio between two bands. Many parameters can be adopted and their influences provide a good set of texture images. See below the description of the adopted solutions for the GLCM and Gabor processing.
We applied this method to both April and July WorldView-2 images. The GLCM statistical texture features offered much more information about inter-pixel relationships and spatial grey level de-pendencies (15,16). We computed the second order image histogram for some original bands. The results for the Yellow and the NIR bands were significant with a kernel of 33 (Figures 5 and 6).
The Gabor Wavelet’s spectral texture transformation reveals the frequency distribution of a signal in an image: The magnitude response captures the texture homogeneity (17). Its frequency re-sponse is Gaussian in shape and the central frequency of each filter is selected to fit a peak in the texture power spectrum. The parameters involved are: the radial frequency (f), the standard devia-tion () of the Gaussian symmetrical curve and the orientation (θ). Here, the used filter with an ori-entation of about 160°, standard deviation = 1 and frequency f = 2, was applied on the Red band (Figure 7).
Other feature images are generated applying the NDVI filter, combining Red and NIR bands (Fig-ure 8) and the Ratio image putting in relation the Yellow and Red edge bands (Figure 9).

EARSeL eProceedings 11, 2/2012 139
Figure 5: GLCM texture image from July WV2 Yellow band.
Figure 6: GLCM texture image from July WV2 NIR band.
Figure 7: Gabor texture image from April WV2 Red band.

EARSeL eProceedings 11, 2/2012 140
Figure 8: NDVI image from April WorldView-2.
Figure 9: Ratio image from April WorldView-2.
Statistical analysis to assess the contribution of each image with respect to the training data set
In order to obtain a good balance in dimensionality and redundancy and to avoid a strong correla-tion between the multispectral bands and the texture images, we tested their performances, high-lighting their lowest correlation and highest variance for every land cover class.
Many approaches are available, mostly aiming to evaluate class separability by means of cost function or metrics: Jeffrey-Matusita and Mahalanobis distances or the correlation matrix.
Firstly, we applied a statistical analysis based on the correlation matrix. It was useful to highlight the band and class combination in reciprocal relation. For each class, a histogram using the whole original data set (8 bands) was produced. Figures 10-12 show the specific histograms of sugar beet, durum wheat and tomato land cover classes and the tables with the correlation coefficients referred to other derived images: NDVI and Ratio. Low values, extra diagonal, show in which bands the confusion between each class is minimum.

EARSeL eProceedings 11, 2/2012 141
Figure 10: Histogram analysis and correlation matrix referred to sugar beet class.
Figure 11: Histogram analysis and correlation matrix referred to durum wheat class.
Figure 12: Histogram analysis and correlation matrix referred to tomato class.
Different classes are usually seen in different spectral responses. For this reason it is useful to assess where the different classes are better separable, mainly in relation to the spectral bands.
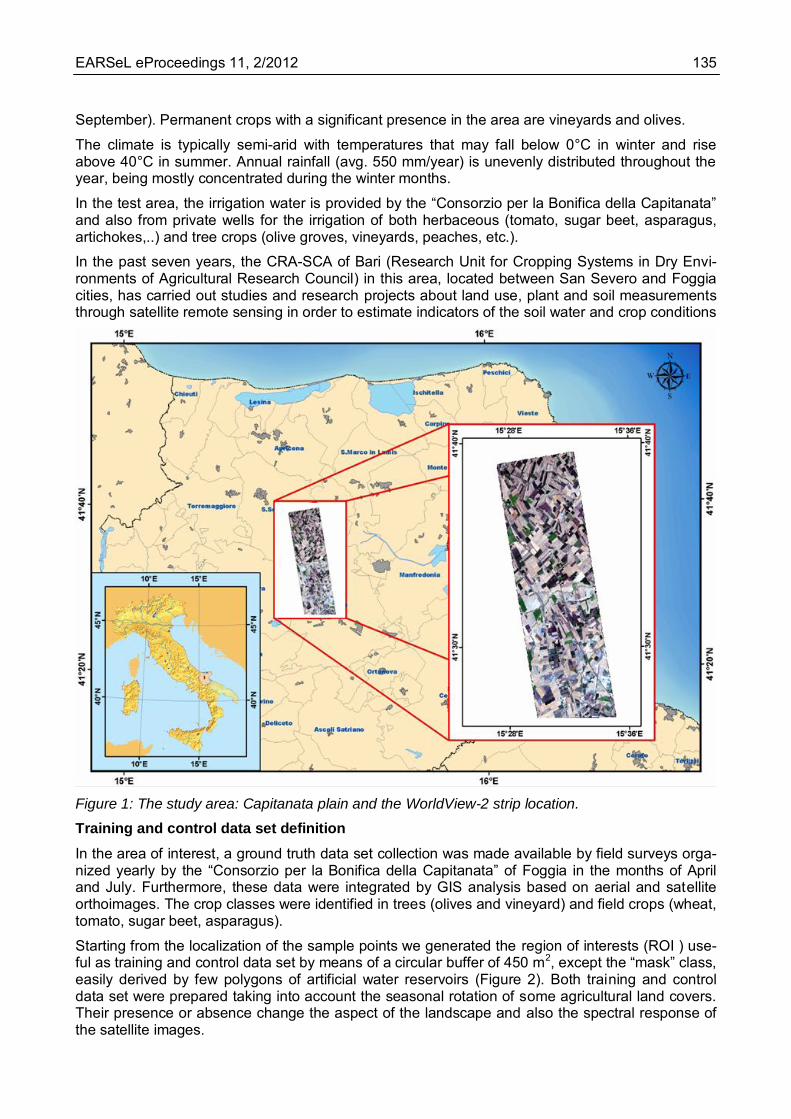
To analyse the composition of the training samples related to a class, it is necessary to analyze the radiometric content of the original images in the area restricted by the polygons of the training samples. The separability index allows us to understand which choice is the sensitive information on classes or how many classes of information correspond to the spectral classes. Use of texture bands (ratio, NDVI) focus on most of the information that contains the original data. In order to veri-fy the most suitable bands that provide better quality of information and improve the classification process, thus saving memory and processing time, the separability assessment was performed by means of Jeffries-Matusita (JM) indicator. The JM measurement is based on Bhattacharrya dis-tance and allows us to indicate how well a selected pair of spectral classes is statistically separable (class separability). In particular, values greater than 1.9 indicate that the pair has a good separa-bility (18,19).
First, the separability on the WV2 data set imagery was analysed referring to 8 classes derived by the ground truth data, and between the 8-band multispectral bands in the following order: Red, Green, Blue, Blue-Coastal, Yellow, Red edge, NIR 1, NIR 2. Afterwards, we added the other tex-ture images. Figure 13 includes the table in which each class is related to both itself and other classes with respect to the spectral information available. The result of this analysis highlights the band combination with the highest value of separability for indices greater than 1.9.
EARSeL eProceedings 11, 2/2012 142
Figure 13: Separability by means of Jeffries-Matusita analysis.
Image object segmentation
In the hybrid classification method, image object segmentation represents the first step of classifi-cation to define elements which correspond to real objects to assign descriptive characteristics. An accurate and precise segmentation is important to extract meaningful entities better representing objects in the landscape, which are useful for the final thematic mapping process. This step in-volves the image ground resolution, the choice of many parameters which directly affect the quality of final segmentation. The procedure consists of splitting the image into entities (polygons), close to the human vision process that tends to generalise the image contents into homogeneous areas (9). The meaningful objects in the real world not always have clean-cut boundaries, but they can also have soft transitions in the land covers, sometimes depending on image scale or application. So it is suitable to solve this task with the best method.
The segmentation process in T-MAP provides an image of segments derived by pixels with homo-geneous spectral similarity combined with spatial parameters. The tool is based on a pyramidal approach that combines edge-detection with region-growing techniques and setting some segmen-tation parameters (Minimum Mapping Unit, spectral difference, number of pyramid levels, scale factor, etc.). It is possible to customize and drive the analysis in order to extract specific features of interest (buildings, roads, agricultural fields, etc.) (20,8).
In order to realize a GIS ready product with spatial consistency, semantic representation and num-ber of extracted classes, a customized approach has to be performed. After several tests with dif-ferent images and pyramid levels had been performed, a set of efficient working parameters were carried out. In particular, the developed segmentation algorithm takes into account compactness, convexity, solidity and roundness parameters. These are spatial and topological parameters which help to define the aspect of the object shape and to distinguish objects from each other. That way, the obtained segmentation is suitable for specific change detection and landscape monitoring analysis.
For this research, the WV2 data set imagery gave a detailed segmentation in relation to the fine ground resolution of images (2 meters). The April WV2 Red edge band was able to obtain a good feature extraction of 12,379 polygons (Figure 14). The same spectral band, coming from the July strip, gave two different segmentations: the first one with 10,132 polygons and the second one with 18,987 polygons. In the following classification step, the finest detail of the second segmentation provided a good definition for the classes with small-size parcels that were not always homogene-ous (Figure 15). For arable land used for wheat cultivation, the spectral homogeneity allowed us to obtain well defined and extended polygons, both in April when the soil was completely covered by wheat vegetation and in July when the soil was almost bare.

EARSeL eProceedings 11, 2/2012 143
Figure 14: The detail of the April WV2 segmentation.
Figure 15: The finest detail of the July WV2 segmentation.
In order to improve the segmentation results, we used, as a “mask”, only some land cover classes: buildings, roads and rivers; digitized in vector form by a Regional Technical Map at medium-scale resolution (Figure 16). This refinement gave good performances in terms of edge definition and was arranged for a better hybrid classification. In fact, we generated two new segmentations which were much more beneficial to the research objectives to be achieved relating to the agricultural landscape owing to the elimination of areas that were of no interested to the definition of the crop classes. The edges of the crop parcels were better defined and the compactness of some poly-gons was improved by merging small segments with the same spectral characteristics and not con-fusing them with the neighbouring artificial regions. The July segmentation provided 7,750 poly-gons, while the April segmentation gave many more regions (9,347) because of intense crop vege-tation (Figure 17).

EARSeL eProceedings 11, 2/2012 144
Figure 16: The mask used to refine the segmentation.
Figure 17: The segmentations on the WV2 Red edge masked band: April (left) and July (right).
Finally, the produced vector file contains all the information characterizing the regions, stored in a table and useful to evaluate the geometrical aspects of the parcels (area, perimeter, and so on). In this step, land cover class assignment is not finished yet and will be performed successively. Automatic per pixel classification
The hybrid approach combines the advantages of a supervised pixel-based classification with an object-based segmentation, to find the thematic classes of the meaningful object. Following these two fundamental steps we achieved a good classification.
Per pixel classification is essentially based on the statistical spectral values. The selected WV2 feature data set (5 texture features + 8 multispectral bands = 13 features) was used to run a pixel-based supervised classification by means of a robust classifier (AdaBoost) (21). The key idea was to iteratively focus on difficult patterns increasing the weights of misclassified training patterns. The selected training data set was the same as described in the previous section. The added texture features were chosen to increase the raw spectral band information and to characterize specific land cover patterns (i.e., permanent crops: olives and vineyard). To focus the classification only on agricultural land covers and to improve the final results, we applied the same mask (in raster for-mat) as used during the segmentation process to the whole image data set, in order to exclude the

EARSeL eProceedings 11, 2/2012 145
artificial classes.
Class assignment to the objects
The per pixel classification provided the information (pixels) partitioned into wide categories. This represented the input to the following Winner-Takes-All (WTA) approach (22). It is used to exploit the pixel-based results in classifying the objects coming from the previous image segmentation, thus providing a refined object-based classification. The approach sorts out meaningful segmented regions into thematic classes in terms of membership class percentages. A classification according to the predominant class attribute can provide a “hard” thematic map.
We followed this process to avoid the “salt and pepper” effect of a pixel-based classification and to improve the result in terms of spatial consistency, semantic representation and GIS ready produc-tion. In fact, the output was a thematic map (Land Cover/Land Use) characterized by a custom-designed legend and a good performance in terms of accuracy and legend detail.
The resulting thematic maps, in raster form and vector form, and the accuracy assessment are illustrated in the next section.
HYBRID CLASSIFICATION RESULTS AND ACCURACY ASSESSMENT
The pixel-based classification results were two thematic maps related to the April WV2 data set (Figure 18) and to the July imagery information (Figure 19).
Subsequently, the crossing of these maps with the control data set produced the confusion matri-ces used to assess the per pixel classification accuracy. The per pixel classification yielded good results in terms of Overall Accuracy (OA) both in April (84%) (Figure 20) and in July (82%) (Figure 21). A detailed class assessment can be provided also by comparing the Producer Accuracy (PA) and User Accuracy (UA) or by means of the correspondent Omission (O) and Commission (C) er-rors. Moreover, it appeared that the OA values did not take into account the result of the class “mask” which gave 100% of Producer Accuracy (PA)/User Accuracy (UA). In fact, including this class we have reached an OA of about 97% in both classifications.

EARSeL eProceedings 11, 2/2012 146
Legend
asparagus
sugar beet
wheat
tomato
olives
vineyards
photovoltaic
mask Figure 18: April WV2 per pixel classification.
Legend
asparagus
sugar beet
wheat
tomato
olives
vineyards
photovoltaic
mask Figure 19: July WV2 per pixel classification.

EARSeL eProceedings 11, 2/2012 147
Figure 20: Two tables and legend as output of T-Map software: accuracy assessment on April WV2 per pixel classification.
Figure 21: Two tables and legend as output of T-Map software: accuracy assessment on July WV2 per pixel classification.
The best values of PA/UA are referred to sugar beet, wheat and tomato classes which were used in the following change detection analysis to process some indicators. This good accuracy allowed us to accurately perform this analysis.
Finally, the object attribute assignment gave new LCLU maps in vector form with the correlated tables that provide information for each classified polygon about its membership class percent-ages, which is useful in evaluating the accuracy in terms of stability assessment (23). Figure 22 shows the thematic map obtained by April WV2 land use object classification and Figure 23 illus-trates the land use object classification derived by the July WV2 image.

EARSeL eProceedings 11, 2/2012 148
Legend
asparagus
sugar beet
wheat
tomato
olives
vineyards
photovoltaic
mask Figure 22: Object Land Use Map (April WV2)
Legend
asparagus
sugar beet
wheat
tomato
olives
vineyards
photovoltaic
mask Figure 23: Object Land Use Map (July WV2)
The differences between the two classifications were explained by the changes in the crop cultiva-tions, the different seasons (spring – summer) and, in many cases, the different performances of the segmentations derived from spectral aspects of the raw images. Sometimes, the polygon de-scribing a land parcel was not correctly partitioned. This might have produced a mistake in the class assignment when the dominant class percentage was derived by the pixel presence inside the polygon. If there is confusion (presence of different covers) and the polygon includes more ar-eas, this will be a problem for the correct definition of the class.
Stability assessment
The accuracy assessment coming from the Confusion Matrix gave us a percentage of OA related to the whole classified landscape, but it was not possible to know where correct and erroneously classified regions were really located in the whole data set.
A strong and innovative point in T-MAP is its capability of providinge a detailed accuracy assess-ment by means of the stability map that helps the user to differentiate between regions with well identified attributes (stable) and those which should be preliminarily verified (instable) before using.

EARSeL eProceedings 11, 2/2012 149
According to the WTA approach, the confusion index (CI) is derived by comparing the membership class percentage inside each region and is used to produce the stability map. The CI value is de-fined in a range of 0-1, where 0 represents the ideal condition of a pure dominant class inside the region.
The following stability maps (Figure 24) were obtained by putting a threshold to the CI value equal to 0.65. Red polygons are unstable (CI>0.65), while the yellow ones are stable with a rate of 93% for the total study area in both hybrid classifications (April and July).
The stability map supports the reliability of the hybrid classification procedure and also helps to perform the visual interpretation approach, assigning nonhomogeneous classes in an automatic way. Thus, it becomes a valid instrument that drives the user in the LULC map consultation, indi-cating which polygons are critical areas in terms of heterogeneity and providing the segments can-didate for improving the class assignment.
Legend
0 - 0,65
0,65 - 1 Figure 24: Stability Maps - April (left) and July (right).
CROPPING SYSTEMS INDICATORS AND CHANGE DETECTION
In the test area analyzed in this study, durum wheat (DW), tomato (TO) and sugar beet (SB) repre-sent the main field crops. The durum wheat is the most important crop in Southern Italy, useful for the production of flour derivate foodstuff (pasta, pane, pizza).
In the temporal comparison (2007-2010) by means of the previous SPOT5 classification and the last WV2, it was evident that the three crops increased their extension (Figure 25). In fact, they took up 86.8% of the agricultural cropped area in 2007 and 92.5% in 2010.
This is illustrated in detail in Table 2. The larger increase has been observed for sugar beet (+38%), because in the 2005-2008 period a sugar industry crisis caused a strong reduction of sug-ar beet cultivation. Successively, the sugar price increase stimulated the farmers to crop sugar beet again with autumnal sowing time and deficit irrigation scheduling (2-3 irrigation applications, only). The processing of tomato increased the cropped area by 14%: this crop is one of few field crops that allow the farmers a good net return; durum wheat, the most typical crop (about 66% of the study area), showed almost the same area after 3 years (+6%).

EARSeL eProceedings 11, 2/2012 150
Table 2: Classification results and comparison between 2007 and 2010.
2007 2010 2010 vs 2007
Crop Hectares (%) Hectares (%) (%)
Sugar beet 625 5.4 864 7.5 +38.2 Tomato 1862 16.1 2124 18.4 +14.1 Durum wheat 7545 65.3 7693 66.6 +2.2 Total 10032 86.8 10681 92.5 +6.5 Total crop area 11553
Total area 13162
Figure 25: Classification comparison for the three crops: SPOT 5 images (2007) (left) and WorldView 2 (2010) (right).
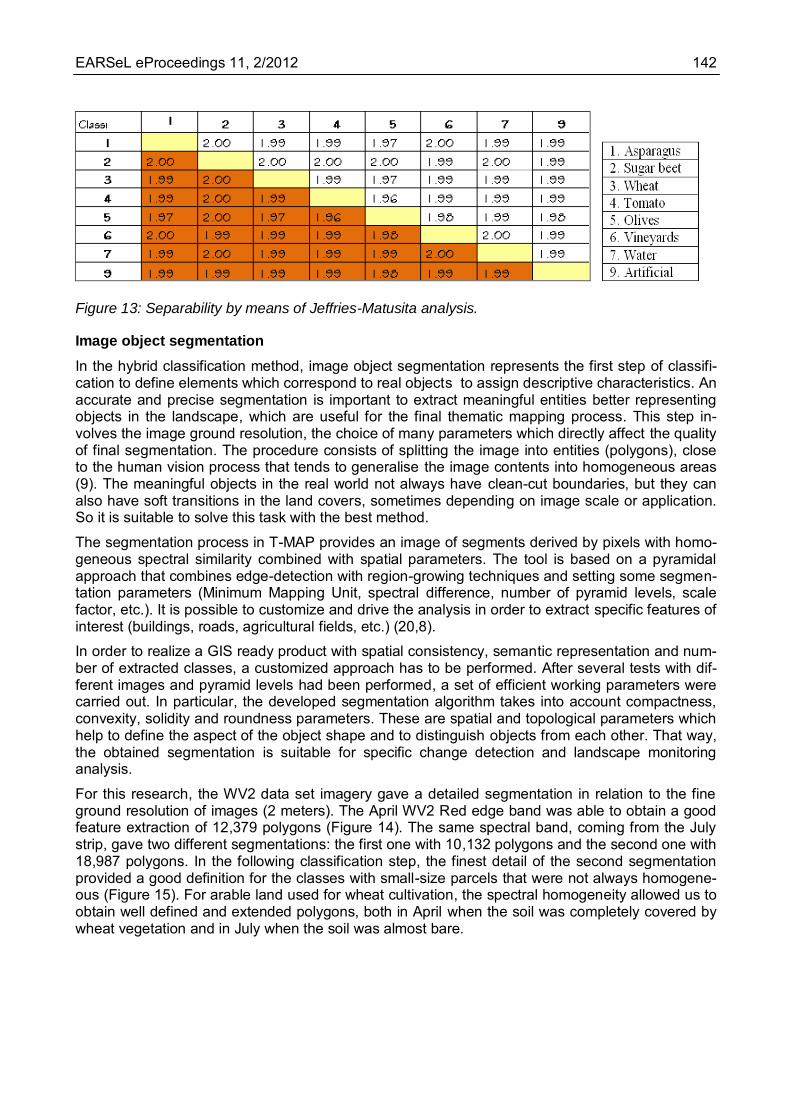
An evaluation of the dynamic of cropping systems has been carried out. The fields where durum wheat was cropped in both years represented 73% of the area (Table 3, Figure 26). This confirms that durum wheat is cropped in 1- to 4-year rotations: monoculture and combinations of the three crops, DW-TO, DW-DW-TO, DW-DW-SB and DW-TO-DW-SB. The crop sequences with TO fol-lowing TO and SB and the sequences with SB following SB and TO are not recommended and
EARSeL eProceedings 11, 2/2012 151
should consequently not be adopted in sustainable cropping systems; in fact, from an agronomic point of view, the sequence of TO and SB crops increases the pest risk, nutrient def iciencies and the production of allelopathic substances that can badly influence the growth of the following crop.
The crop rotation is a fundamental agronomic practice, aimed to avoid a decrease in soil fertility (different macro- and micronutrient uptake and fertilization), to reduce the pest load (critical when the same crop is cultivated on the same soil again too soon, except for cereals like wheat), to allow of a better weed control in beet and tomato with benefit to the following crop. Last but not least, crop rotations reduce economic risks and enables a better distribution of labour and machinery during the year.
Table 3: Size of the area with the same crop in the two years (2007 and 2010).
Hectares (%)
Crop Sugar beet 52 6.00 Tomato 538 25.33 Durum wheat 5590 72.66
Figure 26: Fields where the crop of 2007 came back in 2010.
Another indicator, very important in areas where water is the yield limiting factor, is the water re-quirement. We evaluated the total yearly average irrigation requirement in the test area according to the crops and the fields cropped. The seasonal irrigation volumes are reported in (24) to be 200 mm for sugar beet and in (25) and (26) to be 500 mm for tomato. In this case, we did not consider the actual climatic conditions, but only the average irrigation water requirements at irrigation district scale.
The results, reported in Table 4, show an increase in the estimated water needs by about 1,780 millions of cubic meters of water (about 17%) from 2007 to 2010. This is very important information for planning irrigation water distribution. This increment is in accordance with the water supplied by the “Consorzio per la Bonifica della Capitanata” in the two years for the districts comprising the test area (+34% higher in 2010 than in 2007), but considering also other irrigated crops.

EARSeL eProceedings 11, 2/2012 152
Table 4: Crop irrigation water requirement in the test area in the two years (2007 and 2010), con-sidering 500 mm of irrigation water for tomato and 200 mm for sugar beet (wheat is a rain-fed crop).
m3 of water 1,000
2007 2010
Crop Sugar beet 1,250 1,728 Tomato 9,310 10,615 Durum wheat - - Total 10,560 12,343
CONCLUSIONS
This research, carried out to monitor the crop rotations in the Capitanata plain, demonstrates the good performances of an advanced methodology for the automatic land use classification: the hy-brid solution implemented in the software T-MAP. The hybrid method proved its potentiality com-bining different processes and good data imagery availability. The multispectral WorldView-2 im-ages proved to be very suitable to improve the spectral classification. The Red edge, Yellow and the two Near Infrared bands increased the spectral information to discriminate different agricultural land covers. Furthermore, the utility to add texture images in this approach confirmed a high classi-fication accuracy for different classes which have a distinctive spatial pattern (i.e., permanent crops).
The spectral classification gave good results in terms of overall accuracy (more than 82%) and in relation to the three crops used in the change detection analysis (sugar beet, tomato and durum wheat) the OA was more than 90%.
The object segmentation provided the final GIS ready thematic maps, improving the attribute def i-nition of the land parcels, avoiding the “salt and pepper” presence and the thematic accuracy of each region by means of the stability map information.
The LULC results were useful to evaluate the yearly water requirement according to the three main crops in the test area. They showed an increase in the estimated water requirement from 2007 to 2010 of about 17%, as confirmed by the data provided by the “Consorzio per la Bonifica della Cap i-tanata”.
Another use of the LULC data was related to the evaluation of some dynamics of cropping sys-tems, which are essential to avoid a decrease in soil fertility, to reduce the pest load and, last but not least, to reduce economic risks and to enable a better distribution of labour and machinery dur-ing the year.
For these reasons, the reliable performances of a valid automatic classification methodology and the use of high resolution remote sensing imagery can facilitate more frequent analyses to discover the changes of land use over time. The monitoring of changes in land cover and land use can be a useful tool for different political stakeholders in supporting land management and implementing many activities aiming at environmental protection, exploitation and processing.
REFERENCES
1 Ventrella D & M Rinaldi, 1999. Comparison between two simulation models to evaluate crop-ping systems in Southern Italy. Yield response and soil water dynamics. Agricoltura Mediterra-nea, 129: 99-110
2 Garofalo P, E Di Paolo & M Rinaldi, 2009. Durum wheat (Triticum durum Desf.) in rotation with the faba bean (Vicia faba var minor L.). A long-term simulation case-study, Crop and Pasture Science, 60: 240-250
3 Lu D & Q Weng, 2007. A survey of image classification methods and techniques for improving
EARSeL eProceedings 11, 2/2012 153
classification performance. International Journal of Remote Sensing, 28(5): 823-870
4 Gao Y & J F Mas, 2008. A Comparison of the Performance of Pixel-based and Object-based Classifications over images with various Spatial Resolution. Online Journal of Earth Science, 2: 27-35
5 Shackelford A K & C H Davis, 2003. A combined fuzzy pixel-based and object-based ap-proach for classification of high-resolution multispectral data over urban areas. IEEE Transac-tions on Geoscience and Remote Sensing, 41(10): 2354-2363
6 Sims F M & V Mesev, 2007. Use of ancillary data in object-based classification of high resolu-tion satellite data. In: Urban Remote Sensing Joint Event, 10 pp.
7 Blaschke T, 2010. Object-based image analysis for remote sensing, ISPRS Journal of Photo-grammetry & Remote Sensing, 65: 2-16
8 Bernardini A, E Frontoni, E S Malinverni, A Mancini, A N Tassetti & P Zingaretti, 2010. Pixel, object and hybrid classification comparison. Special Issue ‘Geographic Object-based Image Analysis’, Journal of Spatial Science, 55(1): 43-54
9 Malinverni E S, A N Tassetti, A Mancini, P Zingaretti, E Frontoni & A Bernardini, 2011. Hybrid approach for land use / land cover mapping using high resolution imagery. Special Issue ‘Ob-ject-based Landscape Analysis’, International Journal of Geographical Information Science, 25(6): 1025-1043
10 Woodcock C E & S Gopal, 2000. Fuzzy set theory and thematic maps: accuracy assessment and area estimation. International Journal of Geographical Information Systems, 14(2): 153-172
11 Acutis M, A Perego, E Bernardoni & M Rinaldi, 2010. AQUATER software as a DSS for irriga-tion management in semi-arid Mediterranean areas. Italian Journal of Agronomy, 5(2): 205-216
12 Ehlers M, M Gahler & R Janowsky, 2003. Automated analysis of ultra high-resolution remote sensing data for biotope type mapping: New possibilities and challenges. ISPRS Journal of Photogrammetry and Remote Sensing, 57(5-6): 315-326
13 Rinaldi M, 2010. AQUATER Project. Italian Journal of Agronomy, 5(2): 166
14 Satalino G, F Mattia, A Balenzano, M Rinaldi, S Ruggieri & P Garofalo, 2010. A comparison of Leaf Area Index maps derived from multi-sensor optical data acquired over agricultural areas. Italian Journal of Agronomy, 5(2): 167-176
15 Haralick R, K Shanmugam & I Dinstein, 1973. Texture features for image classification. IEEE Transactions On Systems, Man. and Cibernetics,Smc-3: 610-621
16 Tassetti A N, E S Malinverni & M Hahn, 2010. Texture analysis to improve supervised classifi-cation in Ikonos imagery. Proceedings 100 Years ISPRS “Advancing Remote Sensing Sci-ence”, Vol. XXXVIII, Part 7A, Wagner W & B Székely (eds), 245-250
17 Idrissa M & M Acheroy, 2002. Texture classification using Gabor filters. Pattern Recognition Letters, 23: 1095-1102
18 Marcheggiani E, A Galli, A Bernardini, E S Malinverni & P Zingaretti, 2008. Selection criteria of training set for optimal land cover discrimination with a view to automatic segmentation. In Proceedings 28th Symposium European Association of Remote Sensing Laboratories, edited by Derya Maktav (IOS Press, Amsterdam, The Netherlands) 284-291
19 Richards J A, 1999. Remote Sensing Digital Image Analysis (Springer-Verlag, Berlin) 240 pp.
20 Zingaretti P, E Frontoni, E S Malinverni & A Mancini, 2009. A hybrid approach to land cover classification from multispectral images. In: Image Analysis and Processing- ICIAP 2009, P. Foggia, C. Sansone, M. Vento (Eds.), Lecture Notes in Computer Science Series - LNCS 5716 (Springer, Berlin) 500-508
EARSeL eProceedings 11, 2/2012 154
21 Schapire R E & Y Singer, 1999. Improved boosting algorithms using confidence-rated predic-tions. Machine Learning, 37(3): 297-336
22 Jain B J & F Wysotzki, 2003. A competitive winner-takes-all architecture for classification and pattern recognition of structures. In: Graph Based Representations in Pattern Recognition, ed-ited by E Hancock & M Vento (Springer, Berlin) 259-270
23 Malinverni E S, A N Tassetti & P Zingaretti, 2010. LCLU Information System For Object-Oriented Nomenclature. Proceedings 2010 IEEE International Geoscience and Remote Sens-ing Symposium, IGARSS-GRSS
24 Rinaldi M & A V Vonella, 2006. The response of autumn and spring sown sugar beet (Beta vulgaris L.) to irrigation in Southern Italy: water and radiation use efficiency. Field Crops Re-search, 95(2-3): 103-114
25 Rinaldi M., Rana G. 2004. I fabbisogni idrici del pomodoro da industria in Capitanata. Rivista Italiana di Agrometeorologia, 1: 31-35
26 Rinaldi M., Di Paolo E., Vonella A.V. 2006. Efficiency of Water Use in Sugar Beet (Beta vulgar-is L.) and Processing Tomato (Lycopersicon esculentum Mill.) Cropped in Southern Italy. In: Italian Journal of Agronomy, 3: 369-377