Embed Size (px)
Citation preview

1
Aggregate Ramp Rates Analysis of Distributed
PV Systems in 5 Locations at San Diego County
Juan L Bosch, Mohammad Jamaly and Jan Kleissl
Dept. of Mechanical and Aerospace Eng., University of California, San Diego
February 6, 2013
Abstract
Aggregate ramp rates of 209 distributed photovoltaic (PV) systems clustered on 5 feeders in San
Diego County, CA were analyzed (Alpine, Fallbrook, Ramona, San Diego and Valley Center).
Satellite derived irradiance data was utilized to estimate the aggregated power production for
each area during the year 2011. The goal was to quantify the largest aggregate ramp rates and
determine the success of day-ahead forecast products to predict these ramps. Over one year the
largest hourly aggregate absolute ramp was a 78% decrease and hourly ramps over 27% occurred
about once per day (ramps are expressed as a fraction of Performance Test Conditions rating).
Numerical Weather Prediction models were unable to forecast most ramps day-ahead, but there
was some success in forecasting the intra-day variability.
1. Introduction
Integration of large amounts of photovoltaic (PV) into the electricity grid poses technical
challenges due to the variable solar resource. Solar distributed generation (DG) is often behind
the meter and consequently invisible to grid operators. The ability to understand actual
variability of solar DG will allow grid operators to better accommodate the variable electricity
generation for resource adequacy considerations that inform planning, scheduling, and
dispatching of power. From a system operator standpoint, it is especially important to understand
when aggregate power output is subject to large ramp rates. If in a future with high PV
penetration all PV power systems were to strongly increase or decrease power production
simultaneously, it may lead to additional cost or challenges for the system operator to ensure that
sufficient flexibility and reserves are available for reliable operations.

2
In this study, aggregate ramp rates of distributed PV systems installed in San Diego, CA and
surrounding area are analyzed. Modeled irradiation data along with specifications of 209 PV
systems are used to evaluate the frequency, magnitude, and ability to forecast large ramps in the
aggregate power output. The methodology is described in Section 2. Results of the detected
largest ramps in aggregate power output are presented in Section 3 and Section 4 contains the
conclusions.
2. Methodology
2.1. Datasets
The California Solar Initiative (CSI) rebate program database includes street address and PV
system specifications including AC Rating (kWAC) at performance test condition (PTC, typically
14% less than STC), inverter maximum efficiency, panel azimuth and tilt angles, and tracking
type. The PTC rating simulates more realistic conditions at 1000 W m-2
plane-of-array irradiance
with panel temperature derived from ambient air temperature at 20oC and 1 m s
-1 wind speed.
Given the rapid increase in solar distributed generation (DG) in most coastal urban centers in
California (like San Diego which is the focus of this study), this dataset is complete enough to
project future effects of high PV penetration on the electric grid. From the 2011 CSI database,
specifications for 79 PV power plants on the five feeders were obtained. 130 additional sites
were identified using aerial imagery in Google Earth. Site specifications were derived from the
measured projected surface areas of each site by assuming a DC conversion efficiency of 15%
and a DC-rating to PTC-rating ratio of 0.852. Azimuth and tilt angles were randomly selected
from the specifications of nearby (same feeder) sites contained in the CSI database. Therefore, a
final set of 209 PV systems with total PTC rated capacity of 4.62 MW, mean PTC rated of 22
kW, and median PTC rated of 4.7 kW are analyzed (Fig. 1). Table 1 shows the characteristics of
the different feeders. Notably on the Valley Center and Fallbrook feeders, the largest site (1
MW) constitutes more than half of the total capacity, which reduces geographic diversity effects.
Initially we attempt to use measured PV power output provided by Sullivan Solar Power and the
California Solar Initiative Performance-Based Incentive (PBI) program to compute aggregate
ramps. This was unsuccessful due to the small number of sites with a full year of data. Only the
Point Loma and Fallbrook feeders had more than one such site, but at only 2 and 4 sites the
diversity effects due to geography and installation angles of the wide variety of PV systems
connected to each feeder were not adequately represented. Therefore, PV output power is
estimated based on satellite imagery and a PV performance model.
3
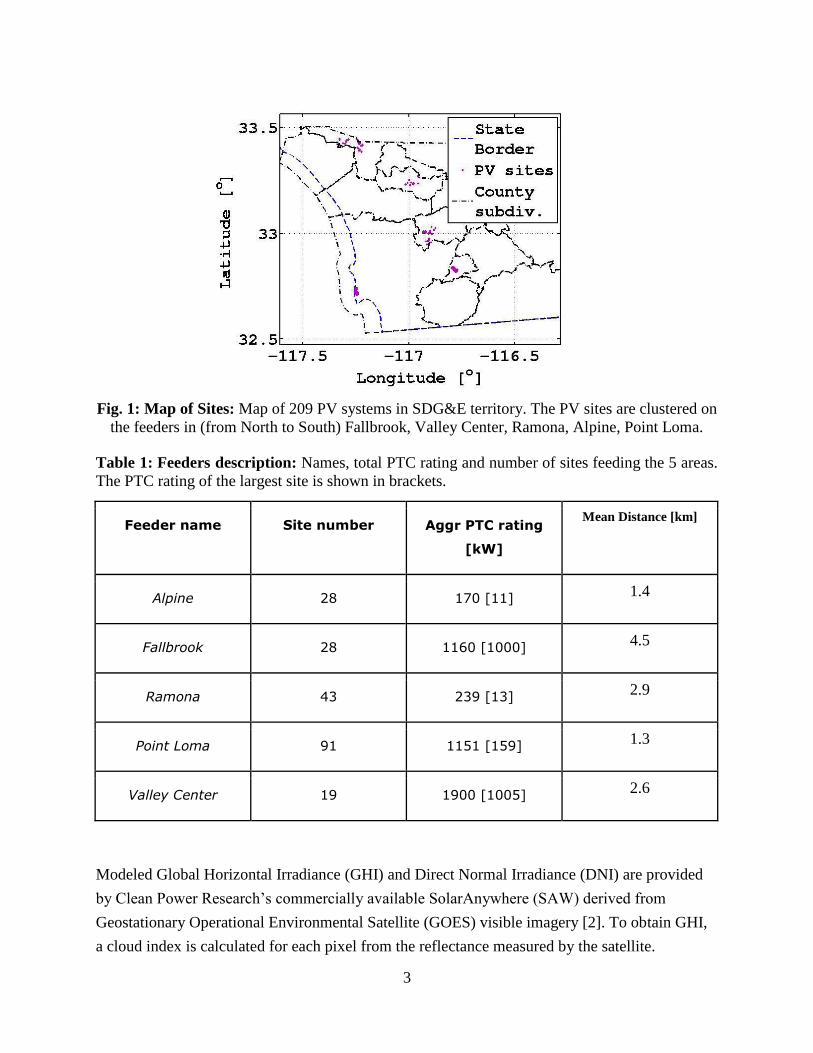
Fig. 1: Map of Sites: Map of 209 PV systems in SDG&E territory. The PV sites are clustered on
the feeders in (from North to South) Fallbrook, Valley Center, Ramona, Alpine, Point Loma.
Table 1: Feeders description: Names, total PTC rating and number of sites feeding the 5 areas.
The PTC rating of the largest site is shown in brackets.
Feeder name Site number Aggr PTC rating
[kW]
Mean Distance [km]
Alpine 28 170 [11] 1.4
Fallbrook 28 1160 [1000] 4.5
Ramona 43 239 [13] 2.9
Point Loma 91 1151 [159] 1.3
Valley Center 19 1900 [1005] 2.6
Modeled Global Horizontal Irradiance (GHI) and Direct Normal Irradiance (DNI) are provided
by Clean Power Research’s commercially available SolarAnywhere (SAW) derived from
Geostationary Operational Environmental Satellite (GOES) visible imagery [2]. To obtain GHI,
a cloud index is calculated for each pixel from the reflectance measured by the satellite.

4
Instantaneous, spatially averaged GHI is then calculated by using the cloud index along with a
clear sky model that considers regional and seasonal effects of turbidity [3]. SAW enhanced
resolution satellite-derived irradiation with 30-min temporal and 1 km spatial resolutions is
applied in this study. SAW can be purchased for operational applications with less than 30 min
latency.
At each PV system, the SAW derived GHI and DNI are used to estimate power output P by
using a performance model as described in [4]. The analysis is conducted for January 1st to
December 31st, 2011. To avoid errors due to sensor cosine response and shading by nearby
obstructions (not considered by SAW), only data for solar zenith angles less than 75° are
considered. Performance when the solar zenith angle is less than 75º for a flat plate system is less
than 26% of rated capacity so hourly ramps are likely to be substantially less during those
periods.
2.2. Aggregate PV Ramp Rates
The aggregate SAW modeled power output for each area of study is used to determine the largest
absolute ramp rates in 2011. From the aggregate PV power output at each time step, differences
are calculated for different ramp duration intervals; 30-min through 5-hour in 30-min increments.
We present normalized absolute ramp rates to facilitate scaling the results to future PV
penetration scenarios (assuming a similar geographic diversity). Therefore, the aggregate power
outputs are normalized by the aggregate (PTC) kWAC capacity of the PV systems for each area
(Figs. 2, 3).
2.3. Day ahead forecast
In addition, day-ahead forecasts of the PV power production have been calculated for each of the
209 sites. A high-resolution (1.3 km), direct-cloud-assimilating Numerical Weather Prediction
(NWP) model based on the Weather and Research Forecasting model (WRF) forecasts
instantaneous hourly GHI day ahead [5]. Satellite observations of cloud cover at model
initialization are assimilated into the model. Forecasts with (WRFA) and without (WRF) cloud
assimilation have been calculated for May and June 2011 when the marine layer cloud events are
more frequent in the coastal areas. These forecasts have been used to determine the next day
expected variability and compared with the measured variability.
5
2.3.1 Daily Variability Index
Following a method developed at UC San Diego and Sandia National Labs [5, 6], the daily
variability is calculated for each day in terms of a Variability Index (VI). The VI was modified to
allow the use of aggregated PV power output (rather than irradiance):
∑day
|RR|
∑day
|RRclear|,
where the absolute values of the 1-hour ramp rates (RR) are summed and divided by the sum of
the absolute 1-hour ramp rates that would have occurred if the day was clear (RRclear). This index
will be 1 for a clear day and larger than 1 for days with partial cloud cover. It can also take
values below 1 for overcast days. Both WRF forecasts (with and without cloud assimilation) and
the clear sky model provide global horizontal irradiance (GHI), which is then transformed to PV
power output following the same model applied to the SAW database earlier.
3. Results
3.1. The Largest Ramps
3.1.1. Largest Ramp Rates by Time Horizon
The largest step sizes in the absolute aggregate PV power output (normalized by kWAC) are
detected over the year for different intervals (Fig. 2). As expected, the maximum ramp
magnitude increases with the ramp interval approaching 90% for 5 hour ramps reflective of the
diurnal cycle (e.g. from zero output at 0700 to near maximum output at 1200 solar time) on a
clear day. However, the ramp magnitudes are already at 65 to 77% over 30 minutes, which is
much larger than the SDG&E-wide ramps observed in [Jamaly, Bosch, Kleissl 2012]. The reason
is the relatively small geographic diversity within a feeder. A fast-moving cloud front can cover
an entire feeder in 30 to 60 minutes causing large ramps, which is especially true for the
mountain conditions in Alpine.

6
Fig. 2: Largest absolute ramps: Largest ramp magnitude versus ramp time interval (from
30-min upto 5-hours) for aggregate normalized output (P/kWAC)
3.1.2. Histogram of large hourly ramps
1-hour ramps have a special significance as most energy exchange between electric balancing
areas is currently scheduled over hourly intervals. The distribution of hourly absolute ramp rates
in the aggregate PV output (Fig. 3) shows that ramps over 27% h-1
of PTC capacity are rare,
occurring only for 154 hours of the year. For smaller ramps, the distribution decreases linearly.
The differences between the feeders are relatively small; only the coastal San Diego feeder
shows slightly more large ramps presumably due to the overall more cloudy conditions.

7
Fig. 3: Distribution of hourly ramp rates: Cumulative distribution of absolute value of 1-hour
ramp rates of aggregate absolute 30-min output (normalized by kWAC) from all 209 PV sites
grouped by area. The ramps are zero for the remaining hours up to 8760 h, because these
are night time conditions.
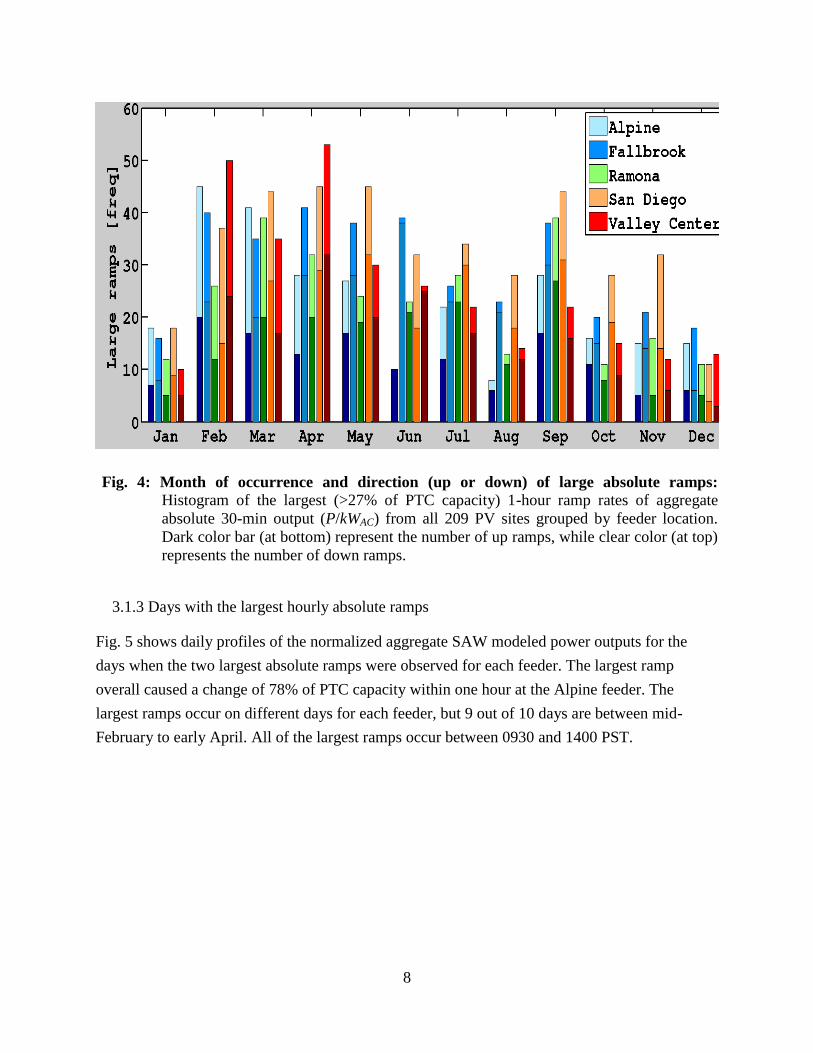
Fig. 4 shows a histogram (by month) of the 1-hour absolute ramp rates of aggregate normalized
power output (normalized by kWAC) which are larger than 27% of PV capacity. The number of
ramps is largest from February through May. From June to October most ramps are up-ramps
which are caused by marine layer cloud evaporation that coincides with increasing solar altitude.
8
Fig. 4: Month of occurrence and direction (up or down) of large absolute ramps: Histogram of the largest (>27% of PTC capacity) 1-hour ramp rates of aggregate
absolute 30-min output (P/kWAC) from all 209 PV sites grouped by feeder location.
Dark color bar (at bottom) represent the number of up ramps, while clear color (at top)
represents the number of down ramps.
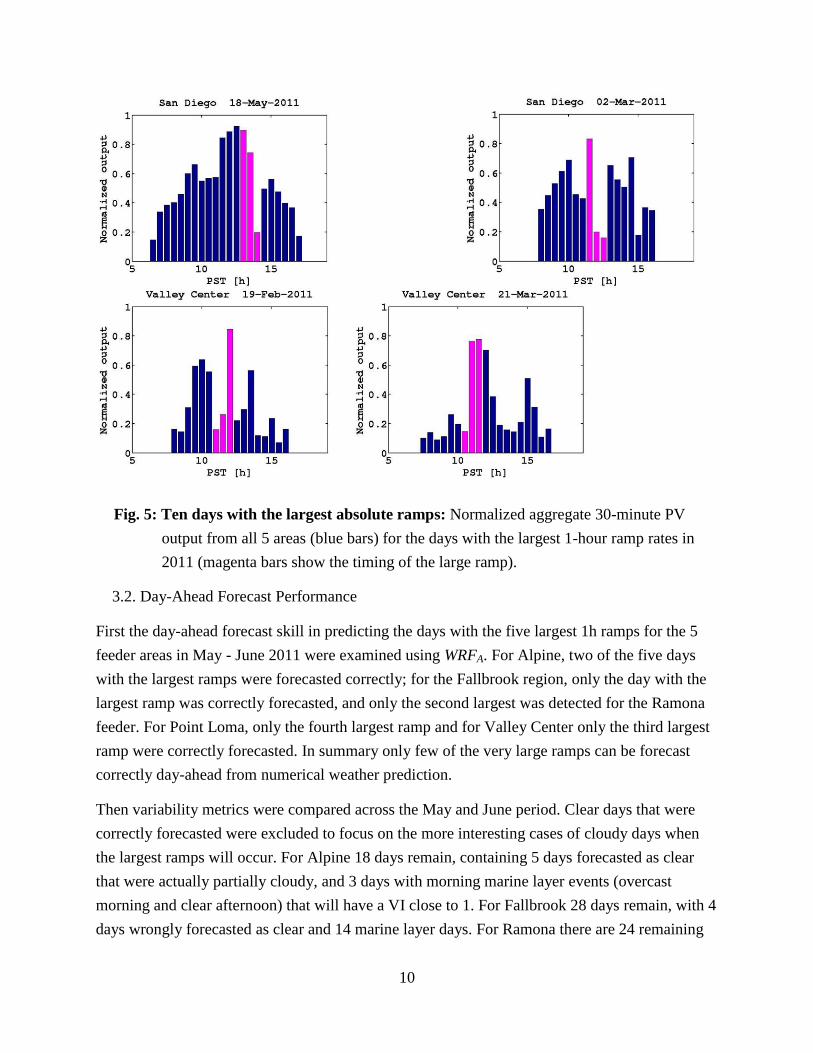
3.1.3 Days with the largest hourly absolute ramps
Fig. 5 shows daily profiles of the normalized aggregate SAW modeled power outputs for the
days when the two largest absolute ramps were observed for each feeder. The largest ramp
overall caused a change of 78% of PTC capacity within one hour at the Alpine feeder. The
largest ramps occur on different days for each feeder, but 9 out of 10 days are between mid-
February to early April. All of the largest ramps occur between 0930 and 1400 PST.

9
10
Fig. 5: Ten days with the largest absolute ramps: Normalized aggregate 30-minute PV
output from all 5 areas (blue bars) for the days with the largest 1-hour ramp rates in
2011 (magenta bars show the timing of the large ramp).
3.2. Day-Ahead Forecast Performance
First the day-ahead forecast skill in predicting the days with the five largest 1h ramps for the 5
feeder areas in May - June 2011 were examined using WRFA. For Alpine, two of the five days
with the largest ramps were forecasted correctly; for the Fallbrook region, only the day with the
largest ramp was correctly forecasted, and only the second largest was detected for the Ramona
feeder. For Point Loma, only the fourth largest ramp and for Valley Center only the third largest
ramp were correctly forecasted. In summary only few of the very large ramps can be forecast
correctly day-ahead from numerical weather prediction.
Then variability metrics were compared across the May and June period. Clear days that were
correctly forecasted were excluded to focus on the more interesting cases of cloudy days when
the largest ramps will occur. For Alpine 18 days remain, containing 5 days forecasted as clear
that were actually partially cloudy, and 3 days with morning marine layer events (overcast
morning and clear afternoon) that will have a VI close to 1. For Fallbrook 28 days remain, with 4
days wrongly forecasted as clear and 14 marine layer days. For Ramona there are 24 remaining
11
days, with 7 cloudy days forecasted as clear, and 8 marine layer days. Point Loma feeder has the
lowest number of completely clear days, resulting in 53 remaining days, with 9 days wrongly
forecasted as clear and most of the days showing marine layer events. For the Valley Center
feeder there are 20 remaining days, with 4 cloudy days forecasted as clear and 5 marine layer
days.
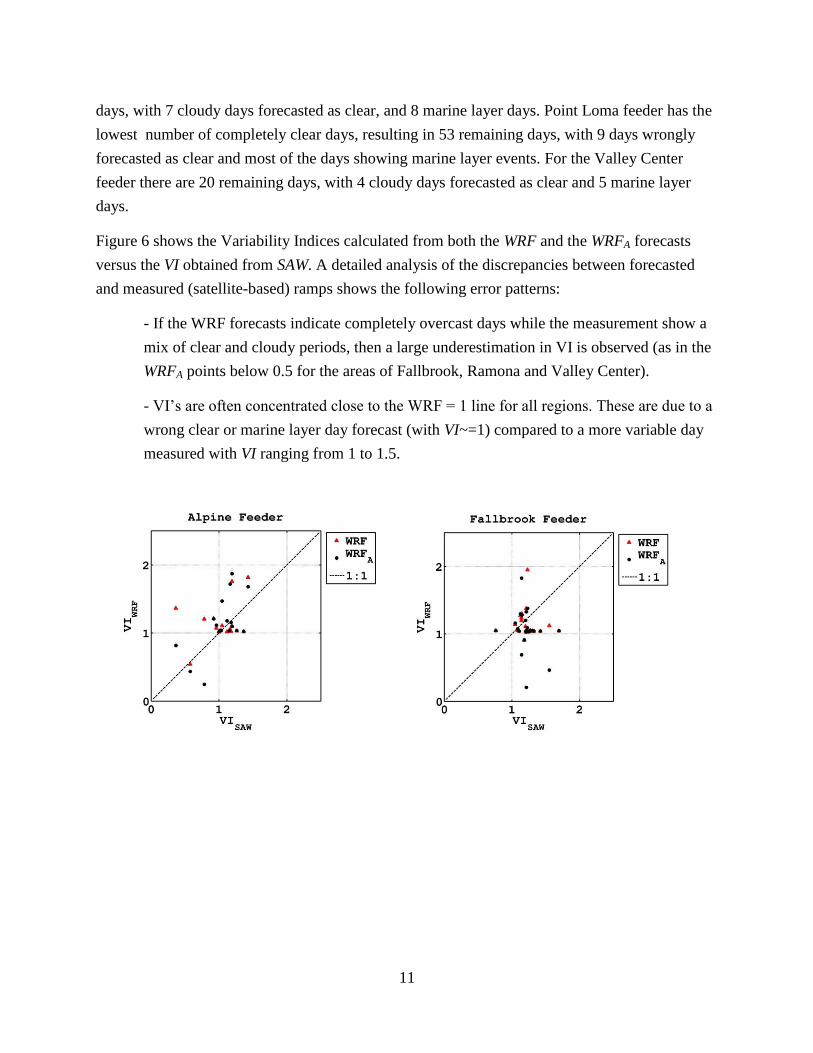
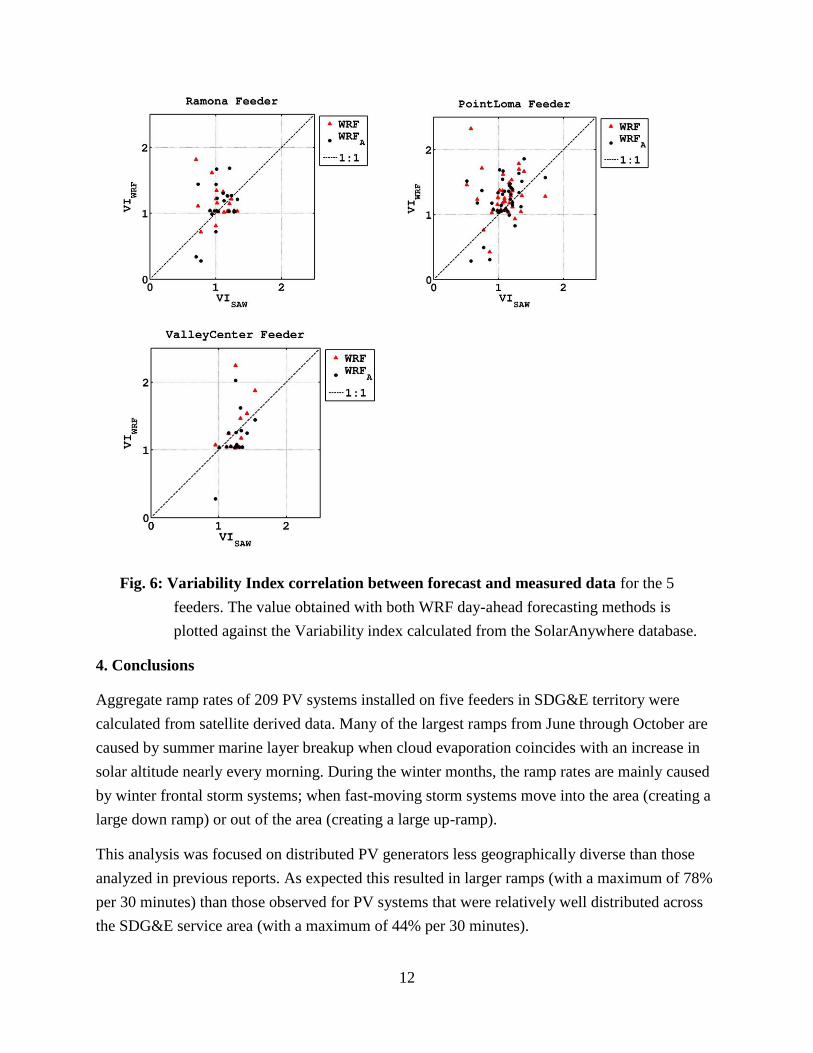
Figure 6 shows the Variability Indices calculated from both the WRF and the WRFA forecasts
versus the VI obtained from SAW. A detailed analysis of the discrepancies between forecasted
and measured (satellite-based) ramps shows the following error patterns:
- If the WRF forecasts indicate completely overcast days while the measurement show a
mix of clear and cloudy periods, then a large underestimation in VI is observed (as in the
WRFA points below 0.5 for the areas of Fallbrook, Ramona and Valley Center).
- ’s are often concentrated close to the WRF = 1 line for all regions. These are due to a
wrong clear or marine layer day forecast (with VI~=1) compared to a more variable day
measured with VI ranging from 1 to 1.5.
12
Fig. 6: Variability Index correlation between forecast and measured data for the 5
feeders. The value obtained with both WRF day-ahead forecasting methods is
plotted against the Variability index calculated from the SolarAnywhere database.
4. Conclusions
Aggregate ramp rates of 209 PV systems installed on five feeders in SDG&E territory were
calculated from satellite derived data. Many of the largest ramps from June through October are
caused by summer marine layer breakup when cloud evaporation coincides with an increase in
solar altitude nearly every morning. During the winter months, the ramp rates are mainly caused
by winter frontal storm systems; when fast-moving storm systems move into the area (creating a
large down ramp) or out of the area (creating a large up-ramp).
This analysis was focused on distributed PV generators less geographically diverse than those
analyzed in previous reports. As expected this resulted in larger ramps (with a maximum of 78%
per 30 minutes) than those observed for PV systems that were relatively well distributed across
the SDG&E service area (with a maximum of 44% per 30 minutes).
13
Day ahead power output forecasts from high-resolution Numerical Weather Prediction model did
not show significant skill in forecasting large ramps, even statistically. Further research is
required to improve NWP forecasts.
5. References
1 California Solar Initiative, "California Public Utilities Commission California Solar
Initiative Program Handbook," Accessed Sep. 2011 at:
http://www.gosolarcalifornia.org/documents/CSI_HANDBOOK.PDF
2 Web-based Clean Power Research service database, SolarAnywhere. Available:
https://www.solaranywhere.com/Public/About.aspx
3 R. Perez, P. Ineichen, K. Moore, M. Kmiecik, C. Chain, R. George, and F. Vignola, "A
new operational model for satellite-derived irradiances: Description and validation,"
Solar Energy, 73(5):307-317, 2002.
4 M. Jamaly, J.L. Bosch, and J. Kleissl, Power Output Analysis of Distributed PV Systems
in California Using SolarAnywhere Enhanced Resolution Irradiation, CSI Report, 2012.
5 P. Mathiesen, C. Collier, and J. Kleissl, “A high-resolution, cloud-assimilating numerical
weather prediction model for solar irradiance forecasting.“ Solar Energy, n Press, 2013.
6 J.S. Stein, C. W. Hansen and M. J. Reno, “The ariability ndex: A new and novel metric
for quantifying irradiance and P output variability” ASES conference 2012.


![Comparative Study of Ramp-Rate Control Algorithms for PV ...Energies 2019, 12, 1342 3 of 15 In [20], a ramp-rate based gradient control is presented. The main difference of this algorithm](https://img.dokumen.tips/doc/110x75/61017d2a8004f233b26ed5e7/comparative-study-of-ramp-rate-control-algorithms-for-pv-energies-2019-12.jpg)