Embed Size (px)
Citation preview

Full Terms & Conditions of access and use can be found athttp://www.tandfonline.com/action/journalInformation?journalCode=ttra21
Download by: [90.192.121.82] Date: 16 July 2016, At: 00:50
Transportmetrica A: Transport Science
ISSN: 2324-9935 (Print) 2324-9943 (Online) Journal homepage: http://www.tandfonline.com/loi/ttra21
Agent-Based Day-to-Day Traffic Network Modelwith Information Percolation
Wenlong Shang, Ke Han, Washington Ochieng & Panagiotis Angeloudis
To cite this article: Wenlong Shang, Ke Han, Washington Ochieng & Panagiotis Angeloudis(2016): Agent-Based Day-to-Day Traffic Network Model with Information Percolation,Transportmetrica A: Transport Science, DOI: 10.1080/23249935.2016.1209254
To link to this article: http://dx.doi.org/10.1080/23249935.2016.1209254
Accepted author version posted online: 14Jul 2016.Published online: 14 Jul 2016.
Submit your article to this journal
Article views: 1
View related articles
View Crossmark data
Publisher: Taylor & Francis & Hong Kong Society for Transportation Studies Limited Journal: Transportmetrica A: Transport Science DOI: 10.1080/23249935.2016.1209254
Agent-Based Day-to-Day Traffic Network Model with Information Percolation
Wenlong Shang, Ke Han*, Washington Ochieng, Panagiotis Angeloudis Department of Civil and Environmental Engineering, Imperial College London
*Corresponding author, e-mail: [email protected] Abstract This paper explores the impact of travel information sharing on road networks using a two-layer, agent-based, day-to-day traffic network model. The first layer (cyber layer) represents a conceptual communication network where travel information is shared among drivers. The second layer (physical layer) captures the day-to-day evolution in a traffic network where individual drivers seek to minimize their own travel costs by making route choices. A key hypothesis in this model is that instead of having perfect information, the drivers form individual groups, among which travel information is shared and utilized for routing decisions. The formation of groups occurs in the cyber layer according to the notion of percolation, which describes the formation of connected clusters (groups) in a random graph. We apply the novel notion of percolation to capture the disaggregated and distributed nature of travel information sharing. We present a numerical study on the convergence of the transport network, when a range of percolation rates are considered. The findings suggest a positive correlation between the percolation rate and the speed of convergence, which is validated through statistical analysis. A sensitivity analysis is also presented which shows a bifurcation phenomenon with regard to certain model parameters. Keywords Agent-based simulation; day-to-day dynamics; information percolation; convergence; traffic network
1. Introduction Travel information plays an increasingly vital role in travel behaviour. In the literature of traffic assignment, the user equilibrium (UE) principle assumes that travellers have perfect information (Wardrop, 1952), whereas the stochastic user equilibrium (SUE) allows the information to be incomplete (Daganzo and Sheffi, 1977). Intrinsic to both approaches is a strong relationship between the availability and quality of travel information and network performance. Data quality has already been acknowledged as a key concern in much of the existing body of work on traffic assignment. The effects of data quality were initially studied by Mahmassani (1990), where it was found that travel times in simulated networks would converge to an equilibrium state regardless of the completeness of travel information. In a follow up study, Friesz et al. (1994) examined the evolution of traffic flow patterns when users are provided with complete or incomplete information through Advanced Traveller Information Systems (ATIS). It is found that perfect information lead to faster convergence and lower travel costs during the adjustment period leading to the equilibrium. Similarly, Zheng et al. (2013) emphasize that incomplete network information and insufficient communication have a negative impact on traveller’s route behaviour. The authors use simulations to show that network performance and convergence speeds increase as the numbers of travellers receiving up-to-date information increase. However, there exist studies that suggest otherwise: Balakrishna et al. (2013) point out that information do not necessarily improve network performance for day-to-day traffic learning models. A common characteristic of these studies is that they all focus on travel information provided by exogenous sources (e.g. network operator, ATIS, Google Map etc.). There exists another source of information, which is generated among travellers themselves through daily commute, and disseminated and used through certain information sharing structures 1 and learning processes.
1 Examples include internet-enabled navigation devices (such as those offered by TomTom or Garmin) or smartphone apps with social networking features (such as Waze).
Dow
nloa
ded
by [
90.1
92.1
21.8
2] a
t 00:
50 1
6 Ju
ly 2
016

Furthermore, studies so far have not considered the possible segregation of travellers in terms of information access and sharing. This paper seeks to address this literature gap by proposing a two-layer, agent-based, day-to-day traffic model that captures the imperfect nature of travel information. The model developed in this study consists of two layers: a cyber layer that represents the communication network among travellers in which travel information can be shared based on certain structure; and a physical layer expressing the day-to-day transport network with individual travellers routing selfishly in order to minimize their own travel costs. This model assumes that, instead of having perfect information 2, travellers form groups where travel information is internally shared. As such, routing decisions are not only influenced by the travellers’ own experiences, but also by choices made by their group peers. The novelty of the model lies in the fact that these processes are represented using two distinct but interacting networks. A physical network is used to capture the underlying traffic network (along with links, nodes and users), while the transmission of travel decisions and experiences among users is modelled through the application of percolation theory (Newman, 2003) to a conceptual communication network (the cyber layer). In this context, percolations refer to the formation of connected node clusters (user groups) in a random graph, where there is a certain probability that node (user) pairs establish a link (connection to exchange travel info). Using this approach, we generate different passenger groups, representing the market segregation of travel information provision. On the physical layer of the model, a day-to-day route adjustment process is proposed based on an agent-based routing game in which individual travellers make rational routing decisions in order to minimize their travel costs. Such a process may be represented using an agent-based model that captures the actions and interactions of autonomous travel agents. In our proposed model, such interaction occurs on both the cyber and the physical layers. Relationships among travel agents give rise to emerging and collective behaviours at network level; this paper is mainly concerned with convergence of the traffic network to an approximate equilibrium state. 3 To the best of our knowledge, this is the first paper to use percolation theory to capture the disaggregated and distributed nature of travel information sharing. It also addresses imperfect travel information since the model assumes that travellers can only perceive the travel cost along certain path if at least one traveller in the same group uses that path. When the network is sufficiently large such that the number of viable paths is significantly larger than the number of agents in the same group, such a group undergoes a learning process with very limited information on the entire network. With the application of information percolation in the agent-based, day-to-day traffic model, we are able to describe and quantify the impacts of percolation rate on the travellers’ collective driving behaviour and the convergence of the resulting network to an approximate equilibrium state. The significance of this model is that it manages to parameterize the imperfectness of travel information using a single variable (the percolation rate), which has not been achieved in the literature. It also proposes a measure for the convergence of the resulting traffic system in the presence of a variety of stochasticities (e.g. the random connections in the cyber layer and the logit route choice sub-model). The contribution and main finding of this study are shown as follows:
1. This paper proposes a novel agent-based, day-to-day traffic model that incorporates information percolation. This model is able to parameterize the imperfectness of travel information through percolation theory, and simulate the day-to-day evolution of traffic under a structured learning process of the travel agents.
2. The direct impact of the percolation rate on the convergence of the network is studied in detail. The results show that a higher percolation rate leads to faster convergence. Moreover, there exists a threshold percolation rate for which both the travel group number and the convergence rate undergo a qualitative change.
3. A sensitivity analysis is conducted to understand the impact of various modeling parameters on the overall convergence of the network. It also reveals an interesting bifurcation situation with respect to certain model parameters.
2 In this paper, having perfect travel information means that exact route travel times/costs are known to all drivers using the network. 3 As we shall subsequently see, due to the stochasticity inherent in the traffic model, an exact equilibrium is difficult to achieve. Thus a definition of approximate equilibrium is needed.
Dow
nloa
ded
by [
90.1
92.1
21.8
2] a
t 00:
50 1
6 Ju
ly 2
016
The rest of this paper is organized as follows. Section 2 presents some literature review on agent-based simulation, day-to-day traffic assignment models, and percolation theory. Section 3 provides some background materials concerning the static traffic assignment model and percolation theory. Section 4 presents the agent-based stochastic day-to-day traffic model. In Section 5 we presents a numerical case study that demonstrates the characteristics of the model, and quantifies the impact of information percolation on the convergence of the traffic network. A sensitivity analysis is also presented in this section. Finally, Section 6 offers some concluding remarks.
2. Literature review In this section, we provide an in-depth review of relevant literature on three subjects: agent-based simulation, day-to-day traffic evolution model, and percolation theory. Agent-based simulation (ABS) is a popular approach for modelling complex systems composed of autonomous, interacting agents, and is able to reveal relevant characteristics such as self-organization, emergence of order, and resilience, by compiling information about entities at a lower level (Macal and North, 2010). ABS was originally applied in the study of complex adaptive systems (Kauffman, 1993) and artificial life (Langton, 1989). In the field of transportation, a range of agent-based models have been applied to study driving and travel behaviors at microscopic/mesoscopic/macroscopic levels. Nagel and Schreckenberg (1992) apply ABS to set up a stochastic discrete automation model to simulate car motions of individual vehicles. Afterwards, agent-based modelling in transportation receives increased attentions. Node, arc and traveller are regarded as three types of agents by Zhang and Levinson (2004). Following this, Zou and Levinson (2006) develop an agent-based model. Nagel and Flötteröd (2009) propose to study traffic assignment from individual agent’s perspective, in order to address the complexity of choice dimensions such as the departure time and mode choices. The influence of spatial information on user behaviour is addressed by Zhu et al. (2007), who propose an agent-based route choice model to simulate how travellers make route choices over time by using a route choice set. Although the model is able to account for the presence of exogenous information, how such information is propagated among agents is not addressed. Zheng et al. (2013) explicitly introduce basic concepts and general modelling frameworks of ABS. The authors point out the close relation between ABS and social science models, behaviour models, route choice models, land use models and activity-based travel demand models. In addition, ABS is employed to explore the parking search and decisions (Levy et al., 2013), and container transport business (Sinha-Ray et al., 2003). Day-to-Day (DTD) Evolutionary Dynamics are used in this study to describe and predict the daily variation of traffic flows and drivers’ route adjustment processes. Day-to-day (DTD) models are typically used to accommodate disequilibrium traffic models with embedded drivers’ learning processes. Smith (1984) proposes a deterministic DTD model through the proportional switch adjustment process (PSAP), which stipulates that drivers on a higher-cost path tend to switch to a lower-cost one in the next day at a rate proportional to the cost differences between these two paths. Following this, Huang and Lam (2002) and Peeta and Yang (2003) use PSAP to model the path choice dynamics. In addition, Zhang and Nagurney (1996) and Nagurney and Zhang (1997) regard the drivers’ adjustment process prior to reaching equilibrium as projected dynamical system (PDS). Friesz et al. (1994) apply network tatonnement process (NTP) in modelling the disequilibrium state of DTD dynamics. One type of evolutionary traffic flow dynamics known as the Brown-von Neumann-Nash (BNN) dynamic is used to study how drivers are equally likely to switch strategies with the rate being proportional to the sum of the excess payoffs (Yang, 2005). These models are all based on path flows. He and Liu (2012) propose a link-based day-to-day traffic assignment model to capture the evolution of traffic under network disruptions. The authors describe the traffic equilibrium process with prediction-correction model rather than relying entirely on their own experiences from previous days. Following this, He and Peeta (2016) develop a marginal utility day-to-day traffic evolution model based on drivers’ rationality in their route choices, i.e. by including marginal benefits/costs in the route choice models. In order to capture characteristics of drivers in route choice within an urban railway network, Wu et al. (2013) propose a day-to-day traffic assignment model with taking into account Bounded Rationality (BR) of drivers. Guo et al. (2015) introduce a general link-based day-to-day dynamic model to facilitate the understanding of the day-to-day adjustment mechanism of traffic flows. Wang et al. (2015) propose a day-to-day congestion pricing scheme to improve the
Dow
nloa
ded
by [
90.1
92.1
21.8
2] a
t 00:
50 1
6 Ju
ly 2
016

network resilience after transport networks suffers disruptions. Smith et al. (2013) investigate the long term behavior of deterministic and stochastic day-to-day dynamic models. Percolation theory seeks to link connectivity and information transport in geometrically complex systems (King et al., 2002) – it has been branded as the science of ‘clumping’ in random environments (Gastner, n.d.). A percolation process is one in which a vertical or edge in a network is randomly marked either ‘occupied’ or ‘unoccupied’ (Newman, 2003). Its origins can be traced back to the World War , when Flory and Stockmayer applied it to the study of chemical process which small molecules form large macromolecules (Stauffer and Aharony, 1994). Percolation theory was first used in an epidemiological study by (Broadbent and Hammersley, 1957) to model the spread of diseases – this has been the first study that involved real-world networks. Sahini (1994) attempted to summarize the applications of percolation theory to the modelling of phenomena in disordered systems, and stated that porous media problems such as oil recovery processes may benefit from such research. Many other problems can also be mapped to percolation models. Brodera et al. (2000) and Albert et al. (2000) deem that the resilience of web graph to random failures of nodes is equivalent to the site percolation process; and Sander et al. (2002) point out that the models of epidemic diseases can be mapped to the percolation in which the percolation rate is correspondent to the “epidemic threshold” of epidemiology. Summarizing, percolation theory is widely accepted tool for the exploration of critical phenomena, and is crucial to understanding important aspects of network topology (Albert and Barabási, 2002).
3. Preliminaries This section introduces concepts, notations and a method quantifying convergence employed in this study. We also describe how percolation theory can be applied to traffic modelling (for the first time to our best knowledge).
3.1 Notation and background In this section we briefly review some standard assumptions and notations employed in static traffic assignment and discrete choice models. Since this paper focuses on the day-to-day evolution of traffic, some variables presented below have explicit dependence on the time index t, which represents one “day”. ( , ) Graph representation of a network with node set and link set E Set of origin-destination (OD) pairs , Set of routes connecting OD pair ( , ) Set of routes in the network Flow on link on day Vector of link flows on day , = ( ) ∈ ℎ Flow along route on day ℎ Vector of path flows on day , ℎ = (ℎ ) ∈ Perceived travel cost on route by agent ∈ on day ∈ {0,1} Random route choice index: equals 1 if takes route on day ; equals 0 otherwise. ( ) Link travel cost function (possibly non-separable) Cost associated with route on day Vector of route costs on day , = ( ) ∈ , Link-route incidence index: equals 1 if ∈ ; equals 0 otherwise
Link-route incidence matrix: = , ∈ , ∈
Travel group to which traveller belongs In a road network, a route is represented as a set of links it traverses. The flow on link ∈ on day is the sum of relevant route flows ℎ ; that is, = ∑ , ⋅ ℎ∈ for all ∈ , (1)
Dow
nloa
ded
by [
90.1
92.1
21.8
2] a
t 00:
50 1
6 Ju
ly 2
016
or, in matrix notation, = ℎ . Given the link loads , the cost for using link is assumed to be a function: ( ). The route travel cost is the sum of relevant link travel costs: = ∑ , ⋅ ( )∈ for all ∈ (2)
The process of calculating route travel costs for a given vector of route flows is known as the network loading problem. Mathematically, the network loading can be expressed as: [Network loading] = ( ) ∈ , = ( ) ∈ , = ∑ , ⋅ ( )∈ for all ∈ (3)
We denote by the perception of driver on the cost of route on day ; it represents the subjective and expected travel costs of driver . In some literature (Davis and Nihan, 1993, Cominetti, 2013), the perception is based on the driver’s past travel experience and is updated on a daily basis as: = + ⋅ ( − ) (0,1) (4)
It can be seen from Eqn (4) that the perception of a driver about a route on a particular day is jointly affected by his/her previous perception, and the experienced travel cost on that route on the most recent day (day − 1 ). Here, the parameter measures the impact of the most recent travel experience (on day − 1) on the perception, and it varies between 0 and 1 to make sure that the perception always stays positive.
We use the logit model to describe drivers’ random route choices under the influence of their own perceptions. In particular, the probability of choosing a route ∈ , is = 1 = exp(− ⋅ )∑ exp(− ⋅ )∈ , (5)
This stochastic route choice model assumes that there may be some irrationality involved in the route choice process; that is, the route with the minimum cost may not necessarily be chosen by all the travellers, due to imperfect travel information and drivers’ predictive behaviour.
The main novelty of the proposed agent-based, day-to-day traffic flow model lies in the incorporation of imperfect travel information through the cyber layer. It will be assumed that travelers form groups; within each group travel information is shared according to a mechanism that is an extension of Eqn (4); namely, the perception of one driver will be influenced by the travel experience not only of his/her own, but also of the others within the same group. Such an extension will be elaborated in Section 4.1.3. In general, however, the way the travelers form groups is arbitrary and difficult to capture using parameterization; to overcome this issue, we employ the percolation theory. A brief introduction of the application of percolation theory in the context of information sharing will be presented in the next section, while the proposed learning process based on information percolation will be detailed in Section 4.1.3.
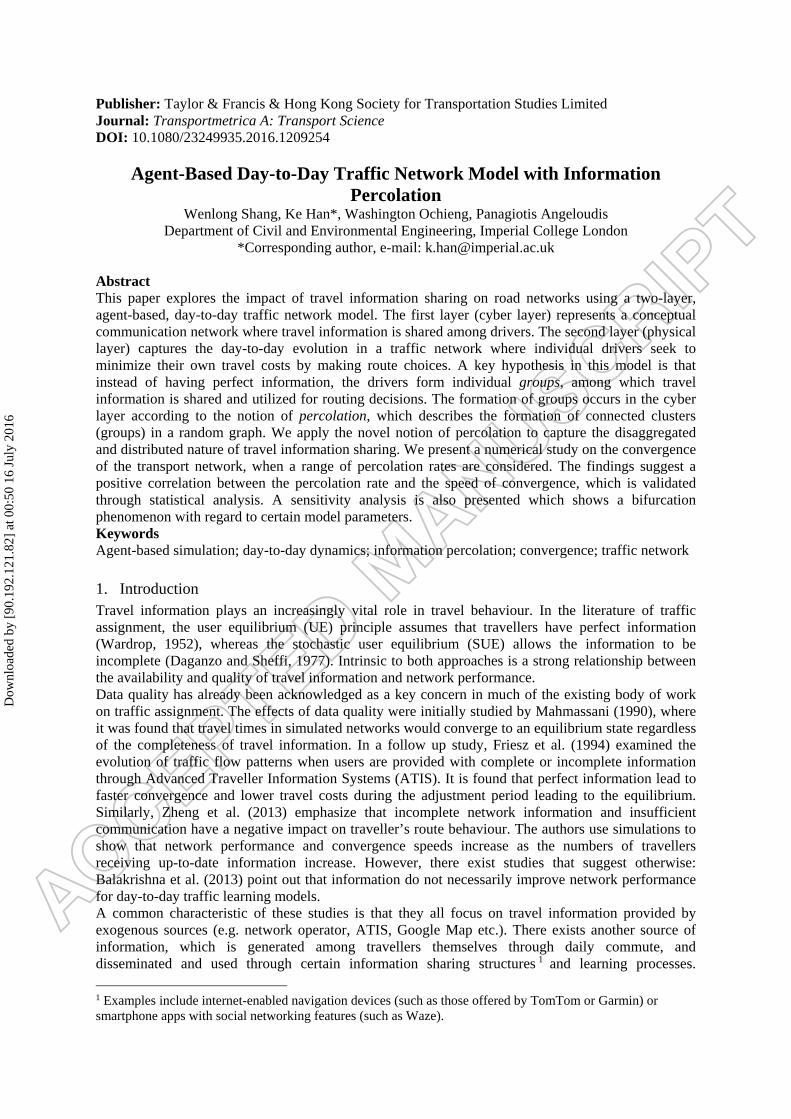
3.2 Random graph and percolation We invoke the notion of random graph to describe and quantify the connectivity among drivers and the degree of information accessibility. In particular, we define the nodes in the random graph to be all the drivers of the same O-D pair. Then, for an arbitrary pair of nodes, the link between them, which represents the communication channel between the two drivers, is randomly generated according to a fixed probability ∈ (0,1), called percolation rate. In addition, the events of link generation between different node pairs are independent. As a result of this random generation of links, we will obtain a graph. Figure 1 shows three realizations of the random graph, with different percolation rates. As we can see from this figure, when the percolation rate is rather low (e.g. Figure 1a), the links are unlikely to be established and the nodes are completely disconnected; when the percolation rate becomes high (e.g. Figure 1c), the entire graph becomes connected. 4 Here, we introduce a few basic terminologies and notions in graph theory. We consider two graphs, ( , ) and ( , ), where , and , denote the sets of nodes and links, respectively.
4 A graph is said to be connected if any node is connected to any other node through finite number of links.
Dow
nloa
ded
by [
90.1
92.1
21.8
2] a
t 00:
50 1
6 Ju
ly 2
016

Definition 1. (Sub-graph and maximum connected sub-graph) We say that ( , ) is a sub-graph of ( , ), denoted ( , ) ⊂ ( , ), if ⊂ , ⊂ . A graph is connected if one can go from any node to another node by traversing the links in the graph. We say that ( , ) is a maximum connected sub-graph of ( , ) if for any connected graph ( , ) such that ( , ) ⊂ ( , ) ⊂ ( , ) it must be that ( , ) = ( , ). In prose, a graph is the maximum connected sub-graph if there exists no bigger and connected sub-graphs. For an arbitrary realization of the random graph with a percolation rate , we consider all of its maximum connected sub-graphs, each one corresponding to a driver group. By definition, any two drivers in the same group can be connected through finite number of communications (links); see Figure 1 (second row) for the determination of the driver groups.
Figure 1. Illustration of random graph and percolation. Form (a) to (c), the percolation rate increases, causing fewer maximum connected sub-graphs (driver groups), which are encircled by dark curves.
According to percolation theory, there exists a certain percolation rate threshold ∗ beyond which the entire network becomes fully or almost connected. In other words, as the percolation rate increases, the number of driver groups decreases; and when > ∗, with a very high probability, the driver group number is equal to 1. The study described in this paper borrows the core idea of percolation, by allowing random connections to be established among drivers, and assuming that information sharing can occur within the extent of the same driver group (i.e., maximum connected sub-graph of the communication network). Moreover, the day-to-day learning process of a given travel agent is influenced by the knowledge obtained from other members in the same group, creating a complex learning dynamic that is coupled with the actual traffic evolution on a daily basis. Note that the random graph approach considered in this paper is not an attempt to capture the real-world information sharing structure, which is affected by numerous factors and difficult to estimate due to the complex nature of social interaction and the lack of relevant data. Instead, for the ease of mathematical representation and parameterization, we consider a much simplified version that relies on random connectivity of travellers at the information (cyber) layer. This has given rise to a specific network configuration that falls within the scope of percolation theory. In particular, a range of connection probabilities, including the critical probability p∗ stipulated by the percolation theory, result in different degrees of network connectivity on the cyber layer, which manifest themselves on the traffic layer in terms of qualitative behaviours such as convergence.
4. An agent-based day-to-day traffic evolution model This section presents details of the agent-based day-to-day traffic assignment model underpinned by information percolation. We also propose a method of quantifying convergence of the stochastic traffic model. Each travel agent in our model is associated with a perception for each route in the network, which may change over time as the network evolves. Unlike existing literature on this approach (Davis and Nihan, 1993, Cominetti, 2013), our model also stipulates that an agent’s perception about a given
(a) (b) (c)
Dow
nloa
ded
by [
90.1
92.1
21.8
2] a
t 00:
50 1
6 Ju
ly 2
016
route may also be influenced by others in the same communication group even if he/she does not take that route.
4.1 Details of the agent-based simulation
4.1.1 Route choice model
We recall that the perception of agent regarding route on the -th day is denoted . The probability for choosing a particular route is thus given by the logit model: = 1 = exp −∑ exp −∈ , > 0 (6)
where the binary variable = 1 if agent selects route on day , and equals 0 otherwise. In the context of stochastic user equilibrium (Prashker and Bekhor, 2000), is termed the dispersion parameter, which is used to indicate the sensitivity of drivers to route costs. The resulting route choice model relies on the premise that agent travel choices depend on their subjective perceptions rather than the actual and objective route costs, due to a variety reasons including imperfect information, driving experience, and drivers’ socio-economic characteristics. This direction of research mainly focuses on relaxing the perfectly rational behaviour when it comes to route choices with perfect travel information. We note that the current form of the route choice model may be insufficient to capture the heterogeneity of road users and their complex and realistic decision-making processes; and there are many more advanced models for route choices, such as the mixed logit model (Ben-Elia and Shiftan, 2010), the nested logit model (Ben Akiva and Lerman, 1985), and the paired-combinatorial logit model (Chu, 1989, Koppelmana and Wen, 2000). However, this paper is a theoretical investigation of the information-sharing paradigm. Instead of employing complicated route choice models with the attempt to replicate reality, we are relying on simplified route choice assumptions in order to highlight the role played by information sharing/percolation.
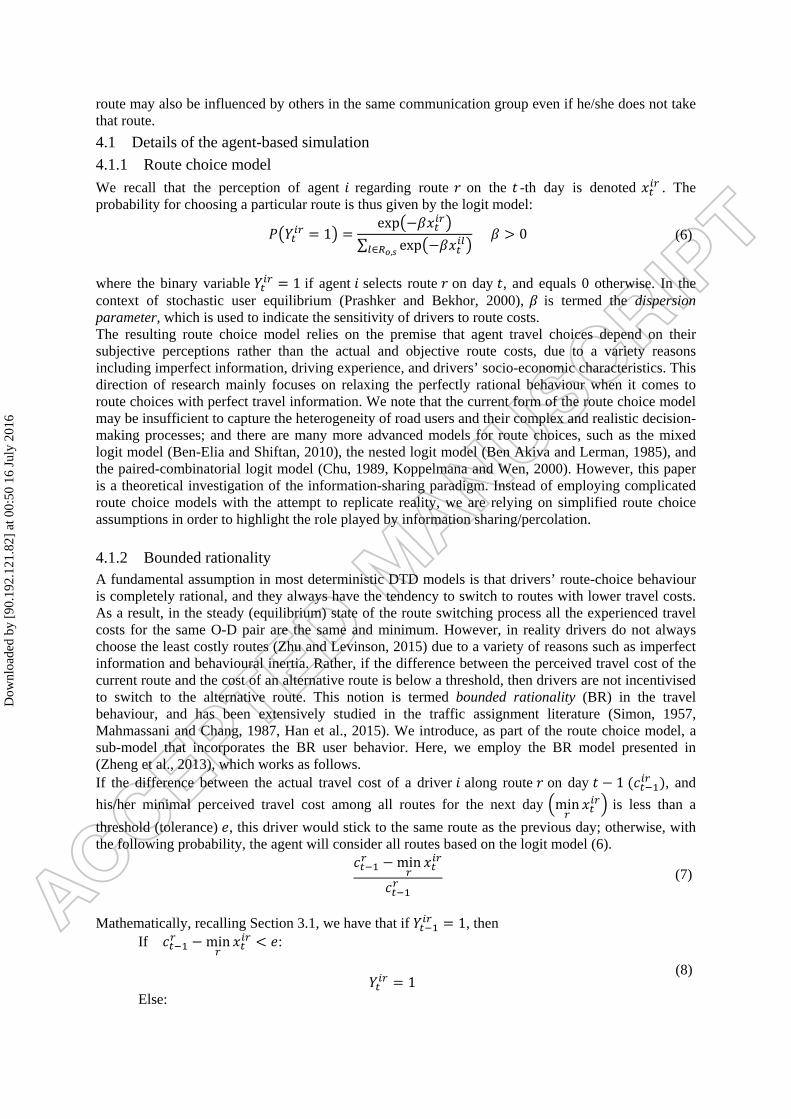
4.1.2 Bounded rationality A fundamental assumption in most deterministic DTD models is that drivers’ route-choice behaviour is completely rational, and they always have the tendency to switch to routes with lower travel costs. As a result, in the steady (equilibrium) state of the route switching process all the experienced travel costs for the same O-D pair are the same and minimum. However, in reality drivers do not always choose the least costly routes (Zhu and Levinson, 2015) due to a variety of reasons such as imperfect information and behavioural inertia. Rather, if the difference between the perceived travel cost of the current route and the cost of an alternative route is below a threshold, then drivers are not incentivised to switch to the alternative route. This notion is termed bounded rationality (BR) in the travel behaviour, and has been extensively studied in the traffic assignment literature (Simon, 1957, Mahmassani and Chang, 1987, Han et al., 2015). We introduce, as part of the route choice model, a sub-model that incorporates the BR user behavior. Here, we employ the BR model presented in (Zheng et al., 2013), which works as follows. If the difference between the actual travel cost of a driver along route on day − 1( ), and
his/her minimal perceived travel cost among all routes for the next day min is less than a
threshold (tolerance) , this driver would stick to the same route as the previous day; otherwise, with the following probability, the agent will consider all routes based on the logit model (6). −min
(7)
Mathematically, recalling Section 3.1, we have that if = 1, then If −min < :
(8) = 1 Else:
Dow
nloa
ded
by [
90.1
92.1
21.8
2] a
t 00:
50 1
6 Ju
ly 2
016
= 1withprobability min + −min × exp −∑ exp −∈ ,= 1withprobability − min × exp −∑ exp −∈ , , ′ ∈ ,
We prove the mathematical validity of Eqn (8) by showing that the sum of probabilities for choosing all the routes between OD pair ( , ) is equal to one for each driver. Indeed, given the current route ∈ , , when the second case (indicated by ‘Else’ in (8)) occurs, we have = 1 + ∑ ( = 1)∈ ,
(9)
= min + −min × exp −∑ exp −∈ ,+ − min × exp −∑ exp −∈ ,∈ ,
= min + −min × ( exp −∑ exp −∈ , + exp −∑ exp −∈ , )∈ ,
=min + −min = 1
In this paper, both scenarios with and without bounded user rationality will be considered and tested later in our numerical study in Section 5. As we shall see, the convergence to a steady state is significantly improved in the bounded rationality case, which is in line with similar studies on bounded rationality (Mahmassani and Chang, 1987).
4.1.3 Updating route perceptions based on information sharing Eqn (10) below expresses the learning mechanism in the proposed model. It differs from the traditional formulation (4) in that it has an additional term, which represents the influence of drivers in the same group. In the proposed model, the perception of driver towards route on day is defined as: = + − + −∈ (0,1) (10)
where α weighs the influence of the driver’s own experience, and , > 0 measures the impact of driver ’s experience about route . We normalize the parameters , by stipulating that = ∑ ∈ for all ∈ such that =1 (11)
where ∈ (0,1) is a constant. Eqn (11) means that, for all the drivers in the same group as , and who used route on the previous day − 1, they have equal weights which sum up to be . The parameters and combined determine how much a driver’s perception is influenced by his/her own experience and by others in the same group. Remark 1. In general, and may be dependent on time and/or a specific traveller . For example, the degree of influence by self and others may be related to the driver’s age, gender, socio-economic status (in which case is relevant), and familiarity with the network (in which case may be relevant). Here, due to the lack of relevant real-world data and without loss of such generality, we employ the simplified formulation (10) and (11). The first summation term on the right hand side of (10) is the perception of agent on route on the previous day ( − 1), which encapsulates the driver’s past driving experience. The second term
Dow
nloa
ded
by [
90.1
92.1
21.8
2] a
t 00:
50 1
6 Ju
ly 2
016
expresses a self-correction process where the perception on the same route is updated based on the actual driving experience on the previous day ( − 1). The third term is another correction process, which is based on the actual experience of other drivers in the same group. This third term expresses how other drivers’ perceptions cumulatively impact that of the subject driver. Eqn (10) can be seen an extension of the following learning process (Cominetti, 2013), which relies solely on the agent’s own traveling experience without any communication with others. = + − (12)
In fact, the learning process described in (12) can be regarded as a special case of our model; namely, if no connections on the cyber layer are present, each agent will constitute a group and (10) immediately reduces to (12).
Remark 2. This paper employs an agent-based simulation (ABS) in which each traveller’s trip and decision-making process is modelled individually. In addition, the realization of one’s route choice is stochastic with probabilities given by the logit model. Therefore, regardless of the state of the system, it is entirely possible that travellers’ route choices differ on any two consecutive days as a result of the aforementioned stochasticity. In this sense, the proposed day-to-day ABS has no stationary/steady state. However, one could relax the model by assuming that travellers are “infinitely splittable” (i.e. non-atomic), then the stochasticity can be eliminated. The steady state of this relaxed problem is a stochastic user equilibrium with bounded rationality.
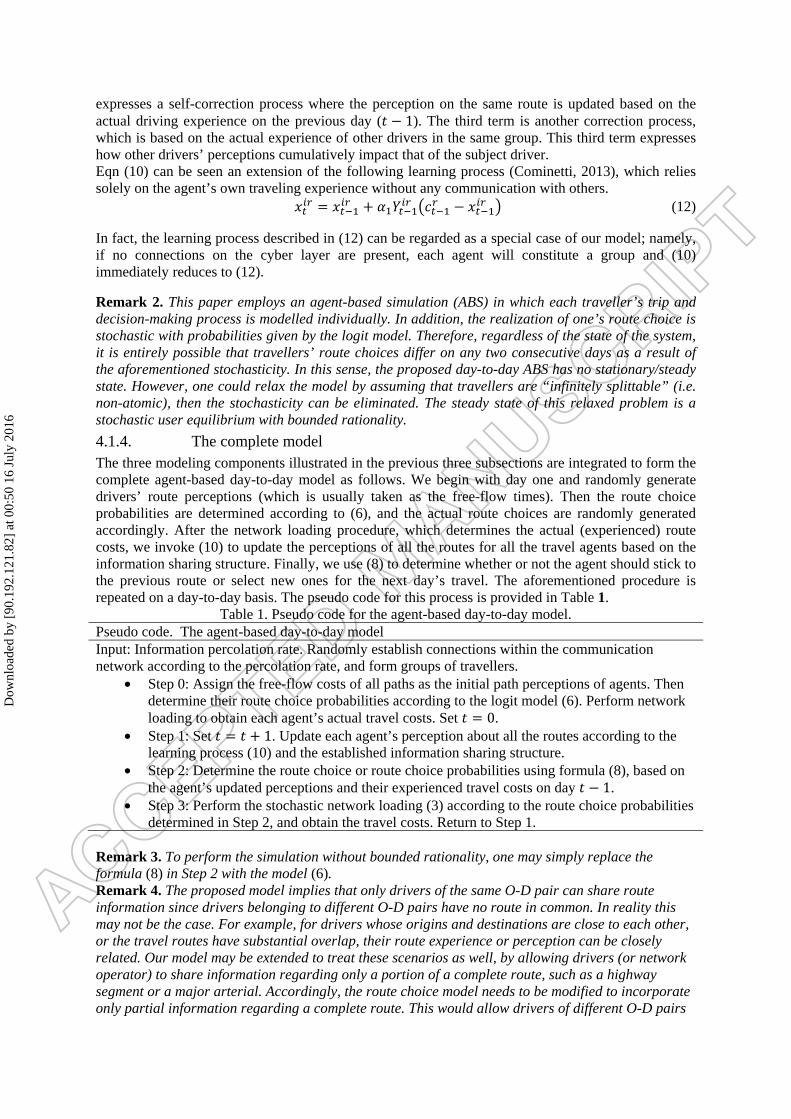
4.1.4. The complete model The three modeling components illustrated in the previous three subsections are integrated to form the complete agent-based day-to-day model as follows. We begin with day one and randomly generate drivers’ route perceptions (which is usually taken as the free-flow times). Then the route choice probabilities are determined according to (6), and the actual route choices are randomly generated accordingly. After the network loading procedure, which determines the actual (experienced) route costs, we invoke (10) to update the perceptions of all the routes for all the travel agents based on the information sharing structure. Finally, we use (8) to determine whether or not the agent should stick to the previous route or select new ones for the next day’s travel. The aforementioned procedure is repeated on a day-to-day basis. The pseudo code for this process is provided in Table 1.
Table 1. Pseudo code for the agent-based day-to-day model. Pseudo code. The agent-based day-to-day model Input: Information percolation rate. Randomly establish connections within the communication network according to the percolation rate, and form groups of travellers.
• Step 0: Assign the free-flow costs of all paths as the initial path perceptions of agents. Then determine their route choice probabilities according to the logit model (6). Perform network loading to obtain each agent’s actual travel costs. Set = 0.
• Step 1: Set = + 1. Update each agent’s perception about all the routes according to the learning process (10) and the established information sharing structure.
• Step 2: Determine the route choice or route choice probabilities using formula (8), based on the agent’s updated perceptions and their experienced travel costs on day − 1.
• Step 3: Perform the stochastic network loading (3) according to the route choice probabilities determined in Step 2, and obtain the travel costs. Return to Step 1.
Remark 3. To perform the simulation without bounded rationality, one may simply replace the formula (8) in Step 2 with the model (6). Remark 4. The proposed model implies that only drivers of the same O-D pair can share route information since drivers belonging to different O-D pairs have no route in common. In reality this may not be the case. For example, for drivers whose origins and destinations are close to each other, or the travel routes have substantial overlap, their route experience or perception can be closely related. Our model may be extended to treat these scenarios as well, by allowing drivers (or network operator) to share information regarding only a portion of a complete route, such as a highway segment or a major arterial. Accordingly, the route choice model needs to be modified to incorporate only partial information regarding a complete route. This would allow drivers of different O-D pairs
Dow
nloa
ded
by [
90.1
92.1
21.8
2] a
t 00:
50 1
6 Ju
ly 2
016

to share information and interact with each other on both the cyber and physical layers of the transportation network.
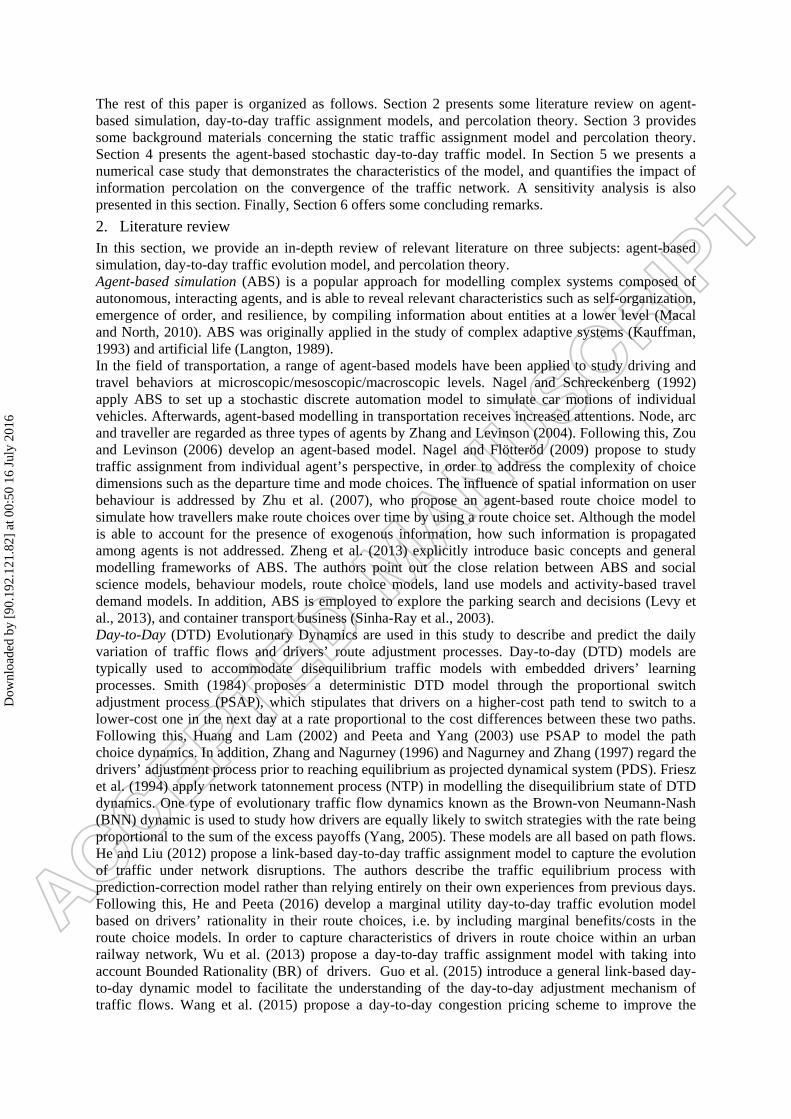
4.2 Quantifying convergence of the network The proposed ABDTD model contains two types of stochasticity. The first one arises from the random connections that are established due to the percolation rate in the cyber layer. The second one is inherent to the stochastic, logit-based route choice model. Notice that the latter introduces no stochasticity to the model if the latter is non-atomic (i.e. the flows are continuous), which is not the case for agent-based approaches. With this in mind, the resulting model performance will be subject to a great deal of uncertainty, making qualitative analysis regarding convergence difficult. In order to properly characterize the convergence of the system in the presence of random noise, we propose the following criterion for convergence in an approximate sense. Let us consider the curve illustrated in Figure 2. Such a curve could be regarded as a generic state variable (with given travel costs, or volumes, on a given path). As the iteration goes on, the curve may stabilize around certain value, albeit with minor local oscillations due to the presence of random route choices.
Figure 2. Illustration of approximate convergence.
In order to reasonably declare the convergence of such a state variable with quantifiable and tuneable measures, we consider a region with length and width ; see Figure 2.The following definition of convergence is employed. Definition 2. (Approximate convergence) Consider a region with length and width . A time-trajectory of a certain quantity is said to converge at time = if the trajectory starting from ending at + is entirely within such a region; in addition, should be the earliest time such that this property holds. We therefore have: = : max∈( , ) ( ) − min∈( , ) ( ) < (10)
In prose, the above definition means that certain quantity can be regarded as convergent on day = if in the next days the oscillations of this quantity are all within a given threshold . Clearly, this is a reasonable criterion for declaring approximate convergence. Moreover, the strictness of this convergence measure can be adjusted by changing the values of and . We note that this definition of approximate convergence is highly related to the notion of stability in the Lagrange sense, which refers to the situation where the time-trajectory of the state variable remains bounded beyond certain point in time (Nemytskii and Stepanov, 1960). This is an important notion for studying traffic equilibria as a real-life traffic network rarely operates at perfect equilibrium; instead, it is more likely to ‘orbit’ around one while exhibiting the Lagrange stability.
5. Numerical study This section presents some simulation results for the proposed model, and illustrates the qualitative behaviour of the network with different degrees of information transparency and accessibility. Through a comparison of network performances associated with different percolation rates on the cyber layer, we will illustrate how the travel information shared across a number of agents affects the qualitative behaviour of the network, namely, its convergence to an approximate equilibrium state. In particular, we will show flow patterns, users’ route choices, route cost, as well as the convergence of
t (day) T
n !
f (t)
Dow
nloa
ded
by [
90.1
92.1
21.8
2] a
t 00:
50 1
6 Ju
ly 2
016
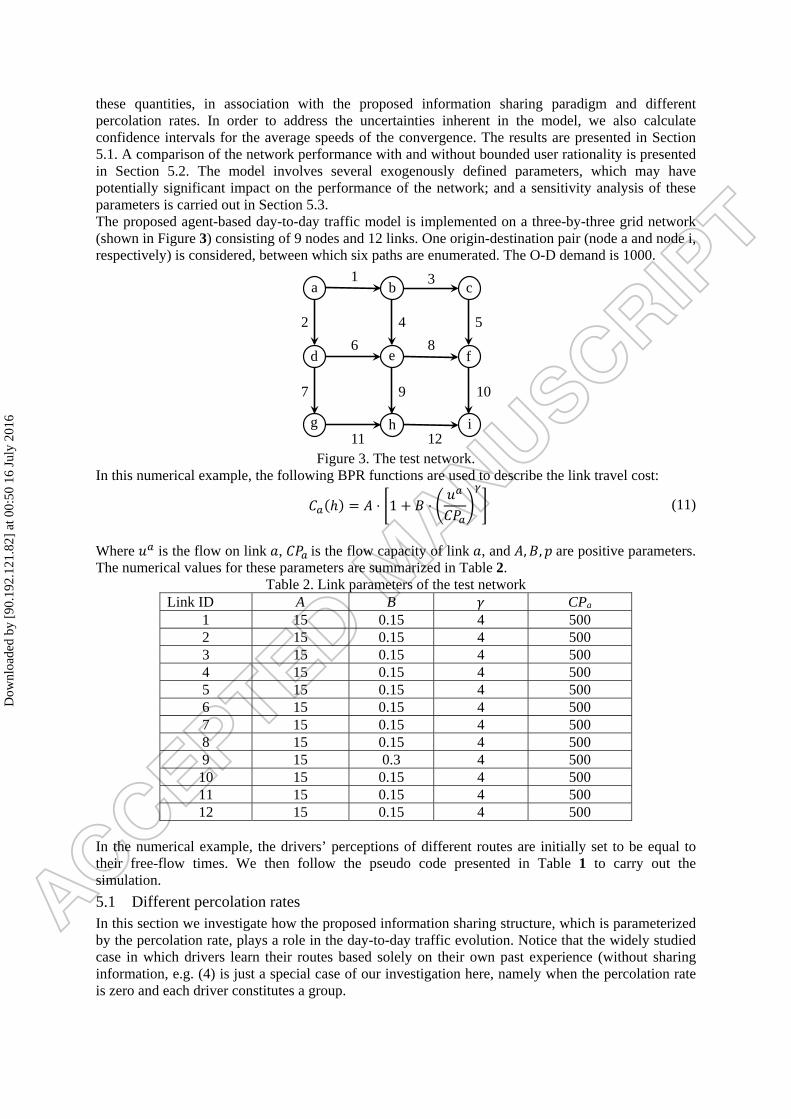
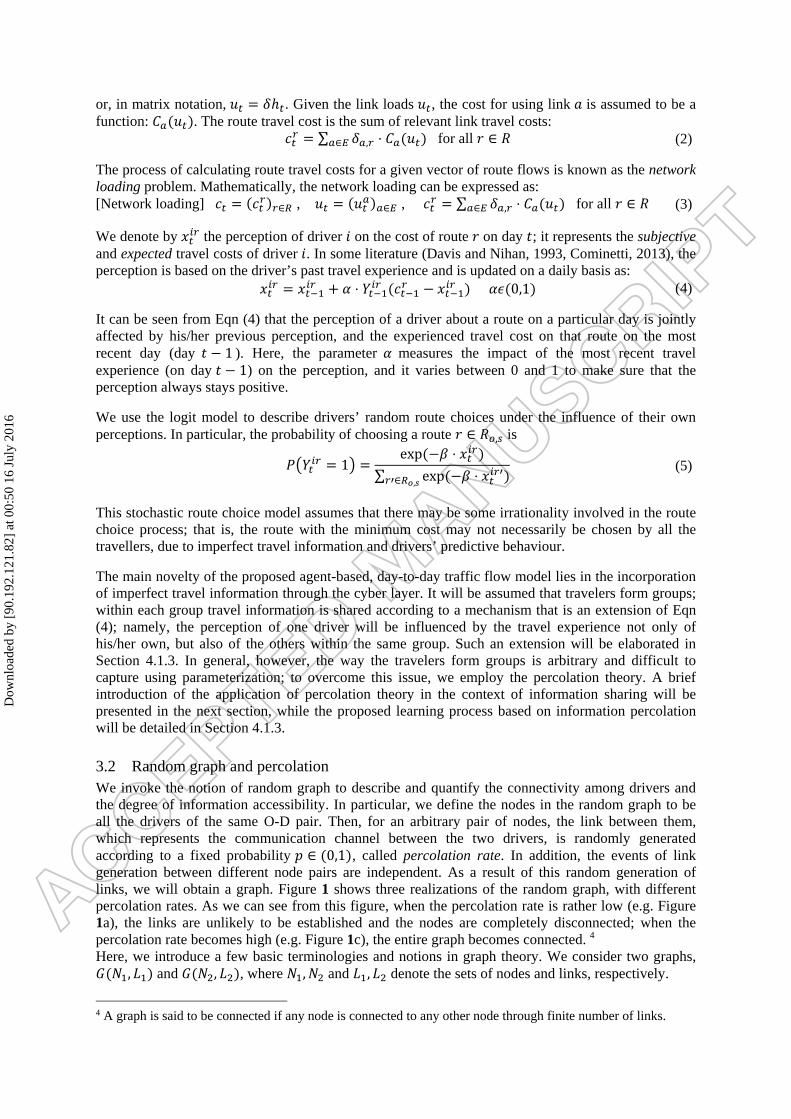
these quantities, in association with the proposed information sharing paradigm and different percolation rates. In order to address the uncertainties inherent in the model, we also calculate confidence intervals for the average speeds of the convergence. The results are presented in Section 5.1. A comparison of the network performance with and without bounded user rationality is presented in Section 5.2. The model involves several exogenously defined parameters, which may have potentially significant impact on the performance of the network; and a sensitivity analysis of these parameters is carried out in Section 5.3. The proposed agent-based day-to-day traffic model is implemented on a three-by-three grid network (shown in Figure 3) consisting of 9 nodes and 12 links. One origin-destination pair (node a and node i, respectively) is considered, between which six paths are enumerated. The O-D demand is 1000.
Figure 3. The test network.
In this numerical example, the following BPR functions are used to describe the link travel cost: (ℎ) = ⋅ 1 + ⋅ (11)
Where is the flow on link , is the flow capacity of link , and , , are positive parameters. The numerical values for these parameters are summarized in Table 2.
Table 2. Link parameters of the test network Link ID A B CPa
1 15 0.15 4 500 2 15 0.15 4 500 3 15 0.15 4 500 4 15 0.15 4 500 5 15 0.15 4 500 6 15 0.15 4 500 7 15 0.15 4 500 8 15 0.15 4 500 9 15 0.3 4 500 10 15 0.15 4 500 11 15 0.15 4 500 12 15 0.15 4 500
In the numerical example, the drivers’ perceptions of different routes are initially set to be equal to their free-flow times. We then follow the pseudo code presented in Table 1 to carry out the simulation.
5.1 Different percolation rates In this section we investigate how the proposed information sharing structure, which is parameterized by the percolation rate, plays a role in the day-to-day traffic evolution. Notice that the widely studied case in which drivers learn their routes based solely on their own past experience (without sharing information, e.g. (4) is just a special case of our investigation here, namely when the percolation rate is zero and each driver constitutes a group.
a
d
g
b
e
h
c
f
i
1 3
2 4 5
6 8
7 9 10
11 12
Dow
nloa
ded
by [
90.1
92.1
21.8
2] a
t 00:
50 1
6 Ju
ly 2
016
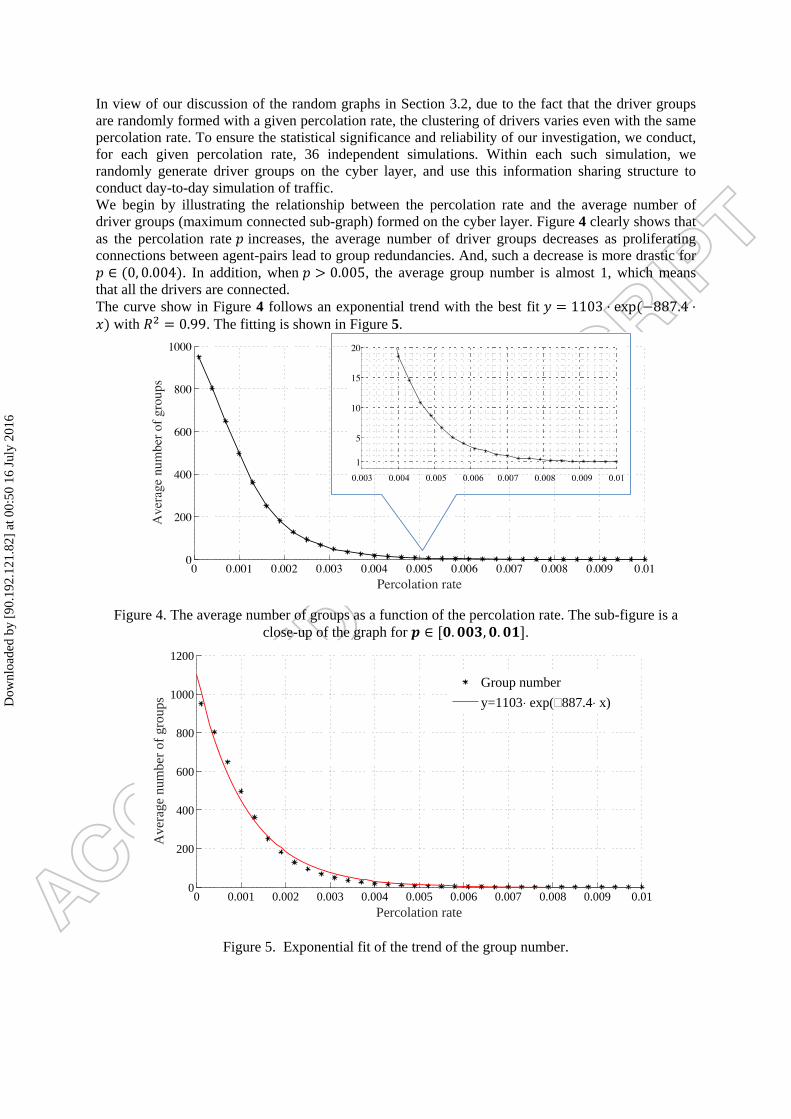
In view of our discussion of the random graphs in Section 3.2, due to the fact that the driver groups are randomly formed with a given percolation rate, the clustering of drivers varies even with the same percolation rate. To ensure the statistical significance and reliability of our investigation, we conduct, for each given percolation rate, 36 independent simulations. Within each such simulation, we randomly generate driver groups on the cyber layer, and use this information sharing structure to conduct day-to-day simulation of traffic. We begin by illustrating the relationship between the percolation rate and the average number of driver groups (maximum connected sub-graph) formed on the cyber layer. Figure 4 clearly shows that as the percolation rate increases, the average number of driver groups decreases as proliferating connections between agent-pairs lead to group redundancies. And, such a decrease is more drastic for ∈ (0, 0.004). In addition, when > 0.005, the average group number is almost 1, which means that all the drivers are connected. The curve show in Figure 4 follows an exponential trend with the best fit = 1103 ⋅ exp(−887.4 ⋅) with = 0.99. The fitting is shown in Figure 5.
Figure 4. The average number of groups as a function of the percolation rate. The sub-figure is a
close-up of the graph for ∈ [ . , . ].
Figure 5. Exponential fit of the trend of the group number.
0 0.001 0.002 0.003 0.004 0.005 0.006 0.007 0.008 0.009 0.010
200
400
600
800
1000
1200
Percolation rate
Ave
rage
num
ber
of g
roup
s
Group number
y=1103⋅ exp( 887.4⋅ x)Dow
nloa
ded
by [
90.1
92.1
21.8
2] a
t 00:
50 1
6 Ju
ly 2
016
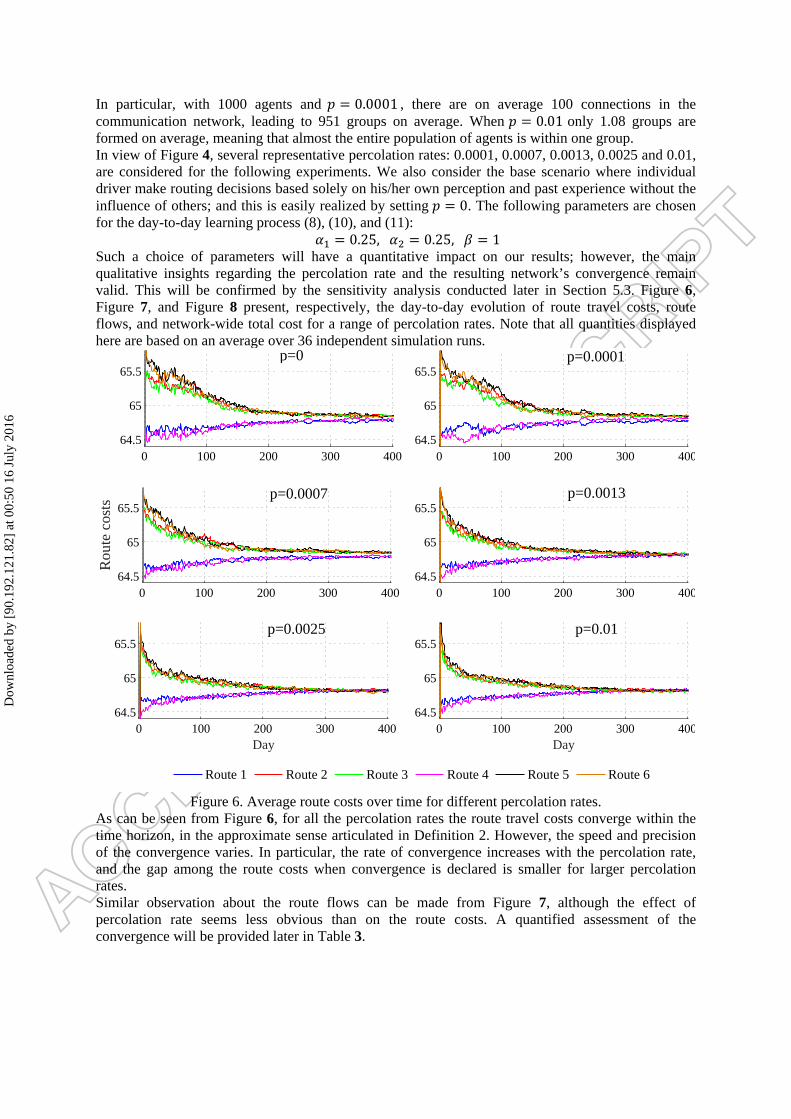
In particular, with 1000 agents and = 0.0001 , there are on average 100 connections in the communication network, leading to 951 groups on average. When = 0.01 only 1.08 groups are formed on average, meaning that almost the entire population of agents is within one group. In view of Figure 4, several representative percolation rates: 0.0001, 0.0007, 0.0013, 0.0025 and 0.01, are considered for the following experiments. We also consider the base scenario where individual driver make routing decisions based solely on his/her own perception and past experience without the influence of others; and this is easily realized by setting = 0. The following parameters are chosen for the day-to-day learning process (8), (10), and (11): = 0.25, = 0.25, = 1 Such a choice of parameters will have a quantitative impact on our results; however, the main qualitative insights regarding the percolation rate and the resulting network’s convergence remain valid. This will be confirmed by the sensitivity analysis conducted later in Section 5.3. Figure 6, Figure 7, and Figure 8 present, respectively, the day-to-day evolution of route travel costs, route flows, and network-wide total cost for a range of percolation rates. Note that all quantities displayed here are based on an average over 36 independent simulation runs.
Figure 6. Average route costs over time for different percolation rates.
As can be seen from Figure 6, for all the percolation rates the route travel costs converge within the time horizon, in the approximate sense articulated in Definition 2. However, the speed and precision of the convergence varies. In particular, the rate of convergence increases with the percolation rate, and the gap among the route costs when convergence is declared is smaller for larger percolation rates. Similar observation about the route flows can be made from Figure 7, although the effect of percolation rate seems less obvious than on the route costs. A quantified assessment of the convergence will be provided later in Table 3.
0 100 200 300 40064.5
65
65.5
0 100 200 300 40064.5
65
65.5
Route 1 Route 2 Route 3 Route 4 Route 5 Route 6
0 100 200 300 40064.5
65
65.5
Rou
te c
osts
0 100 200 300 40064.5
65
65.5
0 100 200 300 40064.5
65
65.5
Day0 100 200 300 400
64.5
65
65.5
Day
p=0
p=0.0013p=0.0007
p=0.0025 p=0.01
p=0.0001
Dow
nloa
ded
by [
90.1
92.1
21.8
2] a
t 00:
50 1
6 Ju
ly 2
016
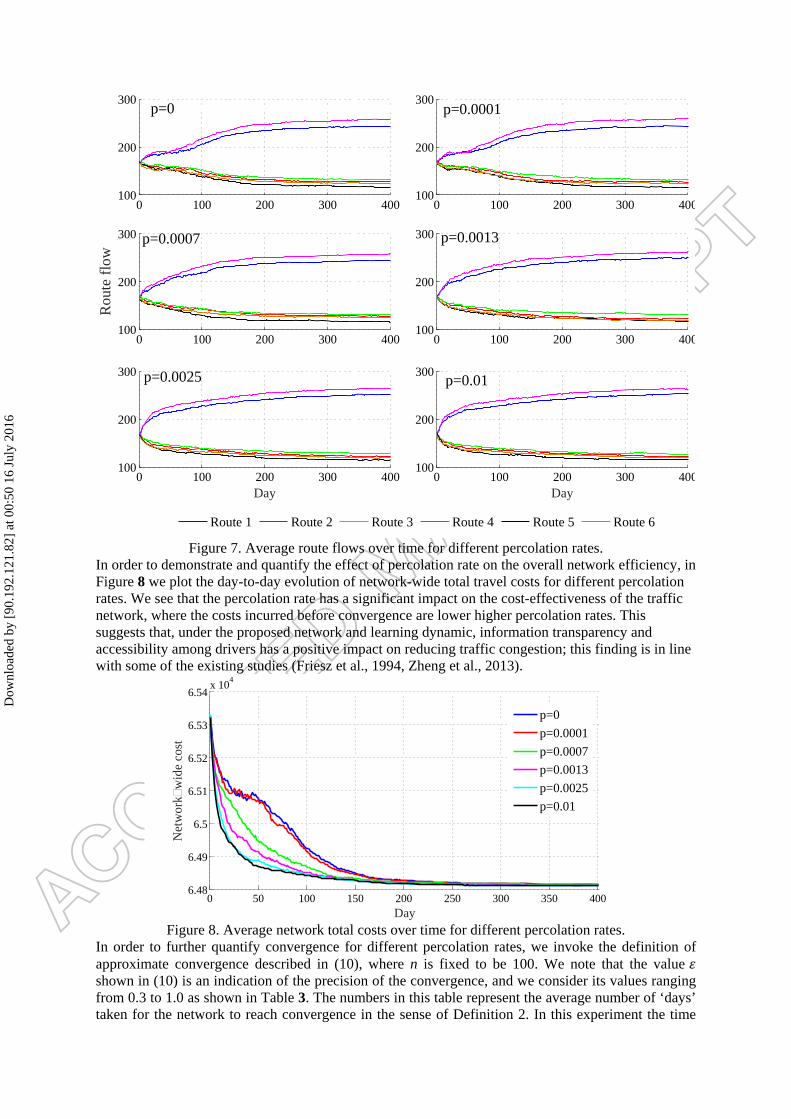
Figure 7. Average route flows over time for different percolation rates.
In order to demonstrate and quantify the effect of percolation rate on the overall network efficiency, in Figure 8 we plot the day-to-day evolution of network-wide total travel costs for different percolation rates. We see that the percolation rate has a significant impact on the cost-effectiveness of the traffic network, where the costs incurred before convergence are lower higher percolation rates. This suggests that, under the proposed network and learning dynamic, information transparency and accessibility among drivers has a positive impact on reducing traffic congestion; this finding is in line with some of the existing studies (Friesz et al., 1994, Zheng et al., 2013).
Figure 8. Average network total costs over time for different percolation rates.
In order to further quantify convergence for different percolation rates, we invoke the definition of approximate convergence described in (10), where n is fixed to be 100. We note that the value shown in (10) is an indication of the precision of the convergence, and we consider its values ranging from 0.3 to 1.0 as shown in Table 3. The numbers in this table represent the average number of ‘days’ taken for the network to reach convergence in the sense of Definition 2. In this experiment the time
0 100 200 300 400100
200
300
Route 1 Route 2 Route 3 Route 4 Route 5 Route 6
0 100 200 300 400100
200
300
0 100 200 300 400100
200
300
Rou
te f
low
0 100 200 300 400100
200
300
0 100 200 300 400100
200
300
Day0 100 200 300 400
100
200
300
Day
p=0.0007
p=0.0025
p=0.0001p=0
p=0.0013
p=0.01
0 50 100 150 200 250 300 350 4006.48
6.49
6.5
6.51
6.52
6.53
6.54x 10
4
Day
Net
wor
kw
ide
cost
p=0
p=0.0001
p=0.0007
p=0.0013
p=0.0025
p=0.01
Dow
nloa
ded
by [
90.1
92.1
21.8
2] a
t 00:
50 1
6 Ju
ly 2
016
horizon is 1000 days, and in Table 3 a value of 1000 indicates that convergence was not reached within the prescribed time horizon.
Table 3. Average number of days taken to reach convergence. = 0.3 = 0.4 = 0.5 = 0.6 = 0.7 = 0.8 = 0.9 = 1.0 = 0 1000 920.58 603.64 218.72 188.03 160.17 141.36 125.78 = 0.0001 1000 938.5 440.81 239.92 179.53 149.61 130.59 117.58 = 0.0007 980.56 797.64 303.89 189.33 157.97 130.28 105.92 93.86 = 0.0013 940.78 484.06 234.17 154.83 128.58 110.08 84.78 75.72 = 0.0025 940.28 403.47 192.97 153.64 120.31 94.92 75.31 56.72 = 0.01 858.97 320.5 188.03 146.81 118.08 91.56 62.44 47.17
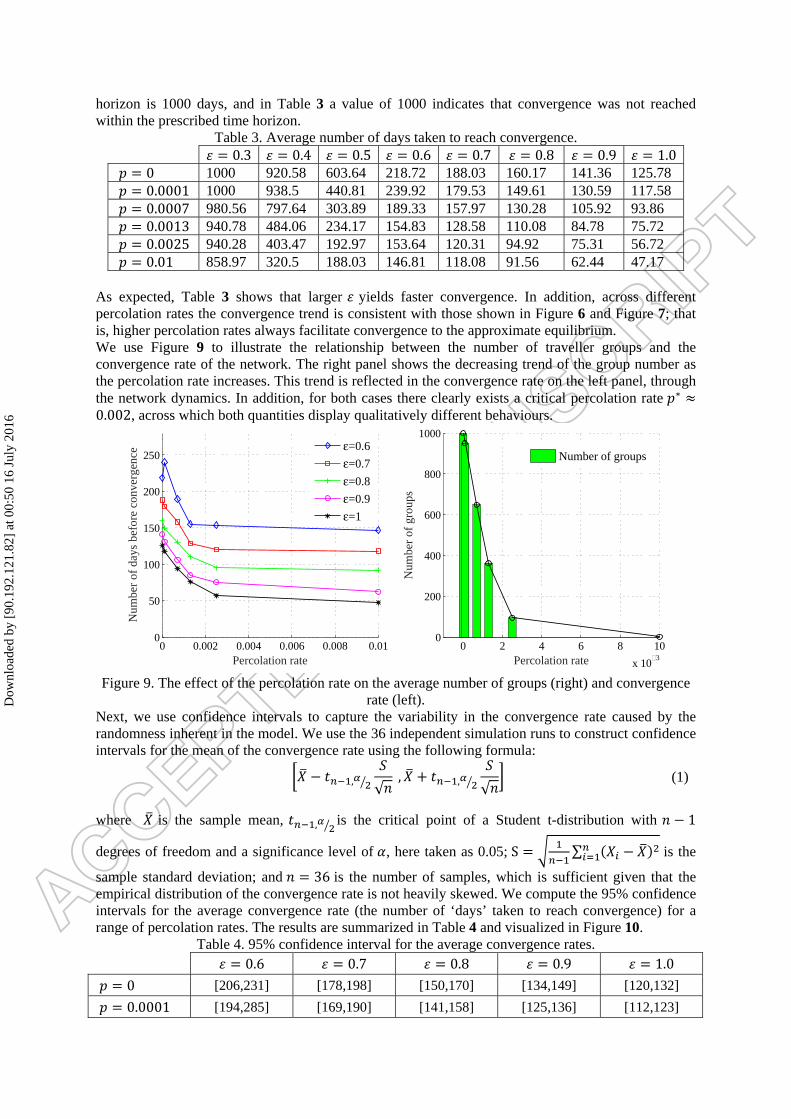
As expected, Table 3 shows that larger yields faster convergence. In addition, across different percolation rates the convergence trend is consistent with those shown in Figure 6 and Figure 7; that is, higher percolation rates always facilitate convergence to the approximate equilibrium. We use Figure 9 to illustrate the relationship between the number of traveller groups and the convergence rate of the network. The right panel shows the decreasing trend of the group number as the percolation rate increases. This trend is reflected in the convergence rate on the left panel, through the network dynamics. In addition, for both cases there clearly exists a critical percolation rate ∗ ≈0.002, across which both quantities display qualitatively different behaviours.
Figure 9. The effect of the percolation rate on the average number of groups (right) and convergence
rate (left). Next, we use confidence intervals to capture the variability in the convergence rate caused by the randomness inherent in the model. We use the 36 independent simulation runs to construct confidence intervals for the mean of the convergence rate using the following formula: − , √ , + , √ (1)
where is the sample mean, , is the critical point of a Student t-distribution with − 1
degrees of freedom and a significance level of , here taken as 0.05; S = ∑ ( − ) is the
sample standard deviation; and = 36 is the number of samples, which is sufficient given that the empirical distribution of the convergence rate is not heavily skewed. We compute the 95% confidence intervals for the average convergence rate (the number of ‘days’ taken to reach convergence) for a range of percolation rates. The results are summarized in Table 4 and visualized in Figure 10.
Table 4. 95% confidence interval for the average convergence rates. = 0.6 = 0.7 = 0.8 = 0.9 = 1.0
= 0 [206,231] [178,198] [150,170] [134,149] [120,132]
= 0.0001 [194,285] [169,190] [141,158] [125,136] [112,123]
0 0.002 0.004 0.006 0.008 0.010
50
100
150
200
250
Percolation rate
Num
ber
of d
ays
befo
re c
onve
rgen
ce
ε=0.6
ε=0.7
ε=0.8
ε=0.9
ε=1
0 2 4 6 8 10
x 103
0
200
400
600
800
1000
Percolation rate
Num
ber
of g
roup
s
Number of groups
Dow
nloa
ded
by [
90.1
92.1
21.8
2] a
t 00:
50 1
6 Ju
ly 2
016
= 0.0007 [179,199] [149,167] [123,138] [100,111] [88,100]
= 0.0013 [146,164] [122,135] [104,116] [81,89] [71,80]
= 0.0025 [145,162] [113,128] [87,103] [68,83] [52,62]
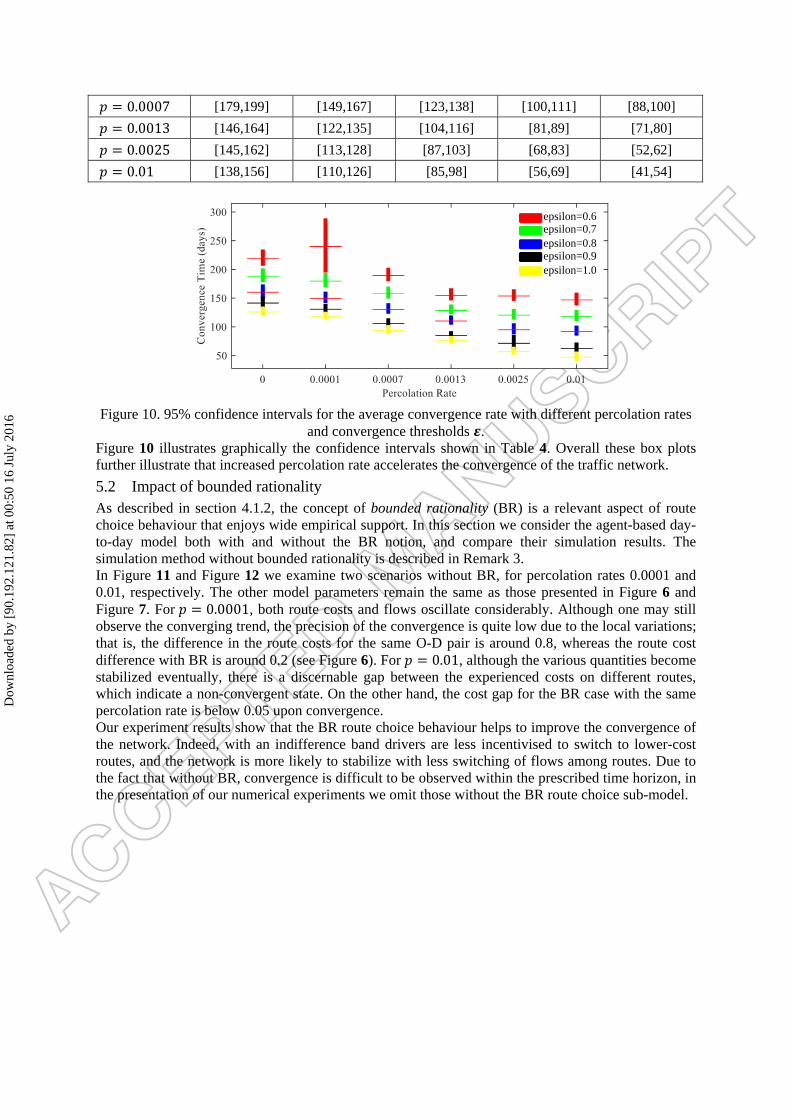
= 0.01 [138,156] [110,126] [85,98] [56,69] [41,54]
Figure 10. 95% confidence intervals for the average convergence rate with different percolation rates
and convergence thresholds . Figure 10 illustrates graphically the confidence intervals shown in Table 4. Overall these box plots further illustrate that increased percolation rate accelerates the convergence of the traffic network.
5.2 Impact of bounded rationality As described in section 4.1.2, the concept of bounded rationality (BR) is a relevant aspect of route choice behaviour that enjoys wide empirical support. In this section we consider the agent-based day-to-day model both with and without the BR notion, and compare their simulation results. The simulation method without bounded rationality is described in Remark 3. In Figure 11 and Figure 12 we examine two scenarios without BR, for percolation rates 0.0001 and 0.01, respectively. The other model parameters remain the same as those presented in Figure 6 and Figure 7. For = 0.0001, both route costs and flows oscillate considerably. Although one may still observe the converging trend, the precision of the convergence is quite low due to the local variations; that is, the difference in the route costs for the same O-D pair is around 0.8, whereas the route cost difference with BR is around 0.2 (see Figure 6). For = 0.01, although the various quantities become stabilized eventually, there is a discernable gap between the experienced costs on different routes, which indicate a non-convergent state. On the other hand, the cost gap for the BR case with the same percolation rate is below 0.05 upon convergence. Our experiment results show that the BR route choice behaviour helps to improve the convergence of the network. Indeed, with an indifference band drivers are less incentivised to switch to lower-cost routes, and the network is more likely to stabilize with less switching of flows among routes. Due to the fact that without BR, convergence is difficult to be observed within the prescribed time horizon, in the presentation of our numerical experiments we omit those without the BR route choice sub-model.
epsilon=0.6 epsilon=0.7 epsilon=0.8 epsilon=0.9 epsilon=1.0
Dow
nloa
ded
by [
90.1
92.1
21.8
2] a
t 00:
50 1
6 Ju
ly 2
016
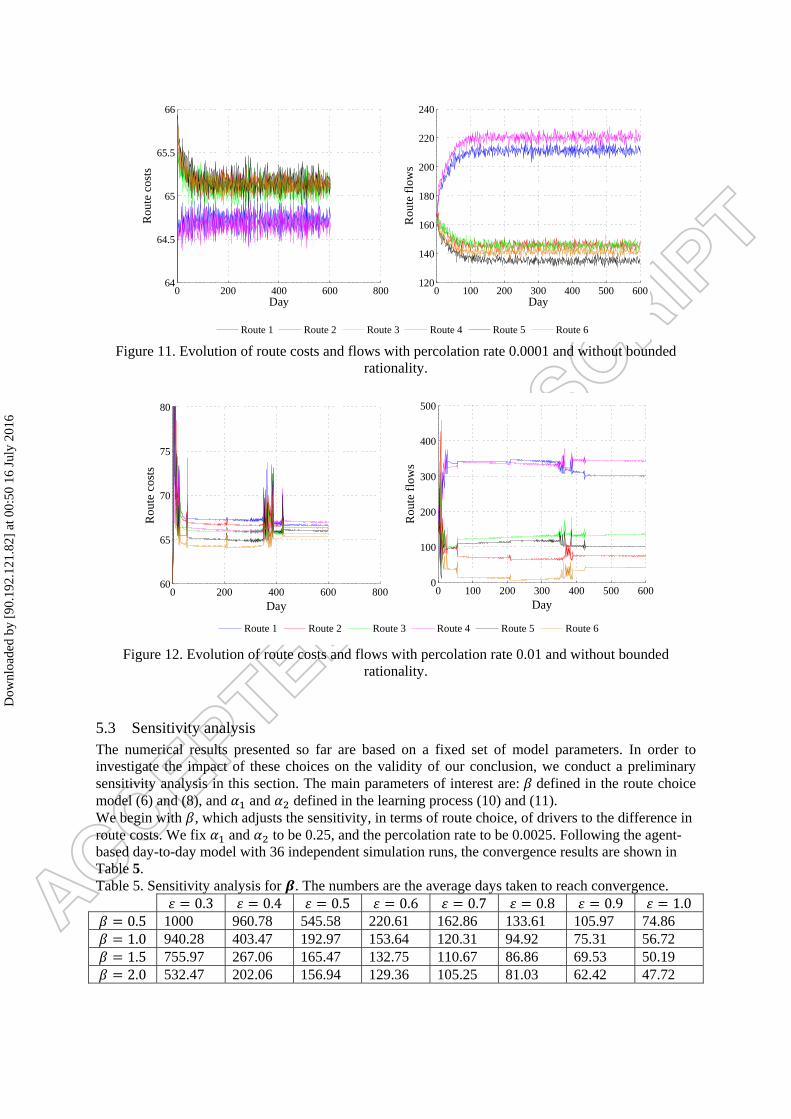
Figure 11. Evolution of route costs and flows with percolation rate 0.0001 and without bounded
rationality.
Figure 12. Evolution of route costs and flows with percolation rate 0.01 and without bounded
rationality.
5.3 Sensitivity analysis The numerical results presented so far are based on a fixed set of model parameters. In order to investigate the impact of these choices on the validity of our conclusion, we conduct a preliminary sensitivity analysis in this section. The main parameters of interest are: defined in the route choice model (6) and (8), and and defined in the learning process (10) and (11). We begin with , which adjusts the sensitivity, in terms of route choice, of drivers to the difference in route costs. We fix and to be 0.25, and the percolation rate to be 0.0025. Following the agent-based day-to-day model with 36 independent simulation runs, the convergence results are shown in Table 5. Table 5. Sensitivity analysis for . The numbers are the average days taken to reach convergence. = 0.3 = 0.4 = 0.5 = 0.6 = 0.7 = 0.8 = 0.9 = 1.0 = 0.5 1000 960.78 545.58 220.61 162.86 133.61 105.97 74.86 = 1.0 940.28 403.47 192.97 153.64 120.31 94.92 75.31 56.72 = 1.5 755.97 267.06 165.47 132.75 110.67 86.86 69.53 50.19 = 2.0 532.47 202.06 156.94 129.36 105.25 81.03 62.42 47.72
0 200 400 600 80064
64.5
65
65.5
66
Day
Rou
te c
osts
0 100 200 300 400 500 600120
140
160
180
200
220
240
Day
Rou
te f
low
s
Route 1 Route 2 Route 3 Route 4 Route 5 Route 6
0 200 400 600 80060
65
70
75
80
Day
Rou
te c
osts
Route 1 Route 2 Route 3 Route 4 Route 5 Route 6
0 100 200 300 400 500 6000
100
200
300
400
500
Day
Rou
te f
low
s
Dow
nloa
ded
by [
90.1
92.1
21.8
2] a
t 00:
50 1
6 Ju
ly 2
016

As shown in Table 5, when increases the convergence of the network improves accordingly. However, the positive impact of on the convergence diminishes as becomes larger. This is apparent from Figure 13.
Figure 13. Sensitivity analysis of .
We next test the model sensitivity with regard to and . These two parameters represent, respectively, weights assigned to the travel cost experienced by oneself and others, during the update of one’s route perception; see (10) and (11). In Table 6, is set to be 1 and the percolation rate remains 0.0025. It can be seen from this table that regardless of our choice of (= = ), the convergence trends are similar to those shown earlier. Table 6. Sensitivity analysis of = = . The numbers are the average days taken to reach convergence.
= 0.3 = 0.4 = 0.5 = 0.6 = 0.7 = 0.8 = 0.9 = 1.0 = 0.05 1000 757.83 349.47 224.28 161.33 130.78 106.42 87.64 = 0.10 960.06 585.5 210.92 180.83 144.28 115.92 84.83 69.92 = 0.25 940.28 403.47 192.97 153.64 120.31 94.92 75.31 56.72 = 0.50 940.39 367.97 182.64 153.08 120.72 90.22 70.17 47.81 Figure 14 provides a visualization of the convergence results. Overall the convergence becomes faster when and increase. However, similar to Figure 13, the effects of and become less significant when increases.
Figure 14. Sensitivity analysis of = = .
In Table 6 and Figure 14 both and are set to the same value. In the following we allow both parameters to vary independently, with the goal of identifying the effect of individual parameter. In Figure 15 and Figure 16, we test several combinations of and , each varying from 0.05 to 0.75, and show the change in the convergence rates. Interestingly, for different percolation rates we observe
0.5 1 1.5 20
100
200
300
400
500
600
β
Num
ber
of d
ays
need
ed to
con
verg
e
ε=0.5
ε=0.6
ε=0.7
ε=0.8
ε=0.9
ε=1
0.05 0.1 0.15 0.2 0.25 0.3 0.35 0.4 0.45 0.50
50
100
150
200
250
300
350
400
α=α1=α
2
Num
ber
of d
ays
need
ed to
con
verg
e
ε=0.5
ε=0.6
ε=0.7
ε=0.8
ε=0.9
ε=1
Dow
nloa
ded
by [
90.1
92.1
21.8
2] a
t 00:
50 1
6 Ju
ly 2
016

qualitatively different convergence trends. For smaller percolation rate (fewer drivers in the same group), such as = 0.0001, the convergence is facilitated by having larger values of , which corresponds to the information transmitted from other group members. However, when the percolation rate gets very large (more drivers in the same group), for instance = 0.01, having large values of seems to hinder convergence, and fast convergence is observed mostly for very small . For percolation rates that are less extreme, i.e. ∈ {0.0007, 0.0013, 0.0019, 0.0025}, the situations are less straightforward and seem to exhibit some kind of transitional states. In particular, there seems to be a bifurcation point ( = 0.0013), which separates two qualitatively different convergence trends. Our observation is confirmed in both Figure 15 and Figure 16.
Figure 15. Sensitivity analysis of individual and . The z-axis represent the number of days taken to reach convergence with = . . and denote the percolation rate and average group number,
respectively.
Figure 16. Sensitivity analysis of individual and . The z-axis represent the number of days taken
to reach convergence with = . and denote the percolation rate and average group number, respectively.
0.050.1
0.250.5
0.75
0.050.1
0.250.5
0.75
0
500
1000
α1α
2
0.050.1
0.250.5
0.75
0.050.1
0.250.5
0.75
0
500
1000
α1α
2
0.050.1
0.250.5
0.75
0.050.1
0.250.5
0.75
0
500
1000
α1α
2
0.050.1
0.250.5
0.75
0.050.1
0.250.5
0.75
0
500
1000
α1α
2
0.050.1
0.250.5
0.75
0.050.1
0.250.5
0.75
0
500
1000
α1α
2
0.050.1
0.250.5
0.75
0.050.1
0.250.5
0.75
0
500
1000
α1α
2
p=0.0007N=650
p=0.0013N=380
p=0.0025N=100
p=0.01N=1
p=0.0001N=960
p=0.0019N=190
0.050.1
0.250.5
0.75
0.050.1
0.250.5
0.75
0
200
400
600
α1α
2
0.050.1
0.250.5
0.75
0.050.1
0.250.5
0.75
0
200
400
600
α1α
2
0.050.1
0.250.5
0.75
0.050.1
0.250.5
0.75
50
100
150
200
α1α
2
0.050.1
0.250.5
0.75
0.050.1
0.250.5
0.75
0
100
200
300
α1α
2
0.050.1
0.250.5
0.75
0.050.1
0.250.5
0.75
0
100
200
300
α1α
2
0.050.1
0.250.5
0.75
0.050.1
0.250.5
0.75
0
100
200
300
α1α
2
p=0.01N=1
p=0.0025N=100
p=0.0019N=190
p=0.0001N=960
p=0.0007N=650
p=0.0013N=380
Dow
nloa
ded
by [
90.1
92.1
21.8
2] a
t 00:
50 1
6 Ju
ly 2
016
Our explanation for the aforementioned two extreme cases are as follows. When is very small, there is very little extra information available to a driver since the groups tend to be very small. Thus if the driver relies more on such information, as represented by a large , the network is more likely to converge. On the contrary, if is very large, a driver receives much information from many group members, and relying too much on it would introduce much disturbance and noisy influence to the dynamics, and thus slowing down convergence. Overall, regardless of the values of and , the convergence improves as the percolation rate gets higher, which is consistent with the main finding of this paper. As a summary of this section, the sensitivity analyses show that the effects of , , and are minor on the convergence for certain range ( ∈ [0.6, 1]). Similar results hold for different percolation rates; for brevity, these are not shown in this paper. Moreover, the conclusion regarding the relationship between the percolation rate and the convergence remain qualitatively valid.
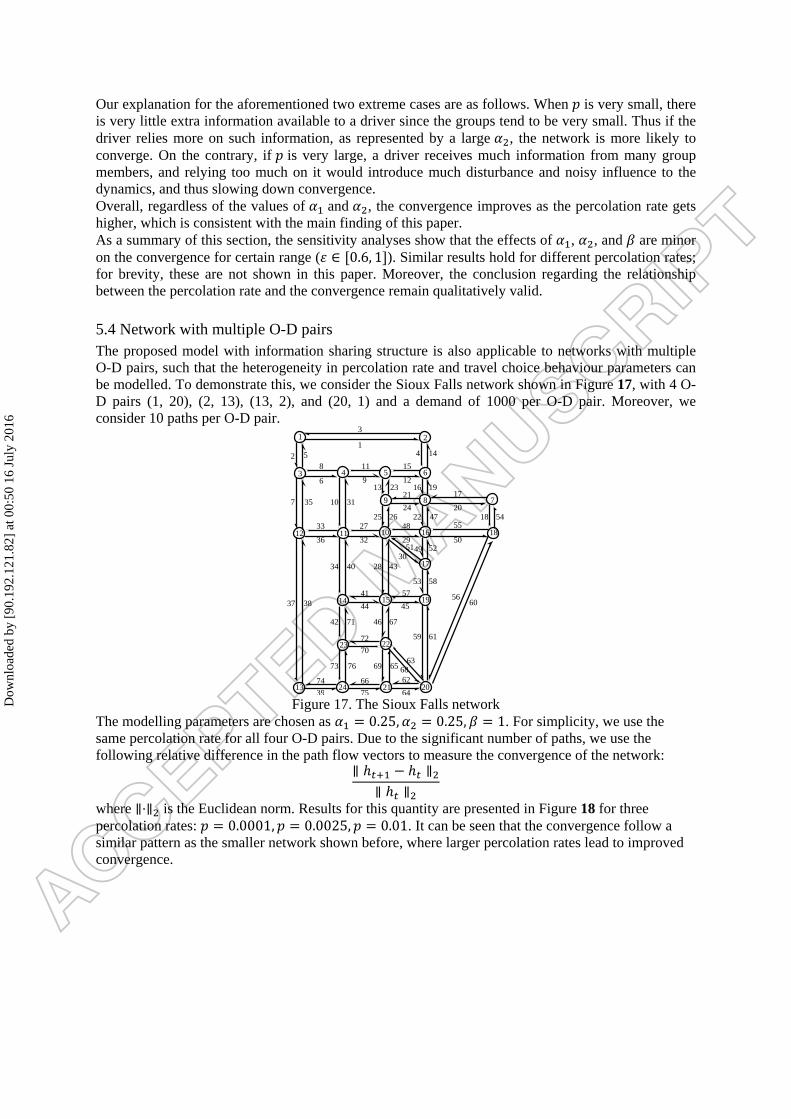
5.4 Network with multiple O-D pairs The proposed model with information sharing structure is also applicable to networks with multiple O-D pairs, such that the heterogeneity in percolation rate and travel choice behaviour parameters can be modelled. To demonstrate this, we consider the Sioux Falls network shown in Figure 17, with 4 O-D pairs (1, 20), (2, 13), (13, 2), and (20, 1) and a demand of 1000 per O-D pair. Moreover, we consider 10 paths per O-D pair.
Figure 17. The Sioux Falls network
The modelling parameters are chosen as = 0.25, = 0.25, = 1. For simplicity, we use the same percolation rate for all four O-D pairs. Due to the significant number of paths, we use the following relative difference in the path flow vectors to measure the convergence of the network: ∥ ℎ − ℎ ∥∥ ℎ ∥
where ∥⋅∥ is the Euclidean norm. Results for this quantity are presented in Figure 18 for three percolation rates: = 0.0001, = 0.0025, = 0.01. It can be seen that the convergence follow a similar pattern as the smaller network shown before, where larger percolation rates lead to improved convergence.
3 4 5 6
9
3
12
8
6
47
5
1 2
7 10
12 11 10 16
49
13 23 16 1921
242625
2951
8
36 32
483322
7
18
20
17
50
5518 54
13
23
14 15 19
22
24 21 2074 66
75
62
64
697673
42
59
6563
34 2840
71
4330
53 58
61
52
17
5660
46 67
68
3837
3135
4 14
12
15
27
9
11
45
5741
44
72
70
39
Dow
nloa
ded
by [
90.1
92.1
21.8
2] a
t 00:
50 1
6 Ju
ly 2
016

Figure 18. Convergence of path flows in the Sioux Falls network.
Figure 19 shows the daily evolution of network-wide travel cost for all the four O-D pairs. Interestingly, unlike Figure 8, higher percolation rate leads to higher total cost, even after the network has converged. This suggests that more information provision could lead to a loss of efficiency.
Figure 19. Network-wide travel cost.
6. Conclusion and future research This paper proposes an agent-based, day-to-day (ABDTD) model, which, for the first time in the literature, incorporates percolation theory in order to capture and quantify the impact of information sharing structure on the convergence of the traffic network. A physical network is used to capture the underlying traffic network (along with links, nodes and users), while percolation theory is used in conjunction with a conceptual communication network (the cyber layer) to model the transmission of travel decisions and experiences among users. An agent-based simulation is used to study the daily evolution of the traffic network and drivers’ route choices, under the influence of imperfect information and users’ bounded rationality. The results suggest a strong positive correlation between the percolation rate, which reflects the connectivity of the communication network, and the convergence of the network. This finding is further confirmed through statistical validation and sensitivity analysis. Our results show that higher percolation rates in the formation of the random network in the cyber layer lead to improved convergence of the network, in terms of both rate and precision. This is partially in line with some studies that indicate the positive relationship between information transparency and network convergence or efficiency. However, different from those studies, this paper focus on information generated within travel groups based on their past travel experience. As a result, we are able to quantify the effect of percolation rate on the network convergence with statistical significance. Moreover, we also explore the impact of boundedly rational route choice behaviour on the network convergence, with a variety of percolation rates. The results suggest that
0 50 100 150 200 250 300 350 4000
0.02
0.04
0.06
0.08
0.1
Day
||ht+
1h t|| 2/||
h t|| 2
p=0.0001
p=0.0025
p=0.01
0 50 100 150 200 250 300 350 4000
0.5
1
1.5
2
2.5
3
3.5
4x 10
6
Day
Tot
al tr
avel
cos
t
p=0.0001
p=0.0025
p=0.01
Dow
nloa
ded
by [
90.1
92.1
21.8
2] a
t 00:
50 1
6 Ju
ly 2
016

with bounded rationality the network is more likely to converge to a steady state, and the precision of the convergence is also improved, compared to the case without BR. As mentioned in Remark 4, one limitation of the current modelling framework is that it does not allow path information to be distributed and utilized between different O-D pairs. This stems from the fact that different O-D pairs have disjoint sets of paths (with no overlap), thus it is not straightforward, at least mathematically, to make use of drivers’ perception of one path (that belongs to certain O-D pair) for use by drivers who consider another path (that belongs to a different O-D pair). To resolve this issue, one needs to define the level of overlap between the two paths, and somehow captures the correlation between the perceptions of these two paths, which is a necessary step towards addressing information sharing among different O-D pairs and will be pursued in a future study. The proposed model is a theoretical abstraction of the information-sharing network in real-life traffic systems. As a future study, we will refine and improve the modelling of the cyber layer by considering more realistic information-sharing mechanisms supported by relevant data. Specifically, we will treat the information layer as a weighted graph to take into account the strength and reliability of the connections, and consider the evolution of the network using models like preferential attachment. The proposed modelling framework, although still in a preliminary form, is potentially useful to study the influence of travel information sharing paradigm on important network properties beyond convergence. These include, but are not limited to, stability, resilience, robustness, permanence, reliability, and sustainability. Finally, we note that the proposed modelling framework may be used to study real-time information provision (such as TomTom and Google Map) and its impact on the network. More specifically, the so-called “day” in our model can be re-scaled to represent an arbitrary time interval such as an hour or 15 minutes. On a rolling-horizon basis we can propagate both traffic and information in a dynamic or semi-dynamic fashion, and the travel information shared within groups of travellers becomes real-time in nature. This is an important extension of our model and will be pursued in a future study. ACKNOWLEDGEMENT The first author of this paper is supported by the Chinese Scholarship Council (CSC). REFERENCES ALBERT, R. & BARABÁSI, A.-L. 2002. Statistic mechanics of complex networks. Reviews of
modern physics, 74, 47-97. ALBERT, R., JEONG, H. & BARABASI, A.-L. 2000. Error and attack tolerance of complex
networks. Nature, 406, 378-382 BALAKRISHNA, R., BEN-AKIVA, M., BOTTOM, J. & GAO, S. 2013. Information Impacts on
Traveler Behavior and Network Performance: State of Knowledge and Future Directions. Advances in Dynamic Network Modeling in Complex Transportation Systems, 2, 193-224.
BEN-ELIA, E. & SHIFTAN, Y. 2010. Which road do I take? A learning-based model of route-choice behavior with real-time information. Transportation Research Part A: Policy and Practice, 44, 249-264.
BEN AKIVA, M. & LERMAN, S. R. 1985. Discrete Choice Analysis: Theory and Application in Travel Demand. MIT Press, Cambridge, MA.
BROADBENT, S. R. & HAMMERSLEY, J. M. 1957. Percolation Processes I: Crystals and mazes. Proc. Camb. Philos. Soc., 53, 629–641.
BRODERA, A., KUMARB, R. K., MAGHOULA, F., RAGHAVANB, P., RAJAGOPALANB , S., STATAC , R., TOMKINSB, A. & WIENERC, J. 2000. Graph structure in the Web. Computer Networks, 33, 309-320.
CHU, C. 1989. A paired combinatorial logit model for travel demand analysis. Proceedings of the Fifth World Conference on Transportation Research, Western Periodicals Co., Ventura, CA, 295–309.
COMINETTI, R. 2013. Adaptive Dynamics and Equilibrium in Congested Networks. TRISTAN VIII, Triennial Symposium on Transportation Analysis.
DAGANZO, C. F. & SHEFFI, Y. 1977. On stochastic models of traffic assignment. Transportation Science, 11, 253-274.
Dow
nloa
ded
by [
90.1
92.1
21.8
2] a
t 00:
50 1
6 Ju
ly 2
016

DAVIS, G. A. & NIHAN, N. L. 1993. Large population approximations of a general stochastic traffic assignment model. Operations Research 41, 169-178.
FRIESZ, T. L., BERNSTEIN, D., MEHTA, N. J. & TOBIN, R. L. 1994. Day-To-Day Dynamic Network Disequilibria and Idealized Traveler Information Systems. Operations Research, 42, 1120-1136.
GASTNER, M. n.d. Percolation theory. Available at http://wwwf.imperial.ac.uk/~mgastner/percolation/percolation.
GUO, R.-Y., YANG, H., HUANG, H.-J. & TAN, Z. 2015. Link-based day-to-day network traffic dynamics and equilibria. Transportation Research Part B: Methodological, 71, 248-260.
HAN, K., SZETO, W. Y. & FRIESZ, T. L. 2015. Formulation, existence, and computation of boundedly rational dynamic user equilibrium with fixed or endogenous user tolerance. Transportation Research Part B: Methodological, 79, 16-49.
HE, X. & LIU, H. X. 2012. Modeling the day-to-day traffic evolution process after an unexpected network disruption. Transportation Research Part B: Methodological, 46, 50-71.
HE, X. & PEETA, S. 2016. A marginal utility day-to-day traffic evolution model based on one-step strategic thinking. Transportation Research Part B, 84, 237-255.
HEATH, R. A. 2000. Nonlinear dynamics: techniques and applications in psychology. Lawrence Erlbaum.
HUANG, H.-J. & LAM, W. H. K. 2002. Modeling and solving the dynamic user equilibrium route and departure time choice problem in network with queues. Transportation Research Part B, 36, 253–273.
KAUFFMAN, S. A. 1993. The Origins of Order: Self-Organization and Selection in Evolution. Oxford University Press: Oxford, UK.
KING, P., BULDYREV, S., DOKHOLYAN, N., HAVLIN, S., LOPEZ, E., PAUL, G. & STANLEY, H. 2002. Percolation Theory. Draft on website, http://www.lps.org.uk/docs/Percolation_Theory.
KOPPELMANA, F. S. & WEN, C.-H. 2000. The paired combinatorial logit model: properties, estimation and application. Transportation Research Part B: Methodological, 34, 75-89.
LANGTON, C. G. 1989. Artificial Life: Proceedings of an Interdisciplinary Workshop on the Synthesis and Simulation of Living Systems. (held September 1987, Los Alamos, New Mexico, Vol. VI in Santa Fe Institute Studies in the Sciences of Complexity),Addison-Wesley: Reading, MA.
LEVY, N., MARTENS, K. & BENENSON, I. 2013. Exploring cruising using agent-based and analytical models of parking. Transportmetrica A: Transport Science, 9, 773-797.
MACAL, C. M. & NORTH, M. J. 2010. Tutorial on agent-based modelling and simulation. Journal of Simulation, 4, 151-162.
MAHMASSANI, H. S. 1990. Information Impacts on Traveler Behavior: Experimental Investigation and Application to the Analysis of Planned Traffic Disruptions. Trans. Res, 24A.
MAHMASSANI, H. S. & CHANG, G.-L. 1987. On boundedly rational user equilibrium in transportation systems. Transportation Science, 21, 89-99.
NAGEL, K. & FLÖTTERÖD, G. 2009. Agent-based traffic assignment: going from trips to behavioral travelers. Paper presented at the 12th International Conference on Travel Behaviour Research (IATBR), Jaipur, December 2009.
NAGEL, K. & SCHRECKENBERG, M. 1992. A cellular automaton model for freeway traffic. Journal de Physique 2, 2221 - 2229.
NAGURNEY, A. & ZHANG, D. 1997. Projected dynamical systems in the formulation, stability analysis, and computation of fixed-demand traffic network equilibria. Transportation Science, 31, 147-158.
NEMYTSKII, V. V. & STEPANOV, V. V. 1960. Quantitative theory of differential equations. Princeton University Press.
NEWMAN, M. E. J. 2003. The Structure and Function of Complex Networks. SIAM Review, 45, 167-256.
PEETA, S. & YANG, T.-H. 2003. Stability issues for dynamic traffic assignment. Automatica, 39, 21-34.
Dow
nloa
ded
by [
90.1
92.1
21.8
2] a
t 00:
50 1
6 Ju
ly 2
016

PRASHKER, J. N. & BEKHOR, S. 2000. Some observations on stochastic user equilibrium and system optimum of traffic assignment. Transportation Research Part B: Methodological, 34, 277-291.
SAHINI, M. 1994. Applications of percolation theory. London : Taylor & Francis. SANDER, L. M., WARREN, C. P., SOKOLOV, I. M., SIMON, C. & KOOPMAN, J. 2002.
Percolation on disordered networks as a model for epidemics. Math. Biosci., 180, 293–305. SIMON, H. 1957. A behavioral model of rational choice. In Models of Man, Social and Mathematical
Essays on Rational Human Behavior in a Social Setting. New York: Wiley. SINHA-RAY, P., CARTER, J., FIELD, T., MASHALL, J., POLAK, J., SCHUMACHER, K., SONG,
D., WOODS, J. & ZHANG, J. 2003. Container World: Global agent-based modelling of the container transport business. Proceedings 4th workshop on Agent-Based Simulation, J.-P. Müller, M.-M. Seidel ©SCS Europe BVBA.
SMITH, M., HAZELTON, M. L., LO, H. K., CANTARELLA, G. E. & WATLING, D. P. 2013. The long term behaviour of day-to-day traffic assignment models. Transportmetrica A: Transport Science, 10, 647-660.
SMITH, M. J. 1984. The stability of a dynamic model of traffic assignment – an application of a method of Lyapunov. Transportation Science, 18, 245-252.
STAUFFER, D. & AHARONY, A. 1994. Introduction To Percolation Theory: Revised Second Edition. Taylor & Francis e-Library.
WANG, Y., LIU, H., HAN, K., FRIESZ, T. L. & YAO, T. 2015. Day-to-day congestion pricing and network resilience. Transportmetrica A: Transport Science, 11, 873-895.
WARDROP, J. G. 1952. Some theoretical aspects of road traffic research. Proceedings of the institution of civil engineers,Part 2, 325-378.
WU, J., SUN, H., WANG, D. Z. W., ZHONG, M., HAN, L. & GAO, Z. 2013. Bounded-rationality based day-to-day evolution model for travel behavior analysis of urban railway network. Transportation Research Part C: Emerging Technologies, 31, 73-82.
YANG, F. 2005. An evolutionary game theory approach to the day-to-day traffic dynamics. Dissertation, University of Wisconsin-Madison.
ZHANG, D. & NAGURNEY, A. 1996. On the local and global stability of a travel route choice adjustment process. Transportation Research Part B, 30, 245–262.
ZHANG, L. & LEVINSON, D. 2004. An agent-based approach to travel demand modeling: An exploratory analysis. In Transportation Research Record: Journal of the Transportation Research Board No.1898,.
ZHENG, H., SON, Y.-J., CHIU, Y.-C., HEAD, L., FENG, Y., XI, H., KIM, S. & HICKMAN, M. 2013. A Primer for Agent-Based Simulation and Modeling in Transportation Applications Technical Report, (No. FHWA-HRT-13-054).
ZHU, S. & LEVINSON, D. 2015. Do People Use the Shortest Path? An Empirical Test of Wardrop's First Principle. PLoS ONE, 10, e0134322.
ZHU, S., LEVINSON, D. M. & ZHANG, L. 2007. An Agent-Based Route Choice Model Available at SSRN: http://ssrn.com/abstract=1743621
ZOU, X. & LEVINSON, D. 2006. A Multi-Agent Congestion and Pricing Model. Transportmetrica, 2, 237-249.
Dow
nloa
ded
by [
90.1
92.1
21.8
2] a
t 00:
50 1
6 Ju
ly 2
016