Embed Size (px)
Citation preview

Leon County Post Disaster Redevelopment Plan Focus Group Meeting
Tallahassee Renaissance Center 2nd Floor Conference Center 435 North Macomb Street Tallahassee, Florida 32301
Tuesday, July 19, 2011 1p.m. – 3p.m.
Agenda I. Welcome
II. Leon County Post Disaster Redevelopment Plan Overview
III. Review of Draft Hazards Analysis and Vulnerability Assessment
a. Discuss GIS Methodology i. HAZUS – Deterministic Hurricane Scenario ii. HAZUS ‐ Flooding iii. Parcel level data and 2010 tax assessment ‐ Wildfire
b. Discuss Demographic Methodology i. 2005‐2009 ACS Data – available now, uses old geography ii. 2010 Census Data – available end of August, uses new
geography iii. 2006‐2010 ACS Data – available December, provides more
information than 2010 Census Data
IV. Input for Local Plan Integration Section a. LMS, CEMP, Comp Plan b. Others Local Plans to Consider
V. Set Future Meeting Dates
VI. Question and Answer
VII. Adjourn

DRAFT
HAZARD IDENTIFICATION AND
VULNERABILITY ASSESSMENT

ii
Table of Contents
Hazard Risk Overview
Disaster History
Hurricanes and Tornadoes
Wildfires
Flooding
Population and Demographic Vulnerability
Social Vulnerability
GIS Methodology
HAZUS
MEMPHIS/ELVIS
GIS Vulnerability and Risk Assessment
Hurricane Analysis
Wildfire Analysis
Flooding Analysis
Development Trends and Implications

ii

1
HAZARD IDENTIFICATION AND VULNERABILITY ASSESSMENT
Economic and social characteristics can have a great impact on post disaster redevelopment and ensuring community sustainability. This chapter provides identification of the hazards that could significantly impact Leon County as well as an assessment of vulnerabilities which may require post disaster redevelopment activities. Housing and public infrastructure are often the common focus of vulnerability discussions and analyses. Characteristics such as when structures were built, what codes were in place at the time of construction, location of the structures in hazardous areas and other variables have an impact on the vulnerability to disasters. Recognizing and identifying these vulnerabilities impacts what actions are to be taken before and after a disaster, as well as influence the creation of future policies and procedures regarding redevelopment. The information provided here focuses on the hazards identified in the Leon County Comprehensive Emergency Management Plan (CEMP) and vulnerability assessments provided in the Leon County Local Mitigation Strategy (LMS).
Hazard Risk Overview
The 2007 Leon County CEMP and the 2009 Leon County LMS highlight that Leon County is vulnerable to multiple hazards that could warrant post disaster redevelopment measures. Hurricanes and Wildfires are both considered to be high risk hazards as listed in the Leon County CEMP while flooding, tornadoes and thunderstorms are listed as medium risk hazards. The Leon County LMS provides a thorough examination of the historic impact, documented damages, vulnerable populations and potential economic impact associated with each hazard. The data and analysis provided in the LMS is summarized in this chapter for the purposes of the PDRP.
Disaster History
Leon County has been faced with numerous disasters associated with various natural hazards events in the last two decades. The majority of these federally declared disasters have resulted from severe storm events, six of which qualified for federal disaster assistance. The table below lists the federal disaster declarations since 1985. All declared disasters are related to severe weather, however Leon County is considered to be at high risk for Wildfires as well.

2
Recent Disasters in Leon County, 1985 ‐ 2010
Declaration Date Event Primary Damage
#756 Nov‐85 Hurricane Kate Debris; Power Outages
#862 Apr‐90 Unnamed Storm Flooding; Power Outages; Debris
#966 Mar‐93 Winter Storm Flooding; Power Outages; Debris
#1035 Jul‐94 T.S. Alberto Flooding; Debris; Power Outages
Undeclared Aug‐94 T.S. Beryl Flooding; Debris; Power Outages
#1069 Oct‐95 Hurricane Opal Flooding; Debris; Power Outages
#1223 Jun‐98 Wildfires Fire Damage
#2201 Jul‐98 Drought Crop Damage, Severe Heat
#1249 Sep‐98 Hurricane Georges Erosion, and Debris
#1339 Apr‐99 Fire; Drought Fire Damage, Crop Damage, Severe Heat
#1344 Oct‐00 T.S. Helene Riverine and Local Flooding
#1381 Jun‐01 T.S. Allison Riverine and Local Flooding
#1545 Sep‐04 Hurricane Frances Flooding; Debris
#1551 Sep‐04 Hurricane Ivan Flooding; Debris
#1561 Sep‐04 Hurricane Jeanne Debris
#1595 Jul‐05 Hurricane Dennis Debris
#1785 Aug‐08 T.S. Fay Flooding; Debris; Power Outages
#1831 Apr‐09 Severe Storms Flooding; Wind Damage
Source: Florida Division of Emergency Management, Bureau of Recovery and Mitigation. http://www.floridadisaster.org/BRM/Disasters/Disaster_history.htm
Hurricanes and Tornadoes
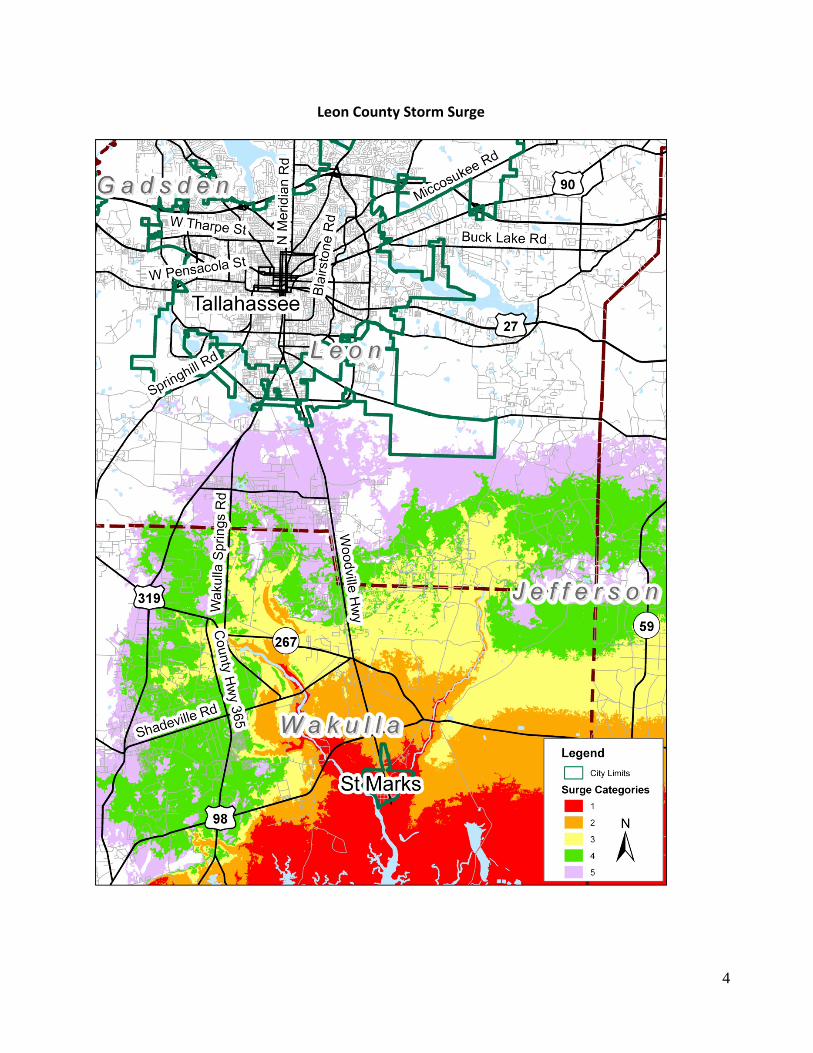
Situated less than 30 miles from the Gulf of Mexico, Leon County is vulnerable to storm surge from hurricanes. Based on information from the National Oceanic and Atmospheric Administration (NOAA) 13 tropical cyclones have passed within 60 miles of Leon County between 1985 and 2010. Of these, two were hurricanes when they impacted the Leon County area. The extent of the damaging inland winds, tornadic activity and associated flooding depends on the strength, forward speed and rainfall of each specific storm. Although the entire Leon County population is susceptible to impacts from hurricanes, those living in structurally unsound housing, manufactured housing and low‐lying areas face the greatest threat. Extensive damage to infrastructure, public and private property can be expected from high winds, tornadoes and fresh water flooding from heavy rainfall. There have

3
been sixteen reported tornadoes in Leon County from 1945‐2006. On November 11, 1995, an F‐1 tornado damaged the Civic Center and the South Ride Road area as it moved through Central Leon County.
Historical Track of Hurricanes Passing Within 60 Miles of Leon County, 1985 ‐ 2010
4
Leon County Storm Surge

5
Wildfires Florida’s typical “fire season” is from January through May. The most vulnerable areas are those generally located at the wild land urban interface, located throughout the County. Large amounts of dry underbrush require only an ignition source which can be from a fireplace, trash burn, cigarette, lightning or even the wheels of a passing train. Due to the concentration of residents in rural wooded areas of the county, additional threats to life and property exist therefore requiring increased mitigation efforts. Recent years have indicated an increase in wildfire activity. Since 1998 more than 15,000 wildfires have devastated over one million acres and destroyed more than 750 structures in Florida. Leon County and the City of Tallahassee have a record of county‐wide vulnerability to fires, specifically wildfires. However, the majority of large wildfires occurs on public land and is subject to specific management efforts by state and national foresters. Based on assessment of historical data and MEMPHIS analysis, wildfires are classified as a high‐risk to Leon County residents. The Division of Forestry recorded a total of 180 wildfires during the period from 1999‐2009, or an average of about 18 wildfires per year in Leon County. The majority of these are small‐acreage (less than 1.0 acres) burnings of debris in southern Leon County.
Leon County Wildfire Risk
Source: Florida Division of Forestry

6
Flooding Leon County and the City of Tallahassee have experienced significant growth in the last 30 years. Changing land uses have accompanied this growth and development, changing the natural topography and increasing the amount of impervious surfaces. The dynamics of land use within this growth context can serve to exacerbate flooding problems. As upland areas are developed, the natural detention capacity of the land diminishes, resulting in increased runoff rates and flow volumes. Flood problems can arise as conveyance capacities are exceeded and/or the sheer quantity of runoff overwhelms the system’s ability to absorb additional stormwater before properties and roadways become impacted. The land development code addresses stormwater runoff rates (not volume) by prohibiting post‐development discharge rates from exceeding predevelopment conditions for storms with recurrence frequencies up to a 25‐year event. While future growth and development should be of concern, the City of Tallahassee and Leon County Stormwater Management Plan identifies past development as the largest problem undermining the proper management of stormwater. There remains a significant need to address flood problems that have arisen from past development practices that failed to deal adequately with stormwater. A solution to this problem is difficult given limited available land within the urbanized landscape and the high costs to adequately retrofit problem areas.
Leon County 100 Year Flood
Plain
City of Tallahassee 100 Year Flood Plain

7
Population and Demographic Vulnerability The City of Tallahassee is the only incorporated municipality in Leon County, and is the state capital of Florida. Tallahassee is also home to two state universities, Florida State University (FSU) and Florida Agricultural and Mechanical University (FAMU). In 2000, the U.S. Census Bureau reported the total population within Leon County was 239,452 persons. Official 2007 population estimates for the City of Tallahassee and the unincorporated areas within Leon County are presented in the Table . Based on 2007 population estimates, there are approximately 409 persons per mi² in Leon County. According to the University of Florida, Bureau of Economic and Business Research (2006), Leon County’s population is expected to experience steady population growth rates for the next 25 years. Table displays the range of population projections for Leon County through 2030.

8
Leon County Population Estimates
Jurisdiction
Population Census 2000
Population Census 2010
% Change 2000‐2010
% of Total Population (2007)
Tallahassee 150,624 181,376 20.4% 65.8%
Unincorporated 88,828 94,111 5.9% 34.2%
Countywide 239,452 275,487 15% 100%
Leon County’s population is growing steadily and reached to 275,487 in 2010. Based on the medium population projection provided by BEBR, Leon County is expected to add almost 100,000 new residents to its population by the year 2030 (378,100), see the figure below.
The figure below shows the U.S. Census and 2010 population per census block group for the City of Tallahassee and unincorporated Leon County. Social Vulnerability The U.S. Census for 2010 reported that the population for Leon County is 275,487, this is consistent with the 2007 BEBR estimate of 272,497. On average there are 2.34 persons per household in Leon County. According to the 2005‐2009 American Community Survey data Leon County had 109,000 occupied households, with 54% being owner occupied and 46% being occupied by renters. Of particular concern within Leon County’s population are those persons with special needs or perhaps limited resources such as the elderly, low‐income or linguistically isolated residents. Households headed by a single individual may have fewer resources for childcare or post‐disaster work opportunities.

9
Leon County Social Vulnerability
Category Number of Persons Percent of Population
Over 65 22,697 8.7%
Under 18 52,205 20%
Under 5 15,575 6%
English Not Spoken “Very Well” 11,657 4.5%
No Access to Vehicle 15,575 6%
Female Head of Household Below Poverty Level 32,577 Households 30% of Households
Source: American Community Survey, 2005‐2009
Leon County Population Per Census Block

10
Source: U.S. Census, 2000

11
Leon County Population Under 5 Years of Age
Source: U.S. Census, 2010

12
Leon County Population Over Age 65
Source: U.S. Census, 2010

13
GIS Methodology
Natural Hazard Vulnerability Analysis Data Sources The vulnerability analysis was conducted using a geographic information systems (GIS) analysis. GIS tools allow users to conduct interactive queries, analyze spatial information, edit data, create maps and present the results of all these operations in a consolidated report. HAZUS‐MH FEMA’s HAZUS‐MH 2.0 software is a nationally applicable standardized methodology that contains models for estimating potential losses from floods and hurricanes. It was used to model and generate estimated potential losses for hurricane winds and flooding. To estimate vulnerable populations in hazard areas, digital American Community Survey 2005 ‐ 2009 data by census block was obtained and census blocks intersecting with hazard areas were used to determine vulnerable population concentrations. HAZUS‐MH 2.0 is FEMA’s standardized loss estimation methodology built upon an integrated GIS platform to conduct analysis at a regional level (i.e., not on a structure by‐structure basis). The HAZUS‐MH 2.0 risk assessment methodology is parametric, in that distinct hazard and inventory parameters (e.g., wind speed and building types) can be modeled using the software to determine the impact (i.e., damages and losses) on the built environment. The HAZUS‐MH 2.0 Hurricane Wind Model is an improvement over existing loss estimation models because it uses a wind hazard‐load‐damage‐loss framework. New features in the HAZUS‐MH 2.0 Wind Model include:
• Commercial data has been updated to Dun & Bradstreet building valuations have been
updated to R.S. Means and building counts are now based on census housing unit counts;
• An updated historic storms database that includes several existing historic storms;
• New coastal storm surge modeling capability that includes SLOSH and SWAN;
• Integration of the CDMS tool;
• NOAA hurricane advisory data is used to model storms with an adjustment feature for
calculating building damage and loss;
An updated probabilistic storm set that reflects updates to the Holland pressure profile model
and filling model;
• An updated wind field model for user‐defined storms; and
A new vulnerability functions to permit calculation of additional losses to manufactured
housing due to trees blow down.
Replacement costs were derived from Means Square Foot Costs for residential, commercial, industrial and institutional building occupancy classes. The Means publication is a nationally accepted reference on building construction costs, which is published annually. This publication provides cost information for a number of low‐rise residential buildings, and for 70 other residential, commercial, institutional and industrial buildings. These are presented in a format that shows typical costs for each model building, showing variations by size of building, type of building structure and building enclosure. More detailed information on HAZUS‐MH 2.0 is available through FEMA at: www.fema.gov/plan/prevent/hazus/.
14
HAZUS‐MH 2.0 is a loss estimation tool for planning purposes only. Uncertainties are inherent in any loss estimation methodology and arise in part from incomplete scientific knowledge concerning natural hazards and their effects on the built environment. Uncertainties also result from approximations and simplifications necessary to conduct such a study; incomplete or outdated data on inventory, demographic, or economic parameters; the unique nature and severity of each hazard when it occurs; and the amount of advance notice that residents have to prepare for the incident. As a result, potential exposure and loss estimates are approximations. Results should not be interpreted or used as precise results from and should be used only to understand relative risk. MEMPHIS and ELVIS Model Mapping for Emergency Management Parallel Hazard Information Systems (MEMPHIS) modeling was the primary method used for the Leon County LMS. MEMPHIS data was made available by DCA and is derived from analysis of U.S. Census Bureau data, Department of Revenue (DOR) data, and other information related to local conditions (historical hazard occurrences, topography, etc.). For the Leon County PDRP, MEMPHIS was the methodology used for estimating potential losses from Wildfires. ELVIS is the Economic Loss Vulnerability Index System. ELVIS allows communities to compare the relative risk of various natural hazards through the use of loss costs. A loss cost is the long‐term average of the damage a hazard causes, which are typically expressed in terms of loss per $1000 of exposure per year.
GIS Vulnerability and Risk Assessment Results
Various data sources were used to conduct the vulnerability and risk assessment. The vulnerability assessments results were generated using the Tallahassee/Leon County GIS Department’s geospatial databases for improved property (structures), critical facilities, other essential facilities and properties of cultural significance. Building vulnerability was assessed using HAZUS‐MH MR3 for hurricane wind and flooding and by performing a parcel level analysis for wildfire.
Hurricane Wind Analysis Wildfire Analysis The Florida Division of Forestry (DOF) responds to fire events on land outside the city limits. As of November 1998, the DOF’s jurisdiction included 214,877 out of the nearly 450,000 acres in Leon County. Of the five counties in Fire District Four (Leon, Gadsden, Jefferson, Wakulla and Franklin Counties) Leon has produced the least number of fires requiring a DOF response. This may be largely due to a lower concentration of combustible fuel types and the significant amount of controlled burning that takes place on a regular basis. For example, large areas in the north and northeast are held as plantations and frequently utilize fire as a land management tool. Additionally, a significant portion of the southwestern area of the county lies within the Apalachicola National Forest. There is no significant habitation within its borders and the area immediately surrounding the forest contains limited development. While residents may experience a periodic blanketing of smoke, the regular use of prescribed burns by Forest Service personnel reduces the risk of wildfire. The table below displays the historical occurrences of wildfires in Leon County between 1999 and 2000.
15
Historical Occurrence of Wildfires in Leon County, 1999 ‐ 2009
Primary Causes Total Number of Wildfires Total Acres
Escaped Debris Burns Children Incendiary Equipment Use Lightning
180 1,858
Source: Florida Division of Forestry, 2009
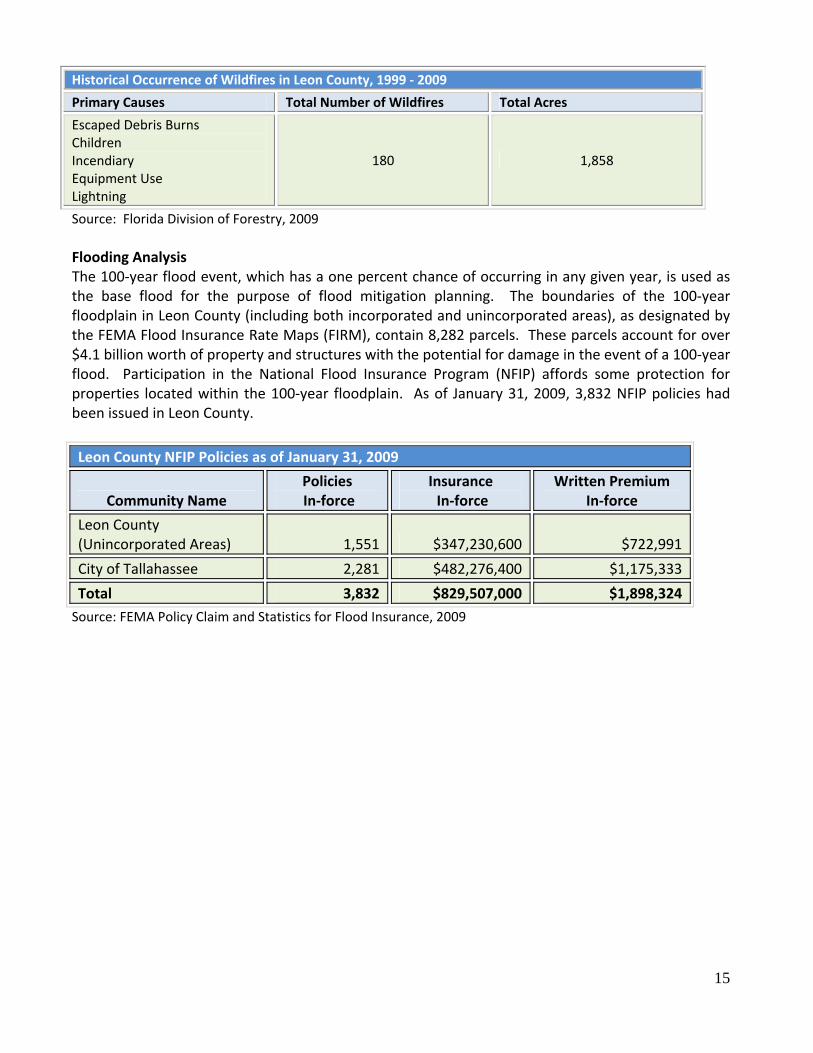
Flooding Analysis The 100‐year flood event, which has a one percent chance of occurring in any given year, is used as the base flood for the purpose of flood mitigation planning. The boundaries of the 100‐year floodplain in Leon County (including both incorporated and unincorporated areas), as designated by the FEMA Flood Insurance Rate Maps (FIRM), contain 8,282 parcels. These parcels account for over $4.1 billion worth of property and structures with the potential for damage in the event of a 100‐year flood. Participation in the National Flood Insurance Program (NFIP) affords some protection for properties located within the 100‐year floodplain. As of January 31, 2009, 3,832 NFIP policies had been issued in Leon County.
Leon County NFIP Policies as of January 31, 2009
Community Name Policies In‐force
Insurance In‐force
Written Premium In‐force
Leon County (Unincorporated Areas) 1,551 $347,230,600 $722,991
City of Tallahassee 2,281 $482,276,400 $1,175,333
Total 3,832 $829,507,000 $1,898,324
Source: FEMA Policy Claim and Statistics for Flood Insurance, 2009

16
Leon County Parcels in the FEMA 100 Year Flood Plain, 2008
City of Tallahassee Unincorporated Leon County Improvement Type Number Percent Value ($) Number Percent Value ($)
Residential 3,176 85 945,341,139 3,589 79 1,219,257,431
Mobile Home 68 2 5,247,052 856 19 122,935,536
Commercial 418 11 531,247,905 81 2 66,587,780
Other* 72 2 666,293,571 22 0 67,185,139
Total 3,734 100 2,148,129,666 4,548 100 1,475,965,886
Sources: Tallahassee‐Leon County Planning Department, Existing Land Use Database, 2008; Leon County
Property Appraiser
The two largest parcels in the "other" category in terms of market value include the Florida State University (FSU) parcel containing Doak Campbell Stadium and most of the main campus of the Tallahassee Community College (150 acre parcel). FSU staff also identified six structures on campus that are within the 100‐year flood plain. Valuations for these structures are included in the figures above. Combined, these values equal two‐thirds of the market value of the "other" category for the City of Tallahassee. Three‐fourths of the market value of "other" for Unincorporated Leon County was for the Chiles High School parcel. National Flood Insurance Program From 1978 to March 2011, there were 782 countywide losses for flood related claims that were paid in the amount of $9.1 million throughout Leon County. The table below provides a list of losses in Leon County.
NFIP Flood Losses and Payments by Jurisdiction, 1978 – March 2011
Jurisdiction Total NFIP Losses Total Payments (in dollars)
City of Tallahassee 254 $3,162,050
Leon County 528 $5,920,934
Countywide Total 782 $9,082,984
Source: FEMA NFIP
Repetitive Flood Loss Properties
It is important to note that not all property within the floodplain is equally vulnerable to flooding. Typically, a small proportion of parcels experience more frequent flooding and are considered a higher priority for flood mitigation actions. A Repetitive Loss (RL) property is any insurable building for which the National Flood Insurance Program (NFIP) paid two or more claims of more than $1,000 within any rolling ten‐year period, since 1978. At least two of the claims must be more than 10‐days apart but, within ten‐years of each other. A RL property may or may not be currently insured by the NFIP. In the City of Tallahassee, there are currently 54 properties identified as repetitive loss properties. Approximately 56 percent of RL properties have reported only two losses. The tables
17
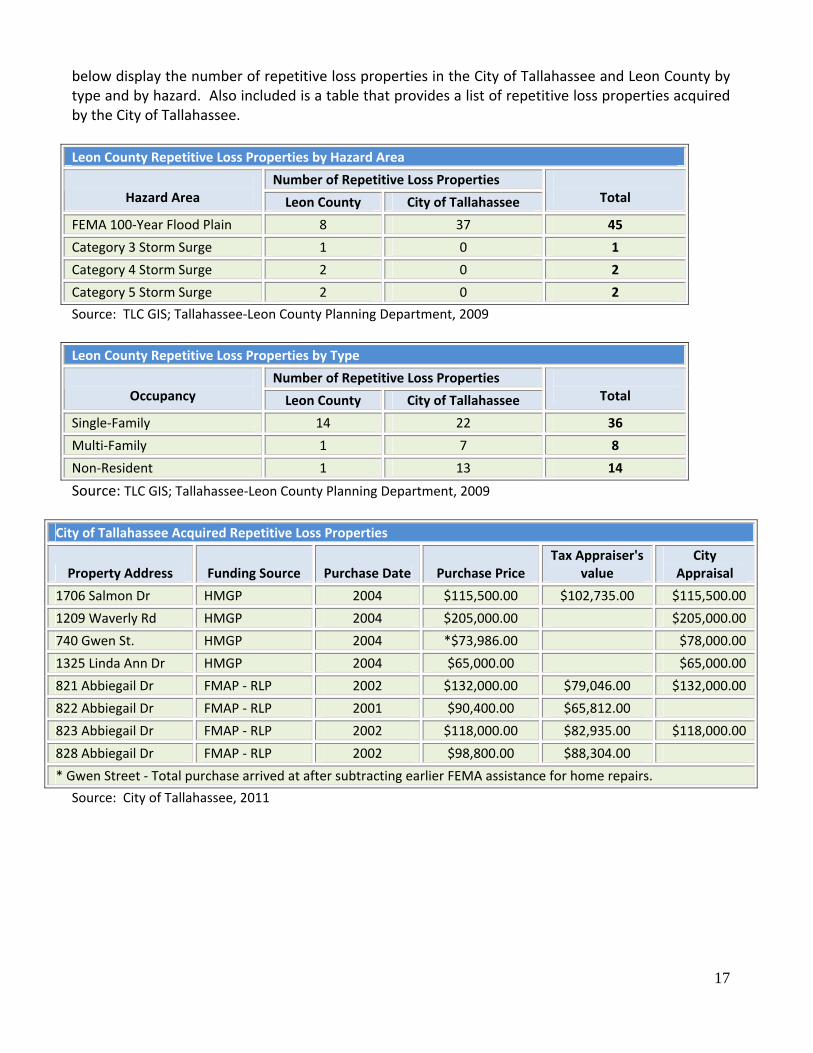
below display the number of repetitive loss properties in the City of Tallahassee and Leon County by type and by hazard. Also included is a table that provides a list of repetitive loss properties acquired by the City of Tallahassee.
Leon County Repetitive Loss Properties by Hazard Area
Number of Repetitive Loss Properties Hazard Area Leon County City of Tallahassee
Total
FEMA 100‐Year Flood Plain 8 37 45
Category 3 Storm Surge 1 0 1
Category 4 Storm Surge 2 0 2
Category 5 Storm Surge 2 0 2
Source: TLC GIS; Tallahassee‐Leon County Planning Department, 2009
Leon County Repetitive Loss Properties by Type
Number of Repetitive Loss Properties Occupancy Leon County City of Tallahassee
Total
Single‐Family 14 22 36
Multi‐Family 1 7 8
Non‐Resident 1 13 14
Source: TLC GIS; Tallahassee‐Leon County Planning Department, 2009
City of Tallahassee Acquired Repetitive Loss Properties
Property Address Funding Source Purchase Date Purchase Price Tax Appraiser's
value City
Appraisal
1706 Salmon Dr HMGP 2004 $115,500.00 $102,735.00 $115,500.00
1209 Waverly Rd HMGP 2004 $205,000.00 $205,000.00
740 Gwen St. HMGP 2004 *$73,986.00 $78,000.00
1325 Linda Ann Dr HMGP 2004 $65,000.00 $65,000.00
821 Abbiegail Dr FMAP ‐ RLP 2002 $132,000.00 $79,046.00 $132,000.00
822 Abbiegail Dr FMAP ‐ RLP 2001 $90,400.00 $65,812.00
823 Abbiegail Dr FMAP ‐ RLP 2002 $118,000.00 $82,935.00 $118,000.00
828 Abbiegail Dr FMAP ‐ RLP 2002 $98,800.00 $88,304.00
* Gwen Street ‐ Total purchase arrived at after subtracting earlier FEMA assistance for home repairs.
Source: City of Tallahassee, 2011


![The Leon reporter (Leon, Iowa), 1900-10-25, [p ]](https://img.dokumen.tips/doc/110x75/61b485bdae16c609d55a09e1/the-leon-reporter-leon-iowa-1900-10-25-p-.jpg)
