Embed Size (px)
Citation preview

Meeting OLC Board Agenda Item No. Paper No.
4 94.4
Date of meeting 20 March 2019 Time required 10 Minutes
Title Finance Report (Month 11)
Sponsor Rob Powell, Chief Executive
Status OFFICIAL
To be communicated to: Members and those in attendance
Executive summary
This paper provides a report on the financial position at the end of month 11. The paper provides a commentary on the key issues in the management accounts which are available in Appendix 1.
Recommendation/action required
Board is asked to NOTE the report.
1
1. Introduction This paper provides an overview of the OLC’s financial position at the end of month 11, and a commentary on the key issues in the usual management accounts (Appendix 1). The figures reflect the reforecast prepared by departments in January 2019.
MoJ work to the Treasury performance measure that public bodies should deliver an outturn position within 1% of the budget. Budgeted expenditure after MoJ uplift was estimated to be £14.8m therefore a target expenditure was £14.6 - £15m. MoJ have been informed of the underspend against budget and provided with the reforecast of £13.3 m as the revised target at this point.
2. YTD performance At the end of month 11 we are reporting an underspend for the year to date of £89k (1%), representing an underspend in legal (£90k, 0.8%) and a small overspend in CMC (£1k, 0.1%), which reflects the following areas:
• 0.8% (£54k) YTD underspend on staff costs: o a £34k underspend in operations as a result of staff turnover, sickness,
maternity, lower pool ombudsman & overtime use o a £16k underspend on bonus provision as a result of recommended non-
payment of parts of the bonus and sundry smaller balances; o offset by a 15% (£20k) overspend on Training and recruitment as a result of
the difficulty of forecasting timing of recruitment fees and procurement of training;
• 16% (£18k) underspend on Fees as a result of the release of provisions for Judicial Reviews or litigation now considered to be a lower risk;
• 1.3% (£14k) underspend on IT; • 3% (£20k) underspend on Premises due to service charge refund for the annual
YTD balancing, plus incorrect timing of Rates accounting; and • 62% (£23k) overspend on “Other” due to an increase in the bad debt provision;
invoices had been delayed due to data integrity issues therefore the forecast had followed an outdated trend.
3. Budget against forecast The forecast was updated after the end of Q3 in line with MoJ requirements.
20 March 2019
Finance report – month 11
2

The forecast outturn currently shows a 10% underspend (£1.5m) across both jurisdictions. Of this, £0.7m relates to CMC as a result of a conscious reduction in the forecast to reflect falling volumes and management of transfer risks; the other £0.8m relates to legal. The main factor is staffing costs being lower than forecast. £80k of the legal underspend is non-cash expenditure (depreciation), which we are unable to move to support other budget lines.
Subject to the reforecast, we estimate this underspend could increase to 12% to reflect the need to control unit cost against the OLC’s KPI given lower volumes of cases currently being concluded and the impact of staff turnover. Expenditure will continue to be brought forward where investment will increase output in the short to medium term.
4. Capital budget The original 2018-19 capital budget was £250k. Capital spend is now being forecast as £160k, and in September the OLC Board approved the return of £87k of capital budget.
5. Next steps 2019-20 budget proposals has now been completed and will be submitted immediately following our Board meeting to the LSB for its 26 March meeting.
The interim external audit took place in January 2019 and the continued focus on the year end quality of information will continue. An Internal Audit took place in February 2019 with a focus on the financial control environment, specifically compliance with MoJ spending controls and we are awaiting the feedback
The data quality issues in CMS 2 continue to impact invoicing of case fees in the short term. Resource is now being provided to clear this back log in P12.
Two vacancies in the finance team have both been successfully filled. The finance officer started in January and the new Accountant joins on 1st May.
3

Legal Ombudsman: Consolidated Income & Expenditure, and Capital ExpenditureAs At 28 February 2019
Actual Forecast Variance Actual Forecast Variance Previous Yr Forecast Budget Variance£'000 £'000 £'000 £'000 £'000 £'000 £'000 £'000 £'000 £'000
Income - Levy 995.1 1,013.4 (18.3) 9,518.9 9,580.5 (61.6) 9,139.3 10,768.5 11,536.5 (768.0)Grant In Aid - - - - - - - - - - Income - Case fees 85.2 114.0 (28.8) 1,073.2 1,098.8 (25.6) 963.6 1,214.0 1,294.2 (80.2)Income - Other 12.5 12.8 (0.3) 143.1 143.2 (0.1) 8.1 143.2 156.0 (12.8)
Total Income 1,092.8 1,140.3 (47.4) 10,735.1 10,822.5 (87.4) 10,110.9 12,125.7 12,986.7 (861.0)Staff Costs 905.5 914.4 8.9 9,589.2 9,644.1 54.9 8,710.5 10,688.2 11,472.7 784.5Travel & Subsistence (0.1) 1.1 1.2 11.6 13.0 1.4 33.3 14.1 40.6 26.5Fees & Consultancy 9.2 26.0 16.8 196.9 215.1 18.3 284.8 244.8 394.9 150.1IT & Telecoms 157.1 177.7 20.6 1,064.2 1,078.5 14.2 1,098.0 1,306.6 1,465.6 159.0Premises & Facilities 43.6 66.9 23.3 584.1 604.3 20.2 700.9 669.5 850.0 180.5Other costs 35.9 9.2 (26.7) 76.9 54.7 (22.2) 148.5 63.2 110.4 47.2
Total Cash Expenditure 1,151.2 1,195.3 44.1 11,522.9 11,609.8 86.8 10,976.0 12,986.4 14,334.2 1,347.8Interest & Charges (4.9) (5.0) (0.1) (59.3) (59.3) 0.1 (23.3) (64.0) (27.5) 36.5
Contingency - - - - - - - - - - Depreciation 34.3 35.3 1.0 379.1 380.8 1.7 350.9 417.1 498.0 80.9
Non Cash Expenditure 34.3 35.3 1.0 379.1 380.8 1.7 350.9 417.1 498.0 80.9
Total Revenue Expenditure before tax 1,180.6 1,225.7 45.1 11,842.7 11,931.3 88.6 11,303.6 13,339.5 14,804.7 1,465.2Taxation - - - - - - - 7.1 7.1 -
Total Revenue Expenditure 1,180.6 1,225.7 45.1 11,842.7 11,931.3 88.6 11,303.6 13,346.6 14,811.8 1,465.2
Capital Expenditure - - - 89.4 98.6 9.2 367.3 163.1 250.0 86.9Fixed Assets - IT - - 86.5 95.7 9.2 367.3 160.2 250.0 89.8Fixed Assets - Premises - - 2.9 2.9 - - 2.9 - (2.9)
Month Year to Date Full Year
4

Legal Jurisdiction: Income & ExpenditureAs At 28 February 2019
Actual Forecast Variance Actual Forecast Variance Previous Yr Forecast Budget Variance£'000 £'000 £'000 £'000 £'000 £'000 £'000 £'000 £'000 £'000
Income - Levy 995.1 1,013.4 (18.3) 9,518.9 9,580.5 (61.6) 9,139.3 10,768.5 11,536.5 (768.0)Grant In Aid - - - - - - - - - - Income - Case fees 76.4 104.4 (28.0) 946.8 974.8 (28.0) 793.6 1,080.4 1,105.2 (24.8)Income - Other 12.5 12.8 (0.3) 143.1 143.2 (0.1) 8.1 143.2 156.0 (12.8)
Total Income 1,084.0 1,130.7 (46.6) 10,608.7 10,698.5 (89.8) 9,940.9 11,992.1 12,797.7 (805.6)Staff Costs 855.0 863.0 8.0 8,898.1 8,955.7 57.7 7,979.4 9,938.5 10,372.8 434.2Travel & Subsistence (0.2) 1.1 1.3 10.8 12.3 1.6 31.7 13.4 35.5 22.1Fees & Consultancy 9.2 26.0 16.8 196.9 215.1 18.3 259.0 244.8 344.0 99.2IT & Telecoms 157.1 177.7 20.6 1,063.3 1,077.6 14.2 1,087.9 1,305.7 1,465.6 159.9Premises & Facilites 41.4 65.0 23.6 564.2 585.2 21.0 684.2 648.6 814.6 166.0Other costs (7.8) (32.5) (24.6) (444.3) (469.0) (24.7) (428.8) (519.1) (712.4) (193.3)
Total Cash Expenditure 1,054.7 1,100.3 45.7 10,288.9 10,377.0 88.1 9,613.3 11,631.8 12,320.1 688.2Interest & Charges (4.9) (5.0) (0.1) (59.3) (59.3) 0.1 (23.3) (64.0) (27.5) 36.5
Contingency - - - - - - - - Depreciation 34.3 35.3 1.0 379.1 380.8 1.7 350.9 417.1 498.0 80.9
Non Cash Expenditure 34.3 35.3 1.0 379.1 380.8 1.7 350.9 417.1 498.0 80.9
Total Revenue Expenditure before tax 1,084.0 1,130.7 46.7 10,608.7 10,698.5 89.8 9,940.9 11,985.0 12,790.6 805.6Taxation 7.1 7.1 -
Total Revenue Expenditure 1,084.0 1,130.7 46.7 10,608.7 10,698.5 89.8 9,940.9 11,992.1 12,797.7 805.6
Month Year to Date Full Year
5

CMC: Income & ExpenditureAs At 28 February 2019
Actual Forecast Variance Actual Forecast Variance Previous Yr Forecast Budget Variance£'000 £'000 £'000 £'000 £'000 £'000 £'000 £'000 £'000 £'000
Income - Levy - - - - - - - - - - Grant In Aid - - - - - - - - - - Income - Case fees 8.8 9.6 (0.8) 126.4 124.0 2.4 170.0 133.6 189.0 (55.4)Income - Other - - - - - - - - - -
Total Income 8.8 9.6 (0.8) 126.4 124.0 2.4 170.0 133.6 189.0 (55.4)Staff Costs 50.5 51.4 0.9 691.1 688.3 (2.8) 731.0 749.7 1,099.9 350.2Travel & Subsistence - - - 0.9 0.7 (0.1) 1.6 0.7 5.1 4.4Fees & Consultancy - - - - - - 25.8 - 50.9 50.9IT & Telecoms - - - 0.9 0.9 - 10.1 0.9 - (0.9)Premises & Facilites 2.2 1.9 (0.3) 19.9 19.1 (0.8) 16.7 20.9 35.4 14.5Other costs 43.8 41.7 (2.1) 521.3 523.7 2.5 577.3 582.3 822.8 240.5
Total Cash Expenditure 96.5 95.0 (1.5) 1,234.0 1,232.8 (1.2) 1,362.7 1,354.5 2,014.1 659.6Interest & Charges - - - - - - - - - -
Contingency - - - - - - - - - - Depreciation - - - - - - - - - -
Non Cash Expenditure - - - - - - - - - -
Total Revenue Expenditure 96.5 95.0 (1.5) 1,234.0 1,232.8 (1.2) 1,362.7 1,354.5 2,014.1 659.6
103,405.78-
Month Year to Date Full Year
6

Total Expenditure By Cost CentreAs At 28 February 2019
Actual Forecast Variance Actual Forecast Variance Previous Yr ForecastOriginal Budget Variance
£'000 £'000 £'000 £'000 £'000 £'000 £'000 £'000 £'000 £'000
CEO 101 29.1 32.5 3.4 352.7 358.1 5.3 304.1 405.0 434.8 29.8Compliance 102 - - 2.9 - - Ombudsman team 201 73.9 76.7 2.8 715.1 721.2 6.2 759.6 797.9 824.5 26.6Legal 202 1.8 17.2 15.4 139.3 153.7 14.3 208.6 171.9 204.7 32.8External Affairs 203 13.3 13.9 0.6 144.3 145.0 0.7 159.5 274.1 114.6Insight 204 1.7 4.8 3.1 25.4 31.7 6.3 40.8 118.8 78.1Operational Transformation 205 16.2 13.5 (2.8) 129.9 123.5 (6.4) 137.0 130.6 (6.4)Operations Hub 206 32.8 33.2 0.5 355.3 357.1 1.8 390.3 366.0 (24.3)Operations Delivery 301 53.8 55.4 1.6 469.9 472.0 2.1 444.5 528.0 501.8 (26.2)Resolution Centre 302 353.5 362.8 9.3 4,066.2 4,080.1 13.9 3,926.1 4,461.5 5,224.6 763.1Assessment Centre 303 - - 527.5 - - RCT 306 - - 177.6 - - GET 305 50.8 54.9 4.1 486.8 497.4 10.7 552.5 432.4 (120.1)Legacy 307 74.5 76.9 2.4 816.9 831.3 14.4 908.0 620.7 (287.3)Data and Information 401 - - - - CPD Course 403 - (0.5) (0.5) 0.0 4.7 (0.5) - 0.5Facilities 502 26.9 50.5 23.7 430.9 453.4 22.5 517.8 502.2 622.3 120.0Finance 503 18.5 23.1 4.6 241.4 246.0 4.5 315.8 276.1 282.5 6.4HR 504 36.9 37.7 0.7 404.2 405.7 1.5 345.0 445.8 431.7 (14.1)IT & Telecoms 505 214.9 236.6 21.7 1,622.4 1,641.2 18.8 1,612.0 1,928.9 2,059.5 130.5Recruitment 506 30.6 13.5 (17.1) 70.3 60.6 (9.8) 115.2 124.9 91.9 (33.0)Corporate Overhead 507 2.5 10.5 8.0 82.7 99.4 16.7 33.9 110.0 177.0 67.0Training 508 21.1 10.0 (11.1) 79.2 69.1 (10.1) 80.9 109.1 162.5 53.4PMO 510 10.8 11.1 0.4 116.2 116.9 0.7 128.0 104.9 (23.1)CMC 310 91.8 92.0 0.2 1,201.3 1,202.4 1.1 1,302.4 1,321.9 1,978.5 656.6 CMC Reapportionment (39.0) (38.6) 0.3 (488.5) (493.3) (4.8) (517.0) (549.6) (787.1) (237.5)Office of the Chief Legal Ombudsman - - 287.9 - - Research 402 - - - - 205.5 - - Modernising LeO 304 - - - - 132.1 - - Quality 509 - - - - 97.8 - -
- - - Total Cost excl. Reserves 1,116.3 1,188.3 71.9 11,461.4 11,572.0 110.6 10,885.0 12,949.3 14,256.8 1,307.5 Contingency - - - - - - - - - - Provision for Doubtful Debts - Legal & cmc 34.9 7.0 (27.9) 61.5 37.8 (23.7) 91.0 44.1 84.5 40.4Holiday Accruals
1,151.2 1,195.3 44.0 11,522.9 11,609.8 86.9 10,976.0 12,993.4 14,341.3 1,347.9Interest & Charges (4.9) (5.0) (0.1) (59.3) (59.3) - (23.3) (64.0) (27.5) 36.5Depreciation 34.3 35.3 1.0 379.1 380.8 1.7 350.9 417.1 498.0 80.9
1,180.6 1,225.6 45.0 11,842.7 11,931.3 88.6 11,303.6 13,346.6 14,811.8 1,465.2
Cashflow As At 28 February 2019Month Year to Date Full yearActual Actual Forecast£'000 £'000 £'000
Expenditure (1,180.6) (11,842.7) (13,346.6)Income 1,092.8 10,735.1 12,125.7Add Back Non Cash expenditure 34.3 379.1 417.1Add back P&L on Asset disposals - - - Increase / (Decrease) in Creditors (51.1) (161.9) 406.2(Increase) / Decrease in Debtors (1,011.8) (9,836.2) (411.9)Net Operating Cashflow (1,116.3) (10,726.6) (809.4)
Purchase of IT Equipment & Software development - (92.9) (154.4)Purchase of Premises Equipment & leasehold Improvements - (2.9) 2.90-
Proceeds - - Cashflows from Investing Activities - (95.8) (157.3)
Grant In Aid 1,258.0 2,478.9
Cashflow for the Period (1,116.3) (9,564.4) 1,512.2
Opening Bank Balance 8,260.3 16,708.4 16,708.4Closing Bank Balance 7,144.0 7,144.0 18,220.6Cash Movement (1,116.3) (9,564.4) 1,512.2
Balance Sheet As At 31 December 2018
Opening
Month Movement
As At 30 September 2018
Full year Forecast Trade debtors analysis
£'000 £'000 £'000 Current 30 days 60 days 90 days + totalPremises 700.1 (6.8) 455.1 448.3 £'000 £'000 £'000 £'000 £'000IT Hardware & Software 613.1 (27.5) 577.3 611.1Total Non Current Assets 1313.2 (34.3) 1,032.4 1,059.4Cash & Bank 16733.9 (1,116.3) 7,144.0 18,220.6 3.0% 4.5% 28.7% 63.8%Debtors 251.9 1,002.3 9,925.4 680.1Prepayments 253.8 9.4 262.5 83.5Total Current Assets 17239.6 (104.6) 17,331.9 18,984.2 Provision for doubtful debts -60.1Total Assets 18552.8 (138.9) 18,364.2 20,043.5Creditors -596.8 (45.2) (436.9) (797.1) Net trade debtors 81.01Accruals -1232.6 50.9 (1,085.2) (1,219.4)Lease Commitments -337.6 45.5 (200.7) (274.4) - ###########Total Current Liabilities -2167 51.1 (1,722.7) (2,290.8) ###########Net Current Assets 15072.6 (53.5) 15,609.1 16,693.3Net Assets 16385.8 (87.8) 16,641.5 17,752.7 - ###########
###########1364.6 - 103,405.8
Retained Earnings -1625 87.8 1,107.6 1,197.6Grant in Aid PY / Levy/ Reserves - (17,749.1) (18,950.3)Reserves -16385.7 87.8 (16,641.5) (17,752.7)
Month Year to date Full Year
4.3 6.4 40.4 90.0 141.1
7
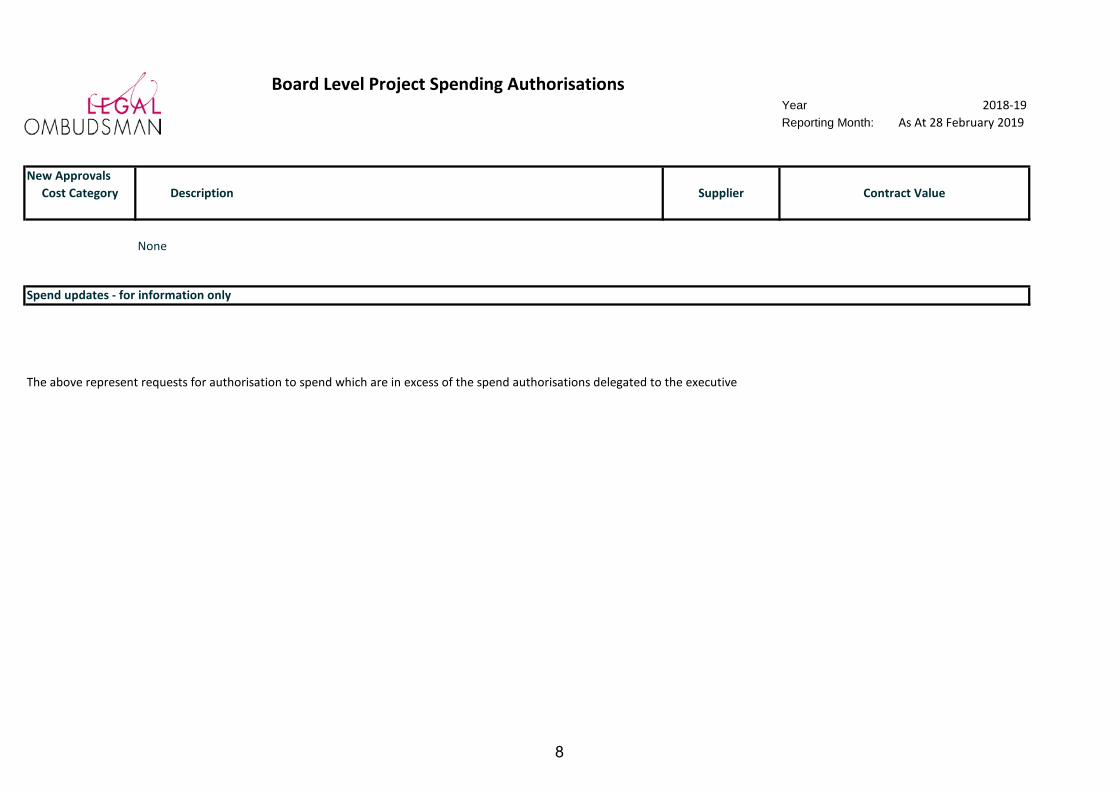
Board Level Project Spending AuthorisationsYear 2018-19Reporting Month: As At 28 February 2019
New ApprovalsCost Category Description Supplier
Spend updates - for information only
The above represent requests for authorisation to spend which are in excess of the spend authorisations delegated to the executive
Contract Value
None
8

Reporting Date 28 February 2019Year 2018-19
Reporting Month: 11
Finance Report
Contents
1. Overall Position2. Legal Jurisdiction3. CMC Jurisdiction4. Cost Centre Analysis5. Spending Approvals Required6. Direct Legal7. Direct CMC8. Overheads only
9
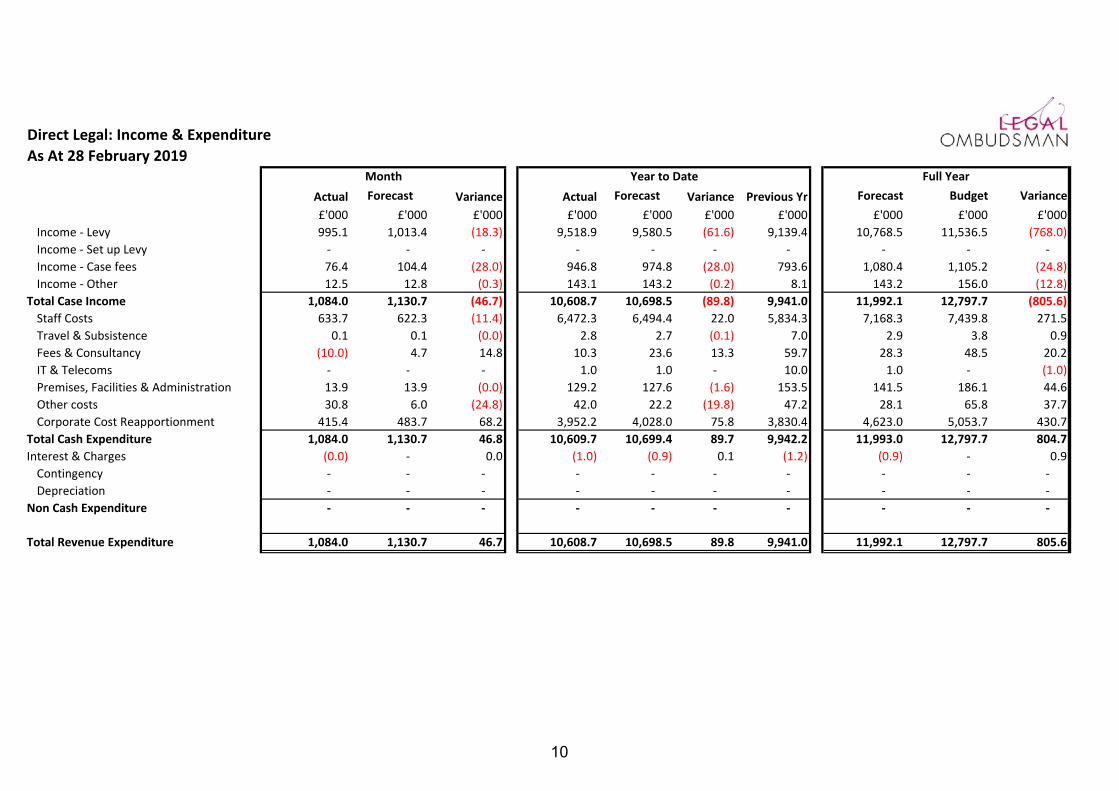
Direct Legal: Income & ExpenditureAs At 28 February 2019
Actual Forecast Variance Actual Forecast Variance Previous Yr Forecast Budget Variance£'000 £'000 £'000 £'000 £'000 £'000 £'000 £'000 £'000 £'000
Income - Levy 995.1 1,013.4 (18.3) 9,518.9 9,580.5 (61.6) 9,139.4 10,768.5 11,536.5 (768.0)Income - Set up Levy - - - - - - - - - - Income - Case fees 76.4 104.4 (28.0) 946.8 974.8 (28.0) 793.6 1,080.4 1,105.2 (24.8)Income - Other 12.5 12.8 (0.3) 143.1 143.2 (0.2) 8.1 143.2 156.0 (12.8)
Total Case Income 1,084.0 1,130.7 (46.7) 10,608.7 10,698.5 (89.8) 9,941.0 11,992.1 12,797.7 (805.6)Staff Costs 633.7 622.3 (11.4) 6,472.3 6,494.4 22.0 5,834.3 7,168.3 7,439.8 271.5Travel & Subsistence 0.1 0.1 (0.0) 2.8 2.7 (0.1) 7.0 2.9 3.8 0.9Fees & Consultancy (10.0) 4.7 14.8 10.3 23.6 13.3 59.7 28.3 48.5 20.2IT & Telecoms - - - 1.0 1.0 - 10.0 1.0 - (1.0)Premises, Facilities & Administration 13.9 13.9 (0.0) 129.2 127.6 (1.6) 153.5 141.5 186.1 44.6Other costs 30.8 6.0 (24.8) 42.0 22.2 (19.8) 47.2 28.1 65.8 37.7Corporate Cost Reapportionment 415.4 483.7 68.2 3,952.2 4,028.0 75.8 3,830.4 4,623.0 5,053.7 430.7
Total Cash Expenditure 1,084.0 1,130.7 46.8 10,609.7 10,699.4 89.7 9,942.2 11,993.0 12,797.7 804.7Interest & Charges (0.0) - 0.0 (1.0) (0.9) 0.1 (1.2) (0.9) - 0.9
Contingency - - - - - - - - - - Depreciation - - - - - - - - - -
Non Cash Expenditure - - - - - - - - - -
Total Revenue Expenditure 1,084.0 1,130.7 46.7 10,608.7 10,698.5 89.8 9,941.0 11,992.1 12,797.7 805.6
Month Year to Date Full Year
10
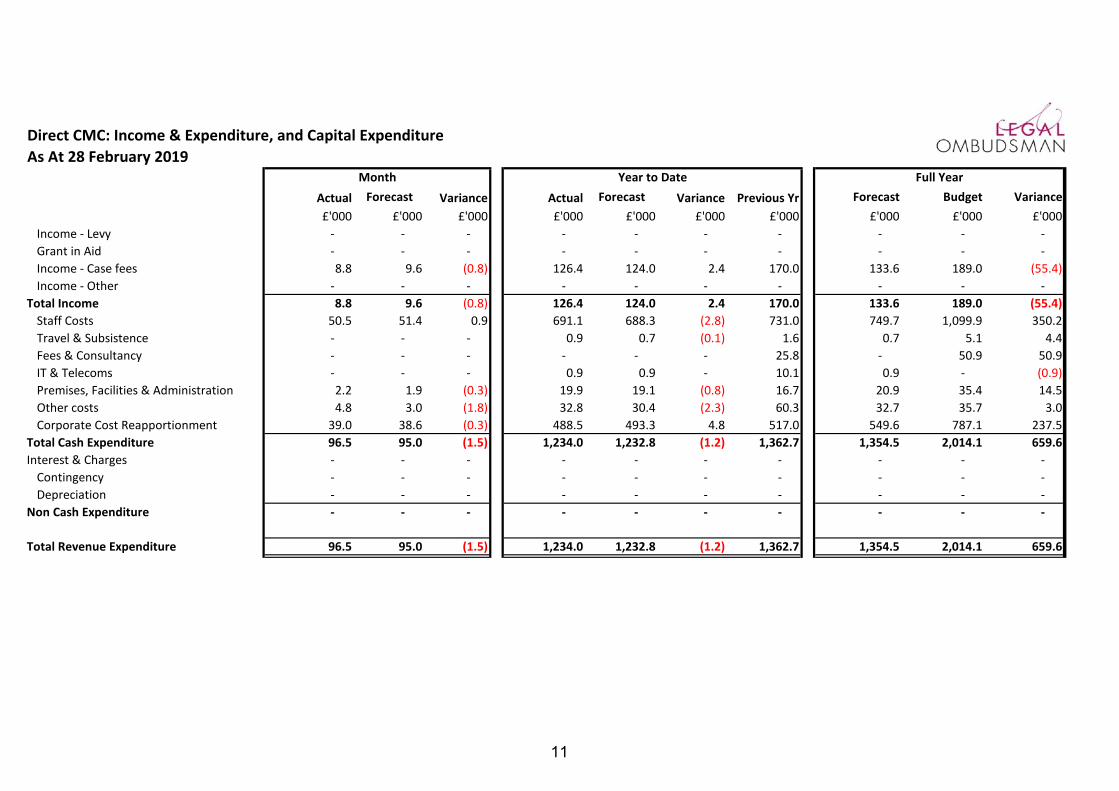
Direct CMC: Income & Expenditure, and Capital ExpenditureAs At 28 February 2019
Actual Forecast Variance Actual Forecast Variance Previous Yr Forecast Budget Variance£'000 £'000 £'000 £'000 £'000 £'000 £'000 £'000 £'000 £'000
Income - Levy - - - - - - - - - - Grant in Aid - - - - - - - - - - Income - Case fees 8.8 9.6 (0.8) 126.4 124.0 2.4 170.0 133.6 189.0 (55.4)Income - Other - - - - - - - - - -
Total Income 8.8 9.6 (0.8) 126.4 124.0 2.4 170.0 133.6 189.0 (55.4)Staff Costs 50.5 51.4 0.9 691.1 688.3 (2.8) 731.0 749.7 1,099.9 350.2Travel & Subsistence - - - 0.9 0.7 (0.1) 1.6 0.7 5.1 4.4Fees & Consultancy - - - - - - 25.8 - 50.9 50.9IT & Telecoms - - - 0.9 0.9 - 10.1 0.9 - (0.9)Premises, Facilities & Administration 2.2 1.9 (0.3) 19.9 19.1 (0.8) 16.7 20.9 35.4 14.5Other costs 4.8 3.0 (1.8) 32.8 30.4 (2.3) 60.3 32.7 35.7 3.0Corporate Cost Reapportionment 39.0 38.6 (0.3) 488.5 493.3 4.8 517.0 549.6 787.1 237.5
Total Cash Expenditure 96.5 95.0 (1.5) 1,234.0 1,232.8 (1.2) 1,362.7 1,354.5 2,014.1 659.6Interest & Charges - - - - - - - - - -
Contingency - - - - - - - - - - Depreciation - - - - - - - - - -
Non Cash Expenditure - - - - - - - - - -
Total Revenue Expenditure 96.5 95.0 (1.5) 1,234.0 1,232.8 (1.2) 1,362.7 1,354.5 2,014.1 659.626.63333
Month Year to Date Full Year
11

Overheads & Corporate: Income & ExpenditureAs At 28 February 2019
Actual Forecast Variance Actual Forecast Variance Previous Yr Forecast Budget Variance£'000 £'000 £'000 £'000 £'000 £'000 £'000 £'000 £'000 £'000
Income - Levy - - - - - - - - - - Income - Other - - - - - - - - - -
Total Income - - - - - - - - - - Staff Costs 221.3 240.8 19.5 2,425.8 2,461.3 35.5 2,145.1 2,770.2 2,933.1 162.9Travel & Subsistence (0.3) 0.9 1.2 8.0 9.6 1.5 24.6 10.5 31.7 21.2Fees & Consultancy 19.2 21.3 2.1 186.6 191.6 5.0 199.3 216.5 295.5 79.1IT & Telecoms 157.1 177.7 20.6 1,062.4 1,076.6 14.2 1,077.8 1,304.7 1,465.6 160.9Premises, Facilities & Administration 27.5 51.1 23.6 435.1 457.7 22.6 530.7 507.1 628.5 121.4Other Costs 0.2 0.2 (0.0) 2.1 2.1 (0.0) 40.9 2.3 8.8 6.5Reapportion to Jurisdictions (454.4) (522.3) (67.9) (4,440.7) (4,521.3) (80.6) (4,347.4) (5,172.6) (5,840.8) (668.2)
Total Cash Expenditure (29.4) (30.4) (1.0) (320.7) (322.5) (1.8) (328.8) (361.2) (477.6) (116.4)Interest & Charges (4.9) (5.0) (0.1) (58.4) (58.3) 0.1 (22.0) (63.0) (27.5) 35.5
Contingency - - - - - - - - Depreciation 34.3 35.3 1.0 379.1 380.8 1.7 350.9 417.1 498.0 80.9
Non Cash Expenditure 34.3 35.3 1.0 379.1 380.8 1.7 350.9 417.1 498.0 80.9
Total Revenue Expenditure before Tax (0.0) (0.0) (0.0) - 0.0 0.0 0.0 (7.1) (7.1) 0.0
Taxation - - - 7.1 7.1 -
Total Revenue Expenditure (0.0) (0.0) - - - - 0.0 - - -
Month Year to Date Full Year
12