Embed Size (px)
Citation preview

Ag Transport Through Non-Irradiated and Irradiated SIC
Reactor Concepts Izabela Szlufarska
University of Wisconsin, Madison
Madeline Feltus, Federal POC Paul Demkowicz, Technical POC
Project No. 11-2988

Final Report Project Title: Ag Transport Through Un-irradiated And Irradiated SiC Covering Period: October 1, 2011 – September 30, 2015 Date of Report: January 11, 2016 Recipient: University of Wisconsin Madison, WI 53706 Contract Number: 00089350 Project Number: 11-2988 Subcontractors: N/A Other Partners: N/A
Contact(s): Principal Investigator: Izabela Szlufarska
Co-Principal Investigators: Dane Morgan ([email protected]) James Blanchard ([email protected]) Collaborators: Kumar Sridharan ([email protected]) Isabella Van Rooyen
([email protected]) Technical point of contact: Paul Demkowicz, Idaho National Laboratories

Final Report January, 2016
2
Table of Content
1 Introduction ............................................................................................................................. 4
2 Diffusion Couple Experiments ............................................................................................... 4 2.1 Development of Ion Implantation Diffusion Couple System .......................................... 4
2.1.1 Overview of Diffusion Couple Design Approach ................................................... 4 2.1.2 Diffusion Couple Exposures ..................................................................................... 5
2.2 Analysis of Ion Implanted Diffusion Couples ................................................................. 6 2.2.1 Overview of Analysis Approach .............................................................................. 6 2.2.2 STEM Analysis of Ion Implanted Diffusion Couples ............................................ 8 2.2.3 SIMS Analysis of Ion Implantation Diffusion Couples ....................................... 11
2.3 Discussion of Measured Ag Transport ........................................................................... 16 2.3.1 Defects Contributing to Non-equilibrium Diffusion ............................................ 16 2.3.2 Discussion of Mechanisms Contributing to Enhanced Diffusion ....................... 18 2.3.3 Diffusion Analysis of Polycrystalline 3C-SiC Diffusion Couples ........................ 20 2.3.4 Discussion of Diffusion in Polycrystalline 3C-SiC: Role of Microstructure ...... 22 2.3.5 Comparison of Ag Diffusion Energetics with Literature .................................... 23 2.3.6 Comparison of Diffusion Energetics with TRISO Fuel Release ......................... 25
2.4 Summary of Observations ............................................................................................... 26
3 Diffusion Studies in Irradiated SiC ..................................................................................... 27 3.1 Overview of Ag Diffusion in Irradiated SiC .................................................................. 27 3.2 Effect of Carbon Ion Irradiation on Ag/SiC Diffusion Couple Experiment ................ 28
3.2.1 Materials and Method ............................................................................................ 28 3.2.2 Radiation/Implantation Damage ........................................................................... 29 3.2.3 SIMS Profiles ........................................................................................................... 30 3.2.4 Comparison of Effective Diffusion Coefficient in Unirradiated and Irradiated SiC 34 3.2.5 GB Diffusion and Lattice Diffusion in Irradiated SiC ........................................ 39
3.3 Analysis of Neutron-Irradiated TRISO Fuel Particles ................................................. 41 3.3.1 Materials and Method ............................................................................................ 41 3.3.2 STEM Analysis of Distribution of Ag and Other FP ........................................... 42 3.3.3 Possible Mechanism of Ag Transport in Neutron Irradiated TRISO Fuel Particle ................................................................................................................................. 46
3.4 Summary of Experimental Work in the Project ............................................................ 47
4 Co-incorporation of Ag with Other Elements .................................................................... 48
5 Atomistic simulations of Ag diffusion ................................................................................. 48 5.1 Ag Diffusion along High Energy Grain Boundary ....................................................... 48
5.1.1 Methods .................................................................................................................... 49 5.1.2 DFT Calculations of Ag Energetics ....................................................................... 53 5.1.3 Kinetic Monte Carlo Model for Ag Diffusion ....................................................... 58
Final Report January, 2016
3
5.1.4 Discussion on the Impact of Ag HEGB Diffusion ................................................ 63 5.2 Radiation Enhanced Diffusion ....................................................................................... 67
5.2.1 Kickout Reactions as a Possible RED Mechanism............................................... 68 5.2.2 Self-Interstitial as a Source for KickoutRreactions ............................................. 69 5.2.3 Kickout Reaction Rates .......................................................................................... 72 5.2.4 Discussion on Radiation Enhanced Diffusion Mechanism .................................. 76
5.3 Summary of Results from Atomistic Simulations .......................................................... 77
6 Continuum model of diffusion through polycrystalline SiC ............................................. 78
7 Publications resulting from this project ............................................................................. 79
8 References .............................................................................................................................. 79
9 Appendices ............................................................................................................................. 88

Final Report January, 2016
4
1 Introduction Silicon carbide is the main barrier to diffusion of fission products in the current design of
TRistuctural ISOtropic (TRISO) coated fuel particles and Ag is one of the few fission products that have been shown to escape through this barrier. Because the SiC coating in TRISO is exposed to radiation throughout the lifetime of the fuel, understanding of how radiation changes the transport of the fission products is essential for the safety of the reactor. The goals of this project are: (i) to determine whether observed variation in integral release measurements of Ag through SiC can be explained by differences in grain size and grain boundary (GB) types among the samples; (2) to identify the effects of irradiation on diffusion of Ag through SiC; (3) to discover phenomena responsible for significant solubility of Ag in polycrystalline SiC. To address these goals, we combined experimental analysis of SiC diffusion couples with modeling studies of diffusion mechanisms through bulk and GBs of this material. Comparison between results obtained for pristine and irradiated samples brings in insights into the effects of radiation on Ag transport. 2 Diffusion Couple Experiments
2.1 Development of Ion Implantation Diffusion Couple System
2.1.1 Overview of Diffusion Couple Design Approach
Numerous experimental challenges influence investigation of silver (Ag) diffusion in silicon carbide (SiC). The primary issues are the expected low solubility limits (S(T)) (<1x10¹⁷ at/cm3) at the temperatures of interest to TRISO fuel operation and accident conditions (900-1600°C) [1] and limited diffusion length scales at the time and temperatures associated with reported diffusion experiments. These constraints influence the design of diffusion couples appropriate for investigation of the Ag-SiC system as well as the necessary analysis techniques needed to measure diffusion in the Ag-SiC system.
This work utilized ion implantation diffusion couples to investigate the diffusion behavior in the Ag-SiC system. Ion implantation overcomes critical issues associated with high temperature diffusion couples of Ag-SiC, namely it provides a consistent Ag source at the temperatures of interest where Ag is a liquid with a high vapor pressure, and as such many traditional diffusion couple designs are not applicable under these conditions. The approach also provides a planar well-defined planar interface, which allows for application of high sensitivity depth profiling techniques. This work revisited Ag-SiC ion implantation diffusion couple approaches, which had been previously reported in the literature [2] and modified the design approach to limit the influence of implantation effects.
The ion implantation diffusion couples were constructed using polycrystalline CVD 3C-SiC from Rohm and Haas (3C-SiC) and single crystal 4H-SiC wafers 4° off (1000) from Cree, Inc. (4H-SiC). Polycrystalline 3C-SiC samples were prepared from bulk samples and were polished to an arithmetic surface roughness (Ra) < 10 nm. The single crystal 4H-SiC wafers were obtained from Cree, Inc. with a Ra < 10 nm. Roughness values were measured using a Zygo

Final Report January, 2016
5
optical profilometer. The polycrystalline 3C-SiC substrates were implanted with two separate dose conditions, 400 kV Ag+ to 1x10¹⁴ ion/cm2 and 5x10¹⁴ ions/cm2, at 300ºC at the Michigan Ion Beam Laboratory (MIBL) through the Advanced Test Reactor National User Facility (ATR-NSUF) program. The single crystal 4H-SiC substrates were implanted to a dose of 5x10¹⁴ ions/cm2 at identical conditions to the polycrystalline 3C-SiC substrates. The implantation dose and the 300ºC implantation temperature were selected to avoid amorphization of the SiC substrate during implantation, while the two dose conditions for the 3C-SiC substrates were selected to understand potential dose dependence on the diffusion behavior. Following Ag implantation a 200-250 nm diamond-like-carbon (DLC) coating was deposited on the SiC’s implanted surface to protect the sample during thermal exposure.
2.1.2 Diffusion Couple Exposures
Individual samples, ~8 mm × ~8 mm, were cut from the bulk implanted substrates for thermal exposure. Individual samples for thermal exposure were mated with an as-polished 3C-SiC sample using graphite paste to further protect the implantation surface. The samples were sealed in a thick-walled quartz ampoule with excess coarse SiC powder to limit surface decomposition, as shown in Fig. 2.1. Approximately, 0.05 g of Ag foil was encapsulated in the isolated sample chamber along with the diffusion sample to limit Ag out-diffusion from the Ag implanted SiC substrates. This diffusion couple exposure system was developed based on observations made from earlier ion implantation diffusion couple studies where samples that were thermally exposed in a W-mesh vacuum furnace exhibited significant surface decomposition which completely consumed the implantation layer in select samples [3]. Samples were exposed to 1500-1569ºC in an MTI GSL 1600X-80 tube furnace and at 1625ºC in a Lindberg Blue tube furnace. The self-contained samples were inserted and removed at temperature followed by a quenched step to limit diffusion contributions during transient heating and cooling. Temperatures were monitored with an external Type-B thermocouple placed in the center of the tube furnace hot zone. Table 2.1 shows the ion implantation diffusion couples investigated in this stage of the study.
Figure 2.1 Schematic illustration of ion implantation diffusion couple exposure system.
Mated IonImplantation Sample
SiC Powder GetterQuartz

Final Report January, 2016
6
Table 2.1 Ion implantation diffusion couple exposure conditions for Ag implantation doses of 5x10¹⁴ ions/cm2, *indicates 1x10¹⁴ ions/cm2 also included Temp. (ºC) 1500ºC 1535ºC 1569ºC 1625ºC Time (hours) 5,10,20 hours* 10 hours* 5,10,20 hours 1 hour
2.2 Analysis of Ion Implanted Diffusion Couples
2.2.1 Overview of Analysis Approach
Diffusion couple analysis focused on measurement of the change in Ag distribution of implanted Ag after thermal exposure to understand the nature and magnitude of thermal diffusion in the samples. Bulk changes in the Ag distribution were determined through the use of secondary ion mass spectroscopy (SIMS), while changes in the spatial distribution of Ag in the SiC substrate were investigated by scanning transmission electron microscopy (STEM).
SIMS analysis was preferred over other depth profiling measurements, such as Rutherford Backscatter Spectroscopy (RBS), due to the large dynamic range in Ag sensitivity gained from SIMS. This aspect is imperative as the signature of impurity diffusion in SiC is expected to be observed below the solubility limits of the Ag-SiC system, that is, when the ion implantation diffusion couple is exposed to temperature, impurity diffusion is driven into the bulk past the implantation peak at approximately the S(T) of the system. This is displayed in Fig. 2.2, which shows a schematic of the ion implantation diffusion scenario which satisfies the constant source approximation, where the impurity concentration extends into the bulk below the S(T) of the system and is observed as a shoulder or “tail” off of the Gaussian distribution extending into the bulk substrate. Because the signature of impurity diffusion is tied to the solubility limit of the Ag-SiC a high sensitivity depth profiling technique capable of measuring concentrations below 1x10¹⁷ at/cm3 is required - for this reason SIMS was identified as an ideal analytical technique.

Final Report January, 2016
7
0 200 400 600 800 1000 1200 14001E15
1E16
1E17
1E18
1E19
1E20
1E21
1E22 Implantation Diffusion
[Ag]
at/c
m3
Depth (nm)
Figure 2.2 Schematic illustration of the ion implantation diffusion couple depth profile.
SIMS analysis was conducted using a Cameca IMS 7f-GEO magnetic sector SIMS. Depth profiles were obtained for Ag in SiC by rastering a 5 keV O2
+ ion beam over a 200 × 200 µm area with a 33 µm diameter optically gated analysis area. The SIMS analysis was performed at the Institute of Critical Technology and Applied Science Nanoscale Characterization and Fabrication Laboratory at Virginia Tech. 107Ag intensity was measured as a function of time and the measured intensity was correlated to Ag concentration using a relative sensitivity factor of 1.10-1.32×10²³ at/cm3 calculated from of the as-implanted (AI) SiC substrates using the isotope 28Si as the bulk SiC reference intensity. Relative sensitivity factors were determined for all AI substrates (polycrystalline 3C-SiC 1×10¹⁴ ions/cm2 and 5×10¹⁴ ions/cm2, and single crystal 4H-SiC 5×10¹⁴ ions/cm2), where the range in relative sensitivity factors is representative of minor experimental variations for each AI substrate. Crater depths were determined by measuring the SIMS sputter crater using a Zygo optical profilometer to correlate sputtering time with depth.
STEM was employed to observe the initial state of the implanted substrate and the change in Ag spatial distribution after thermal exposure. STEM samples for investigation were prepared by traditional focused ion beam (FIB) lift-out techniques using a Zeiss CrossBeam Dual Beam FIB/SEM at the University of Wisconsin-Madison Materials Science Center (UWMSC). The FIB lift-out technique provided cross-sectional TEM samples of the SiC structure along the implantation and diffusion direction. Bright Field (BF) TEM analysis was performed using a Technai TF-30 at 300 kV. Selected area diffraction (SAD) patterns of the implantation layer and unaffected SiC beyond the implantation layer were obtained using a 300 nm aperture. Annular Dark Field (ADF) micrographs were obtained using a FEI Titan aberration-corrected STEM at the UWMSC to provide additional mass-contrast to aid in resolving the nature of the Ag after implantation and thermal exposure
~S(T)

Final Report January, 2016
8
2.2.2 STEM Analysis of Ion Implanted Diffusion Couples
Figure 2.3 shows a BF-TEM comparison of the implantation zone for the polycrystalline 3C-SiC 5×10¹⁴ ions/cm2 as-implanted (AI) and 1569ºC 20 hour exposure samples. SAD patterns, inset in Fig. 2.3, indicate the implantation zone remained crystalline and suggests the implanted Ag remained in solution after implantation as no segregated features are observed in the implantation zone, which is identified as a darker band parallel to the implantation surface. Post thermal exposure, a fine structure is observed in the primary implantation region, indicating implanted Ag redistributes after thermal annealing in the crystalline substrate. Figure 2.4 shows the BF-TEM micrographs of the single crystal 4H-SiC 5×10¹⁴ ions/cm2 AI and 1569ºC 20 hours exposure samples. Similar to the polycrystalline 3C-SiC substrates, no evidence of amorphization is apparent as the SAD pattern indicates a crystalline substrate remains after implantation. Following thermal exposure fine scale segregated Ag features are observed. No insight on the structure of the fine scale segregated Ag features was determined from the SAD analysis of the thermally exposed samples.

Final Report January, 2016
9
Figure 2.3 BF TEM micrographs of polycrystalline 3C-SiC 5×10¹⁴ ions/cm2 AI (A-B) and 1569ºC 20 hours (C-D) conditions, inset SAD of (200) zone axis, dashed line indicates implantation surface while arrow indicates implantation direction, i) shows SAD from implanted region, u) indicates SAD from undamaged region.

Final Report January, 2016
10
Figure 2.4 BF TEM micrographs of single crystal 4H-SiC 5×10¹⁴ ions/cm2 AI (A) and 1569ºC 20 hours (B) conditions, inset SAD of (11-20) zone axis, dashed line indicates implantation surface while arrow indicates direction implantation direction, i) shows SAD from implanted region, u) indicates SAD from undamaged region.
Figure 2.5 ADF micrographs of polycrystalline 3C-SiC 5×10¹⁴ ions/cm2 AI (A) and 1500ºC 10 hours (B) conditions identifying fine structure after thermal exposure, dashed line indicates implantation surface while arrow indicates direction of ion implantation.
ADF provides diffraction contrast and mass contrast for imaging Ag impurities in the low atomic mass SiC matrix. Figure 2.5 shows a comparison of the polycrystalline 3C-SiC 5×10¹⁴ ions/cm2 AI and 1500ºC 10 hours thermal exposure, confirming fine scale Ag features form after thermal exposure in the region associated with the implantation zone. The affected depth is measured to be ~300-350 nm with no obvious features observed at greater depths. No obvious indicators of Ag segregation to microstructural features were noted.

Final Report January, 2016
11
The primary observation from the STEM analysis was that the substrate remained crystalline after ion implantation. This was a targeted attribute of the experiment as amorphization of the implantation region has been shown to influence the transport and redistribution of the implanted Ag due to recrystallization of the SiC substrate [2]. Maintaining a crystalline implantation region is expected to mitigate the influence of substrate recrystallization on Ag transport. Additionally, STEM analysis indicated the implantation surface remained intact with no deleterious surface decomposition, such that changes in the Ag distribution would not be influenced by SiC substrate decomposition.
2.2.3 SIMS Analysis of Ion Implantation Diffusion Couples
SIMS analysis provided insight into the bulk redistribution of the implanted Ag after thermal exposure through depth profile measurements. Figure 2.6 shows an isochronal comparison of Ag depth profiles for single crystal 4H-SiC substrates exposed to temperatures of 1500-1569ºC for 10 hours. The AI Ag profile measured in the single crystal 4H-SiC substrate presents a singular Ag concentration peak at ~140 nm with a skewed Ag concentration past the primary peak away from the surface into the bulk substrate. This is expected from ion straggling during implantation. The thermally exposed single crystal 4H-SiC substrates indicate a bi-modal Ag distribution for all thermally exposed samples, with the primary peak remaining at ~140 nm and a secondary peak at a depth of ~500 nm. Figure 2.7 shows Ag depth profiles for the isothermal exposures of 1569ºC 5-20 hours. The isothermal comparison presents a similar observation in that no significant variation in the Ag concentration profile past the primary implantation peak is observed as a function of time, which implies that the observed redistribution of the implanted Ag concentration past the primary implantation peak is independent of the exposure time and temperature for the conditions investigated.

Final Report January, 2016
12
Figure 2.6 SIMS depth profiles of Ag in SiC for single crystal 4H-SiC (dose of 5×10¹⁴ ions/cm2) in AI condition followed by 1500-1569ºC 10 hours isochronal exposures identifying redistribution of Ag past the primary implantation peak.
Figure 2.7 SIMS depth profiles of Ag in SiC for single crystal 4H-SiC (dose of 5×10¹⁴ ions/cm2) in AI condition followed by 1569ºC 5-20 hours isothermal exposures identifying redistribution of Ag with minimal variation past the primary implantation peak.
The correlation of the Ag depth profile with the SRIM damage profile is shown in Fig. 2.8. A scaling factor of 1.28 was used to account for the underestimation of the heavy ion interaction with SiC in SRIM [4]. The observed Ag concentration minimum and secondary peak, as seen in Fig. 2.6 and Fig. 2.7, coincides with the reduction in implantation induced damage estimated in SRIM and is beyond the depth containing end-of-range defects identified by BF-
-0.5 0.0 0.5 1.0 1.5 2.0 2.5 3.01015
1016
1017
1018
1019
1020
[Ag]
at/c
m3
Depth (μm)
AI 4H-SiC 5x1014 cm-2
1500oC 10 Hrs 1535oC 10 Hrs 1569oC 10 Hrs
-0.5 0.0 0.5 1.0 1.5 2.0 2.5 3.01015
1016
1017
1018
1019
1020
[Ag]
at/c
m3
Depth (μm)
AI 4H-SiC 5x1014 cm-2) 1569oC 5 Hrs 1569oC 10 Hrs 1569oC 20 Hrs

Final Report January, 2016
13
TEM. The consistent Ag depth profiles suggest the redistribution of Ag past the primary implantation peak is due to diffusion annealing of a finite population of implantation induced defects in the single crystal 4H-SiC substrate.
Figure 2.8 SIMS Ag depth profile of single crystal 4H-SiC (dose 5x10¹⁴ ions/cm2) in AI conditionand 1569oC 5 hours exposure overlaid with damage profile estimated from SRIM.
SIMS depth profiles for the polycrystalline 3C-SiC substrates indicated a different behavior than the 4H-SiC single crystal substrates. SIMS Ag depth profiles for the 5×10¹⁴ ions/cm2 polycrystalline 3C-SiC substrates exposed to isochronal conditions of 1500-1569ºC for 10 hours are shown in Fig. 2.9. Ag concentration is observed to penetrate into the bulk SiC beyond the primary implantation peak with increasing penetration as a function of exposure temperature, suggesting a temperature dependence on the Ag penetration. Figure 2.10 shows a comparison of 5×10¹⁴ ions/cm2 polycrystalline 3C-SiC substrates exposed to 1500ºC for 10 and 20 hours with the AI condition. From Fig. 2.10 a minimal variation in the Ag concentration between the 1500ºC 10 and 20 hours exposures is observed implying the observed profiles at 1500ºC are due to Ag transport influenced by finite non-equilibrium point defects generated during implantation. Figure 2.11 shows the Ag concentration depth profiles for isothermal 5×10¹⁴ ions/cm2 polycrystalline 3C-SiC substrates exposed to 1569ºC for 5-20 hours and indicate that the Ag penetration into bulk SiC increases as a function of time. This observation suggests the Ag concentration “tail” extending into the bulk past the primary implantation peak is due to a thermally dependent transport mechanism. A comparative Ag concentration penetration depth was determined at a reference Ag concentration of 2×10¹⁶ at/cm3 in the Ag penetration “tail”. The magnitude of the observed Ag penetration past the AI profile is approximately 0.19 µm, 0.44 µm and 0.66 µm for 1500ºC, 1535ºC, and 1569ºC, 10 hour exposures, respectively, while the 1625ºC 1 hour exposure indicated an Ag concentration penetration of 0.34 µm past the AI profile. From this behavior, evidence of thermal Ag diffusion is indicated by the extended Ag

Final Report January, 2016
14
penetration past the consistent 1500ºC 10 and 20 hour profiles. For the 1500ºC profiles, the consistent profiles imply no Ag transport is measurable beyond the signature of the implantation-induced transport. Figure 2.12 shows a Ag dose comparison for polycrystalline 3C-SiC 1×10¹⁴ ions/cm2 and 5x10¹⁴ ions/cm2 AI and 1535ºC 10 hour exposures - the profiles indicate a similar Ag concentration penetration profile extending into the bulk SiC offset by the variation in independent AI profiles, suggesting minimal implantation dose dependence.
A reduction of the primary peak for Ag implanted concentration was noted for most exposures and this is consistent with previously reported observation of thermally exposed Ag/SiC implantation diffusion couples and is expected to be due to loss to the implantation surface [5-8]. For the 1569ºC 10 hours and 20 hours exposures a peak shift skewed away from the implantation surface was observed. This phenomenon was also reported by Friedland et al. [5] and was suggested to be due to grain boundary diffusion effects.
Figure 2.9 SIMS depth profiles of Ag in SiC for polycrystalline 3C-SiC (dose 5x10¹⁴ ions/cm2) in AI condition followed by1500-1569ºC 10 hour isochronal exposures identifying extension of Ag concentration past the primary implantation peak.
-0.5 0.0 0.5 1.0 1.5 2.0 2.5 3.0 3.51015
1016
1017
1018
1019
1020
[Ag]
at/c
m3
Depth (μm)
AI 3C-SiC 5x1014 cm-2
1500oC 10 hrs 1535oC 10 hrs 1569oC 10 hrs

Final Report January, 2016
15
Figure 2.10 SIMS depth profiles of Ag in SiC for polycrystalline 3C-SiC 5×10¹⁴ ions/cm2 AI, followed by 1500ºC 10 hours and 20 hours. The comparison identifies limited variation in Ag concentration between exposure conditions show no significant Ag concentration penetration into bulk SiC.
Figure 2.11 SIMS depth profiles of Ag in SiC for polycrystalline 3C-SiC 5×10¹⁴ ions/cm2 AI followed by 1569ºC 5-20 hours isothermal exposures. An extension of the Ag concentration is measured in bulk SiC past the primary implantation peak for all conditions with the magnitude of penetration dependent on exposure time.
-0.5 0.0 0.5 1.0 1.5 2.0 2.5 3.0 3.51015
1016
1017
1018
1019
1020
[Ag]
at/c
m3
Depth (μm)
AI 3C-SiC 5x1014 cm-2
1500oC 10 Hrs 1500oC 20 Hrs
0 1 2 31015
1016
1017
1018
1019
1020
[Ag]
at/c
m3
Depth (μm)
AI 3C-SiC 5x1014 cm-2
1569oC 5 Hrs 1569oC 10 Hrs 1569oC 20 Hrs

Final Report January, 2016
16
Figure 2.12 SIMS depth profiles for implantation dose comparison of Ag in SiC for polycrystalline 3C-SiC 1×10¹⁴ ions/cm2 AI followed by 1535ºC 10 hours and polycrystalline 3C-SiC 5×10¹⁴ ions/cm2 AI and 1535ºC 10 hours exposures. An extension of the Ag concentration is measured in bulk SiC past the primary implantation peak for both implantation conditions.
2.3 Discussion of Measured Ag Transport
2.3.1 Defects Contributing to Non-equilibrium Diffusion The SIMS observations from both 4H-SiC single crystal and 3C-SiC polycrystalline
diffusion couples imply residual point defects from the ion implantation influence the measured Ag profiles after thermal exposure. This effect is manifested as enhanced diffusion relative to thermal diffusion. The following section discusses the nature of the observed diffusion based on the SIMS and STEM analysis. Discussion focuses primarily on the analysis of the single crystal 4H-SiC samples as the single crystal nature of the microstructure isolates the contributions from grain boundary effects.
The diffusion coefficient, D, for equilibrium impurity diffusion is described by an Arrhenius relationship shown in Equation 2.1. In Equation 2.1, Do (m2/s) is a pre-exponential term which describes the physical nature of the diffusion mechanism, k is Boltzmann’s constant (eV/K), T is temperature (K) and Q is the activation energy (eV). The activation energy, Q, is composed of a migration energy barrier, Em, and a formation energy barrier, Ef . Here Em, in general terms, describes the energy barrier for a specific mechanism to proceed forward, while Ef describes the probability that a specific defect is present to participate in the diffusion process. The activation energy, Q, is approximated as the sum of both Em and Ef.
Equation 2.1 =
-0.5 0.0 0.5 1.0 1.5 2.0 2.5 3.0 3.51015
1016
1017
1018
1019
1020
[Ag]
at/c
m3
Depth (μm)
AI 3C-SiC 1x1014 cm-2
1535oC 10 Hrs 1x1014 cm-2
AI 3C-SiC 5x1014 cm-2
1535oC 10 Hrs 5x1014 cm-2

Final Report January, 2016
17
In simple cases, enhanced diffusion can occur from irradiation effects when non-equilibrium point defect concentrations contributing to the diffusion mechanism are present after implantation. Under enhanced diffusion conditions resulting from non-equilibrium point defects, the activation energy for diffusion is not dependent on Ef and is dominated by Em and trapping effects [9]. When trapping effects are limited, the enhanced diffusion coefficient, Denh
, is increased proportionally to the concentration of non-equilibrium point defects remaining after implantation where the barrier to diffusion becomes dominated by Em for the specific mechanism. Equation 2.2 demonstrates this principle for a specific mechanism, in this example, a direct interstitialcy diffusion mechanism [10]. In Equation 2.2, Denh., is the enhanced diffusion coefficient, [AI], is the impurity interstitial concentration, [AI
eq.] is the equilibrium impurity interstitial concentration and DA
eq. is the equilibrium diffusion coefficient. [AIeq.] depends on the
Ef, as described by Equation 2.3 [11], leading to the enhanced diffusion coefficients dependence on Em.
Equation 2.2 . = . [ ].
Equation 2.3 . ≈ # ×
For enhanced diffusion to be active after ion implantation, residual point defects must be
present. Residual point defects generated during implantation are expected to be present in the SiC substrate after the implantation process at 300oC in this study and as such would be available to contribute to enhanced diffusion. However, the availability of specific defects is expected to vary as self-interstitials and vacancies have different annealing temperatures in SiC. The annealing temperatures of vacancies in the Si and C sublattices are expected to be 800oC and 450-500oC, respectively [12]. The corresponding migration barriers, Em, for vacancy motion are 5.2-6.5 eV for Si sublattice vacancies, VSi, and 3.5–5.2 eV for C sublattice vacancies, VC [12]. The effective diffusion length for intrinsic vacancy diffusion is estimated from x = √ , where x is an approximation of the diffusion length scale. For the implantation conditions, ~40 min implantation at 300oC, the effective vacancy diffusion length are ~4.3×10⁻²⁶ nm and ~1.5×10⁻²⁹ nm using reported diffusion coefficients of VC and VSi, respectively [13-15]. This highlights the limited vacancy mobility at 300oC. The picture of remaining interstitials generated by implantation damage is less clear. The insight on the nature of self-interstitials in SiC as determined by ab initio simulations suggest several interstitial configurations are possible [16],[13]. The mobility of self-interstitial defects is expected to be greater than vacancies in SiC. The expected prevalent migration pathway for C interstitials is associated with a Em between 0.91–1.68 eV [12] while the barrier for Si self-interstitial diffusion is expected to range from 3.4-3.56 eV [12],[17]. A comparison of the magnitude of the Em for vacancies and interstitials suggests that Si self-interstitials may remain after implantation as the Em is equivalent to the low end of the C vacancy Em, which corresponds to a defect annealing temperature of 450-500oC. The Em of C self-interstitials is ~2 eV lower, implying that the defects are likely mobile at 300oC
Final Report January, 2016
18
and may anneal out. The energetics of defects formed by the implantation process suggests excess point defects, notably Si and C vacancies and Si self-interstitials, are available to participate in the Ag diffusion process after the implantation is halted.
The nature of the implantation induced point defects for the Ag-SiC system is not explicitly known, and as such direct confirmation of the mechanism responsible for the Ag diffusion in 4H-SiC and initial diffusion in 3C-SiC (as indicated by the 1500oC 10 and 20 hour samples) is not possible. No direct measurement of the nature of the impurity Ag after implantation has been made in this study. A previous ion implantation study by Xiao et al. [8] reported that implanted Ag exists interstitially after implantation at 377ºC as determined by RBS channeling experiments. Alternately, ab initio simulations by Schrader et al. [16] suggest the most stable Ag defect in the lattice is the AgSi-VC
-1 complex, implying Ag prefers to sit in a complex-substitutional site after implantation. TEM analysis indicates trapping of implanted Ag at end-of-range large scale defects, as shown in Fig. 2.3 and Fig. 2.4, which are formed due to a super-saturation of point defect in the primary implantation peak.
The distributions of implantation induced vacancy and self-interstitial point defects are expected to vary as a function of depth in the implanted substrate. Excess vacancies are expected to be present in the regime from the surface to the projected end-of-range and excess interstitials begin to dominate beyond the projected end-of-range [18, 19]. In Si substrate implantations, this difference in point defect populations is expected to influence enhanced impurity diffusion [20]. The observed Ag diffusion, associated with the Ag concentration minima in the single crystal 4H-SiC depth profiles, occurs in the regime where there is excess of interstitials. This suggests that excess vacancies provide sufficient trapping sites to immobilize implanted Ag from the implantation surface to the end-of-range. The redistribution of Ag past the transition from excess vacancies to excess interstitials implies that the observed Ag diffusion is dependent on mobile interstitials. The secondary segregation peak occurs beyond the primary implantation peak and is expected to be the result of Ag gettering at implantation induced impurity sinks in the irradiated substrate. This implantation induced gettering in the trans-end-of-range region has been observed in Si ion implantations and is attributed to trapping of mobile interstitials at small interstitial features [21-23]. The suggested dependence of the observed enhanced Ag diffusion on the vacancy and interstitial populations provides evidence for two potential mechanisms: direct interstitial diffusion and a kick-out diffusion mechanism.
2.3.2 Discussion of Mechanisms Contributing to Enhanced Diffusion
A direct interstitial diffusion mechanism describes the scenario where implanted Ag resides interstitially after implantation, as suggested by Xiao et al. [8]. Here, the excess implanted Ag interstitials would be expected to be mobile at the exposure temperatures until reaching an interstitial sink, due to the expected low Em for Ag interstitials, ~0.89 eV [16]. This would account for the observed bi-modal distribution as an increased sink density is present at the near-surface due to excess vacancies, at the end-of-range implantation peak due to large scale defects, and in the region past the primary peak (trans-end-of-range defects).

Final Report January, 2016
19
In the simplified kick-out process an excess self-interstitial (I) replace an Ag substitutional atom (AgS) yielding a Ag interstitial atom (AgI), shown in Equation 2.4. The Ag interstitial is then available to diffuse by a direct interstitial mechanism or by the reverse reaction. However, this simplified process is likely more complicated in SiC due to the multiple sublattices and the presence of anti-site defects.
Equation 2.4 + ⇔
Based on Equation 2.2 impurity diffusivity is dictated by the Ag impurity concentrations, which are coupled to the self-interstitial concentration. For systems where the kick-out mechanism is active, under equilibrium conditions the concentration of substitutional impurities can be significantly greater than that of the interstitial impurities, however, the vacancy diffusivity can be much lower than the interstitial diffusivity [24]. This holds for the energetics of Ag defects in SiC where Ef is lower for substitutional defects compared to interstitials and Em of interstitials is expected to be lower than Em of substitutional defects [16]. Thus after implantation, the kick-out mechanism effectively mobilizes a non-equilibrium fraction of the implanted impurity atoms leading to enhanced diffusion.
For the kick-out mechanism, [AgI] cannot be estimated directly as insight on the reaction constant for Equation 2.4 must be known in addition to trapping effects. We define the “+1 model” as one that assumes a self-interstitial, I, is formed for every incident ion [25]. Assuming the reaction in Equation 2.4 proceeds completely to the right (with limited trapping effects), an upper bounds estimate of [AgI] ~1×10⁻⁴ to 1×10⁻⁸ can be made from the +1 model. The same estimate for [AgI] is also obtained if we assume all implanted Ag resides interstitially after implantation. The estimated value for [Ageq.
I] is ~1×10-30 at 1500ºC based on the Ef ~ 10.49 eV from ab initio calculations [16]. This equates to a [AgI]/[Ageq.
I] ~ 1×10²²-26, leading to a proportional increase in Denh .and represents an upper bound in the magnitude of Denh. (as the role of trapping is not considered). The single crystal 4H-SiC depth profiles indicate that the mobile point defects are annealed out after 1500ºC at 10 hours. A lower bound on Denh. is estimated from the observed diffusion length from the Ag concentration minima to the trans-end-of-range peak of ~100 nm. The estimated lower bound of Denh. for the shortest exposure time (1625ºC for 1 hour) is ~1×10-18 m2/s. This value is reasonable in comparison to the calculated DAg for interstitial lattice diffusion from ab initio simulation of ~2.5×10⁻³⁰ m2/s at 1625ºC as it represents an ~1×10¹¹ increase in DAg, which is below the estimated bound for Denh.
Ultimately, the extent of the enhanced diffusion and responsible mechanism observed in single crystal 4H-SiC exposures is unknown due to a limited understanding of the residual point defects after implantation and magnitude of the specific defect concentrations. However, the correlation of the damage profile with bi-modal Ag redistribution indicates the non-equilibrium interstitial point defects, which remain after ion implantation, contribute to the observed diffusion of Ag in single crystal 4H-SiC. The constant Ag concentration profile past the primary peak at 1569ºC for 5, 10, 20 hours exposures for single crystal 4H-SiC implies that the

Final Report January, 2016
20
redistribution was due to the annealing out of a finite mobile point defect population which is indicative of an enhanced diffusion by ion implantation [10].
2.3.3 Diffusion Analysis of Polycrystalline 3C-SiC Diffusion Couples
The time and temperature dependence of the Ag profiles in the polycrystalline 3C-SiC diffusion couples allowed for analysis of the diffusion kinetics of the system. For ion implantation diffusion experiments, the main implantation peak serves as a constant source approximation when the peak concentration is greater than the solubility limit, S(T), of the system. A modified expression for diffusion dependence of ion implanted impurity species is presented in Equation 2.5. In Equation 2.5, Co is the concentration at which the impurity species extends into the bulk, do is the depth at which the impurity concentration deviates from the implantation peak at Co, d is the depth at C(d,t), t is time in seconds of the thermal exposure, and D is the diffusion coefficient [26].
Equation 2.5 = √
The magnitude of the Ag concentration penetration “tail”, Co, was estimated by
extrapolating a linear fit of the Ag concentration “tail” in the bulk to the primary implantation peak. Table 2.2 shows the magnitude for the observed Ag penetration, Co, for each implantation sample. Table 2.2 Co values for polycrystalline 3C-SiC diffusion profiles
Time Dose 1535°C 1569°C 1625°C
1 hour 5×1014 cm-2 - -
6.47±0.57×10¹⁶ at/cm3
1×1014 cm-2 - - -
5 hours 5×1014 cm-2 -
6.33±0.83×10¹⁶ at/cm3
-
1×1014 cm-2 - - -
10 hours 5×1014 cm-2
6.13±0.43×10¹⁶ at/cm3
6.26±0.69×10¹⁶ at/cm3
-
1×1014 cm-2 4.81±0.43×10¹⁶
at/cm3 - -
20 hours 5×1014 cm-2 -
6.03±0.70×10¹⁶ at/cm3
-
1×1014 cm-2 - - -
Diffusion coefficients for Ag in polycrystalline 3C-SiC, DAg, were estimated from the exposures above 1535°C, as at 1500°C no change in Ag profile was observed due to thermal diffusion, by numerically solving Equation 2.5 using the Co values in Table 2.2. Estimated values for DAg from the SIMS profiles are presented in Table 2.3. Fitting the DAg to an Arrhenius

Final Report January, 2016
21
relationship, Equation 2.1, using a least squares fit equates to an activation energy, Q, of 5.89±0.99 eV and a pre-exponential term, Do of 2.08x10⁻¹ m2/s. The range of the pre exponential term error is 4.04×10⁻⁴ to 1.07×10² m2/s. Error is estimated from the standard deviation of the linear regression fit.
Table 2.3 Estimated Ag diffusion coefficients in SiC (DAg) from SIMS diffusion profiles
Time Dose 1535°C 1569°C 1625°C
1 hour 5×1014 cm-2 - - 5.17±0.56×10⁻¹⁷ m2/s 1×1014 cm-2 - - -
5 hours 5×1014 cm-2 - 1.40±0.42×10⁻¹⁷ m2/s - 1×1014 cm-2 - - -
10 hours 5×1014 cm-2 9.72±8.63×10⁻¹⁸ m2/s 1.27±0.19×10⁻¹⁷ m2/s - 1×1014 cm-2 8.19±1.92×10⁻¹⁸ m2/s - -
20 hours 5×1014 cm-2 - 1.41±0.15×10⁻¹⁷ m2/s - 1×1014 cm-2 - - -
Average 8.95×10⁻¹⁸ m2/s 1.36×10⁻¹⁷ m2/s 5.17×10⁻¹⁷ m2/s Error ±4.42×10⁻¹⁸ m2/s ±1.63×10⁻¹⁸ m2/s ±5.62×10⁻¹⁸ m2/s
SIMS depth profiling in the polycrystalline 3C-SiC substrates gives rise to the possibility
that the observed Ag penetration is due to SIMS artifacts from preferential sputtering and roughness effects. The peak-to-valley roughness of the SIMS crater surface is an indication of the magnitude of the crater surface roughness. Peak-to-valley roughness was measured by optical profilometery to be 0.05±0.02 µm. This correlates to penetration depths ~4-13 times greater than the peak-to-valley roughness as measured at the reference Ag concentration of 2×10¹⁶ at/cm3 past the AI profile for 1500-1625ºC. Additionally, the peak-to-valley roughness did not correlate with measured Ag concentration penetration differences observed in the isothermal 1569ºC comparison, implying that the variation in observed Ag penetration is not primarily due to a SIMS artifact.
Additional caution is noted for the diffusion analysis in this study as the contributions of enhanced diffusion from annealing of excess point defects during the initial stages of Ag defect diffusion are unknown and will likely influence the observed diffusion. Furthermore, secondary diffusion phenomena associated with peak broadening may also influence the diffusion analysis of Co. The contribution of these effects on the diffusion analysis error is not explicitly known. To mitigate concerns about the influence of implantation effects, higher temperatures and longer annealing times should be investigated to drive diffusion lengths past the primary implantation peak and the magnitude of the Ag penetration to concentrations above the influence of the enhanced Ag diffusion and SIMS detection limits.

Final Report January, 2016
22
2.3.4 Discussion of Diffusion in Polycrystalline 3C-SiC: Role of Microstructure
Comparison of the change in Ag concentration past the primary implantation peak between the single crystal 4H-SiC and polycrystalline 3C-SiC substrates suggests polycrystalline 3C-SiC accommodates excess Ag and facilitates impurity diffusion into bulk SiC. Ideally, the single crystal 4H-SiC substrate serves to isolate lattice diffusion contributions while the polycrystalline 3C-SiC substrate serves to mimic the TRISO fuel layer by introducing GB diffusion to contribute to Ag transport.
The absence of Ag extending into bulk SiC in the single crystal 4H-SiC substrates suggests that Ag is not accommodated in single crystal SiC above the detection limits of the SIMS analysis technique (1×10¹⁵ at/cm3), whereas an extension of the Ag concentration is observed at approximately 4-7×10¹⁶ at/cm3 for the polycrystalline 3C-SiC substrates. In the single crystal 4H-SiC substrates implanted defects are annealed out after 1500ºC 10 hours. The extension of Ag into the bulk of the polycrystalline 3C-SiC and similar diffusion profiles for the polycrystalline 3C-SiC 5×10¹⁴ ions/cm2 1500ºC 10 and 20 hours exposures suggests that GBs act as Ag impurity sinks for the mobile implanted Ag defects during the initial stages of the thermal annealing, while the presence of GBs facilitates measurable impurity diffusion above 1535ºC. No experimental values of the solubility limits of Ag in single crystal or polycrystalline SiC are reported in literature. Solubility limits, S(T), for impurities with atomic numbers greater than 37, have a maximum value of 2.5×10¹⁷ at/cm3 at temperatures greater than 2150ºC [1]. The observation of S(T) < 1×10¹⁵ at/cm3 for the single crystal 4H-SiC substrate follows this trend. The presence of GBs likely accounts for an increase in the S(T) of the system as Ag is expected to strongly segregate to GBs with an estimated GB segregation factor, s, of ~1×10⁸ at 1500ºC where s is defined as the ratio of the impurity concentration at the GB to the impurity concentration in the lattice [11]. This analysis implies that most Ag is expected to be segregated to GBs. Electron backscatter diffraction analysis of the polycrystalline 3C-SiC substrate in this study estimated the total GB volume fraction to be ~4×10⁻⁴. Under a bounding condition of complete GB saturation, an upper estimate for S(T) of ~4×10¹⁹ at/cm3 is possible. The measured Co for the observed Ag concentration penetration correlates to Ag GB concentration of approximately 0.1 at% and a bulk Ag concentration << 1×10¹⁵ at/cm3, for s ~ 1×10⁸. For both scenarios the peak implanted Ag concentration is above the expected S(T) of the 4H-SiC and 3C-SiC systems implying that the constant source approximation assumed in Equation 2.5 was satisfied.
The presence of GBs implies that the measured Ag penetration in 3C-SiC is due to GB diffusion and is more significant than impurity lattice diffusion. This conclusion is supported by experimental observations, which suggest C self-diffusion along GBs in polycrystalline 3C-SiC is 5-6 orders of magnitude faster than lattice diffusion [14] and ab initio results which suggest DAg along Σ3 GBs is greater by 10 orders of magnitude than lattice diffusion [11]. Again, this analysis suggests the observed diffusion in polycrystalline 3C-SiC is due primarily to GB diffusion, however, other microstructural features may contribute to the observed diffusion, including differences in dislocation density, stacking fault density, and extrinsic defect

Final Report January, 2016
23
populations. The presence of stacking faults (SF) and GBs are confirmed in the BF-TEM analysis of the polycrystalline 3C-SiC substrates (Fig. 2.3), while no such features are observed in the BF-TEM analysis of the single crystal 4H-SiC substrates (Fig. 2.4).
2.3.5 Comparison of Ag Diffusion Energetics with Literature
Table 2.4 shows a comparison of the pre-exponential term, Do, and activation energy, Q from ion implantation studies, computational studies, release from TRISO fuel and self-diffusion in of Si and C in polycrystalline 3C-SiC. Figure 2.13 graphically illustrates the magnitude of the reported diffusion coefficients.
Table 2.4 Do and Q values for Ag/SiC diffusion and Si and C tracer self-diffusion from ion implantation, computational simulations, and TRISO release.
Type Mechanism Do (m2/s) Q (eV) Note Ref. This work GB* 2.08×10⁻¹ 5.89±0.99 *Exact mechanism
unknown -
Implantation GB 4.30×10⁻¹² 2.50 [5]
Implantation Lattice D <1×10-21 Upper bound (1400ºC) [5]
Implantation GB 2.40×10⁻⁹ 3.43 [6]
Implantation --- D < 5×10-21 Upper bound (1500ºC) [27]
Simulation Lattice 6.30×10⁻⁸ 7.88 Fastest calc. mechanism [16]
Simulation GB 1.60×10⁻⁷ 3.95 (210) Σ3 tilt GB, fastest mechanism along [011]
[11]
Simulation GB - 3.35±0.25 (120) antiphase Σ5 tilt GB [28]
TRISO Release - D > 1×10-16 Lower Bound (1500ºC) [29]
TRISO Release - 6.76×10⁻⁹ 2.21 [30]
TRISO Release - 4.50×10⁻⁹ 2.26 [31]
TRISO Release - 9.60×10⁻⁶ 4.22 “Good SiC” [32]
TRISO Release - 4.50×10⁻⁵ 4.16 “Medium SiC” [32]
TRISO Release - 2.50×10⁻³ 4.24 “Poor SiC” [32]
TRISO Release - 3.60×10⁻⁹ 2.23 [33]
TRISO Release - 6.80×10⁻¹¹ 1.83 [34],[35]
TRISO Release - 3.50×10⁻¹⁰ 2.21 [36]
TRISO Release - 1.14×10⁻¹³ 1.13 [37]
Tracer Lattice 2.62±1.83×10⁴ 8.72±0.14 C Self-Diff. [14]
Tracer GB 4.44±2.03×10³ 5.84±0.09 C Self-Diff. [14]
Tracer Lattice 8.36±1.99×10³ 9.45±0.05 Si Self-Diff [15]
Final Report January, 2016
24
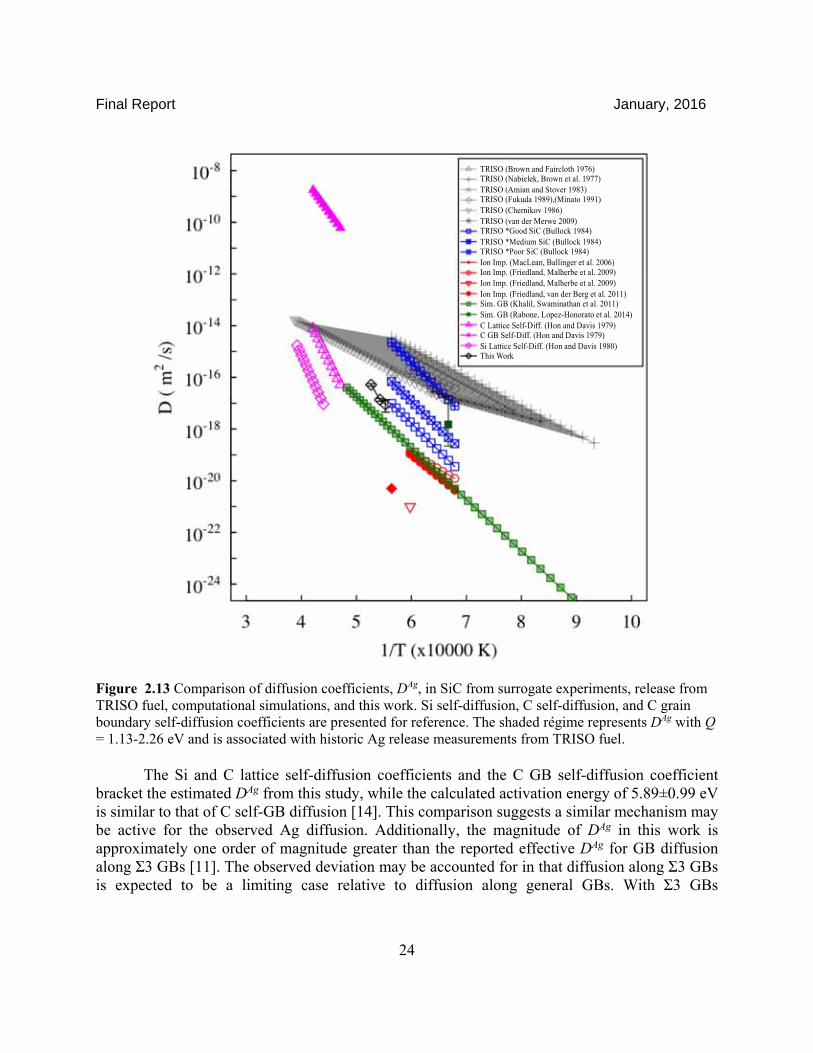
Figure 2.13 Comparison of diffusion coefficients, DAg, in SiC from surrogate experiments, release from TRISO fuel, computational simulations, and this work. Si self-diffusion, C self-diffusion, and C grain boundary self-diffusion coefficients are presented for reference. The shaded régime represents DAg with Q = 1.13-2.26 eV and is associated with historic Ag release measurements from TRISO fuel.
The Si and C lattice self-diffusion coefficients and the C GB self-diffusion coefficient bracket the estimated DAg from this study, while the calculated activation energy of 5.89±0.99 eV is similar to that of C self-GB diffusion [14]. This comparison suggests a similar mechanism may be active for the observed Ag diffusion. Additionally, the magnitude of DAg in this work is approximately one order of magnitude greater than the reported effective DAg for GB diffusion along Σ3 GBs [11]. The observed deviation may be accounted for in that diffusion along Σ3 GBs is expected to be a limiting case relative to diffusion along general GBs. With Σ3 GBs
TRISO (Brown and Faircloth 1976) TRISO (Nabielek, Brown et al. 1977) TRISO (Amian and Stover 1983) TRISO (Fukuda 1989),(Minato 1991) TRISO (Chernikov 1986) TRISO (van der Merwe 2009) TRISO *Good SiC (Bullock 1984) TRISO *Medium SiC (Bullock 1984) TRISO *Poor SiC (Bullock 1984) Ion Imp. (MacLean, Ballinger et al. 2006) Ion Imp. (Friedland, Malherbe et al. 2009) Ion Imp. (Friedland, Malherbe et al. 2009) Ion Imp. (Friedland, van der Berg et al. 2011) Sim. GB (Khalil, Swaminathan et al. 2011) Sim. GB (Rabone, Lopez-Honorato et al. 2014) C Lattice Self-Diff. (Hon and Davis 1979) C GB Self-Diff. (Hon and Davis 1979) Si Lattice Self-Diff. (Hon and Davis 1980) This Work

Final Report January, 2016
25
representing limiting GB diffusion pathways, contributions from additional GB types, namely high angle grain boundaries, could possibly lead to an increased effective DAg [38]. An increase in the effective DAg for GB dependent diffusion with the inclusion of additional GB types is supported by the findings of Rabone et al. [28] who report a DAg along Σ5 GBs approximately two to three orders of magnitude greater than the fastest mechanism along the Σ3 GB [11]. Because the DAg measured in this work is an average of all GB types present in the SiC layer, the inclusion of general GBs would be expected to increase the effective DAg over the calculated DAg for the Σ3 GB. These observations give additional validation to the measured Ag diffusion being dominated by GB diffusion.
The root of the deviation in Q between the experimental work reported here and GB diffusion simulation results reported in the literature is not explicitly known. The variation may be accounted for by the influence of microstructural defects (such as defect trapping, GB segregation, and GB character effects), implantation effects, and the contributions from multiple potential contributing diffusion mechanisms (dislocations, SFs, GBs). The cumulative influence of these effects is captured by the SIMS depth profiling technique employed in this study. Anisotropy effects may also contribute to the variation as the reported Q for Ag diffusion along the Σ3 GB is reported to vary as a function of direction along the GB plane, with Qeff. for the fastest mechanism along the [111] direction equal to 7.56 eV compared to 3.95 eV for the fastest mechanism along the [0-11] direction [11]. Additionally, in this work diffusion analysis at short thermal exposures may be influenced by the initial rapid irradiation enhanced diffusion from the annealing out of ion implantation induced defects as observed in the single crystal 4H-SiC conditions. This effect may lead to an overestimation of DAg as the depth profile may be dominated by the initial rapid enhanced diffusion at short time scales before thermal diffusion dominates and influencing the magnitude of Q. This effect would lead to a possible elevated calculation of Q in this study, as the 1625°C 1 hour exposure, was the only condition with a “short thermal exposure time”.
2.3.6 Comparison of Diffusion Energetics with TRISO Fuel Release
The reported activation energies, Q, for TRISO fuel release range from 1.13-2.26 eV, as presented in Table 2.4 (see table for citations). The work by Bullock [32] represents a deviation from the historical release data and reports a Q ranging from 4.16-4.24 eV with Do varying from 9.60×10⁻⁶ to 2.50×10⁻³ m2/s based on the perceived quality of the SiC layer. The variation in magnitude and energetics between these TRISO release studies and the surrogate systems, which includes this work, suggest the observed diffusion responsible for release in actual TRISO fuel is augmented relative to the Ag diffusion observed in surrogate systems. The magnitude of reported DAg in this work is approximately one to three orders of magnitude lower relative to the reported DAg from historic TRISO fuel release, and other surrogate studies report similar deviations in magnitude of measured DAg [5, 6, 11]. The difference in reported diffusion coefficients and energetics implies a significant variation between diffusion behavior of the observed diffusion in TRISO fuel and the observed diffusion studied in surrogate systems. A first order approximation

Final Report January, 2016
26
attributes the observed discrepancies to the inherently complex irradiation effects present TRISO fuel service.
In this work, enhanced Ag diffusion was observed in single crystal 4H-SiC under conditions expected to be interstitial rich, while the implantation enhanced diffusion was observed to be limited in regimes with excess vacancies and high interstitial sink densities. The variation in behavior is likely dependent on the nature of non-equilibrium point defects and defect sink density. The microstructure of neutron and self-ion irradiated SiC varies as a function of temperature and dose [39] and at elevated temperatures, ~1200ºC, the defect density decreases with a corresponding mean defect size increase [40]. This suggests a complex microstructure with varying defect sink densities and point defects populations exists over the life-time of the TRISO irradiation. STEM analysis of the SiC layer in irradiated TRISO fuel particles identified fission products segregated to nano-scale features in the interior of SiC grains [41], suggesting diffusion of fission products into the SiC grain interior. A comprehensive understanding of the residual point defects and irradiated SiC microstructure is not fully presented for the irradiated TRISO SiC in Ag release studies. However, this study indicates that parallels may exist between the observed implantation enhanced Ag diffusion and Ag diffusion measured from TRISO fuel release. This implies the potential for enhanced lattice diffusion to contribute to Ag release under irradiation conditions where excess non-equilibrium point defects are present and able to contribute to diffusion.
The suggested GB diffusion in polycrystalline 3C-SiC presents an alternative or co-operative mechanism to describe the deviation between TRISO release and surrogate systems. The comparison of single crystal 4H-SiC and polycrystalline 3C-SiC implantation samples confirms Ag segregates to GBs and because point defects are stable in GBs the same opportunity for irradiation enhanced diffusion exists. Recent STEM/EDS studies of the SiC layer of TRISO fuel from the AGR-1 irradiation campaign has identified Ag and other select fission products segregating to GBs and triple points [42]. This suggests SiC grain boundaries play a role in accommodating Ag and may serve as diffusion pathways. Additionally, modification of the local GB structure through the nucleation of cavities at GBs has been observed for Si self-ion irradiations [40]. Similar modification of the GB structure in the SiC layer of TRISO fuel may influence the effective diffusion length scale for Ag release. These effects may result in the observed higher DAg for TRISO release relative to surrogate experiments.
2.4 Summary of Observations
The use of SIMS for depth profiling of Ag/SiC ion implantation diffusion couples provided an increased dynamic range allowing for the identification of multiple diffusion régimes not previously observed. This aspect was critically important when considering the physical constraints on the Ag/SiC system such as solubility limits of Ag in SiC. Ag diffusion was observed to be active via enhanced diffusion of implantation-induced defects in the single crystal 4H-SiC single crystal substrates under perceived interstitial rich conditions, while thermal diffusion past the primary implantation peak was measured in the polycrystalline 3C-SiC substrates. The comparison of single crystal 4H-SiC and polycrystalline 3C-SiC diffusion
Final Report January, 2016
27
couples confirmed that GBs act as Ag impurity sinks and suggests that GB diffusion contributed to the observed diffusion in the polycrystalline 3C-SiC substrate. The magnitude and energetics of the suggested GB diffusion implies impurity diffusion in annealed, ion-implanted polycrystalline 3C-SiC does not account for the measured Ag release from TRISO fuel as determined from Ag release experiments. This observation, coupled with the measured implantation-enhanced diffusion in single crystal 4H-SiC, suggests that irradiation effects likely contribute in some capacity to the Ag release. The observations in this work also provided additional confirmation of active Ag diffusion in polycrystalline 3C-SiC and presented new insights on enhanced Ag diffusion in single crystal 4H-SiC suggesting irradiation enhanced lattice diffusion may also contribute to Ag release in the TRISO fuel system. 3 Diffusion Studies in Irradiated SiC
3.1 Overview of Ag Diffusion in Irradiated SiC While diffusion coefficients measured in laboratory diffusion couple experiments [6, 43, 44]
are in a very good agreement with values predicted by computer simulations [16, 45-47], these diffusion coefficients are orders of magnitude lower than those observed in actual fuel release experiments [32, 37, 48, 49]. The reason(s) for these discrepancies is not explicitly known, but one important difference between the in-pile and out-of-pile experiments is the presence of radiation in the former measurements. The effect of radiation damage on Ag release has been hypothesized in previous studies [6, 49-52], yet the magnitude of the enhancement and the mechanism remain largely unknown.
As discussed in section 2.3.1 and 2.3.2, evidence shows that radiation defects induced by Ag implantation caused enhanced Ag diffusion in single crystal 4H-SiC. However, the main purpose of implantation in diffusion couple experiments described earlier was to introduce Ag into SiC and therefore the radiation damage produced was short-ranged and not intentionally controlled. Furthermore, the implantation temperatures in those studies (room temperature to 600°C) are also different from the operating temperatures of TRISO particles (800°C to 1400°C [53]), which may result in different types of radiation-induced defects between the two temperature ranges. Connell et al. [51] investigated transport of Ag-Pd mixture in well-controlled neutron irradiated 3C-SiC and showed that Ag-Pd transport was significantly enhanced in the high temperature and high dose irradiated samples. However, it remains unclear whether these conclusions are valid for Ag diffusion in the absence of Pd.
In this section, two approaches are introduced to better understand the radiation effects on Ag diffusion in SiC. The first one is well controlled diffusion couple experiment with pre-irradiated SiC to quantitatively investigate the effects of carbon ion irradiation. The second approach is a STEM post irradiation examination of neutron irradiated TRISO fuel particle to unveil the most possible release mechanism.

Final Report January, 2016
28
3.2 Effect of Carbon Ion Irradiation on Ag/SiC Diffusion Couple Experiment
3.2.1 Materials and Method The same polycrystalline CVD 3C-SiC and single crystal 4H-SiC as described in section
2.1.1 were used in this study. Before carbon ion irradiation, samples were polished to an arithmetic surface roughness (Ra) of less than 10 nm using successively finer diamond polishing media culminating in a final polishing step with 0.05 µm colloidal silica. We prepared three 3C-SiC and three 4H-SiC bulk samples. For each type of material, two samples were subjected to carbon ion irradiation to introduce radiation damage, and the third unirradiated bulk sample was used as a reference (control) system. Carbon ion irradiation was conducted at the University of Wisconsin-Madison Ion Beam Laboratory (UW-IBL). Samples were irradiated at 950°C with 3.15MeV C2+ beam using a tandem accelerator equipped with Source of Negative Ions via Cesium Sputtering (SNICS). The irradiation current was ~2.5µA and the total fluence was 1.1×10¹⁷ ions/cm-2. Following this, both C2+ irradiated and unirradiated 3C-SiC samples were simultaneously implanted with 400keV Ag+ at 300°C to a dose of 5×10¹⁴ ions/cm-2 at the Michigan Ion Beam Laboratory (MIBL). Similarly, the irradiated and unirradiated 4H-SiC samples were simultaneously implanted with 400keV Ag2+ at the same temperature and dose at the INNOViON Corporation. Following Ag implantation, a ~220 nm thick diamond-like-carbon (DLC) films were deposited on the surface of the samples for surface protection during subsequent high temperature exposures. The DLC films were deposited using the plasma immersion ion implantation and deposition (PIIID) process [54] at the University of Wisconsin, Madison. Deposition was performed using the acetylene plasma generated by the glow discharge method at a pressure of 12 mTorr, and at near-room temperature.
After Ag implantation, individual samples (each approximately 8 mm × 8 mm in size), were cut from the bulk control and carbon ion irradiated samples for thermal exposures at various temperatures and times, as listed in Table 3.1. Detailed procedures of thermal exposure are described in Section 2.1.2. Here, the irradiated and unirradiated samples were sealed in the same quartz tube during thermal exposure to ensure that they have the same temperature history. After thermal exposure, samples were investigated by SIMS to understand the change in Ag concentration profile as a function of depth. Details for SIMS analysis are described in Section 2.2.1.

Final Report January, 2016
29
Table 3.1 Thermal exposure conditions for various diffusion couples.
Temperature 1400 oC 1500oC 1535oC 1569oC
Time
C2+ irradiated 3C-SiC
- 10 hours 10 hours
5,10,20 hours
Unirradiated 3C-SiC
- 10 hours 10 hours 10 hours
C2+ irradiated 4H-SiC
10 hours 10 hours - 1,10 hours
Unirradiated 4H-SiC
10 hours 10 hours - 10 hours
3.2.2 Radiation/Implantation Damage Figure 3.1 shows the distribution of radiation damage in an irradiated 3C-SiC sample after
1569°C thermal exposure. STEM analysis was performed using a 300kV Technai TF-30 at the University of Wisconsin-Madison Materials Science Center. STEM samples were prepared by traditional focused ion beam (FIB) lift-out techniques using a Zeiss Augria FIB/SEM. FIB lift-out technique provided cross-sectional TEM samples of the SiC structure along the implantation and diffusion directions. SRIM code [55] was used to calculate the damage profile. In these calculations we assumed SiC density of 3.21 g/cm3 and threshold displacement energies of 35 and 20 eV for Si and C, respectively. The calculated SRIM profile is overlaid with STEM image in Figure 3.1.
The visible radiation damage extends to the distance of approximately 2750 nm from the implantation surface. This damage consists of both black spot defects (BSD) and dislocation loops, an observation that is consistent with other reports [56]. The amount of damage increases with implantation depth and has an approximately 250 nm wide highly damaged band at the end-of-range. The difference between damage range predicted by SRIM (2550 nm) and the one measured experimentally (STEM visible damage range, approximately 2750 nm) is approximately 7.8%, indicating that the SRIM prediction is applicable in this study. Selected Area Electron Diffraction (not shown here) carried out on as-irradiated samples and on irradiated and Ag-implanted samples showed no evidence of amorphization within the entire irradiation/implantation range.

Final Report January, 2016
30
Figure 3.1 STEM image showing the range of radiation induced damage in a C2+ irradiated polycrystalline 3C-SiC followed by Ag implantation and thermal exposure at 1569oC for 20hours, overlaid with damage profile calculated using SRIM software.
3.2.3 SIMS Profiles Figure 3.2 shows Ag concentration profiles for unirradiated 3C-SiC samples exposed for
10 hours to a constant temperature (different for each sample) in the range 1500-1569°C. The Ag concentration in all exposed samples is observed to penetrate into the bulk SiC past the AI peak, indicating thermal diffusion of Ag into SiC. This penetration depth for unirradiated 3C-SiC samples was determined to be approximately 0.41 µm at 1500°C, and 0.64 µm at 1535°C and 1569°C.
Figure 3.3 shows the Ag depth profiles for irradiated polycrystalline 3C-SiC samples exposed to temperatures 1500-1569°C for 10 hours. Similar to unirradiated samples, Ag penetration “tail” is also observed in the samples that were first irradiated and then annealed. The Ag penetration depth determined for irradiated samples is approximately 2.08 µm for 1500°C and 1535°C, and 1.86 µm for 1569°C. These depths are significantly higher than those observed in an unirradiated sample. This result provides evidence that carbon ion irradiation enhances the diffusion of Ag in 3C-SiC. As is discussed in Sections 2.2.3 and 2.3.4, for Ag implanted polycrystalline 3C-SiC at 1569°C from 5-20 hours, the Ag penetration depth increased with exposure time and this effect was suggested to be due to GB diffusion mechanism. The

Final Report January, 2016
31
penetration depths calculated from unirradiated 3C-SiC thermal exposed at 1569°C for 5, 10 and 20 hours are 0.47, 1.07 and 1.58µm, respectively (Fig. 2.11). These depths are higher in the case of the irradiated 3C-SiC. Specifically, as shown in Figure 3.4, the Ag penetration depths in irradiated samples exposed at 1569°C for 5, 10 and 20 hours are approximately 1.36µm, 1.86µm and 1.92µm, respectively. It can be seen that the diffusion depth still shows time dependence, although the diffusion rate seems to slow down after 10 hours. This result indicates that a more complicated radiation enhanced diffusion mechanism is active in carbon irradiated polycrystalline SiC.
Figure 3.2 SIMS Ag profiles of as-implanted and isochronally annealed unirradiated polycrystalline 3C-SiC.

Final Report January, 2016
32
Figure 3.3 SIMS Ag profiles of irradiated polycrystalline 3C-SiC, showing data for as-implanted and isochronally annealed samples.
Figure 3.4 SIMS Ag profiles for irradiated polycrystalline 3C-SiC. Data is shown for as-implanted sample as well as for sample isochronally annealed at 1569°C for 5, 10, and 20 hours.
The SIMS profiles determined in this study for unirradiated single crystal 4H-SiC samples are shown in Figure 3.5. These profiles also lack Ag penetration “tail” and show a bi-modal distribution, which is consistent with the SIMS profile of 4H-SiC in Section 2.2.3. While AI 4H-SiC substrate has a singular Ag concentration peak in the diffusion profile at ~140 nm, all thermal exposed samples show a bi-modal Ag distribution with the primary peak remaining at

Final Report January, 2016
33
~140 nm and a secondary peak at ~500 nm (see inset in Figure 3.5). Interestingly, the secondary peak becomes more pronounced as the exposure temperature increases. This may indicate a weak defect annihilation at lower temperature (1400°C), which is driven by interstitial diffusion of Ag [44]. Within the implantation induced damage range, Ag mobility was enhanced by radiation damage, which led to the observed redistribution of Ag.
Figure 3.5 SIMS Ag profiles of as-implanted and isochronally annealed unirradiated single crystal 4H-SiC.
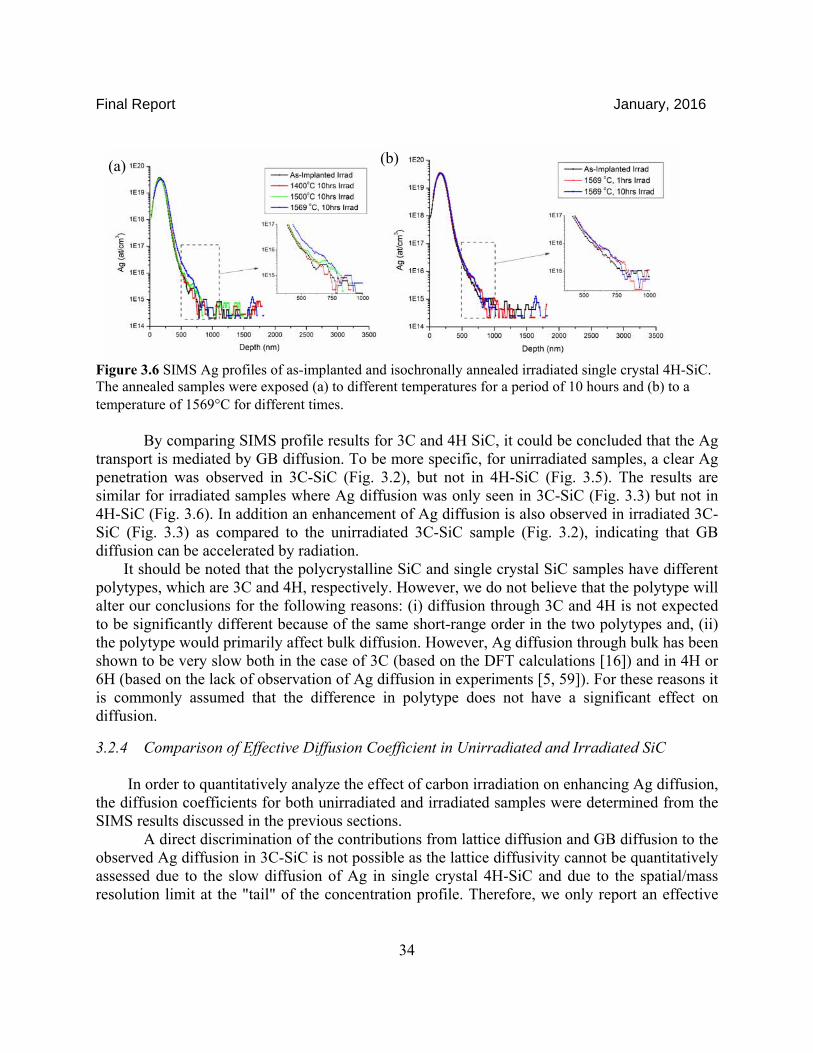
The SIMS profiles of irradiated single crystalline 4H-SiC are shown in Fig. 3.6. Figure 3.6 (a) shows the Ag depth profiles for carbon irradiated samples exposed to temperatures 1500 and 1569°C for 10 hours and Fig. 3.6 (b) shows Ag concentration profile for irradiated samples that were exposed at 1569°C for 1 and 10 hours. In all of our single-crystal 4H-SiC data we found no significant diffusion of Ag. Since radiation did not enhance Ag diffusion in 4H-SiC (in contrast to a significant radiation effect observed for 3C-SiC), one can conclude that the Ag transport in 3C-SiC is mediated by GB diffusion and this type of diffusion can be accelerated by radiation. For the C2+ irradiated single crystal 4H-SiC, a single peak is seen for all samples. Assuming that the bi-modal profile in thermally exposed unirradiated samples was due to the annealing of implantation induced defects in a confined region, it is plausible that the C2+ irradiation followed by Ag implantation introduced trapping sites at an effective enough density so as to immobilize the implanted Ag. A similar behavior of suppressed diffusion of boron near the damage region was reported in boron ion implanted Si [57] and SiC [58]. Further microstructural analysis will be needed to confirm the hypothesized origin of the bi-modal distribution.
Final Report January, 2016
34
Figure 3.6 SIMS Ag profiles of as-implanted and isochronally annealed irradiated single crystal 4H-SiC. The annealed samples were exposed (a) to different temperatures for a period of 10 hours and (b) to a temperature of 1569°C for different times. By comparing SIMS profile results for 3C and 4H SiC, it could be concluded that the Ag transport is mediated by GB diffusion. To be more specific, for unirradiated samples, a clear Ag penetration was observed in 3C-SiC (Fig. 3.2), but not in 4H-SiC (Fig. 3.5). The results are similar for irradiated samples where Ag diffusion was only seen in 3C-SiC (Fig. 3.3) but not in 4H-SiC (Fig. 3.6). In addition an enhancement of Ag diffusion is also observed in irradiated 3C-SiC (Fig. 3.3) as compared to the unirradiated 3C-SiC sample (Fig. 3.2), indicating that GB diffusion can be accelerated by radiation.
It should be noted that the polycrystalline SiC and single crystal SiC samples have different polytypes, which are 3C and 4H, respectively. However, we do not believe that the polytype will alter our conclusions for the following reasons: (i) diffusion through 3C and 4H is not expected to be significantly different because of the same short-range order in the two polytypes and, (ii) the polytype would primarily affect bulk diffusion. However, Ag diffusion through bulk has been shown to be very slow both in the case of 3C (based on the DFT calculations [16]) and in 4H or 6H (based on the lack of observation of Ag diffusion in experiments [5, 59]). For these reasons it is commonly assumed that the difference in polytype does not have a significant effect on diffusion.
3.2.4 Comparison of Effective Diffusion Coefficient in Unirradiated and Irradiated SiC
In order to quantitatively analyze the effect of carbon irradiation on enhancing Ag diffusion, the diffusion coefficients for both unirradiated and irradiated samples were determined from the SIMS results discussed in the previous sections. A direct discrimination of the contributions from lattice diffusion and GB diffusion to the observed Ag diffusion in 3C-SiC is not possible as the lattice diffusivity cannot be quantitatively assessed due to the slow diffusion of Ag in single crystal 4H-SiC and due to the spatial/mass resolution limit at the "tail" of the concentration profile. Therefore, we only report an effective
(a) (b)

Final Report January, 2016
35
diffusion coefficient D, which is a combination of GB diffusion Dgb and lattice diffusion Dl coefficients.
As described in Section 2.3.3, for ion implantation diffusion experiments, the main implantation peak serves as a constant source approximation when the peak concentration is greater than the solubility limit, S(T), of the system. An effective diffusion coefficient D of a Fickian type diffusion can be determined by the following equation
Equation 3.1 ( , ) = √
where Co is the concentration at which the impurity diffuses into the bulk and it is usually equal to the solubility of the impurity. do is the depth at which the impurity concentration equals to Co, d is the depth where the concentration is measured and t is time in seconds [60]. This equation assumes a constant concentration (C0) at the source during the time of the experiment. In these experiments, the peak Ag concentration is ~3×10¹⁹ and the solubility (the highest Ag concentration in the Ag “tail”) is less than 1×10¹⁷, which suggests that the implanted Ag is more than enough to pin the concentration at its solubility limit for the duration of the experiment, justifying the use of Equation 3.1. By subtracting the AI Ag profile from the thermal exposed Ag profile, we can obtain Ag diffusion profiles (symbols in Fig. 3.7) for different exposure conditions. In this study, our aim is to compare the diffusion of Ag in pristine SiC and in carbon irradiated SiC. Therefore, do is chosen as 500 nm to avoid the region damaged by Ag implantation as identified in Ref. [44] for the same implantation conditions. If the experimental data follows the trend described by Equation 3.1, a plot of erfc-1(C/Co) vs. (d- do) will yield a straight line with the slope equal to (4Dt)-1. An example of such plot for 3C-SiC samples irradiated and heat treated at 1569°C for 10 hrs is shown in Fig. 3.8. We first fit a linear function based on all the points from depth 575 to 2675 nm (for unirradiated samples from 575 to 1725 nm) and then adjust Co until the intercept of the linear fit equals to zero. The slope obtained from the linear fit is finally used to calculate D.

Final Report January, 2016
36
Figure 3.7 Measured Ag diffusion profiles (symbols) and fitted diffusion profiles (lines) for polycrystalline 3C-SiC. Reference profiles for as-implanted samples were subtracted from the profiles shown in the figure.
Figure 3.8 Linear fit of erfc-1(C/C0) to determine diffusion coefficient of 1569oC/10hrs exposed irradiated 3C-SiC.
By plugging in the calculated D values into Equation 3.1, we can plot the fitted Ag
concentration profile, C(d,t), for each sample (see colored lines in Fig. 3.7). The fitted C(d,t) profiles align well with the experimental SIMS data for unirradiated samples, whereas in irradiated samples they align well until ~2750 nm, which is the termination point of visible

Final Report January, 2016
37
radiation damage as identified by TEM. Beyond the end of radiation damage, the fitted C(d,t) profiles have a higher Ag concentration than the SIMS measured data points, consistently with the hypothesis that radiation damage is the underlying reason for enhanced Ag diffusion.
The calculated Co and D values for different exposure conditions in unirradiated and irradiated 3C-SiC samples are summarized in Table 3.1, where the reported error is derived from the standard deviation of the slope of the linear fit. From Table 3.1 we can see that the effective diffusion coefficients in irradiated samples are 12.3, 5.3 and 4.1 times higher than that in unirradiated samples at 1500, 1535 and 1569°C, respectively, demonstrating that carbon ion irradiation can appreciably enhance Ag diffusion in polycrystalline SiC. Although still lower than most reported D values from TRISO integral release experiments, (1.5-35.9)×10-16m2/s at 1500 oC [48, 49, 61, 62], D value of irradiated sample at 1500oC is similar to the D value of 7.1×10⁻¹⁷m2/s reported by Bullock [32] for “medium SiC” from a TRISO post-irradiation annealing experiment. Considering that the SiC layer in a real TRISO fuel is subjected to more severe neutron radiation than this ion irradiation study, the radiation enhanced diffusion coefficient is expected be higher than the values reported here, and radiation could be responsible for the observed increased Ag release from TRISO particles.
The magnitude of the diffusion coefficient, D, in unirradiated 3C-SiC increases with thermal exposure temperature (see Figure 3-9), and it can be fitted to an Arrhenius relationship
Equation 3.2 =
where Do (m2/s) is a pre-exponential term which describes the physical nature of the diffusion mechanism, k is the Boltzmann’s constant (eV/T), T is temperature (K) and Q is the activation energy (eV). The fitted Q and Do values of unirradiated 3C-SiC are 1.84±0.40 eV and (1.04±0.10)×10-12m2/s, respectively. One should treat these values only as approximate estimates because the experiments were carried out over a relatively narrow range of annealing temperatures and only one sample was investigated at each temperature. Table 3.2 Co and D values for unirradiated and irradiated Ag/3C-SiC diffusion couples.
1500°C 10hrs 1535°C 10hrs 1569°C 10hrs 1569°C 5hrs 1569°C 20hrs
Co(at/cm3) Unirradiated 2.56×10¹⁶ 3.61×10¹⁶ 2.56×10¹⁶ - -
Irradiated 4.92×10¹⁶ 6.71×10¹⁶ 4.68×10¹⁶ 5.70×10¹⁶ 7.81×10¹⁶
D(m2/s) Unirradiated 5.93±0.31×10⁻¹⁸ 7.99±0.74×10⁻¹⁸ 8.84±1.19×10⁻¹⁸ - -
Irradiated 7.32±0.74×10⁻¹⁷ 4.21±0.30×10⁻¹⁷ 3.60±0.21×10⁻¹⁷ 3.53±0.16×10⁻¹⁷ 1.80±0.11×10⁻¹⁷
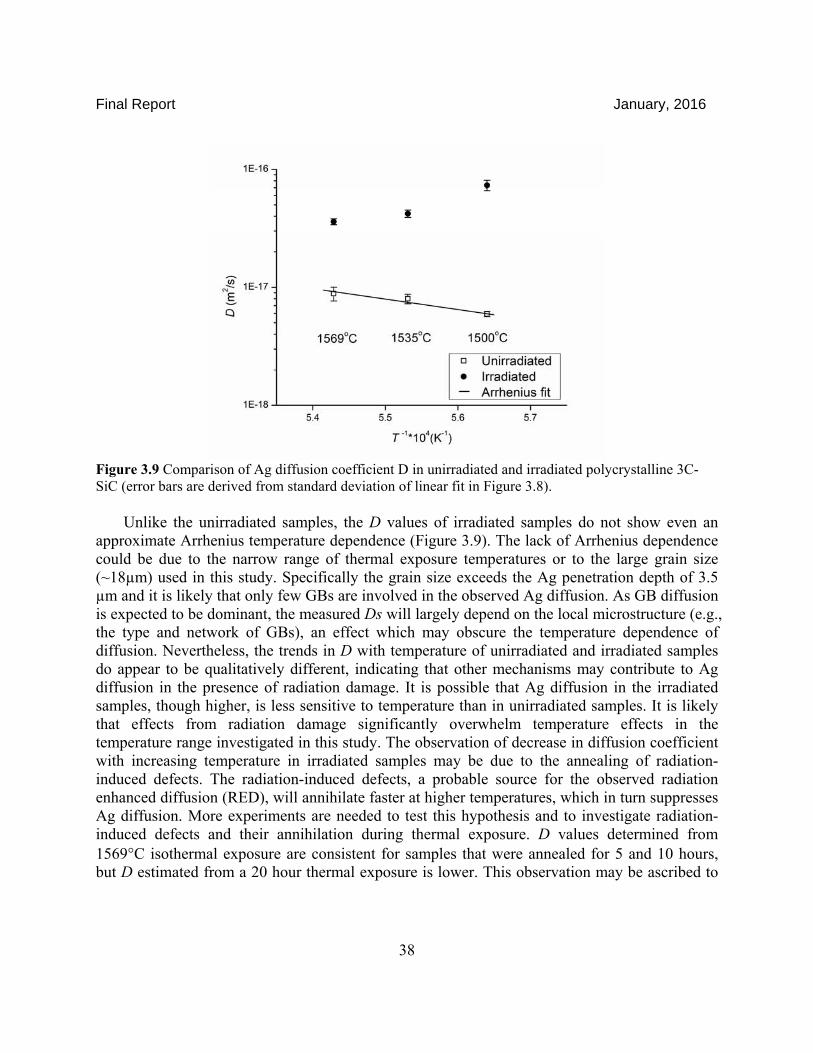
Final Report January, 2016
38
Figure 3.9 Comparison of Ag diffusion coefficient D in unirradiated and irradiated polycrystalline 3C-SiC (error bars are derived from standard deviation of linear fit in Figure 3.8).
Unlike the unirradiated samples, the D values of irradiated samples do not show even an
approximate Arrhenius temperature dependence (Figure 3.9). The lack of Arrhenius dependence could be due to the narrow range of thermal exposure temperatures or to the large grain size (~18µm) used in this study. Specifically the grain size exceeds the Ag penetration depth of 3.5 µm and it is likely that only few GBs are involved in the observed Ag diffusion. As GB diffusion is expected to be dominant, the measured Ds will largely depend on the local microstructure (e.g., the type and network of GBs), an effect which may obscure the temperature dependence of diffusion. Nevertheless, the trends in D with temperature of unirradiated and irradiated samples do appear to be qualitatively different, indicating that other mechanisms may contribute to Ag diffusion in the presence of radiation damage. It is possible that Ag diffusion in the irradiated samples, though higher, is less sensitive to temperature than in unirradiated samples. It is likely that effects from radiation damage significantly overwhelm temperature effects in the temperature range investigated in this study. The observation of decrease in diffusion coefficient with increasing temperature in irradiated samples may be due to the annealing of radiation-induced defects. The radiation-induced defects, a probable source for the observed radiation enhanced diffusion (RED), will annihilate faster at higher temperatures, which in turn suppresses Ag diffusion. More experiments are needed to test this hypothesis and to investigate radiation-induced defects and their annihilation during thermal exposure. D values determined from 1569°C isothermal exposure are consistent for samples that were annealed for 5 and 10 hours, but D estimated from a 20 hour thermal exposure is lower. This observation may be ascribed to

Final Report January, 2016
39
greater annealing of radiation damage with exposure time. However, caution is needed with this interpretation since the measurement error for these results is not explicitly known.
The Co values in both unirradiated and irradiated samples do not show a clear temperature dependence. This is likely due to the narrow range of temperatures investigated in our experiments. This observation is consistent with lack of temperature dependence found for penetration depth discussed in Section 3.2.3. However, it is clear that the Co values in irradiated samples are about two times larger than in unirradiated samples. Therefore, the irradiated 3C-SiC is able to accommodate more Ag than its unirradiated counterpart.
It is interesting to compare the value of C0 to the total number of SiC atoms in the GBs to assess the GB solubility of Ag. Using a lattice parameter of 4.36Å one can estimate the total concentration of atoms in SiC to be about 9.7×10²²
bulk-atoms/cm3. Assuming the GBs are about 0.5 nm thick and approximately 18 µm grain size, yields an estimated density of GB atoms in SiC of 2.7×1018 GB-atoms/cm3. Taking the ratio of C0 ~ 3×10¹⁶ Ag-atoms/cm3 to this GB atom density suggests a density of Ag in the GB of about 1.1×10⁻² atom fraction (Ag as a fraction of total number of Si and C atoms) for unirradiated conditions, and about twice this value for irradiated material. Thus our results suggest the GB solubility for Ag is about 1-2% atomic fraction.
3.2.5 GB Diffusion and Lattice Diffusion in Irradiated SiC
In polycrystalline materials, diffusion is a complicated phenomenon that involves several fundamental processes, such as direct lattice diffusion from the surface, diffusion along the GBs, partial leakage from the GBs to the lattice, and the subsequent lattice diffusion near the GBs [63]. Depending on the relative contributions of such processes, one can observe essentially different regimes of kinetics. Harrison has classified the diffusion kinetics in polycrystalline materials into three regimes identified as Types A, B and C [64]. Here, we apply different kinetic regimes to our experimental results to provide insights into the underlying mechanisms. In the calculations below we will use data obtained for samples 1569oC 10 hours exposed sample as an example, but other samples show qualitatively similar results.
Type A regime is observed when the lattice diffusion length, (Dlt)1/2, is greater than the average grain diameter, dgb. Usually Dl<D<Dgb, thus in this study (Dl t)1/2<(Dt)1/2 = 1.14 µm, smaller than the average grain diameter of 18 µm. Therefore Type A regime is not applicable to this study. Type C is applicable when the diffusion takes place only along the GBs, without any substantial leakage to the lattice. It occurs when (Dlt)1/2<0.2sδ, where s is the GB segregation factor and δ is the effective GB width. By applying our data and using δ = 0.5 nm, we can deduce that Type C can be applicable if s >1.11×10³. The segregation factor in irradiated SiC is not explicitly known, but atomistic simulations from Ref. [45] showed that segregation factor of Σ3 GB in unirradiated SiC at 1200oC is 3.1×10⁸. Unless carbon irradiation greatly reduces this value, Type C kinetics may be applicable for irradiated samples in this study. If Type C applies, the effect of lattice diffusion is negligible and Dgb = D. In this case, the significant difference in

Final Report January, 2016
40
the diffusion coefficient between unirradiated and irradiated samples is solely ascribed to the enhanced GB diffusion caused by carbon irradiation. However, if the carbon irradiation greatly changes s value so that Type C is no longer applicable, both lattice diffusion and GB diffusion need to be taken into account and one needs to consider Type B diffusion.
Type B regime is applicable when the following conditions are satisfied
Equation 3.3 = ( ) / > 10
Equation 3.4 = ( ) / < 0.1
Under these conditions, Dgb can be calculated, using known values of Dl and s and the following equation [65]
Equation 3.5 = . ( ) / [− ( ) / ] /
In Figure 3.10 we plot lnC vs (d-do)6/5 for an irradiated sample. By obtaining the slope
from a linear fit, the relation between Dl, Dgb, and, s can be defined using Equation 3.5. Then applying Equations 3.3 and 3.4 we find that 1.74×10⁻²² (m2/s) < Dl <3.41×10⁻¹⁸ (m2/s), 1< s <140, and 3.41×10⁻¹⁶ (m2/s) < Dgb <4.78×10⁻¹⁴ (m2/s). From these calculations we conclude that Type B kinetics is applicable when segregation factor in the irradiated samples is lower than 140. Although Dl and Dgb cannot be determined exactly, these calculations would suggest that both GB diffusion and lattice diffusion coefficients are greatly enhanced as compared to the unirradiated samples if Type B kinetics were accurate, for which Dl ≈ 10-29 (m2/s) [16] and Dgb ≈ 10-18 (m2/s) at 1569oC.
From the lattice diffusion coefficient extracted by assuming Type B diffusion, the one-dimension diffusional distance (xl) can be estimated by xl = (Dlt)1/2. For 1569oC 10 hours exposed 4H-SiC sample, we can estimate 2.5 nm < xl < 349.9 nm. As can be seen in Fig. 3.10, hundreds of nanometer penetration of Ag is not observed in these single crystal samples. This result suggests that either Ag atoms are trapped in the implantation damage region, or Dl lies near the lower bound of the 1.74×10⁻²² (m2/s) <Dl< 3.41×10⁻¹⁸ (m2/s) regime. In the latter case, the Dl will lead to few (or tens of) nanometers of penetration and such penetration cannot be discerned experimentally.
While both type B and C kinetics are applicable, our result clearly suggests that the ion irradiation enhances Ag diffusion in either case.

Final Report January, 2016
41
Figure 3.10 A plot of logarithm of concentration lnC vs. (d-do)6/5 for 1569oC/10hrs exposed irradiated 3C-SiC. Diffusion coefficient can be determined by fitting the data to Type B kinetics (Equation 3.5)
3.3 Analysis of Neutron-Irradiated TRISO Fuel Particles
Research described in this section was carried out in collaboration with Dr. Isabella Van Rooyen from Idaho National Laboratories. Dr. Van Rooyen co-wrote the text presented in this section. The experiments were supported by a rapid turn-around proposal (RTE 13-412). The results of this work have been submitted for publication (“STEM EDS Analysis of Fission Products in Neutron Irradiated TRISO Fuel Particles from AGR-1 Experiment”, B. Leng, I. van Rooyen, Y. Q. Wu, I. Szlufarska, K. Sridharan, Submitted).
3.3.1 Materials and Method The TRISO fuel particle examined in this study was CP35 from Compact 6-3-2 from the
AGR-1 experiment, which had an estimated Ag retention of 80%. Details of this fuel particle and the rationale for its selection for this study are described elsewhere [41]. Two STEM lamellae (identified as 6a and 6b) were prepared by a focused ion beam near the IPyC-SiC interlayer as shown in Fig. 3.11. The purpose of using two lamellae was to provide larger areas for investigation and no specific microstructural differences were expected in these two lamellae.
The fission products (FPs) produced during irradiation consist of relatively heavy elements compared with coating material layers used in TRISO fuel particles. Therefore, the High Angle Annular Dark Field (HAADF) detector in STEM, of which contrast in the image is sensitive to

Final Report January, 2016
42
atomic number differences (so-called Z-contrast imaging), was chosen to reveal the distribution of FPs. The compositional analysis of these fine FP precipitates was performed by standardless EDS analysis in STEM mode.
The STEM-EDS analyses were conducted with an FEI Tecnai G2 F30 STEM at the Microscopy and Characterization Suite, Center for Advanced Energy Studies, in Idaho Falls where low-activity irradiated materials can be examined. Pd, U, and Ag were identified using Pd Kα1 peak (21.175 keV), U Lγ1 peak (20.163 keV), and Ag Kα1 peak (22.162 keV), respectively, to avoid uncertainties associated with peak overlaps. An EDS line scan was used for the qualitative identification of FP using an acquisition time of 10–40 secs/point. Transmission Electron Microscopy images and analysis software were used for quantitative EDS analysis, and furthermore longer 480 secs/point area analysis was used for quantitative measurements to increase the signal-to-noise ratio.
Fig. 3.11 Images showing: (a) positions in a post-irradiated TRISO fuel particles from where STEM lamellae were fabricated, (b) position investigated in lamella 6b (Position 1:SiC layer) and (c) position investigated in lamella 6a (Positions 1: SiC layer).
3.3.2 STEM Analysis of Distribution of Ag and Other FP
Using HAADF imaging and combined EDS measurements, various FP precipitates were identified, and categorized based on their size, shape, and location in the microstructure. Micron-sized Precipitates (≥100 nm)
As shown in Fig. 3.11, micron-sized precipitates with irregular shape were mainly located at IPyC-SiC interlayer, but some of these precipitates were also observed inside the SiC and IPyC layers. The size of these precipitates varied from approximately 100 nm up to 2μm, and the precipitates in SiC and IPyC layers were smaller than those in IPyC-SiC interlayer (Fig. 3.11). Additionally, micron-sized precipitates in the SiC layer and the IPyC-SiC interlayer had sharp protrusions connecting them to SiC grain boundaries which indicates that their formation
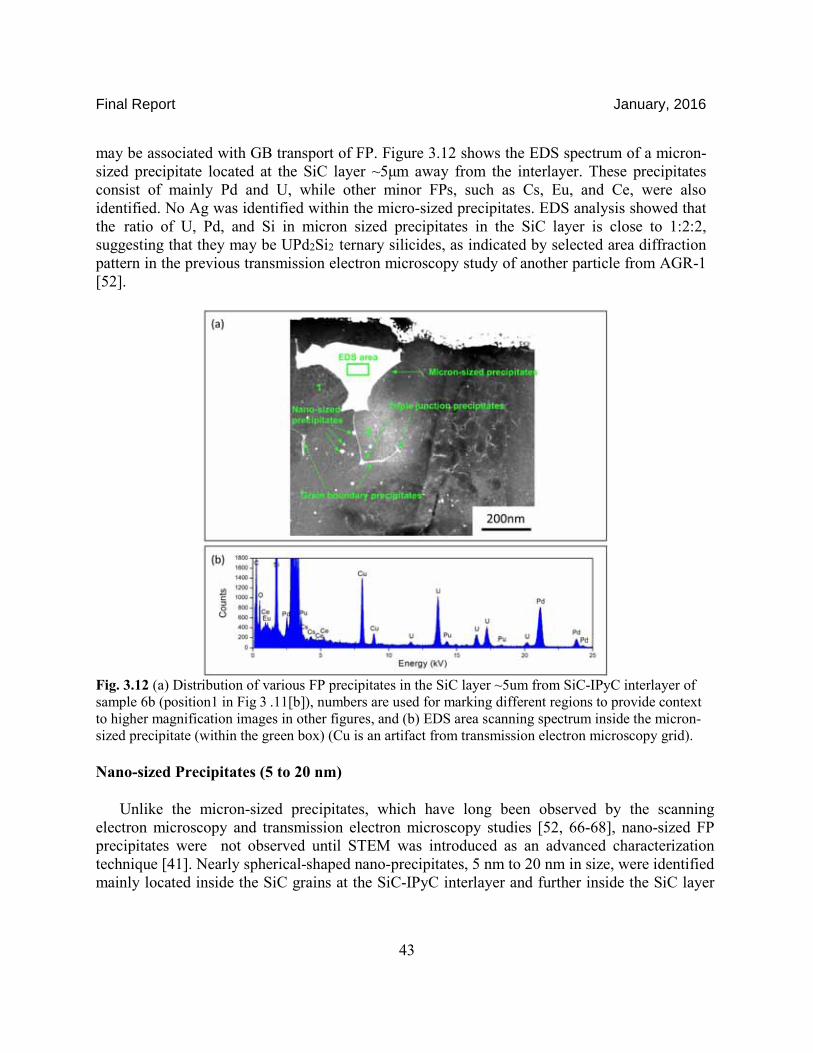
Final Report January, 2016
43
may be associated with GB transport of FP. Figure 3.12 shows the EDS spectrum of a micron-sized precipitate located at the SiC layer ~5μm away from the interlayer. These precipitates consist of mainly Pd and U, while other minor FPs, such as Cs, Eu, and Ce, were also identified. No Ag was identified within the micro-sized precipitates. EDS analysis showed that the ratio of U, Pd, and Si in micron sized precipitates in the SiC layer is close to 1:2:2, suggesting that they may be UPd2Si2 ternary silicides, as indicated by selected area diffraction pattern in the previous transmission electron microscopy study of another particle from AGR-1 [52].
Fig. 3.12 (a) Distribution of various FP precipitates in the SiC layer ~5um from SiC-IPyC interlayer of sample 6b (position1 in Fig 3 .11[b]), numbers are used for marking different regions to provide context to higher magnification images in other figures, and (b) EDS area scanning spectrum inside the micron-sized precipitate (within the green box) (Cu is an artifact from transmission electron microscopy grid). Nano-sized Precipitates (5 to 20 nm)
Unlike the micron-sized precipitates, which have long been observed by the scanning electron microscopy and transmission electron microscopy studies [52, 66-68], nano-sized FP precipitates were not observed until STEM was introduced as an advanced characterization technique [41]. Nearly spherical-shaped nano-precipitates, 5 nm to 20 nm in size, were identified mainly located inside the SiC grains at the SiC-IPyC interlayer and further inside the SiC layer

Final Report January, 2016
44
(Fig. 3.13(a)). Most of these nano-precipitates were identified to be Pd-rich with no detectable Ag and U (Fig. 3.13(c)), which is consistent with the previous work [41]. Further examination in this study indicated a small amount of Ag in one EDS site (Fig. 3.13 (b)).
Figure 3.13(b) shows an example of the Pd-Ag nano-sized particle, which is found in the SiC layer ~5 μm away from the interlayer. The EDS spectrum clearly showed peaks corresponding to Pd and Ag. Among 10 nano-sized precipitates evaluated in this study, only two contained Ag. These Ag-Pd containing nano-precipitates should be further investigated to determine if they are intergranular or intragranular.
The semi-quantitative analysis results of selected nano-sized precipitates are shown in Table 3.3. The Si content in precipitates is higher, whereas C content is lower than in the SiC matrix, indicating the precipitates to be FP silicides. The concentration of FP measured in nano-sized precipitates is much smaller than Si or C. This is because the collected EDS signal emanates mainly from SiC matrix (~100 nm size, comparable to sample thickness) rather than from small size of precipitates (<20 nm).
Figure 3.13 (a) Different types of nano-precipitates identified inside a SiC grain (position1 in Fig. 3.12(a)), (b) EDS spectrum indicates S1 is a Pd-Ag precipitate and (c) EDS spectrum indicates S2 is a Pd-rich precipitate.
Table 3.3 Quantitative EDS results showing the composition of Pd-Ag (Fig. 3.13(b)) and Pd-rich (Fig. 3-13(c)) nano-sized spherical precipitates.
Elements Concentration (at.%)
SiC matrix S1 S2 S3
C(K) 47.14 31.30 26.21 32.37
Si(K) 52.79 66.36 66.51 62.38
Pd(K) 0.00 1.88 7.04 5.25

Final Report January, 2016
45
U(L) 0.07 0.46 0.06 0.00
GB precipitates (Width <5nm) and Triple Junction Precipitates (10 to 20 nm)
Nano-sized FP at triple junctions and boundaries of SiC grain was revealed by STEM-High Angle Annular Dark Field (ADF) imaging (Fig. 3.14 and Fig. 3.15). These triple junction precipitates are connected by hair-line shaped GB precipitates. In the previous study [41], these intergranular precipitates were found to be either Pd-rich (identified up to 4μm from SiC-IPyC interlayer) or Ag-rich (up to 0.5μm from the interlayer). This work confirmed the results of the previous study by analyzing more areas.
Pd-rich intergranular precipitates were identified up to 5 μm from SiC-IPyC interlayer as shown in Fig. 3.14. Quantitative results in Table 3.4 suggest the Pd-rich triple junction precipitates to be Pd silicides with no detectable U or Ag. Variation in Pd concentration may be influenced by the matrix signals, the extent of which depends on different precipitates’ sizes.
Ag-rich intergranular precipitates were identified up to 1.5 μm from SiC-IPyC interlayer (Fig. 3.15) providing evidence of Ag can transport along SiC grain boundaries. EDS spectrum shows that no U or Pd exist inside the Ag-rich precipitates, but a small amount of Cd was identified.
Figure 3.14 High magnification image of position.2 in Fig. 3.12(a), showing Pd-rich GB precipitates and triple junction precipitates.

Final Report January, 2016
46
Figure 3.15 Ag-rich GB and triple junction precipitates in SiC layer of sample 6a, ~1.5 um from SiC-IPyC interlayer (position 1 in Fig. 3.11 (c)).
Table 3.4 Quantitative EDS results showing the composition of different three Pd-rich triple junction precipitates (T1,T2,T3) (shown in Fig.3.4)
Elements Concentration (at.%)
SiC matrix T1 T2 T3
C(K) 47.14 41.13 36.0 33.43
Si(K) 52.79 51.40 58.98 55.75
Pd(K) 0.00 7.47 4.83 10.77
U(L) 0.07 0.00 0.19 0.05
3.3.3 Possible Mechanism of Ag Transport in Neutron Irradiated TRISO Fuel Particle
In this study, Ag was found in SiC GBs and triple junctions up to 1.5 μm from the SiC-IPyC interlayer, providing direct evidence of Ag GB diffusion. Compared with Pd rich GBs and triple junctions, which were identified up to 5μm in SiC layer from SiC-IPyC interlayer, the intergranular Ag was identified within a shorter range. This may imply that Ag GB transport is slower than Pd. However, more GB precipitates need to be examined to confirm this hypothesis. It is worth noting that in this study, no Pd was identified in Ag-rich grain boundaries and triple junctions and no Ag was identified inside the micron- sized Pd-U-Si

Final Report January, 2016
47
precipitates. This may suggests that the Pd assisted Ag transport through “mobile Pd- silicide nodules” as proposed in [67] and [69] is not likely to be the main mechanism for Ag GB transport. However, it should be noted that atomic migration along the grain boundaries, below the STEM and EDS detection limits, is possible and likely. From this study, it seems that Pd is not required for Ag intergranular transport. The single instance where an Ag-Pd nano-sized precipitate was found inside the SiC grains suggests a possible Pd-assisted intragranular transport mechanism for Ag. Similar to the intragranular Pd precipitates, Ag-Pd intragranular precipitates were not observed in the surrogate experiment [69], indicating a possible relation with radiation effects. Further high-resolution STEM work is needed to investigate the intergranular Ag-Pd precipitate formation. Small amounts of Cd were also seen in the Ag-rich GB precipitates and triple junction precipitates, which suggest that it can transport with Ag by an intergranular mechanism.
3.4 Summary of Experimental Work in the Project
The effects of radiation damage in SiC on diffusion of Ag have been studied with the goal of advancing the understanding of the transport of Ag fission product through the SiC diffusion barrier layer in TRISO fuel particles.
Polycrystalline 3C-SiC and single crystal 4H-SiC were irradiated with 3.15MeV C2+, followed by Ag ion implantation with 400KeV Ag ions. The samples were annealed at 1500oC, 1535oC, and 1569oC for durations of up to 20 hours, followed by analysis of Ag distribution profile by SIMS analysis. For 3C-SiC polycrystalline material, the damage introduced by carbon ion irradiation significantly enhanced the diffusion coefficient of Ag as compared to the unirradiated samples, with the difference decreasing with increasing temperature (likely due to defect annealing). The diffusion of Ag in unirradiated samples followed the expected Arrhenius law, whereas for the irradiated samples a nearly ‘flat-line’ behavior was observed and was speculated to stem from the counteracting effects of temperature and defect annealing. The Ag diffusion coefficient was (1.8-7.3)×10-17m2/s for ion irradiated 3C-SiC, and (5.9-8.8)×10-18m2/s for unirradiated 3C-SiC. The C2+ irradiated 4H-SiC single crystal, on the other hand, showed no visible Ag diffusion due to slow lattice diffusion (even under irradiation conditions). The increased effective diffusion coefficient in 3C-SiC was attributed to enhanced GB diffusion in the irradiated region.
Carbon irradiation experiment provided strong support for the hypothesis that ion radiation can significantly enhance Ag diffusion in polycrystalline SiC. However, the observed enhancement in diffusion coefficient in itself could not account for the integral release measurements ((1.5-35.9)×10-16m2/s at 1500oC). In addition to irradiation, the release of Ag can be affected by many other factors, such as the presence of nanocracks and voids [27, 70, 71], change in the microstructure (including degradation) of SiC [72, 73], the effect of other fission products/impurities [42, 74-77], and possibly combined effects of these factors with irradiation.
The work also represents one of first few studies on high resolution TEM/EDS examination of fission product in TRISO fuel after in-pile neutron irradiation testing. Previous PIE study [41] has illustrated the potential of STEM-EDS method to identify Ag at the SiC- IPyC interlayer in a

Final Report January, 2016
48
neutron irradiated TRISO fuel particle during post-irradiation examination. In the PIE study presented in this section, we further examined FP precipitates inside SiC layer (0.5μm to 5μm from the interlayer), along with a quantitative assessment of size, shape, preferential location, and composition of those FP precipitates.
Ag was found in SiC grain boundaries and triple junctions up to 1.5μm from the SiC-IPyC interlayer, providing direct evidence of Ag GB diffusion. No Pd was found in those nano-sized Ag GB and triple junction precipitates, which suggests that Pd may not be required for Ag GB transport. The co-existence of Cd with Ag in triple points reported previously [41] was confirmed by the present study. The presence of Pd rich nano-sized intragranular precipitates was further investigated. In one instance an Ag-Pd nano-sized precipitate was found inside the SiC grains, which suggests a possible Pd-assisted intragranular transport mechanism for Ag. Further high-resolution STEM work is needed to confirm the intergranular Ag-Pd precipitate formation. Nano-sized precipitates were not observed in the surrogate Pd/Ag-SiC diffusion experiments [69, 75], indicating that the precipitates are associated with neutron radiation effects. 4 Co-incorporation of Ag with Other Elements
We have considered the possibility that solubility of Ag in SiC could be increased if Ag was co-incorporated with other species. To test this hypothesis, we have performed ab initio calculations based on the Density Functional Theory of formation energies of defects comprised of Ag bound to iodine or oxygen. We found that for crystalline SiC, Ag co-incorporation with I or O into SiC is not energetically favorable. The results have been published in (Londono-Hurtado et al. J. Nucl. Mater. 2013) and are summarized in Appendix A.
5 Atomistic simulations of Ag diffusion
5.1 Ag Diffusion along High Energy Grain Boundary Despite the efforts to understand the Ag release through SiC in past decades, the release
mechanism yet remains largely unknown. Recently, a number of studies have provided strong evidence supporting the hypothesis that GB diffusion is a dominant pathway for the Ag transport in high-quality CVD-SiC. For example, Friedland et al. [5, 6] and Gerczak et al. [78] recently carried out Ag implantation in a single crystal SiC (sc-SiC) and a polycrystalline CVD-SiC (pc-SiC) at 1300°C. The Ag diffusion was only observed in pc-SiC, but not in the sc-SiC. Lopez-Honorato et al. [79, 80] designed a diffusion couple model where a layer of silver was trapped between two stoichiometric SiC layers then heat treated up to 1500°C. Significant Ag diffusion into SiC was observed in the samples and transmission electron microscopy images confirmed Ag particles along the columnar GB structure. Most recently, a study by Van Rooyn et al. [41] used scanning transmission electron microscopy-energy dispersive X-ray spectroscopy to

Final Report January, 2016
49
observe Ag in both GBs and the triple junctions from irradiated TRISO coated particles. The above considerations suggest that GB diffusion is a preferred mechanism for Ag
transport, yet it remains unclear which GBs transport the Ag and how quickly, how this transport occurs at the atomistic level, and if there is any coupling to irradiation effects. To better elucidate the fundamentals of Ag diffusion in SiC, atomistic simulation studies have modeled Ag diffusivity through bulk [16], ∑3-GBs [45], and ∑5-GBs [81] of 3C-SiC. The diffusion coefficients (D) were predicted to be DBulk= 3.9×10⁻²⁹ m2s-1 at 1600°C in bulk SiC (the fastest mechanism being Ag interstitials, where the Ag residues on a site tetragonally coordinated by four Carbon atoms), D∑3-GB = 3.7×10⁻¹⁸ m2s-1 at 1600°C in ∑3-GBs (for the fastest direction, which was along the [011]), and D∑5-GB = 0.22 - 10.5×10⁻¹⁸ m2s-1 at 1227°C in the ∑5 (120) tilt GB. These results strongly suggest that the bulk diffusion cannot account for the experimentally observed release rates of Ag from TRISO particles, which are summarized in Table 5.2. Additionally, the higher D values found for GBs provide further evidence that GB diffusion is a dominant mechanism responsible for Ag release.
Despite the higher D values predicted for select GBs compared to bulk, the predicted D in ∑3 and ∑5 GBs are still from one to three orders of magnitude lower than the lowest values measured from integral release measurement [37, 48, 49, 61, 62, 82, 83] at similar temperatures, and therefore they cannot be simply invoked as the explanation for the observed diffusion. A major missing part of present understanding is that high-energy GBs (HEGBs) have not yet been modeled or measured explicitly, but are expected to play a significant role in Ag transportation in pc-SiC. The HEGBs are often highly disordered structures and represent > 40% of GBs in TRISO prototype materials [78, 84]. The high fraction of HEGBs allow them to provide a percolating path for Ag transportation, and HEGBs are the one of few GB types that are present in high enough concentration to form a percolating path [45]. More importantly, it is often found that disordered (amorphous) materials provide a faster transportation pathway for extrinsic defects [85-87] compared to crystalline materials. Therefore, we expect HEGBs are the most likely GB type to dominate Ag transport, and the Ag diffusion coefficient in HEGBs to be faster than those in other GBs or bulk, which possibly bridges the remaining discrepancies with integral release measurements. In this work, we used an ab initio based stochastic modeling approach to predict the Ag diffusion coefficient in HEGBs.
5.1.1 Methods
The HEGB is modeled as an amorphous SiC (a-SiC) region, as the local environments in HEGBs of covalent materials are known to be similar to amorphous phases [88, 89] and a bulk amorphous phase is computationally more tractable to model than a full GB structure. We prepared an a-SiC structure from classical molecular dynamics with the Tersoff interatomic potential using the melt-quench method [90]. A supercell containing 128 atoms with a perfect stoichiometry (but allowing antisite and coordination defects) was arbitrary cut out from the bulk, then fully relaxed using Density Functional Theory (DFT) with periodic boundary
Final Report January, 2016
50
conditions and under constant zero pressure and zero K temperature. The resulting cell vectors were [11.21, 0.17, -0.37; 0.17, 11.57, 0.15; -0.38, -0.15, 11.03] (non-cubic) and the final density of the cell was 2.98 g/cm3, which is comparable with the simulated density by Tersoff potential (3.057 and 2.896 g/cm3) in Ref [90], and is, as expected, lower than the DFT calculated sc-SiC density, 3.18 g/cm3. It is true that some features of real amorphous structures may depend on cooling and processing conditions, but we make the assumption that the present method captures local environments adequately enough to approximate the diffusion rates of Ag through an amorphous-like GB region.
The Vienna Ab-Initio Simulation Package (VASP) [91-94], an ab initio DFT code, and projector-augmented plane-wave (PAW) method [66, 95] were used to relax the final a-SiC and to explore Ag diffusion in the a-SiC structure. The exchange-correlation was treated in the Generalized Gradient Approximation (GGA), as parameterized by Perdew, Burke, and Ernzerhof (PBE) [96]. A single Γ-point k-point mesh was used to sample reciprocal space. While this is not highly converged it was necessary to use few k-points to enable the large number of required calculations. The Γ-point k-point mesh had an error about 15 meV/atom for 128 atom cell compared to 2×2×2 k-point mesh, which is expected to be well-converged. Tests on at least five barriers showed that error in energy barrier with respect to k-points for a Γ-point vs. 2×2×2 k-point mesh is within an acceptable error range of 200 meV/Ag (this corresponds to about a factor of 5× error at 1500K). The energy cut-off was set at 450eV. The convergence for the electron self-consistency cycle was set to 10 eV. For the formation energy (ΔEf) of defects, we use the following expression [97] : ΔEf = Edef ˗ Eundef + ΣIΔnI μI. The Edef and Eundef are energies of the defected and the undefected cell, ΔnI is the change in the number of the atomic species in the defected cell from the number of same species in the undefected cell, and μI is the chemical potential of atomic species I relative to its reference energy. The reference states for Si and C are taken as the bulk Si and C VASP energies (which are referenced to their pseudopotential reference energies) in their groundstate structures (diamond lattice for Si and graphite for C). Throughout this study, Si-rich condition chemical potentials are used for silicon and carbon (μSi = -5.44 and μC = -9.65 eV) for consistency. The ab initio formation energy of bulk solid phase Ag metal (μAg = -2.82eV) is set to be the chemical potential for Ag. No charged supercells or explicitly charged defects were considered in this study. We believe this approximation is a reasonable as the neutral state for Ag interstitials (which are our focus in this study, as discussed in Section 5.1.2) is stable charge state for Ag in n-type crystalline SiC, as predicted by Shrader, et al [16]. Furthermore, even if the Ag were charged, at least some of the impact of the changes in energy as compared to the neutral state would cancel between initial and activated states during the migration barrier calculation, further reducing its impact on the predicted value of D.
To obtain diffusion pathways and the corresponding minimum energy path, the climbing nudged elastic band (CNEB) method was employed. Typically, three images were used in the CNEB calculations. The initial estimate for the transition state was set as a center image, and additional images are linearly interpolated between Ag site and the center image. The transition states are first estimated by putting the Ag at the centroid of the sites consisting of the initial and final Ag sites and all Si and C sites within 1.89 Å (the nearest neighbor bond length of SiC) (this

Final Report January, 2016
51
approach is similar to that use in Ref. [98]). Calculations starting from this initial Ag position converged into a stable transition state in more than 80% of cases during the CNEB optimization. However, in the remaining cases the initial Ag position was too close to a Si or C atom and the CNEB calculation did not converge. For these cases a new candidate activated state was estimated by using a two step process. First, a linearly interpolated image halfway between the initial and final Ag configurations is determined. Then, if in this image the Ag and any other atom were less than 1.45 Å apart, the Ag and this other atom were moved by 1.0 Å each in opposite directions to assure their separation. The displacement was done in the plane normal to the line connecting the initial and final Ag states. Displacements were attempted along lines every 45 degrees within the normal plane until all interatomic distances in the candidate activate state were greater than or equal to 1.42 Å (which is 75% of a SiC nearest-neighbor bonding length). The calculations starting from these candidate activated states showed robust convergence.
In order to represent Ag migration barriers independently of the initial and final state energies we use the Kinetically Resolved Activation (KRA) Barrier [99, 100] to represent the barrier value. In the KRA the saddle point migration energy ( saddle
mE ) is determined by the energies of the
initial and final sites ( initialfE and final
fE ) and KRA energy (EKRA), which is used to as in Equation
5.1 and illustrated in Fig. 5.1. The KRA approach provides a compact way to represent the migration energy of a hop in either a forward or backward direction. Furthermore the approach defines EKRA so as to remove the contributions of the initial and final energy to saddle
mE , and EKRA
is therefore likely to vary less and be easier to represent than saddlemE .
Equation 5.1 ( ) / 2saddle initial final
KRA m f fE E E E= − +
Figure 5.1 A schematic representation of the Kinetically Resolved Activation (KRA) barrier.
In order to explore the diffusion in a disordered lattice we use the effective medium approximation (EMA) [101], which has been applied previously to model diffusion in an amorphous system [102, 103]. In this model, a single Ag atom diffuses under the assumption that Ag atoms do not interact with each other while diffusing along HEGB. The main idea of this scheme is to replace the actual system jump frequencies by an effective energy surface with an equal frequency distribution (fitted to DFT calculations), but stochastically sampled. The
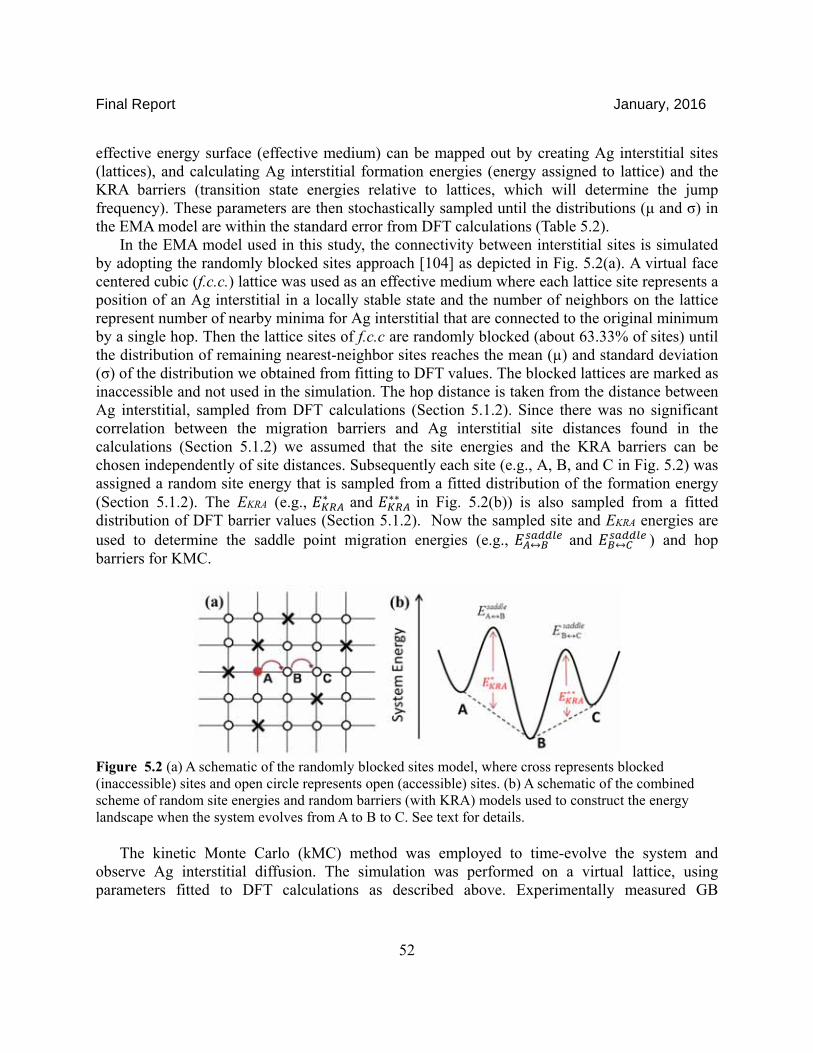
Final Report January, 2016
52
effective energy surface (effective medium) can be mapped out by creating Ag interstitial sites (lattices), and calculating Ag interstitial formation energies (energy assigned to lattice) and the KRA barriers (transition state energies relative to lattices, which will determine the jump frequency). These parameters are then stochastically sampled until the distributions (μ and σ) in the EMA model are within the standard error from DFT calculations (Table 5.2).
In the EMA model used in this study, the connectivity between interstitial sites is simulated by adopting the randomly blocked sites approach [104] as depicted in Fig. 5.2(a). A virtual face centered cubic (f.c.c.) lattice was used as an effective medium where each lattice site represents a position of an Ag interstitial in a locally stable state and the number of neighbors on the lattice represent number of nearby minima for Ag interstitial that are connected to the original minimum by a single hop. Then the lattice sites of f.c.c are randomly blocked (about 63.33% of sites) until the distribution of remaining nearest-neighbor sites reaches the mean (µ) and standard deviation (σ) of the distribution we obtained from fitting to DFT values. The blocked lattices are marked as inaccessible and not used in the simulation. The hop distance is taken from the distance between Ag interstitial, sampled from DFT calculations (Section 5.1.2). Since there was no significant correlation between the migration barriers and Ag interstitial site distances found in the calculations (Section 5.1.2) we assumed that the site energies and the KRA barriers can be chosen independently of site distances. Subsequently each site (e.g., A, B, and C in Fig. 5.2) was assigned a random site energy that is sampled from a fitted distribution of the formation energy (Section 5.1.2). The EKRA (e.g., ∗ and ∗∗ in Fig. 5.2(b)) is also sampled from a fitted distribution of DFT barrier values (Section 5.1.2). Now the sampled site and EKRA energies are used to determine the saddle point migration energies (e.g., ↔ and ↔ ) and hop barriers for KMC.
Figure 5.2 (a) A schematic of the randomly blocked sites model, where cross represents blocked (inaccessible) sites and open circle represents open (accessible) sites. (b) A schematic of the combined scheme of random site energies and random barriers (with KRA) models used to construct the energy landscape when the system evolves from A to B to C. See text for details.
The kinetic Monte Carlo (kMC) method was employed to time-evolve the system and
observe Ag interstitial diffusion. The simulation was performed on a virtual lattice, using parameters fitted to DFT calculations as described above. Experimentally measured GB

Final Report January, 2016
53
dimensions were used for the simulation cell of the virtual lattices (which we will refer to as a virtual HEGB). The virtual HEGB structure should match a typical grain size and HEGB width. With this goal in mind the HEGB structure is set to be a rectangular plate with side of approximately 980nm (~1 µm) and thickness of 1 nm (z-direction) [78, 84] in this work. Owing to the low formation energies of Ag defects in HEGB (Section 5.1.2), Ag is assumed to stay within the assumed constant finite thickness of the GBs. Therefore, PBC were applied on the virtual lattice except along the z-direction. The Bortz-Kalos-Liebowitz [105] algorithm was used in the kMC model. The hopping rates (Г) for Ag atoms are given by the transition state theory as Г = ω exp(-EA/kBT), where ω is attempt frequency and EA is the migration barrier of the hop. The ω value is assumed to be equal to a typical phonon frequency for a heavy atom, which we take as 1.0×10⁻¹²s-1. The activation barrier (EA) for each hop is estimated by the formalism of EKRA energy associated with energies of two equilibrium sites. In each step of kMC, Ag migrates from the current lattice site (i) to one of Z neighbor lattices. The probability for Ag to migrate from lattice site i to j is determined stochastically by Pij= Гij / Σ Гin, where j is a positive integer from an interval (0,Z]. Next, the system is updated to the j state with an increment of time
forward,∆ , given by ∆ = ∑ ΓijZn=1 -1 ln( )), where u is a uniform random number between 0 and 1. The Ag diffusion coefficient is determined by the Einstein relation, DAg= < r2
Ag (t) > / 2dt, from the calculated mean square displacement as a function of time [106], where d is the dimensionality of the system in which Ag diffuses (here d = 2), t is time, and < r2
Ag (t) > is the mean square displacement of Ag as a function of time. We evaluate the average using the multiple time origin method [107]. For the quasi-two dimension HEGB of interest, <r2
Ag (t) > = 1/Nt [ Σ [[ rx(oj+(N/2)) ˗ rx(oj)]2 +[ry(oj+(N/2)) ˗ ry (oj) ]2] where Nt is the number of time origins, and the quantity rx(oj+(N/2)) - rx(oj) is the displacement along the x-direction over the time span between time origin oj and oj+(N/2) (analogous quantities for the y-direction). The diffusion along the z-direction is negligible within the geometry of HEGB (1nm in thickness with no PBC vs. effectively infinite diffusion in the x-y direction due to PBCs) and therefore is not considered for simplicity. For statistical reliability we choose the number of time origins Nt to be half the total number of time steps, N/2. For the given N time-steps, < r2
Ag (t) > is computed for N/2 possible time origins between j and (j + N/2) time steps. The kMC simulation is allowed explore the system across multiple periodic boundaries along x and y directions. The converged diffusion coefficient values were extrapolated from a linear fit to a plot of < r2
Ag (t) > vs. t. Each simulation was typically performed for 10 billion kMC steps to obtain a well-converged fit.
5.1.2 DFT Calculations of Ag Energetics
In order to understand the transportation behavior of Ag in the a-SiC, it is important to determine which Ag defect is stable and will contribute to the diffusion. To determine the dominant Ag diffusion species in a-SiC, first the formation energies of the point defects (vacancies, Ag substitutionals on Si and C lattices, and Ag interstitials) were studied. These defects were sampled over a wide range of local environments and the results are summarized in
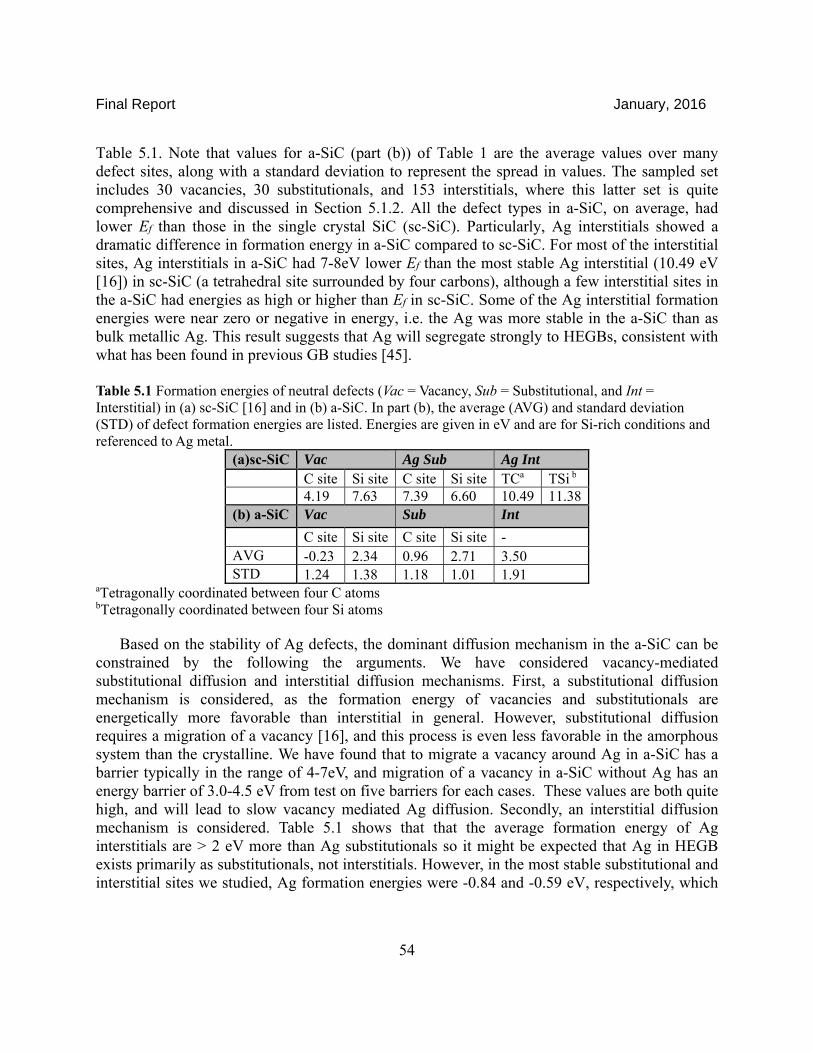
Final Report January, 2016
54
Table 5.1. Note that values for a-SiC (part (b)) of Table 1 are the average values over many defect sites, along with a standard deviation to represent the spread in values. The sampled set includes 30 vacancies, 30 substitutionals, and 153 interstitials, where this latter set is quite comprehensive and discussed in Section 5.1.2. All the defect types in a-SiC, on average, had lower Ef than those in the single crystal SiC (sc-SiC). Particularly, Ag interstitials showed a dramatic difference in formation energy in a-SiC compared to sc-SiC. For most of the interstitial sites, Ag interstitials in a-SiC had 7-8eV lower Ef than the most stable Ag interstitial (10.49 eV [16]) in sc-SiC (a tetrahedral site surrounded by four carbons), although a few interstitial sites in the a-SiC had energies as high or higher than Ef in sc-SiC. Some of the Ag interstitial formation energies were near zero or negative in energy, i.e. the Ag was more stable in the a-SiC than as bulk metallic Ag. This result suggests that Ag will segregate strongly to HEGBs, consistent with what has been found in previous GB studies [45].
Table 5.1 Formation energies of neutral defects (Vac = Vacancy, Sub = Substitutional, and Int = Interstitial) in (a) sc-SiC [16] and in (b) a-SiC. In part (b), the average (AVG) and standard deviation (STD) of defect formation energies are listed. Energies are given in eV and are for Si-rich conditions and referenced to Ag metal.
(a)sc-SiC Vac Ag Sub Ag Int C site Si site C site Si site TCa TSi b 4.19 7.63 7.39 6.60 10.49 11.38 (b) a-SiC Vac Sub Int
C site Si site C site Si site - AVG -0.23 2.34 0.96 2.71 3.50 STD 1.24 1.38 1.18 1.01 1.91
aTetragonally coordinated between four C atoms bTetragonally coordinated between four Si atoms
Based on the stability of Ag defects, the dominant diffusion mechanism in the a-SiC can be constrained by the following the arguments. We have considered vacancy-mediated substitutional diffusion and interstitial diffusion mechanisms. First, a substitutional diffusion mechanism is considered, as the formation energy of vacancies and substitutionals are energetically more favorable than interstitial in general. However, substitutional diffusion requires a migration of a vacancy [16], and this process is even less favorable in the amorphous system than the crystalline. We have found that to migrate a vacancy around Ag in a-SiC has a barrier typically in the range of 4-7eV, and migration of a vacancy in a-SiC without Ag has an energy barrier of 3.0-4.5 eV from test on five barriers for each cases. These values are both quite high, and will lead to slow vacancy mediated Ag diffusion. Secondly, an interstitial diffusion mechanism is considered. Table 5.1 shows that that the average formation energy of Ag interstitials are > 2 eV more than Ag substitutionals so it might be expected that Ag in HEGB exists primarily as substitutionals, not interstitials. However, in the most stable substitutional and interstitial sites we studied, Ag formation energies were -0.84 and -0.59 eV, respectively, which
Final Report January, 2016
55
are about equal. This result suggests that for the most stable cases, which might be expected to dominate the behavior of small amounts of Ag, both substitutional and interstitial Ag may be approximately equally stable. The migration barriers, however, were typically around 1-3 eV for Ag interstitials, which is considerably lower than the typical barriers for vacancies. Given these energy trends, Ag transportation via interstitial mechanism is expected to be dominant mechanism and is the mechanism which we focus on in this paper. We note that the above qualitative argument is insufficient to rule out the possibility of a fast vacancy mediated path, and such transport mechanisms are a useful topic for further study.
To model Ag interstitial diffusion in a-SiC, the energy landscape of Ag interstitials was first investigated. In an amorphous material, locating extrinsic interstitial defect sites is challenging because of lack of long-range order. Many approaches to identify interstitial sites have been proposed in other amorphous systems [108-111]. To achieve a complete list of possible Ag interstitial sites, we have taken a brute force but comprehensive approach to identify possible sites. Specifically, we identified all existing interstitial sites by gridding our entire supercell with a fine uniform grid and relaxing a Ag interstitial at every grid point in the cell. A similar approach was used to study Li diffusion in amorphous oxides [111]. When necessary, gridding points were shifted so that they were at least 1.5 Å from any adjacent host atoms to avoid a numerical instability. The ideal grid density was tested for ¼ of the simulation cell to verify a maximum grid size that could still to capture all existing minima. It was determined that a grid size of 1 Å on a side was adequate to find all the interstitials.
For the a-SiC sample, we investigated 113 grid points and identified 247 apparently distinct Ag interstitial sites. However, many of these sites were found to be close to each other, both energetically and geometrically. These similar sites may fail to relax to a single site due to the fact that the calculations are at zero temperature and have a complex energy landscape with many weakly separated local minima. At finite temperature, on the other hand, the Ag will likely thermalize into just one effective site, even if a number of very nearby ones are found at zero temperature. Therefore the hierarchical clustering approach [110] was employed to group the close configurations into clusters while having the lowest energy state represent the cluster. All Ag within a cut-off distance were grouped together. The cut-off distance was set to be 0.5 Å, which is about 1/4 of the shortest bonding length between Ag and host atom for a bulk interstitial (the bonding length of Ag and C in the bulk sc-SiC interstitial position is 2.076 Å). Thus we are making the approximation that sites within this cut-off distance are essentially equivalent. The following observations support the idea that the clustering will not have a significant effect on the Ag interstitial diffusion at the temperature range of the interest (1200-1600°C). Firstly, the energy variation within a cluster was typically found to be no larger than 50 meV, 100 meV at most. Also the migration barriers between configurations in clusters were found to be less than 200 meV in all the 10 cases checked. These results suggests that within a cluster the Ag will easily move between sites at high temperatures, which will cause the cluster to behave like a single effective local minimum for Ag.
The distribution of formation energies is shown in Fig. 5.3 (a). The formation energies of Ag interstitials in a-SiC had an average value of 3.50 eV and this value is ~7 eV more stable than the

Final Report January, 2016
56
most stable Ag interstitial in sc-SiC (10.49eV [16]). The values range from -0.59 to 8.21 eV, with a standard deviation of 1.91 eV. The Ag, which is an impurity with a relatively larger size than those studied in similar amorphous systems [108-110, 112-115], turned out to be highly stable as interstitial in a-SiC. Figure 5.3 (b) shows the Ag distance from one interstitial site to the nearest neighbor site. The figure shows that 95% of interstitial sites have a nearest-neighbor interstitial site within 2.0Å and 100% within 2.75Å.
Figure 5.3 Gridding approach results after clustering (a) Distribution of formation energy with a bin size of 0.5 eV. Comparison to Gaussian distribution parameterized by mean and standard deviation from gridding method. (b) Distribution of Nearest-Neighbor cluster distance from one cluster to the other with a bin size of 0.5 Å.
Migration barriers that are needed for a diffusion analysis of Ag in a-SiC are calculated using
the CNEB. A number of migration barrier calculations are performed to achieve a statistically robust dataset. Instead of gathering barrier energies for all possible migrations, we focused on elucidating the systematic features of barriers as the sampling size increase. Fifty pairs of minima, approximately 1/6 of the total number of transition states, are randomly sampled. The distribution of migration barriers as a function of the relative Ag distance is shown in Fig. 5.4(a). The energy barrier for a hop is dependent on the energy state of two endpoints and thus two values (barrier from low energy state to high energy state (L-H) and vice versa (H-L)) are plotted for each reaction. It is observed that there is no correlation between the barrier and the Ag hop distance. However, most of the CNEB calculations between sites with distance larger than 2.5Å failed to discover a single saddle point (not shown in Fig. 5.4). They either showed a convergence failure, likely due to significant difference in local ordering that requires movement of multiple atoms, or found two saddle points, which is not a single hop and involves another minimum between them. Therefore 2.5 Å was used as a cutoff distance to determine the number of neighbor interstitial sites (Z) from an interstitial site. The Z distribution and the normal fit to Z are shown in Fig. 5.5. On average, interstitial sites had Z=4.4, which represents the average number of sites to which Ag can migrate by a single hop.

Final Report January, 2016
57
The EKRA values as shown in Fig. 5.4(b) are distributed normally in the range of 0.4-2.2 eV. Table 5.2 gives the results of fitted normal distributions for Ag interstitial sites for both coordination and energetics. With the KRA formalism and values in Table 5.2 and Equation 5.1 the number of possible hops and their migration energies associated with leaving a given site can be sampled. Therefore, now we can stochastically generate the Ag atom hop energetics that are needed at each kMC step.
Figure 5.4 Result of migration barrier calculations for Ag in a-SiC: (a) Energy barriers between two minima plotted as a function of relative distance of minimum. The barrier from high to low and low to high energy state is marked with "H-L" and "L-H" respectively. (b) A histogram of EKRA values from calculated migration barriers in (a).
Figure 5.5 A histogram of the number of neighbor interstitial sites (Z) from an interstitial site within the cutoff distance of 2.5 Å of relative Ag positions. A normal distribution fit to the data is shown with red line.

Final Report January, 2016
58
Table 5.2 Mean (μ) and Standard deviation (σ) of diffusion related parameters from ab initio calculation. All three parameters were fitted to normal distributions (FIG. 5.3(a), FIG. 5.4(b), and Fig. 5.5). SEμ and SEσ are the standard errors of mean and standard deviation ((SEμ = σ / √n, and SEσ ≈ σ/ 2(n − 1) [116])) from the distribution.
μ σ SEμ SEσ
Ef (eV) 3.50 1.91 0.15 0.11
EKRA (eV) 1.05 0.54 0.08 0.05
Z (sites) 4.4 2.1 0.17 0.12
5.1.3 Kinetic Monte Carlo Model for Ag Diffusion
With the statistical distributions from Table 5.2 we performed a kMC simulation as described in Section 5.1.1. To be more specific, we first constructed a virtual medium of f.c.c. lattice sites where f.c.c. sites correspond to Ag interstitial sites. The single Ag hop distance (lattice distance
in EMA) is taken as ℎ = 2.1 Å, where h is Ag hop distance sampled from DFT calculation, and ℎ is the mean of h2 for all sampled Ag hops. Then sites are randomly removed (i.e. become inaccessible) until the distribution of number of remaining nearest neighbor sites agrees with the mean and standard deviation of Z, sampled from a-SiC (Table 5.2). The formation energies are randomly assigned to remaining sites by sampling from the fitted normal distribution of Ef in Table 5.2. The migration barriers between sites are computed by Equation 5.1, where EKRA is sampled from the normal distribution in Table 5.2. After the Ag interstitial site network has been established, a single Ag is randomly placed on one of the sites and its movement is determined by the rates of migration using kMC.
It is important to carry out the sampling correctly and to generate a realistic energy landscape. We have identified two factors that in general may lead to an unrealistic (or inefficient) sampling and that were adjusted for in our model. First, we considered if there might be a relation between a minimum that has a low number of possible hops, and its surrounding energy landscape. Physically this might correspond to there being a particular tendency for a site far from any others to be unstable and have a low barrier for migration. Since the long time steps (where ∆t is much larger relative to those of typical steps) are most likely to occur when Ag sits on a site that has small number of neighbors and is the bottom of the potential well, this type of correlation could play a critical role. We found in our ab initio calculations that all the minima with low number of nearest neighbors (Z=1 or 2) are higher in their energy than energies of neighboring minima. In fact, low Z minima were found to be higher in formation energy than the average of neighboring energy minima by 1-2eV. This correlation implies that Ag atoms are less likely to be found at these meta-stable low Z minima under equilibrium condition of dilute solution. This correlation is included in our model by setting the energy of low Z sites (Z=1 or 2) to 1.5 eV higher than the average energies of their neighboring minima.

Final Report January, 2016
59
Another important consideration related to the possibility of generating an unrealistic energy landscape is the sampling of parameters from tails of Gaussian distributions. Although we have shown that it is a reasonable approach to take parameter distributions as Gaussian, the analysis was based on considering the middle regions of the Gaussian, not the tail regions. However, a significant number of samples from the Gaussian distributions during the kMC runs include many points in the far tail regions of the Gaussians, which may not be representative of the real system. Considering that our actual ab initio results are all within two standard deviations from mean value, the sampling is likely accessing many values that are far from the ab initio observations. Thus we constrained the minimum and maximum values from sampling to be consistent with those obtained from the ab initio calculations. The values are still sampled from the Gaussian distributions (Table 5.2), but values outside those limiting cases seen in the ab initio calculations are not used.
It is possible that the diffusion of impurities in a disordered material can be different in different regions. To account for possible spatial deviation of the distribution parameters, we have explored 1/8 volume fraction of another 128 atom a-SiC test structure (prepared in the same manner as described in Section 5.1.1) with DFT calculations and we discovered 31 interstitial minima. The distribution of formation energies followed normal distribution as well. The formation energies distribution from this new data set followed N(3.24, 2.21) with standard error of mean SEμ = 0.40 and standard error of standard deviation SEσ = 0.28, where the original distribution was N(3.50, 1.91). For the EKRA, about 1/6 of possible transition states within the sub-region were examined. The EKRA also showed a normal distribution of N(1.14, 0.58) with standard error of mean SEμ = 0.15 and standard error of standard deviation SEσ = 0.11, where the original distribution was N(1.05, 0.54). The mean and standard deviation values from the distributions associated with the new structure are within the standard error range (Table 5.2) of those computed for the previous structure. As both variables had distribution parameters within their standard error range, we conclude that the distributions are not statistically distinct. This result suggests that the distributions determined from our first cell are adequately general for modeling the energy landscape for Ag in HEGB.
The typical HEGB dimensions are approximately 1μm×1μm×1nm and we will assume that this is large enough that the Ag diffusivity in a given HEGB is indistinguishable from that which would be obtained from an infinite HEGB, denoted Deff. In order to determine Deff we model diffusion in a series of cells each with dimensions of 140nm × 140nm × 1nm, as larger cells were too computationally expensive. To obtain the effective infinite cell diffusivity we calculated the Deff for a number of the 140nm × 140nm × 1nm simulation cells in series. Specifically, Deff is estimated as the harmonic mean of diffusion coefficient in each simulation cell, or Deff = n / [ =1 (Di)-1], where n is the number of sampling (n=350) and Di is the diffusion coefficient from each simulation cell.
Due to the significance of EKRA formalism in our model, it is expected that the largest errors will stem from the EKRA distribution. Although we have shown the sampled EKRA distribution can effectively represent the distribution in a-SiC, the effective diffusivity can be sensitive to the change of EKRA within the standard error range. Hence, here we analyze the impact on Deff of the

Final Report January, 2016
60
uncertainty in EKRA by considering two extreme conditions for EKRA. We assume that the distribution can be shifted within the standard error range of our computed distribution mean and sigma. The standard errors (SEμ, SEσ) of measured distribution mean (μ) and standard deviation (σ) were summarized in the Table 5.2. We define the total uncertainty due to EKRA sensitivity by setting mean and standard deviation to result in their extreme values and studying the range of D. In other words, for the (a) upper bound of D we set μ' = μ ˗ SEμ and σ' = σ + SEσ and for the (b) lower bound of D we set μ' = μ + SEμ and σ' = σ ˗ SEσ. In the kMC simulation, Deff values are predominantly determined by relatively slow hops with large t, which is due to high migration barrier. More sampling of higher values for EKRA will therefore give lower D. The upper bound case samples barrier from distribution with lower mean and smaller spread, which barriers are sampled from left tail of parent Gaussian distribution. For the lower bound D, barriers are sampled from a distribution with higher mean and larger spread, which distribution center lies near and above the right tail of the parent Gaussian distribution. The Defftotal for cases (a) and (b) are calculated as done for the original EKRA distribution at each temperature, but now using the newly determined EKRA distributions to estimate a lower and upper value and corresponding error range for Defftotal.
Another potentially significant uncertainty stems from the statistical error in D sampling from kMC modeling. For statistical reliability, Deff values were computed from the harmonic mean of 350 of the 140 nm × 140 nm × 1 nm cells at each temperature. The standard error of Deff
(SE(Deff)) is estimated by the equation proposed by Norris, SEN(Deff) = (Deff)2 × [σ(1/ Di) /√ − 1], where the σ(1/ Di) is the standard deviation of the reciprocals of the Di, and m is the number of the sampling [117]. We note that this formula effectively relies on a first-order Taylor expansion which may not provide an accurate estimate for our values. We therefore also estimate a bound on this error by blocking the 350 calculations into 10 blocks of 35 and calculating the standard error in the mean of these blocks. This also provides an estimate of our error and we denote this block based approach as SEB(Deff). We found that the statistical error from number of sampling was generally significantly less than the uncertainty from EKRA. For example, the SEN(Deff) (SEB(Deff)) at 1673 K was found as 5.1×10⁻¹⁹m2s-1 (8.9×10⁻¹⁹m2s-1) while the estimated errors (the difference between the upper and lower bound) from EKRA was 4.2×10-
18m2s-1. The total error from two sources is added in quadrature at each temperature, where we always use the larger of the two values of SEN(Deff) and SEB(Deff), and shown in Fig. 5.6.
The calculated Deff in the range from operating to accident temperature of TRISO fuel particles (from 1200 to 1600 °C) are shown in Fig. 5.6 at each temperature. The diffusion prefactors (D0), the effective activation energies (QA), and the diffusion coefficient (D) at 1300 °C and 1600 °C from the literature are also summarized in Table 5.3 and Fig. 5.6. Ag diffusion simulations were performed in 50 virtual HEGB cells for each temperature. The error bar includes the uncertainty range of D values due to EKRA sampling during kMC (See above for details on the error calculations, where we find that among possible sources of likely error, uncertainty arising from EKRA sampling is the most significant.), and all of the calculated D values are found within the error bars. The diffusion coefficients show Arrhenius type diffusion and the pre-exponential factor (D0) and effective activation barrier (EA,eff) are extrapolated from
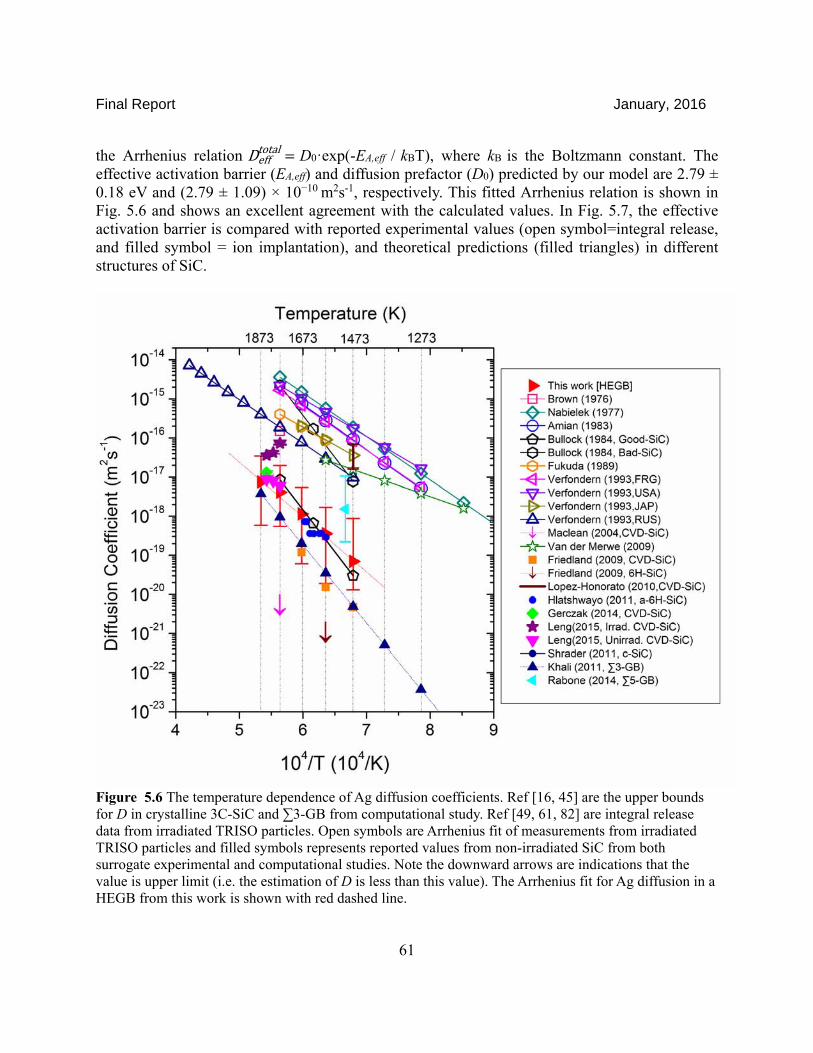
Final Report January, 2016
61
the Arrhenius relation Defftotal = D0·exp(-EA,eff / kBT), where kB is the Boltzmann constant. The effective activation barrier (EA,eff) and diffusion prefactor (D0) predicted by our model are 2.79 ± 0.18 eV and (2.79 ± 1.09) × 10−10
m2s-1, respectively. This fitted Arrhenius relation is shown in Fig. 5.6 and shows an excellent agreement with the calculated values. In Fig. 5.7, the effective activation barrier is compared with reported experimental values (open symbol=integral release, and filled symbol = ion implantation), and theoretical predictions (filled triangles) in different structures of SiC.
Figure 5.6 The temperature dependence of Ag diffusion coefficients. Ref [16, 45] are the upper bounds for D in crystalline 3C-SiC and ∑3-GB from computational study. Ref [49, 61, 82] are integral release data from irradiated TRISO particles. Open symbols are Arrhenius fit of measurements from irradiated TRISO particles and filled symbols represents reported values from non-irradiated SiC from both surrogate experimental and computational studies. Note the downward arrows are indications that the value is upper limit (i.e. the estimation of D is less than this value). The Arrhenius fit for Ag diffusion in a HEGB from this work is shown with red dashed line.

Final Report January, 2016
62
Figure 5.7 Effective activation energy barrier in this study and literature values [5, 16, 45, 49, 61, 62, 81-83]. Note that values predicted in the bulk and ∑3-GB are activation energies for Ag specific species and directions, respectively. Table 5.3 A summary of reported diffusion coefficients for Ag in SiC in the form of an Arrhenius relation
( )0 A Bexp Q / TD D k= × − when available. The temperature range shown gives the range of
temperature values used to fit the Arrhenius relation for D. Method and Reference Temp.(°C) ( ) ( ) D (T=1300°C) D(T=1600°C)
Experiments
Integral Release Brown [48] a1500 - - - a1.5 × 10 Nabielek[49] 800-1500 6.8 × 10 2.21 5.7 × 10 -
Amian[82] 1000-1500 4.5 × 10 2.26 2.8 × 10 -
Bullock [83] 1200-1500 9.6 × 10 4.24 - -
Fukuda [62] 1300-1500 6.8 × 10 1.84 - -
Verfondern (FRG)[61] 1000-1500 3.6 × 10 2.23 2.6 × 10 -
Verfondern (USA) [61] 1000-1500 5.0 × 10 1.89 4.5 × 10 -
Verfondern (JAP) [61] 1200-1400 6.8 × 10 1.84 9.0 × 10 -
Verfondern (RUS) [61] 1200-2300 3.5 × 10 2.21 3.0 × 10 4.0 × 10
Van der Merwe [37] 920-1290 1.14 × 10 1.13 2.7 × 10 -
Ion Implantation Friedland (CVD-SiC)[6] 1200-1400 2.4 × 10 3.43 1.5 × 10 - bFriedland (6H-SiC) [5] 1200-1400 - - c < 1.0 × 10 -
Friedland(CVD-SiC) [5] 1200-1400 4.3 × 10 2.50 2.8 × 10 -
Maclean (CVD-SiC)[118] a1500 - - - a,c <5.0 ×
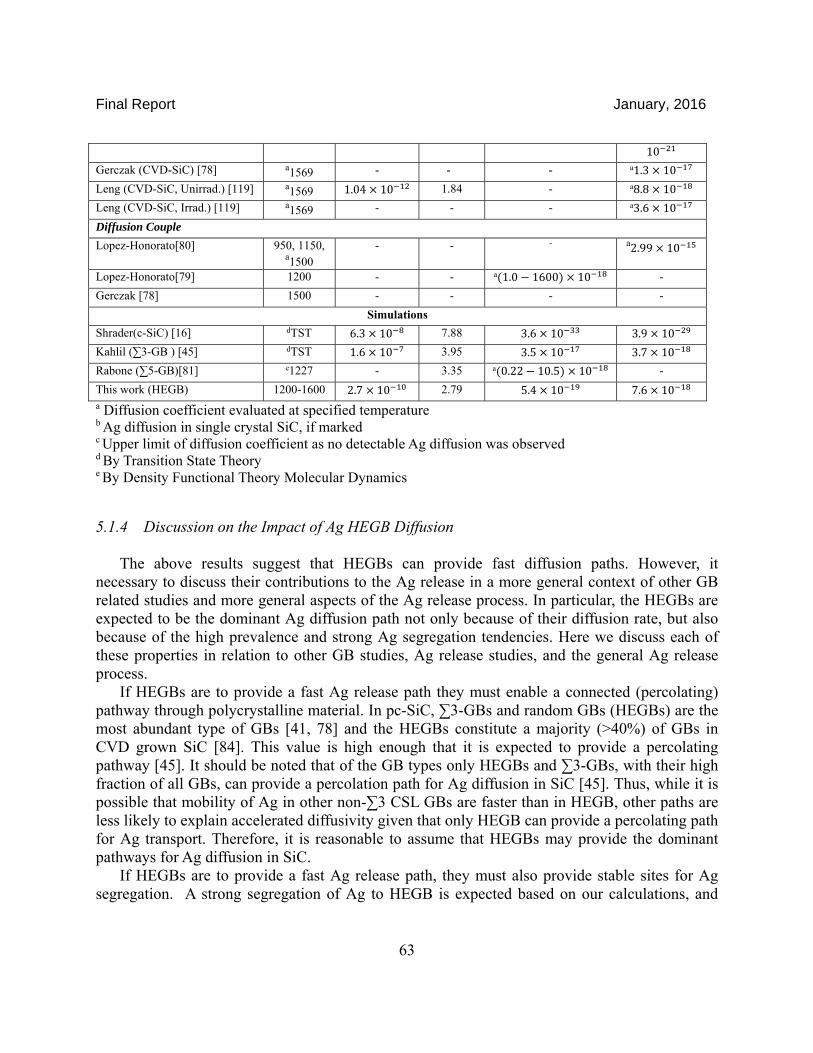
Final Report January, 2016
63
10
Gerczak (CVD-SiC) [78] a1569 - - - a1.3 × 10
Leng (CVD-SiC, Unirrad.) [119] a1569 1.04 × 10 1.84 - a8.8 × 10
Leng (CVD-SiC, Irrad.) [119] a1569 - - - a3.6 × 10
Diffusion Couple
Lopez-Honorato[80] 950, 1150, a1500
- - - a2.99 × 10
Lopez-Honorato[79] 1200 - - a(1.0 − 1600) × 10 -
Gerczak [78] 1500 - - - -
Simulations
Shrader(c-SiC) [16] dTST 6.3 × 10 7.88 3.6 × 10 3.9 × 10
Kahlil (∑3-GB ) [45] dTST 1.6 × 10 3.95 3.5 × 10 3.7 × 10
Rabone (∑5-GB)[81] e1227 - 3.35 a(0.22 − 10.5) × 10 -
This work (HEGB) 1200-1600 2.7 × 10 2.79 5.4 × 10 7.6 × 10 a Diffusion coefficient evaluated at specified temperature b Ag diffusion in single crystal SiC, if marked c Upper limit of diffusion coefficient as no detectable Ag diffusion was observed d By Transition State Theory e By Density Functional Theory Molecular Dynamics
5.1.4 Discussion on the Impact of Ag HEGB Diffusion
The above results suggest that HEGBs can provide fast diffusion paths. However, it necessary to discuss their contributions to the Ag release in a more general context of other GB related studies and more general aspects of the Ag release process. In particular, the HEGBs are expected to be the dominant Ag diffusion path not only because of their diffusion rate, but also because of the high prevalence and strong Ag segregation tendencies. Here we discuss each of these properties in relation to other GB studies, Ag release studies, and the general Ag release process.
If HEGBs are to provide a fast Ag release path they must enable a connected (percolating) pathway through polycrystalline material. In pc-SiC, ∑3-GBs and random GBs (HEGBs) are the most abundant type of GBs [41, 78] and the HEGBs constitute a majority (>40%) of GBs in CVD grown SiC [84]. This value is high enough that it is expected to provide a percolating pathway [45]. It should be noted that of the GB types only HEGBs and ∑3-GBs, with their high fraction of all GBs, can provide a percolation path for Ag diffusion in SiC [45]. Thus, while it is possible that mobility of Ag in other non-∑3 CSL GBs are faster than in HEGB, other paths are less likely to explain accelerated diffusivity given that only HEGB can provide a percolating path for Ag transport. Therefore, it is reasonable to assume that HEGBs may provide the dominant pathways for Ag diffusion in SiC.
If HEGBs are to provide a fast Ag release path, they must also provide stable sites for Ag segregation. A strong segregation of Ag to HEGB is expected based on our calculations, and

Final Report January, 2016
64
results to date suggest this segregation is even stronger than for other CSL GBs. The formation energies for substitutional and interstitial Ag (Table 5.1) are significantly lower than the most stable states of Ag found for bulk (10.5 eV in AgTC). Similarly, the most stable interstitials in the HEGB (which are as low as -0.59 eV) are lower than the interstitial sites found in ∑3-GB (5.32 and 2.76 eV (both Ag-V clusters) [45]), and in a ∑5-GB (0.88 eV and 1.19 eV.) Ag therefore appears to be notably more stable in the HEGBs than bulk [16] or in other CSLs [45, 81], and thus Ag is expected to segregate to these GBs. This weak solubility in bulk SiC is consistent with the recent results of Hlatshwayo [59], who observed precipitates of implanted Ag in single crystal 6H-SiC after thermal exposure at T < 1300 °C, suggesting low bulk Ag solubility.
A useful assessment of the solubility energetics in our model is to predict Ag solubility and compare it to values estimated from experiments. The solubility of the Ag in SiC (concentration per unit volume at equilibrium) can be estimated in the non-interacting limit using the calculated formation energies of Ag defects.
Equation 5.2 BAg
1 B
exp( / )
(1 exp( / ))
inF
iii F
E k TC
E k Tρ
=
−= ×+ −
where i is the type of defect, ρi is the site density of defects of type i (number of sites per unit volume), and is the formation energy of the defect of type i. For i = Ag interstitial in HEGB, the solubility limit ( HEGB
AgC ) is calculated by considering the amorphous SiC unit cell studied
above and the n = 153 sites and their energies that were determined to be the effective stable Ag interstitial sites in that cell. For each interstitial site, we used a site density (ρi) value of (1 site / a-SiC cell volume). The Ag solubility limit in the HEGB ( HEGB
AgC ) from Ag metal is predicted by
this approach to be 4.60×1027 m-3 at 1200 °C, and 4.59×1027 m-3 at 1535 °C. The use of the Ag metal reference case is relevant for any situation where metallic Ag is in excess, e.g.,during ion implantation. Using the atomic density of the a-SiC cell used in this study, the total concentration of atoms in HEGB can be estimated to be about 8.96×1028 GB-atoms/m3. Taking the ratio of GB Ag solubility to GB atomic density, we can estimate that the Ag solubility is about 5.1 at. % (i.e., about 0.051 Ag for a Si or C) in the HEGB. From Equation 5.2, the Ag solubility limits in sc-SiC and Σ3-GB are calculated as Bulk
AgC =3.00×10¹⁰ m-3 and 3AgCΣ = 3.80×10¹⁸ m-3 at 1200 °C, and
BulkAgC =7.08×10¹³ m-3 and 3
AgCΣ = 2.30×10²⁰ m-3 at 1535 °C. The BulkAgC and 3
AgCΣ
are calculated
based on the neutral defect formation energies in Ref [16, 45], and these values are consistent with reported values [45]. It can be seen that the Ag solubility in GBs are significantly higher than in sc-SiC, specifically ×108 for Σ3-GB and ×1017 for HEGB at 1200 °C. These solubility limit differences are consistent with the Ag strongly segregating to GBs, especially to HEGBs.
The GB solubility can be compared to experimentally measured (net) solubility from pc-SiC. In Ag-implanted SiC diffusion studies, the Ag solubility limits measured at 1535 °C are 4.80×10²² m-3 [44] and 3.61×10²² m-3 [119]. Note that these are the net solubilities, including

Final Report January, 2016
65
contributions from crystalline regions and all GBs. The net solubilities ( AgnetC ) are higher than
BulkAgC by a factor of about 109. This comparison indicates that the net solubility cannot be solely
explained by the bulk solubility, and is consistent with our above argument of a strong Ag segregation to GB. If the net solubility is converted into a GB solubility by assuming all the Ag is in GBs, then the GB solubility at 1535 °C is estimated from these experiments as 1-2 % atomic fraction of GB-atoms (as discussed in Ref. [119]). If we further assume all the Ag is in HEGBs, which make up about half the GBs, then this value suggests a HEGB Ag solubility of 2-4%, which is is remarkably good agreement with the estimate from our calculations. While this level of quantitative agreement is almost certainly fortuitous, the qualitative agreement supports the both our ab initio energetics and the model that Ag is predominately present in, and therefore transported by, HEGBs, at least in typical ion implantation studies.
It is important to note that the above model for predicting Ag solubilities assumes no Ag-Ag interactions. While such as assumption is not unreasonable at just a few percent concentration, it is not clear this is overall a good approximation. We estimated the qualitative effect of Ag-Ag interaction by examining formation energies of two interstitials in the system and comparing that to their single isolated interstitial energies. Sets of two interstitial sites have been picked so the Ag-Ag distance is within 5.0 Å. For these calculations the presence of another Ag nearby increased the formation energy by about 1.4-2.0 eV/Ag. The increase in formation energy indicates that there is a significant interaction which will reduce Ag solubility relative to the predictions of the non-interacting model above. More work on a Ag solubility model including Ag-Ag interactions is therefore needed for more quantitative predictions of Ag concentrations in HEGBs.
This work has provided the first guidance on the specific transport properties of HEGBs and suggests that these GBs are a good candidate for being the fastest Ag diffusion paths among different GB types. To further explore whether HEGBs are in fact the dominant mechanism, the DHEGB is compared to previous studies on other mechanisms and rates of Ag diffusion in SiC. A DFT study by Shrader et al. [16] showed extremely low Dbulk values (3.9×10⁻²⁹ m2 s−1 at 1600°C), suggesting that the GB diffusion is far more important than bulk diffusion, at least in the unirradiated materials. Study on Ag diffusion in a low angle ∑3 CSL grain boundary by Khalil et al.[45] has shown a relatively fast diffusion compared to Dbulk, but still slower than our DHEGB in the range of temperature considered, 1200-1600°C. At 1600 °C, the ratio of DHEGB to DΣ3-GB is close to one, but our result indicates this ratio will increase as the temperature is lowered due to the difference in activation energies. In contrast, Rabone et al.[81] predicted a range of D∑5-GB to be higher than DHEGB as shown in Fig. 5.6, but their results shows inconsistency with both integral release (open symbols) and ion implantation measurements (non-triangle filled symbols). In fact, there are some potential sources of errors in the approach taken by Rabone et al. [81]. They extracted a migration barrier from a Ag hop in molecular dynamics, which hop was identified from the trajectory and from the change in potential energy. In this approach a single energy barrier for the Ag interstitial hop is used to extract D from the Arrhenius relation. However, it is not clear that this hop is fully representative given that the total

Final Report January, 2016
66
energies of the system before and after the hop were found inconsistent. Thus we take D from Rabone et al. to be an upper bound for the diffusion in ∑5-GB, as other larger barriers might exist. Although the data is very limited, from the comparison of reported Ds, Ag in HEGB is expected to diffuse at similar rates or faster than other GB or bulk mechanism in pc-SiC, except perhaps in the ∑5-GB.
In the above arguments, we showed that the HEGBs can provide percolating, highly soluble and fast pathway for Ag transportation. This hypothesis is also supported by experimental studies on Ag diffusion in sc-SiC and a-SiC. In a 6H sc-SiC [5, 27], no movement of Ag in SiC was detected at 1300°C [5] and 1500°C [27]. It was postulated that the Ag bulk diffusion is not fast enough to be observed on the experimental time scale, thus the upper bound of D values were estimated from the limited time of experiment. The slow Ag diffusion in sc-SiC is consistent with this work and other simulation studies [16, 45]. Particularly encouraging is that the Ag diffusion from amorphized 6H-SiC by Hlatshwayo [59] shows a quantitatively good agreement with our predictions for a-SiC. The agreement with Ag diffusion in amorphized 6H-SiC experiments not only supports the fast diffusion of Ag in disordered HEGBs but also suggests that the stochastic approach utilized in this work is indeed capable of reproducing realistic Ag transport.
It is useful to compare the DHEGB to net diffusion coefficients in the pc-SiC to assess whether they support HEGB diffusion being the dominant mechanism in pc-SiC. As it can be seen from Fig. 5.6, DHEGB shows a good agreement with D values of the recent ion implantation experiments (non-triangle filled symbols) [5, 44, 78, 119] on 3C-SiC. The discrepancies with the existing non-irradiated experimental data on pc-SiC are within about a factor of ten, except the diffusion couple studies by López-Honorato et al.[79, 80]. They reported D value that is 3 orders of magnitude higher than DHEGB, and in fact these values are close to integral release measurements (Fig. 5.6, open symbols) [37, 48, 49, 61, 62, 82, 83]. In the studies of López-Honorato et al. Ag diffusion was observed with SEM in a heat-treated diffusion couple, where a layer of silver was trapped between CVD-SiC layers. The fast diffusion observed perhaps owes to the higher concentration of Ag, which may support some form of accelerated Ag transport, e.g., through a dissolution type mechanism [73]. Similarly in the Ag/SiC vapor diffusion couple at 1500 °C, Gerczak [78] observed localized dissolution of condensed Ag at SiC surface and Ag penetrated into bulk in Ag-Si corrosion form, not by impurity diffusion kinetics. As the Ag concentration in these experiments is much higher than the expected Ag concentration in the SiC layer of TRISO particles [37, 49] the implications of these results for the TRISO particles is not entirely clear.
There is a 2-3 orders of magnitude difference between our predicted DHEGB and the D from integral release measurements in the relevant temperature ranges of 1200-1600 °C. Compared to integral release measurements, other ion implantation experimental observations of Ag diffusion also exhibit a low value, quite consistent with our calculations. These experiments and our calculations are different from the integral release measurements in multiple ways, but perhaps the most obvious difference is that these experiments and our calculations do not involve irradiation. Therefore, we believe that the predicted DHEGB is an approximate upper bound for the

Final Report January, 2016
67
effective diffusivity in unirradiated pc-SiC. As just mentioned, integral release measurements show a clear discrepancy in diffusion rates
when compared to most of the other studies, including both experiments (typically ion implantation) and modeling. The discrepancies are likely due to a combination of different factors. However a reasonable explanation for the disagreement of D values between integral release measurements, and ion implantation experiments and models is that irradiation affects Ag diffusivity in SiC. In general, radiation enhanced diffusion (RED) has been widely observed in metallic nuclear materials and semiconductors [120-122]. These irradiation effects, if they are occurring, must involve coupling over time as the integral release experiments are generally performed by heating samples that were irradiated previously, so the release is measured long after the irradiation has occurred. It is not clear how the irradiation, especially prior irradiation, might enhance the Ag transport, but below we discuss some possible mechanisms.
Irradiation of SiC not only results elevated point defect concentration but also develops complex defect structures such as interstitial clusters, dislocations, and voids. Irradiation-induced defects may activate different diffusion mechanisms to create radiation enhanced diffusion (RED) of Ag, and this might take place in both bulk and GB regions. In irradiated SiC, however, it is likely that GB RED is responsible for the observed fast diffusion of Ag instead of bulk RED, based on the following argument. From earlier discussion we have shown that the Ag solubility in bulk expected to be low, and an extremely strong segregation towards GBs is predicted. Therefore, even if RED occurs in the bulk, the Ag will quickly end up trapped in GBs, which will then provide the dominant diffusion mechanism. Consistent with the hypothesis that the irradiation effects are dominated by RED in GBs, we showed in Section 3 (also Ref. [119]) that the sc-SiC does not show any enhanced Ag transport after irradiation, while irradiated pc-SiC clearly shows RED of Ag at 1400-1569 °C. These arguments support the hypothesis that GB RED may bridge the discrepancy of Ag diffusivity between integral release and other reported values. However, there is limited understanding in the possible mechanisms for RED in SiC GBs. In the following Section 5.2, we propos a Ag kickout mechanism [119], that can be active in GBs with crystalline qualities.
5.2 Radiation Enhanced Diffusion
Depending on irradiation temperature and fluence, different defect structures (such as vacancies, interstitials, interstitial clusters, dislocation loops, and voids) can develop inside of SiC during irradiation [123]. These irradiation-induced defects may change both bulk diffusivity and GB diffusivity of Ag and lead to radiation enhanced diffusion (RED). In general it is unlikely that the observed RED of Ag is through a bulk mechanism, i.e., although bulk diffusion might be enhanced it is not likely that this mechanism is dominant. First, such a mechanism would require significant amounts of Ag dissolved in the bulk SiC lattice. Calculations from Shrader, et. al. [16] showed that Ag solubility in bulk SiC is extremely low, suggesting that Ag in single crystal SiC and in grains within polycrystalline SiC could reside primarily in Ag precipitate clusters. This hypothesis is consistent with recent experimental studies from Hlatshwayo [59], who found precipitates of implanted Ag in single crystal 6H-SiC after thermal

Final Report January, 2016
68
exposure at T<1300°C. In addition, the extremely strong GB segregation predicted by ab initio studies [45, 124] implies that even if bulk diffusion were accelerated under irradiation, Ag would rapidly become trapped at GBs and the GB diffusion would dominate any transport in a polycrystalline material. The absence of any bulk RED for Ag is consistent with our results in Section 3, where the single crystal SiC does not show any enhanced Ag transport after irradiation.
The possible sources of RED in SiC GBs are difficult to analyze due to their structural complexity, but we here provide some qualitative considerations of possible mechanisms. For GBs with significant crystalline qualities (these are most obviously low angle or coincident site lattice GBs, but also perhaps some regions of more disordered GBs) it is expected that mechanisms can be at least qualitatively described by a model that treats the local structure as crystalline. Within that approximation, we considered what mechanisms might accelerate Ag diffusion in a crystalline environment, with the idea that these mechanisms might provide RED for some types of GBs. We assume at the outset that these crystalline-like GB environments have enough disorder that there is sufficient Ag solubility for it not to cluster into Ag metal precipitates, as it is likely to do in pure bulk. The stability of substitutional Ag and the barriers for Si and C vacancy mediated diffusion [16] suggest that substitutional diffusion of Ag is likely to be slow, and that facile Ag motion in a crystalline environment is most likely through some form of Ag kickout mechanism to access fast Ag interstitial motion. Such a mechanism has been seen previously for other elements in crystalline SiC. For instance, it was shown in Refs [113, 125] that irradiation of SiC may enhance the bulk diffusivity of boron through the kick-out reaction + → , where intrinsic interstitials kick out impurity atoms from substitutional sites to interstitial sites . A detailed model of possible kickout mechanisms which might be active during integral release experiments is given in following sections.
5.2.1 Kickout Reactions as a Possible RED Mechanism
Ag integral release experiments to date typically involve heating an irradiated SiC material often hundreds or thousands of hours after irradiation [32, 48, 49, 61, 62, 83, 126]. Therefore, any model to explain Ag integral release experiments in terms of RED must include a mechanism by which irradiation can alter the kinetics after the irradiation has long-since stopped. Excess vacancies are likely available in irradiated SiC after irradiation and commonly lead to RED in metals (e.g., see Ref. [127]). However, a study from Shrader et al.[16] has shown that high intrinsic VSi and VC hopping barriers (approximately 2.70 eV, and 3.66 eV) mean Ag diffusion by vacancy mechanisms is expected to be quite slow even in the presence of greatly enhanced vacancy concentrations, and unlikely to provide the relatively low 2-3 eV activation energy observed in integral release experiments. An alternative possible mechanism of RED is Ag diffusion as an interstitial after being kicked out from its most stable substitutional position by a Self-Interstitial (SI). This mechanism is consistent with the fast Ag interstitial (notated as AgTC, tetragonally coordinated by C) diffusion predicted by Shrader et al. [16]. Although few

Final Report January, 2016
69
free SI will survive after irradiation, BSDs, which are speculated to be SI clusters, develop during radiation [56]. BSDs are quite stable, and will persist long after irradiation. These BSDs can be dissolved into interstitials [128] at the typical integral release experiment annealing temperature of >1200 °C, providing a source of SIs to kick out Ag in GBs and enable Ag motion. To assess if the kickout model for Ag RED is plausible we need to consider if the following quantities are consistent with the observed Ag diffusion: (i) the number of SIs provided by the BSDs, (ii) the rate SIs are generated by dissolving BSDs, and (iii) the rate of SI kickout reactions.
5.2.2 Self-Interstitial as a Source for KickoutRreactions
First the concentration of available SIs is taken into consideration. From simple geometric arguments we can approximate the SI concentration when disk-shaped BSDs are fully dissolved into SIs by C (at/m ) = C (1/m ) × 2π (m) × (at/m) , where CSI and CBSD are number densities of SI (either a C or a Si) and BSD, is the average diameter of BSD, and is the bond length of SiC in bulk (156 pm). Here we assume that the SI density in BSDs is the same as that of Si and C in SiC. In Table 5.4, TEM observations on BSD concentration and size from Ref [39, 129] are summarized, and the SI concentrations are estimated for each set of data under the assumption that the BSDs are fully dissolved. The CSI for neutron and self ion irradiations are approximately expected to be 1×1024-1×1026 at·m−3. In particular, CSI for C+ irradiated 4H-SiC, which was irradiated under conditions similar to those used in this study (similar radiation source, temperature, and dpa), is estimated to be 2.6×1024 at·m−3 [129]. The C+ irradiated 4H-SiC data will be used for the present analysis as it is the available data with the most similar irradiation conditions to the experiments performed here. However, note that all values for CSI in Table 5.4 are larger than this value, so this value provides a lower bound within the data we have collected. This exercise shows that the estimated CSI is greater by two orders of magnitude than the Ag solubility limit measured in our ion implantation experiment (~ 1×10²³at·m−3), and greater by five orders of magnitude than Ag TRISO particle content measured before annealing in integral release measurements (1018-1019 at·m−3) [37, 49]. Also the irradiation condition of post-irradiation experiments [32, 48, 49, 61, 62, 83, 126] and our ion-implantation measurements are within reported BSD forming region reported in Ref. [39]. It is therefore reasonable to surmise that these experiments led to BSD formation and that these BSDs can provide a significant interstitial source during annealing. These results demonstrate that enough SI can be liberated from BSDs during post-irradiation annealing to potentially enable kicking out of every dissolved Ag many times over, supporting our hypothesis of SI enabled RED. It should be noted that the BSD dissolution rate and SI concentration can be different from one experiment to another, since they may have developed differently depending on the irradiation condition.

Final Report January, 2016
70
Table 5.4 Measured density and size of BSD in neutron and Si ion radiated SiC [39, 129]. The concentration of self-interstitials is estimated based on the geometry of BSD.
Reference Implanted particles
Irradiation Temperature
()
Fluence (dpa)
BSD Size(nm)
BSD Density (1/m )
Estimated CSI (at/m )
Katoh, et al. [39]
Neutron(3C-SiC)
300 6 1.0 2.2×1024
3.7×1025
800 4.5 2.6 2.6×10²³
1.1×1025
800 7.7 3.0 3.3×10²³
1.7×1025
Silicon(3C-SiC) 1000 10 4.0 2.6×10²³
1.8×1025
1400 10 10.0 2.3×10²¹
3.9×10²³
He, et al. [129]
Neutron(3C-SiC) 300 10 1.1 1.20×1024
2.2×1025
300 7 1.0 2.10×1024
3.6×1025
500 7 1.9 7.80×10²³
2.5×1026
Carbon(3C-SiC) 600 0.5 1.3 5.00×10²³
1.1×1025
Carbon(4H-SiC) 1000 0.5 1.4 1.10×10²³
2.6×1024
Now we estimate the rate of BSD dissolution and associated release of Sis, which is an
important factor to determine whether the SI mediated RED of Ag can be active during annealing experiments. The dissolution rate ( dissolutionv ) for an n-atom cluster can be estimated from a simple model for thermally activated emission and diffusion away of the interstitials in the cluster into an infinite medium with no significant interstitial concentration (see Equation 5.3, taken from Ref. [130]). This model must be parameterized by specific properties of BSD observed in carbon irradiation experiments, and we choose those for the 4H-SiC (Table 5.4) due the similarity of irradiation conditions to this study. The SIA-clusters are assumed to be in the form of a disc plate and to be stoichiometric, which is the most stable composition [131]. Adapting the derivation of geometric reaction factor between a spherical-cluster and point defects, the thermal dissociation rate for disc-shaped clusters to emit i (Si or C) interstitial,
vdissolution , can be written as [128]
Equation 5.3 2
1D
0
2( ) exp( / ( T))
ln( / )dissolution
i i Bi m
dv s D E k
r r
π− = −ΔΩ

Final Report January, 2016
71
where Di is the diffusion coefficient of interstitial i in matrix, r0 is the dislocation core radius and is the half of the distance between dislocations. is the average diameter of BSD, and 2 = is given for the disk-shape cluster where is the covalent bond radii between Si and C. Ωi is the atomic size of element i, kB is the Boltzman constant, T is the annealing temperature, and ΔED is the binding energy of an interstitial to an SIA-cluster. The binding energy of interstitial can be calculated as ΔED=EF (n-1) + EF (1) ˗ EF (n) [132] where EF(n) is the formation energy of n-atom SIA cluster and Ei is the formation energy of a single interstitial in a perfect crystal of 3C-SiC (taken as EC = -3.24 eV, and ESi = -3.17 eV [132]). The EF(n) are taken from the atomistic simulations based model developed by Watanabe, Morishita [131], which gave EF(n)=0.96n1+2.37n1/2. It should be noted that the defect formation energies in SiC, calculated by different potentials, have shown inconsistency with each other. Also a recent first principle calculation work by Jiang et al. [133] had shown the empirical potential may not be capable of predicting the correct energetics or structures of small carbon interstitial cluster. Hence, the correct formation energy model, even for larger interstitial clusters, may deviate from what was proposed by Watanabe et al. [131]. However, there is very limited knowledge of the free energy of SIA clusters, so we will follow the model from Watanabe, Morishita [131].
The BSD is assumed to maintain the SiC stoichiometry, and we can therefore apply Slezov’s multi-component system scheme to Equation 5.3 to get:
Equation 5.4 c Si
2
1C Si
0
2 ( 1) ( ) ( ) exp( ) ( )
Tln( / )eff x xdissolution F F
eff
Bm
d E n E n Ev s D C C
kr r
π− + − −= ⋅Ω
where and are the effective diffusion coefficient and an interstitial formation energy
for Si and C (11 1
C, matrix C, matrix Si, matrix Si, matrix4 ( ) ( )effD x D x D−− − = + , and C C Si Si[ ]effE x E x E= + ). Ω
is the average atomic volume of Si and C, Ci is the concentration of element i in bulk (CC=CSi=0.5), Ci, matrix is the i interstitial fraction in matrix, and Di, matrix is the diffusion coefficients in the matrix, where DC=(9.57×10⁻⁸ m2s-1) × exp(-0.78 eV/kBT) for C interstitials and DSi=(9.57×10⁻⁸ m2s-1) × exp(-1.58 eV/kBT) for Si interstitials. The migration barriers associated with interstitial diffusion are taken from Watanabe, Morishita [132].
In this approach it is assumed that the dissolution process to liberate interstitials from BSDs is a non-equilibrium reaction and is not kinetically hindered at such high annealing temperature. Once interstitials are dissolved they are presumed to diffuse away in this model. The total concentration of dissolved SI in the system is estimated by integrating v-1 when the irradiated SiC is annealed for a period of time. In Fig. 5.8, the dissolved concentration of SI after 20, 200, and 2000 hrs annealing is predicted. The Ag solubility limit measured in this work is also shown. For SI kickout to enable RED of Ag there must be significantly more SIs than Ag dissolved in the SiC. For the annealing experiment in this work of 10 and 20 hours, the produced SI concentration is predicted to be lower than the Ag solubility limit. The analysis of SI concentration therefore indicates that the RED by Ag kickout reactions may show a very small

Final Report January, 2016
72
effect on the Ag distribution in this experimental work, consistent with what is observed. However, in the integral release experiments, the annealing time typically ranges from hundreds to thousands of hours [32, 48, 49, 61, 62, 83, 126]. Therefore SI concentrations in the integral release experiments are expected to be higher than Ag dissolved in SiC under given conditions and RED may occur.
Figure 5.8 The SI concentration dissolved from BSD as a function of annealing temperature and annealing time (for 20, 200, and 2000 hours). The SI concentration is estimated using properties of BSD measured in C+ irradiated 4H-SiC. The SI concentration when the BSD is fully dissolved is denoted with a dash-dot line. The Ag solubility limit at about 1569°C is shown with black dot, and a guide to the eye is provided by the dotted line.
5.2.3 Kickout Reaction Rates
The next issue to explore in considering SI enabled RED is if the reaction rates for key steps in Ag kickout are fast enough to observe significant diffusion of Ag during annealing integral release experiments. The reaction rates will depend on the reaction barrier and energies of reactants and products. The change in enthalpy (∆E=∑Eproducts−∑Ereactants) and reaction activation barrier (EA) are shown for each relevant reaction in Table 5.5. Note that enthalpies and energies are taken as interchangeable under the assumption that we are working at 1 atm pressure. In this study, the products of reactions are assumed to be isolated defects that are not bound, and any binding energies of defects are not considered. This approach assumes that binding and unbinding of defects is not rate-liming. One exception to this assumption is binding of kicked out

Final Report January, 2016
73
Ag interstitials to any defects left after the kickout reaction, as this binding could greatly alter the ability of interstitial Ag to diffuse.
In Table 5.5, R.1-4 SI reactions with AgSub-V, the most stable Ag defect in bulk SiC (Ef=5.32 eV) [16], are calculated. These reactions are not to kick out the Ag but merely to assess if the SI can easily and favorably fill a vacancy site, leaving just substitutional Ag (AgSub). The structure of AgSub-V (notated asAg – V in Ref [16]) is that a Ag sits in between C and Si vacancy. Therefore the reactions are dependent on the orientation of SIs (e.g., C interstitial next to C vacancy (R.1) and C interstitial next to Si vacancy (R.3) will result different reaction energetics). In the R.3, the silicon interstitial relaxed on the carbon vacancy site instantly when two defects began to interact with each other, and formed Ag – Si with nearly zero reaction barrier. The reaction barriers for R.1, R.2, and R.4 are calculated as 1.07, 0.24, and 1.75 eV respectively. All reactions (R.1-R.4) were exthothermic (∆E< 0) and substitutional Ag defects are formed, with or without antisite defects depending on the reaction. We found that, for all SI reactions with AgSub-V, the SI tends to fill a vacancy site to minimize total defect formation energy, with the specific site filled depending on the SI species and orientation. The products of these reactions (AgSub from R.1 and R.4, and AgSub−antisite from R.2 and R.4) cannot be directly related to fast release of Ag as they are largely immobile [16]. However, we found these products can further react with SI through a kickout reaction to create Ag interstitials that can contribute to Ag diffusion.
The Ag kickout reactions by SIs are next investigated. Following Ref [16], we notate the final stable Ag interstitial, which sits in the tetrahedral site surrounded by C, with AgTC. The essential reactions to produce AgTC are shown as R.5-R.12 in Table 5.5. R.5-R.8 show the reaction between SIs and substitutional type Ag defects, which not only are the next most stable defect type for Ag in SiC [16] but also are products of R.1-R.4, as discussed above. The reactions R.9-R.12 show kickout reactions of substitutional Ag that are bound to antisites, which are also products of R.1-R.4. For all kick-out reactions R.5-R.12 the activation barriers range from about 2-5 eV. The reactions for substitutionals Ag on the carbon lattice (2.11 eV for R.5, and 2.71 eV for R.6) had lower activation barriers than those for substitutionals Ag on the silicon lattice (3.35 eV for R.7, and 5.14 eV for R.8). Except R.8, the formation of AgTC by kickout of an isolated AgSub is overall energetically favorable. For R.9-R.12, where Ag is next to an antisite, the reaction barriers for Ag kickouts are 1.57, 0.88, 0.34, and 0.01 eV. These reaction barriers are calculated to be lower than kickout barrier for substitutional Ag (R.5-R.8). However, it was found that the interstitial Ag next to an antisite defect formed a bound defect cluster of Ag with the antisite defects (a Ag – Antisite cluster). We define the binding energy of these clusters (Eb) as the energy of the cluster minus the energy of the antisites in the same positions as in the cluster and the energy of the AgTC isolated from the antisites (i.e., the products minus reactants for AgTC + Antisite → AgInt – Antisite cluster). The AgInt–Antisite cluster binding energies were -3.12 eV for the product of R.9 and -3.83eV for the product of R.12. Therefore, forming these AgInt–Antisite clusters are unlikely to result in mobile Ag. For these cases, Ag atoms are likely to be trapped in a defect cluster and remain immobile. The AgInt–Antisite binding energies are only -0.63eV and -0.45 eV for the product of R.5 and R.10, and positive for the product of R.11 therefore long-term significant Ag trapping would not occur for these reactions.

Final Report January, 2016
74
Table 5.5 Reactions between SIs and most stable Ag defects in bulk. The reaction activation barriers (EA) and the change in enthalpies (∆E=Eproduct-Ereactant) are calculated for each reaction.
* The products of these reactions actually form bound Ag interstitial – antistite (AgInt–Antisite) clusters, in some cases with significant movement of Ag off the AgTC position and energy stabilization. Please see text for details. ** The binding energy (Eb) of Ag interstitial – antistite (AgInt–Antisite) clusters, defined as products minus reactants for AgTC + Antisite → AgInt–Antisite cluster.
A number of reaction paths to kick out Ag from a substitutional site can be identified from Table 5.5. For all types of stable Ag defects considered here, we have discovered a number of energetically favorable reaction paths to kick out Ag and form AgTC. For each path, we summarized the rate-limiting barrier (ER) and the total change in the free energy (∆Et) when forming AgTC from initial point defect energies. Once the unbound Ag interstitial is formed, we are approximating the migration barrier for AgTC to be equal to the AgTC migration barrier in bulk SiC, which is 0.89 eV. It should be noted that AgInt–Antisite clusters are often more stable than unbound AgTC (i.e., the binding energies (Eb) of bound state of AgInt–Antisite clusters are negative) and the paths which involve these clusters in their reaction are marked with '*' in Table 5.5. In these cases, only paths involving weakly bound Ag-Antisite clusters (R.5* and R.10*) are considered for favorable reaction paths as Ag atoms are rarely trapped.
Here, we explicitly consider the two-step reactions for transforming AgSub-V cluster into a mobile AgTC. These paths involve a first step where vacancy of AgSub-V defects are filled (R.1-R.4). The vacancy filling reactions are exothermic and have energy barriers < 1.75 eV, which are
Reac. # Reaction ∆ (eV) (eV)
R.1 (Ag–V) + C → Ag -5.63 1.07 R.2 (Ag–V) + C → Ag −C -1.66 0.24 R.3 (Ag–V) + Si → Ag −Si -3.93 - R.4 (Ag–V) + Si → Ag -6.63 1.75 R.5 * Ag + Si → Ag + Si -2.09 (-0.63**) 2.11 R.6 Ag + C → Ag -3.85 2.71 R.7 Ag + Si → Ag -4.86 3.35
R.8 * Ag + C → Ag + C 0.97 (-3.47**) 5.14 R.9 * (Ag – C ) + Si → Ag +Si + C 0.77 (-3.12**) 1.57
R.10 * (Ag – C ) + C → Ag +C -0.99 (-0.45**) 0.88
R.11 (Ag – Si ) + Si → Ag +Si -3.36 0.34
R.12 * (Ag – Si ) + C → Ag +Si + C 1.36 (-3.83**) 0.01

Final Report January, 2016
75
small enough that this fist step is never rate limiting. Then these paths have a second step where the substitutional Ag is kickout out. Here we list each possible path, labeled P.1 – P.5. (P.1) C interstitial reacts with AgSub-V to fill C sublattice. Then Si interstitial kicks out the AgSi to form AgTC (R1→R.7). ER= 3.35 eV. ∆Et= -10.49 eV. (P.2) C interstitial reacts with AgSub-V to fill Si sublattice. Then C interstitial kicks out the AgC-CSi to form AgTC (R.2→R.10*).ER= 0.88 eV. ∆Et= -2.65 eV. (P.3) Si interstitial reacts with AgSub-V to fill C sublattice. Then Si interstitial kicks out the AgSi-SiC to form AgTC (R.3→R.11). ER= 0.34 eV. ∆Et= -7.29 eV. (P.4) Si interstitial reactions with AgSub-V to fill Si sublattice. Then Si interstitial kicks out the AgC to form AgTC (R.4→R.5*). ER= 2.11 eV. ∆Et= -8.72 eV (P.5) Si interstitial reactions with AgSub-V to fill Si sublattice. Then C interstitial kicks out the AgC to form AgTC (R4→R.6). ER= 2.71 eV. ∆Et= -10.48 eV
Next, one-step reactions for transforming Agsub, the second stable Ag defect, to form mobile AgTC are considered. These paths involve a single step where the substitutional Ag is kicked out (analogously to the second step in the above two-step reactions) and they are labeled P.6 – P.8. (P.6) Si interstitial kicks out AgC to form AgTC (R.5*). ER = 2.11 eV. ∆Et= -2.09 eV. (P.7) C interstitial kicks out AgC to form AgTC (R.6). ER = 2.71 eV. ∆Et= -3.85 eV. (P.8) Si interstitial kicks out AgSi to form AgTC (R.7). ER = 3.35 eV. ∆Et= -4.86 eV.
From the above discussion, we have shown that there are paths with barriers in the 0-4 eV
range (which can be overcome at TRISO integral release experiment temperatures) for AgSub-V and AgSub to be kicked out and to form Ag interstitials, including both types of reacting Ag defect and SI species. Based on the thermal equilibrium concentration of Ag defects, which favor AgSub-V clusters, (P.1), (P.4) and (P.5) are most likely reaction path to kick out Ag as they all begin with this cluster. When AgSub-V interacts with SIs it can readily form substitutional Ag with no vacancies nearby, which can then be kicked out. When following this path the AgSub-V clusters can be kicked out to form interstitial Ag with barriers of 3.35, 2.11 and 2.71 eV for (P.1), (P.4) and (P.5), respectively (see Fig. 5.9). Although there are possible reactions that lead to Ag trapping due to a high reaction barrier (e.g. R.1→R.8) or a strong binding energy as an AgInt-Antisite cluster (e.g., R.1→R.8*, R.2→R.9*, R.3→R.12*, and R.8*), the fraction of kicked out Ag is expected to be greater than trapped Ag as the substitutional Ag concentration is likely much larger than the AgSub-Antisite concentration. Once AgTC is formed, Ag can again form substitutional Ag since AgC or AgSi are more stable than AgTC. However the reaction barrier for AgTC to form substitutional on C site is 3.91 eV and on Si site is 2.98 eV, which is substantially higher than the AgTC migration barrier of 0.89 eV. Thus Ag kicked out into the interstitials state is expected to diffuse quite far before being trapped again as a substitutional defect. The suggested barriers of 2.11-3.35 eV from reactions (P.1, P.4, and P.5) are comparable with the range of the effective activation barriers measured in integral release measurements, 1.84-4.24

Final Report January, 2016
76
eV [32, 48, 49, 61, 62, 83, 126], and the generally accepted value of 2.28-2.70 eV [134]. While the success of this model is suggestive, the hypothesis is still quite speculative and needs further validation. In particular, the parameters used in this model were taken from 3C SiC as our primary comparisons were to integral release experiments done on 3C material. However, the data in the present paper is taken on 4H SiC and a quantitative assessment of the present results would require evaluating all parameters for 4H. Furthermore, this model treats only processes in a perfect crystalline environment. A generalization of these studies to more realistic GB environments would be necessary to more fully assess the ability of these mechanisms to drive RED of Ag in GBs.
Figure 5.9 The rate-limiting barriers for Ag migration in the irradiated (Red) and unirradiated (Blue) SiC. Only the most stable Ag defects are shown here. In irradiated SiC, Ag kickout barriers are rate-limiting barriers as the migration barrier of Ag is 0.89 eV. In unirradiated SiC, reorientations of defect complexes are the rate limiting barriers [16].
5.2.4 Discussion on Radiation Enhanced Diffusion Mechanism
In the previous sections we have shown, from both experiment and modeling, that radiation can enhance Ag release through SiC. Based on these results, here we discuss a possible effect of radiation on diffusion mechanism of Ag in single-crystal and polycrystalline SiC.
In the Section 5.2, we discussed a possible mechanism for RED, which is the kickout of substitutional Ag by SIs. This process would be expected to occur in both in GB and crystalline bulk environments. However no RED of Ag is seen in our single crystal 4H-SiC experiments

Final Report January, 2016
77
(see Section 3). We interpret the lack of RED in the single crystal as being due to the low solubility of Ag in a crystalline region (see estimations on Ag solubilities in Section 5.1.4) allowing for only insignificant substitutional concentration of Ag ions available for kickout. Thus the present kickout model is relevant for regions where Ag energetics is sufficiently altered from bulk single crystal to allow for significant substitutional Ag, but similar enough to crystalline to allow crystalline energetics to provide qualitative guidance on possible mechanisms.
In Section 5.2.2, we discussed the possibility that interstitial clusters formed under irradiation can dissolve under post-irradiation annealing, providing the source of C interstitials, which in turn kick out substitutional Ag and lead to RED. We have argued that the interstitials from this dissolution process are sufficient in number to enable significant Ag transport, and that the resulting kickout mechanism has a barrier consistent with that seen in integral release experiments. While this picture is all quite speculative, our analysis suggests it is possible that some kind of kickout mechanisms supports RED of Ag through relatively ordered GBs and provides at least a qualitative insight into what processes might be occurring in crystalline-like regions. This mechanism of RED may explain the radiation effects on Ag observed in Section 3.
It is also of interest to consider possible effects of irradiation on highly disordered GBs, where a crystalline picture is unlikely to be a good approximation. For highly disordered GBs that can be considered approximately amorphous (high-angle GBs), the literature on RED in amorphous materials strongly suggests that RED is likely. Diffusivities of impurities in various disordered (amorphous) materials can be enhanced by orders of magnitude due to irradiation [135-141]. Specifically, irradiation may increase the pre-factor [135-137] or decrease the activation energy [138-141] of the impurity diffusivity, depending on the diffusion mechanism. Mechanisms proposed for amorphous RED include changes in mediating point defect concentrations [140], irradiation impacting collective diffusion [142], and coupling to free volume [141]. Any of these mechanisms could potentially enhance Ag diffusion under irradiation in high-angle GBs. Regardless of the difference in the experimental conditions and proposed mechanisms in above studies, the reported diffusivities in irradiated amorphous systems show an enhancement in D of typically by 1-3 orders of magnitude. If we apply this amount of enhancement to the recently calculated D in a model high-angle GB [124] (1.9×10-
18m2/s at 1500oC), the expected diffusion coefficients of Ag in the irradiated high-angle GB is comparable to that reported for integral release measurements (e.g., (1.5-35.9)×10-16m2/s at 1500oC). However, this scale of RED is significantly larger than observed in Section 3, and the magnitude of RED of Ag in SiC under different conditions requires further investigation. Although there are still many open questions about magnitudes and mechanisms, these observations on other amorphous systems suggest that RED of Ag through a percolating network of amorphous-like high-angle GBs may explain the observed radiation effects on Ag diffusion in SiC. Overall, we see that for both more crystalline and more highly disordered GBs there are possible mechanisms that could lead to RED for Ag.
5.3 Summary of Results from Atomistic Simulations

Final Report January, 2016
78
To understand Ag diffusion mechanism in SiC layer of TRISO fuel particles, we have assessed two questions with atomistic modeling: (i) “Is HEGB diffusion is responsible for Ag release through the polycrystalline-SiC?” and (ii) “Is there any possible RED mechanism that could account for the enhanced diffusion observed in irradiated SiC?”. To address the first question, Ag diffusion in HEGBs is simulated using a DFT based kinetic Monte Carlo (kMC) model. Ag in a HEGB is predicted to exhibit an Arrhenius type diffusion with diffusion prefactor and effective activation energy of (2.73 ± 1.09) × 10 m s and 2.79 ± 0.18 eV, respectively. The comparison between HEGB results to other theoretical studies suggests not only that GB diffusion is predominant over bulk diffusion, but also that the HEGB is one of fastest grain boundary paths for Ag diffusion in SiC. The Ag diffusion coefficient in the HEGB shows a good agreement with ion-implantation measurements, but is 2-3 orders of magnitude lower than the reported diffusion coefficient values extracted from integral release measurements on in- and out-of- pile samples. This discrepancy between our model and the diffusion observe in integral release experiments involving irradiation drove us to consider the second question above. In response to this question we proposed a possible kickout model for Ag diffusion in GBs with significant crystalline qualities. This model suggests that dissolution of irradiation generated defect clusters could drive mechanisms for Ag interstitial diffusion in crystalline-like GB, with rate-limiting barriers of 2.11-3.35 eV (5.49-9.1 eV in bulk SiC). While this picture is quite speculative, our analysis suggests it is possible that irradiation, even significantly prior to the annealing and Ag release experiment, supports a kickout mechanism that leads to RED of Ag through GBs.
6 Continuum model of diffusion through polycrystalline SiC
We have developed of a 3D kinetic Monte Carlo model of impurity diffusion along grain boundaries of a polycrystalline samples. The details of the model have been published in (Deng et al. Comp. Mater. Sci. 2014) and can be found in Appendix B. This model has been applied to evaluate diffusivity and release fraction of Ag in polycrystalline SiC. The effects of various grain boundary network properties on transport of Ag across the SiC layer have been examined, including fraction of each grain boundary type, spread in grain boundary diffusivities and distribution of grain boundary types. We found that the effective diffusivity and release fraction of Ag exhibit large variability due to changes in the GB structure of SiC, and this variability is almost independent of temperature fluctuation. Our results suggest that the variation in properties of grain boundary networks in SiC may contribute to the spread in the Ag diffusivity and release fraction measured in TRISO particles. It is also found that the grain boundary diffusion alone may be insufficient to account for the Ag diffusivities and release fractions measured in integral release experiments. Additional factors such as irradiation and temperature distribution may also play an important role in Ag transport across the SiC layer. The results have been published in (Deng et al J. Nucl. Mater. 2015) and can be found in Appendix B.

Final Report January, 2016
79
7 Publications resulting from this project [1] Cs and Ag co-incorporation in cubic silicon carbide, A. Londono-Hurtado, D. Morgan, I. Szlufarska, J. Nucl. Mater. 439, p. 65-71 (2013)
[2] Understanding Ag release from TRISO fuel through surrogate diffusion experiments and fuel analysis, T. J. Gerczak, PhD dissertation, University of Wisconsin – Madison (2013)
[3] Kinetic Monte Carlo simulations of effective diffusivities on grain boundary networks, J. Deng, D. Morgan, I. Szlufarska, Computational Materials Science 93, 36-45 (2014)
[4] Grain boundary diffusion of Ag through polycrystalline SiC in TRISO fuel particles, J. Deng, H. Ko, P. Demkowicz, D. Morgan, I. Szlufarska, J. Nucl. Mater. 467: 332-340 (2015)
[5] Effect of exposure environment on surface decomposition of SiC-silver ion implantation diffusion couples, T.J. Gerczak, G.Zheng, K.G. Field, T.R. Allen, J. Nucl. Mater. 456, 281-286 (6015)
[6] Observations of Ag Diffusion in Ion Implanted SiC, T.J. Gerczak, B. Leng, K. Sridharan, JL Hunter, AJ Giordani, TA Allen, J. Nucl. Mater. 461, 314-324 (2015)
[7] Effect of carbon ion irradiation on Ag diffusion in SiC, B. Leng, H. Ko, T. J. Gerczak, J. Deng, A. J. Giordani, J. L. Hunter, D. Morgan, I. Szlufarska, K. Sridharan, J. Nucl. Mater To be published (2016)
[8] STEM EDS Analysis of Fission Products in Neutron Irradiated TRISO Fuel Particles from AGR-1 Experiment, B. Leng, I. van Rooyen, Y.Q. Wu, I. Szlufarska, K. Sridharan, Submitted
[9] Ag diffusion in SiC high-energy grain boundaries: kinetic Monte Carlo study with first-principle calculations, H. Ko, J. Deng, I. Szlufarska, D. Morgan, Submitted
8 References 1. Madelung, O., U. Rossler, and M. Schulz, LN Volumes III/22B-41 A2b: silicon carbide
(SiC), solubility of impurities. 2015, Springer Materials. 2. Malherbe, J.B., Diffusion of fission products and radiation damage in SiC. Journal of
Physics D: Applied Physics, 2013. 46(47): p. 473001. 3. Gerczak, T.J., et al., Effect of exposure environment on surface decomposition of SiC–
silver ion implantation diffusion couples. Journal of Nuclear Materials, 2015. 456: p. 281-286.
4. Zhang, Y., et al., Damage profile and ion distribution of slow heavy ions in compounds. Journal of Applied Physics, 2009. 105(10): p. 104901.
5. Friedland, E., et al., Study of silver diffusion in silicon carbide. Journal of Nuclear Materials, 2009. 389(2): p. 326-331.

Final Report January, 2016
80
6. Friedland, E., et al., Investigation of silver and iodine transport through silicon carbide layers prepared for nuclear fuel element cladding. Journal of Nuclear Materials, 2011. 410(1-3): p. 24-31.
7. Hlatshwayo, T.T., et al., Annealing of silver implanted 6H–SiC and the diffusion of the silver. Nuclear Instruments and Methods in Physics Research Section B: Beam Interactions with Materials and Atoms, 2012. 274: p. 120-125.
8. Xiao, H.Y., et al., Near-surface and bulk behavior of Ag in SiC. Journal of Nuclear Materials, 2012. 420(1-3): p. 123-130.
9. Kuznetsov, A.Y., et al., Boron diffusion in Si and SiC during 2.5 MeV proton irradiation at 500–850°C. Nuclear Instruments and Methods in Physics Research Section B: Beam Interactions with Materials and Atoms, 1999. 148: p. 279-283.
10. Stolk, P.A., et al., Physical mechanisms of transient enhanced dopant diffusion in ion-implanted silicon. Journal of Applied Physics, 1997. 81(9): p. 6031.
11. Khalil, S., et al., Diffusion of Ag alongΣ3 grain boundaries in 3C-SiC. Physical Review B, 2011. 84(21).
12. Bockstedte, M., et al., The Nature and Diffusion of Intrinsic Point Defects in SiC. Materials Science Forum, 2002. 389-393: p. 471-476.
13. Lento, J.M., et al., Self-interstitials in 3C-SiC. Journal of Physics: Condensed Matter, 2004. 16(7): p. 1053-1060.
14. Hon, M.H. and R.F. Davis, Self-diffusion of14C in polycrystalline β-SiC. Journal of Materials Science, 1979. 14: p. 2411-2421.
15. Hon, M.H. and R.F. Davis, Self-diffusion of 30Si in polycrystalline beta-SiC. Journal of Materials Science, 1980. 15: p. 2073-2080.
16. Shrader, D., et al., Ag diffusion in cubic silicon carbide. Journal of Nuclear Materials, 2011. 408(3): p. 257-271.
17. Mattausch, A., M. Bockstedte, and O. Pankratov, Self Diffusion in SiC: the Role of Intrinsic Point Defects. Materials Science Forum, 2001. 353-356: p. 323-326.
18. Lévêque, P., et al., Vacancy and interstitial depth profiles in ion-implanted silicon. Journal of Applied Physics, 2003. 93(2): p. 871.
19. Pellegrino, P., et al., Separation of vacancy and interstitial depth profiles in ion-implanted silicon: Experimental observation. Applied Physics Letters, 2001. 78(22): p. 3442.
20. Pelaz, L., et al., B cluster formation and dissolution in Si: A scenario based on atomistic modeling. Applied Physics Letters, 1999. 74(24): p. 3657.
21. Gueorguiev, Y.M., et al., High-energy ion-implantation-induced gettering of copper in silicon beyond the projected ion range: The trans-projected-range effect. Journal of Applied Physics, 2000. 88(10): p. 5645.
22. Kögler, R., et al., Cu gettering in ion implanted and annealed silicon in regions before and beyond the mean projected ion range. Journal of Applied Physics, 2003. 94(6): p. 3834.

Final Report January, 2016
81
23. Gueorguiev, Y.M., et al., Impurity gettering by high-energy ion implantation in silicon beyond the projected range. Applied Physics Letters, 1999. 75(22): p. 3467.
24. Stolwijk, N.A., et al., Diffusion and solubility of gold in silicon. Physica B + C, 1982. 116(1): p. 335-342.
25. Chao, H.S., et al., Species and dose dependence of ion implantation damage induced transient enhanced diffusion. Journal of Applied Physics, 1996. 79(5): p. 2352.
26. Myers, S.M., Annealing behavior and selected applications of ion-implanted alloys. Journal of Vacuum Science and Technology, 1978. 15(5): p. 1650.
27. MacLean, H.J., et al., The effect of annealing at 1500°C on migration and release of ion implanted silver in CVD silicon carbide. Journal of Nuclear Materials, 2006. 357(1-3): p. 31-47.
28. Rabone, J., E. Lopez-Honorato, and P. Van Uffelen, Silver and cesium diffusion dynamics at the beta-SiC Sigma5 grain boundary investigated with density functional theory molecular dynamics and metadynamics. J Phys Chem A, 2014. 118(5): p. 915-26.
29. Brown, P.E. and R.L. Faircloth, Metal fission product behaviour in high temperature reactors - UO2 coated particle fuel. Journal of Nuclear Materials, 1976. 59: p. 29-41.
30. Nabielek, H., P.E. Brown, and P. Offerman, Silver release from coated particle fuel. Nuclear Technology, 1977. 35(2): p. 483.
31. Amian, W. and D. Stover, Diffusion of silver and cesium in silicon-carbide coatings of fuel particles for high temperature gas-coolcd reactors. Nuclear Technology, 1983. 61(3): p. 475.
32. Bullock, R.E., Fission-product release during postirradiation annealing of several types of coated fuel particles. Journal of Nuclear Materials, 1984. 125: p. 304-319.
33. Moormann, R. and K. Verfondern, Methodikumfassender probabilistischer Sicherheitsanalysen fur zukunftige HTR-Anlagenkonzepte—Ein Statusbericht Band 3: Spaltproduktfreisetzung Report. 1986, Research Center Julich
34. Fukuda, K., Research and development of HTGR fuels Report. 1989, JAERIM89-007 35. Minato, K., Diffusion coefficients of fission products in UO2, PyC, SiC, graphite matrix
and IG-110 graphite, unification of coated particle performance models and fission product transport data for the HTR IAEA Technical Workshop. 1991, HTR IAEA Technical Workshop: Julich, Germany.
36. Chernikov, A.S., Fission Product diffusion in fuel element materials for HTGR, Fission product release and transport in gas-cooled reactors. 1986, IAEA Specialists Meeting: Berkley, CA.
37. van der Merwe, J.J., Evaluation of silver transport through SiC during the German HTR fuel program. Journal of Nuclear Materials, 2009. 395(1-3): p. 99-111.
38. Fujita, T., Z. Horita, and T.G. Langdon, Using grain boundary engineering to evaluate the diffusion characteristics in ultrafine-grained Al–Mg and Al–Zn alloys. Materials Science and Engineering: A, 2004. 371(1-2): p. 241-250.
39. Katoh, Y., et al., Microstructural development in cubic silicon carbide during irradiation at elevated temperatures. Journal of Nuclear Materials, 2006. 351(1): p. 228-240.

Final Report January, 2016
82
40. Kondo, S., Y. Katoh, and L.L. Snead, Cavity swelling and dislocation evolution in SiC at very high temperatures. Journal of Nuclear Materials, 2009. 386-388: p. 222-226.
41. van Rooyen, I.J., T.M. Lillo, and Y.Q. Wu, Identification of silver and palladium in irradiated TRISO coated particles of the AGR-1 experiment. Journal of Nuclear Materials, 2014. 446(1-3): p. 178-186.
42. Lillo, T.M. and I.J. van Rooyen, Associations of Pd, U and Ag in the SiC layer of neutron-irradiated TRISO fuel. Journal of Nuclear Materials, 2015. 460: p. 97-106.
43. López-Honorato, E., et al., Silver Diffusion in Silicon Carbide Coatings. Journal of the American Ceramic Society, 2011. 94: p. 3064-3071.
44. Gerczak, T.J., et al., Observations of Ag diffusion in ion implanted SiC. Journal of Nuclear Materials, 2015. 461: p. 314-324.
45. Khalil, S., et al., Diffusion of Ag along Σ3 grain boundaries in 3C-SiC. Physical Review B, 2011. 84(21): p. 214104.
46. Deng, J., et al., Grain boundary diffusion of Ag through polycrystalline SiC in TRISO fuel particles. Journal of Nuclear Materials, 2015. 467, Part 1: p. 332-340.
47. Méric de Bellefon, G. and B.D. Wirth, Kinetic Monte Carlo (KMC) simulation of fission product silver transport through TRISO fuel particle. Journal of Nuclear Materials, 2011. 413(2): p. 122-131.
48. Brown, P.E. and R.L. Faircloth, Metal fission product behaviour in high temperature reactors -UO2 coated particle fuel. Journal of Nuclear Materials, 1976. 59(1): p. 29-41.
49. Nabielek, H., P.E. Brown, and P. Offermann, Silver release from coated particle fuel. Nuclear Technology, 1977. 35: p. 483-493.
50. Friedland, E., T. Hlatshwayo, and N. van der Berg, Influence of radiation damage on diffusion of fission products in silicon carbide. physica status solidi (c), 2013. 10(2): p. 208-215.
51. O’Connell, J.H. and J.H. Neethling, Ag transport in high temperature neutron irradiated 3C–SiC. Journal of Nuclear Materials, 2014. 445(1-3): p. 20-25.
52. van Rooyen, I.J., et al., Electron microscopic evaluation and fission product identification of irradiated TRISO coated particles from the AGR-1 experiment: A preliminary review. Nuclear Engineering and Design, 2014. 271: p. 114-122.
53. Collins, B.P., et al., AGR-1 Irradiation Test Final As-Run Report. 2012, Idaho National Laboratory: Idaho Falls, Idaho 83415.
54. Anders (Ed.), A., Handbook of plasma immersion ion implantation and deposition. 2000, New York: Wiley.
55. Devanathan, R., W.J. Weber, and F. Gao, Atomic scale simulation of defect production in irradiated 3C-SiC. Journal of Applied Physics, 2001. 90(5): p. 2303-2309.
56. Snead, L.L., et al., Handbook of SiC properties for fuel performance modeling. Journal of Nuclear Materials, 2007. 371(1): p. 329-377.
57. Stolk, P.A., et al., Physical mechanisms of transient enhanced dopant diffusion in ion-implanted silicon. Journal of Applied Physics, 1997. 81(9): p. 6031-6050.

Final Report January, 2016
83
58. Troffer, T., et al., Doping of SiC by implantation of boron and aluminum. Physica Status Solidi a-Applied Research, 1997. 162(1): p. 277-298.
59. Hlatshwayo, T.T., Diffusion of silver in 6H-SiC. 2011, University of Pretoria. 60. Myers, S.M., Annealing behavior and selected applications of ion-implanted alloys.
Journal of Vacuum Science & Technology, 1978. 15: p. 1650. 61. Verfondern, K., R.C. Martin, and R. Moormann, Methods and data for HTGR fuel
performance and radionuclide release modelling during normal operations and accidents for safety analysis. 1993, Forschungszentrum Jülich GmbH.
62. Fukuda, K., et al., Research and development of HTGR fuels. 1989. 63. Mishin, Y. and C. Herzig, Grain boundary diffusion: recent progress and future
research. Materials Science and Engineering: A, 1999. 260: p. 55-71. 64. Harrison, L.G., Influence of dislocations on diffusion kinetics in solids with particular
reference to the alkali halides. Transactions of the Faraday Society, 1961. 57(0): p. 1191-1199.
65. Whipple, R., CXXXVIII. Concentration contours in grain boundary diffusion. Philosophical Magazine, 1954.
66. Blöchl, P.E., Projector augmented-wave method. Physical Review B, 1994. 50(24): p. 17953-17979.
67. Pearson, R.L., R. Lauf, and T. Lindemer, Interaction of palladium, the rare earths, and silver with silicon carbide in HTGR fuel particles. 1982, Oak Ridge National Lab., TN (USA).
68. Tiegs, T., Fission product Pd-SiC interaction in irradiated coated-particle fuels. Nuclear Technology, 1982. 57(3): p. 389-398.
69. Olivier, E.J. and J.H. Neethling, The role of Pd in the transport of Ag in SiC. Journal of Nuclear Materials, 2013. 432: p. 252-260.
70. Nabielek, H. and P.E. Brown, The release of silver-110m in high temperature reactors: Technical note. 1975, OECD Dragon Project. p. 370.
71. Coward, R.A., et al., Transmission electron microscopy investigation of Ag diffusion mechanisms in β-SiC. Journal of Nuclear Materials, 2015. 457(0): p. 298-303.
72. Price, R.J., Neutron irradiation-induced voids in β-silicon carbide. Journal of Nuclear Materials, 1973. 48(1): p. 47-57.
73. Geng, X., et al., An original way to investigate silver migration through silicon carbide coating in triso particles. Journal of the American Ceramic Society, 2014. 97(6): p. 1979-1986.
74. O’Connell, J.H. and J.H. Neethling, Palladium and ruthenium supported silver migration in 3C–silicon carbide. Journal of Nuclear Materials, 2015. 456(0): p. 436-441.
75. Neethling, J.H., J.H. O’Connell, and E.J. Olivier, Palladium assisted silver transport in polycrystalline SiC. Nuclear Engineering and Design, 2012. 251: p. 230-234.
76. O'Connell, J.H. and J.H. Neethling, Ag transport in high temperature neutron irradiated 3C-SiC. Journal of Nuclear Materials, 2014. 445(1-3): p. 20-25.

Final Report January, 2016
84
77. Londono-Hurtado, A., et al., Cs and Ag co-incorporation in cubic silicon carbide. Journal of Nuclear Materials, 2013. 439(1–3): p. 65-71.
78. Gerczak, T., Understanding Ag release from TRISO fule through surrogate diffusion experiments and fuel analysis. 2013, University of Wisconsin-Madison.
79. López-Honorato, E., et al., Silver diffusion in silicon carbide coatings. Journal of the American Ceramic Society, 2011. 94(9): p. 3064-3071.
80. López-Honorato, E., et al., Silver diffusion in coated fuel particles. Journal of the American Ceramic Society, 2010. 93(10): p. 3076-3079.
81. Rabone, J., E. Lopez Honorato, and P.V. Uffelen, Silver and caesium diffusion dynamics at the b-SiC Σ5 grain boundary investigated with density functional theory molecular dynamics and metadynamics. The journal of physical chemistry. A, 2014. 118(5): p. 915-926.
82. Amian, W.S.D., Diffusion of Silver and Cesium in SiC coating of TRISO fuel particle for HTGCR. Nuclear Technology, 1983. 61: p. 475-486.
83. Bullock, R.E., Fission-Product release during postirradiation annealing of several types of coated fuel-particles. Journal of Nuclear Materials, 1984. 125(3): p. 304-319.
84. Kirchhofer, R., et al., Microstructure of TRISO coated particles from the AGR-1 experiment: SiC grain size and grain boundary character. Journal of Nuclear Materials, 2013. 432(1-3): p. 127-134.
85. Joesten, R., Diffusion, atomic ordering, and mass transport. Advances in Physical Geochemistry. Vol. 8. 1991, New York, NY: Springer US. 345-395.
86. Kolobov, I.U.R. and Y.R. Kolobov, Grain boundary diffusion and properties of nanostructured materials. 2007: Cambridge International Science Pub.
87. Xu, S., et al., Lithium transport through lithium-ion battery cathode coatings. Journal of Materials Chemistry A, 2015. 3(33): p. 17248-17272.
88. Keblinski, P., et al., Thermodynamic criterion for the stability of amorphous intergranular films in covalent materials. Physical review letters, 1996. 77(14): p. 2965-2968.
89. Szlufarska, I., A. Nakano, and P. Vashishta, A crossover in the mechanical response of nanocrystalline ceramics. Science, 2005. 309(5736): p. 911-914.
90. Rino, J., et al., Short- and intermediate-range structural correlations in amorphous silicon carbide:A molecular dynamics study. Physical Review B, 2004. 70(4): p. 045207.
91. Kresse, G. and J. Furthmüller, Efficiency of ab-initio total energy calculations for metals and semiconductors using a plane-wave basis set. Computational Materials Science, 1996. 6(1): p. 15-50.
92. Kresse, G. and J. Furthmüller, Efficient iterative schemes for ab initio total-energy calculations using a plane-wave basis set. Physical Review B, 1996. 54(16): p. 11169-11186.
93. Kresse, G. and J. Hafner, Ab initio molecular dynamics for liquid metals. Physical Review B, 1993. 47(1): p. 558.

Final Report January, 2016
85
94. Kresse, G. and J. Hafner, Ab-Initio molecular-dynamics simulation of the liquid-metal amorphous-semiconductor transition in germanium. Physical Review B, 1994. 49(20): p. 14251-14269.
95. Kresse, G., From ultrasoft pseudopotentials to the projector augmented-wave method. Physical Review B, 1999. 59(3): p. 1758.
96. Perdew, J.P., K. Burke, and M. Ernzerhof, Generalized gradient approximation made simple. Physical Review Letters, 1996. 77(18): p. 3865-3868.
97. Kohan, A.F., et al., First-principles study of native point defects in ZnO. Physical Review B, 2000. 61(22): p. 15019-15027.
98. Hao, S. and D.S. Sholl, Using first-principles calculations to accelerate materials discovery for hydrogen purification membranes by modeling amorphous metals. Energy & Environmental Science, 2008. 1(1): p. 175.
99. Van der Ven, A., et al., First-principles theory of ionic diffusion with nondilute carriers. Physical Review B, 2001. 64(18): p. 184307.
100. Puchala, B. and D. Morgan, Atomistic modeling of As diffusion in ZnO. Physical Review B, 2012. 85(6): p. 064106.
101. Haus, J.W. and K.W. Kehr, Diffusion in regular and disordered lattices. Physics Reports-Review Section of Physics Letters, 1987. 150(5): p. 263-406.
102. Kronmüller, H., W. Frank, and P. Scharwaechter, Self-Diffusion and Relaxation Processes in Amorphous Metallic Alloys. Science and Technology of Rapid Solidification and Processing, ed. M. Otooni. Vol. 278. 1995: Springer Netherlands. 271-289.
103. Schirmacher, W., et al., Anomalous diffusion of hydrogen in amorphous metals. Europhysics Letters, 1990. 13(6): p. 523.
104. Kehr, K.W. and T. Wichmann, Diffusion coefficients of single and many particles in lattices with different forms of disorder. Materials Science Forum, 1996. 223-224: p. 151-160.
105. Bortz, A.B., M.H. Kalos, and J.L. Lebowitz, A new Algorithm for Monte Carlo simulation of Ising spin system. Journal of Computational physics, 1975. 17(1): p. 10-18.
106. Karger, J., et al., Single-file diffusion and reaction in zeolites. Journal of Catalysis, 1992. 136(2): p. 283-299.
107. Barnard, L. and D. Morgan, Ab initio molecular dynamics simulation of interstitial diffusion in Ni–Cr alloys and implications for radiation induced segregation. Journal of Nuclear Materials, 2014. 449(1–3): p. 225-233.
108. Bongiorno, A. and A. Pasquarello, Multiscale modeling of oxygen diffusion through the oxide during silicon oxidation. Physical Review B, 2004. 70(19): p. 195312.
109. Hao, S. and D.S. Sholl, Self-diffusion and macroscopic diffusion of hydrogen in amorphous metals from first-principles calculations. The Journal of Chemical Physics, 2009. 130(24): p. 244705.
110. Tritsaris, G.A., et al., Diffusion of Lithium in Bulk Amorphous Silicon: A Theoretical Study. The Journal of Physical Chemistry C, 2012. 116(42): p. 22212-22216.

Final Report January, 2016
86
111. Hao, S. and C. Wolverton, Lithium transport in Amorphous Al2O3 and AlF3 for discovery of battery coatings. The Journal of Physical Chemistry C, 2013. 117(16): p. 8009-8013.
112. Kong, N., et al., Interstitial-based boron diffusion dynamics in amorphous silicon. Applied Physics Letters, 2008. 93(8): p. 082109.
113. Kuznetsov, A.Y. and B.G. Svensson, Nickel atomic diffusion in amorphous silicon. Applied Physics Letters, 1995. 66(17): p. 2229.
114. Su, Y.S. and S. Pantelides, Diffusion Mechanism of Hydrogen in Amorphous Silicon: Ab Initio Molecular Dynamics Simulation. Physical Review Letters, 2002. 88(16): p. 165503.
115. Liu, X.Y., et al., First-principles study of phosphorus diffusion in silicon: Interstitial- and vacancy-mediated diffusion mechanisms. Applied Physics Letters, 2003. 82(12): p. 1839-1841.
116. Ahn, S. and J.A. Fessler, Standard errors of mean, variance , and standard deviation estimators. 2003, Univ. of Michigan, Ann Arbor: Univ. of Michigan, Ann Arbor. p. 1-2.
117. Norris, N., The Standard Errors of the Geometric and Harmonic Means and Their Application to Index Numbers. Ann. Math. Statist., 1940. 11(4): p. 445-448.
118. Maclean, H.J., Silver Transport in CVD Silicon Carbide. 2004, Massachusetts Institute of Technology.
119. Leng, B., et al., Effect of carbon irradiation on Ag diffusion in ion implanted SiC. journal of Nuclear Materials, In press.
120. Dienes, G.J. and A.C. Damask, Radiation Enhanced Diffusion in Solids. Journal of Applied Physics, 1958. 29(12): p. 1713-1721.
121. Sizmann, R., The effect of radiation upon diffusion in metals. Journal of Nuclear Materials, 1978. 69–70: p. 386-412.
122. Leveque, P., et al., Irradiation enhanced diffusion of boron in delta-doped silicon. Journal of Applied Physics, 2001. 89(10): p. 5400-5405.
123. Snead, L.L., et al., Handbook of SiC properties for fuel performance modeling. Journal of Nuclear Materials, 2007. 371: p. 329-377.
124. Ko, H., et al., Ag diffusion in SiC high-energy grain boundaries: kinetic Monte Carlo study with first-principle calculations. Submitted to Acta Mater.
125. Bracht, H. and E.E. Haller, Comment on ``Self-Diffusion in Silicon: Similarity between the Properties of Native Point Defects''. Physical Review Letters, 2000. 85(22): p. 4835-4835.
126. Amian, W. and D. Stover, Diffusion of Silver and Cesium in SiC coating of TRISO fuel particle for HTGCR. Nuclear Technology, 1983. 61: p. 475-486.
127. Odette, G.R., T. Yamamoto, and D. Klingensmith, On the effect of dose rate on irradiation hardening of RPV steels. Philosophical Magazine, 2005. 85(4-7): p. 779-797.
128. Watanabe, Y., K. Morishita, and Y. Yamamoto, Nucleation and growth of self-interstitial atom clusters in β -SiC during irradiation: Kinetic Monte-Carlo modeling. Nuclear Instruments and Methods in Physics Research Section B: Beam Interactions with Materials and Atoms, 2011. 269(14): p. 1698-1701.

Final Report January, 2016
87
129. He, L., et al. High-Resolution Scanning Transmission Electron Microscopy Study of Black Spot Defects in Ion Irradiated Silicon Carbide. in Microscopy and Microanalysis. 2014.
130. Vitaly, V.S., Kinetics of First Order Phase Transitions. 2009. 131. Watanabe, Y., K. Morishita, and A. Kohyama, Composition dependence of formation
energy of self-interstitial atom clusters in β-SiC: Molecular dynamics and molecular statics calculations. Journal of Nuclear Materials, 2011. 417(1–3): p. 1119-1122.
132. Watanabe, Y., et al., Energetics of defects in β -SiC under irradiation. Nuclear Instruments and Methods in Physics Research Section B: Beam Interactions with Materials and Atoms, 2009. 267(18): p. 3223-3226.
133. Jiang, C., D. Morgan, and I. Szlufarska, Structures and stabilities of small carbon interstitial clusters in cubic silicon carbide. Acta Materialia, 2014. 62: p. 162-172.
134. IAEA, Fuel performance and fission product behaviour in gas cooled reactors. 1997, IAEA- TECDOC-978: International Atomic Energy Agency.
135. Bottiger, J., K. Pampus, and B. Torp, Diffusion during Ion Irradiation in Amorphous PdCuSi. Europhysics Letters, 1987. 4(8): p. 915-919.
136. Dyrbye, K., et al., Radiation-enhanced diffusion in amorphous Pd-Cu-Si. Physical review B, 1988. 38(13): p. 8562-8565.
137. Scharwaechter, P., W. Frank, and H. Kronmuller, Diffusion in amorphous metallic alloys, particularly Co58Fe5Ni10Si11B16. Zeitschrift Fur Metallkunde, 1996. 87(11): p. 892-897.
138. Priolo, F., et al., Diffusion of Au in amorphous Si during ion-beam irradiation. Fundamentals of Beam-Solid Interactions and Transient Thermal Processing. Symposium, 1988: p. 87-92.
139. Priolo, F., et al., Radiation-enhanced diffuion of Au in amorphous Si. Applied Physics Letters, 1988. 52(15): p. 1213-1215.
140. Averback, R. and H. Hahn, Radiation-enhanced diffusion in amorphous Ni-Zr alloys. Physical Review B, 1988. 37(17): p. 10383-10386.
141. Bellini, S., A. Montone, and M. Vittori-Antisari, Radiation-enhanced diffusion in amorphous Ni-Zr studied by in situ electron irradiation in a transmission electron microscope. Physical Review B, 1994. 50(14): p. 9803-9809.
142. Schuler, T., et al., Irradiation-enhanced self-diffusion in amorphous metallic alloys - experiments, molecular-dynamics simulations, interpretation. Defect and diffusion forum 1997. 143: p. 753-758.

Final Report January, 2016
88
9 Appendices

Appendix A Summary of results for Task 4 “Co-incorporation of Ag with other elements”

Final Report January, 2016
2
Final Report January, 2016
3

Final Report January, 2016
4

Final Report January, 2016
5
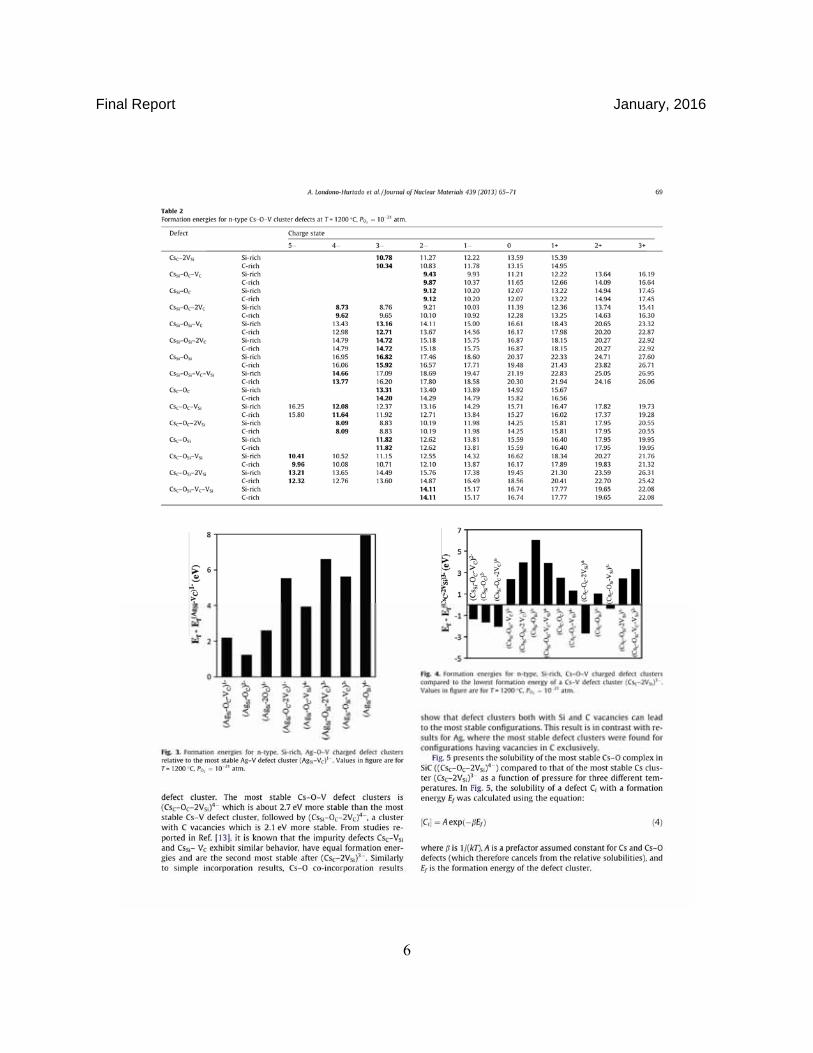
Final Report January, 2016
6

Final Report January, 2016
7

Final Report January, 2016
8
Final Report January, 2016
9
Appendix B
Summary of results for Task 6 “Continuum model of diffusion through
polycrystalline SiC”

Final Report January, 2016
2

Final Report January, 2016
3

Final Report January, 2016
4

Final Report January, 2016
5

Final Report January, 2016
6

Final Report January, 2016
7
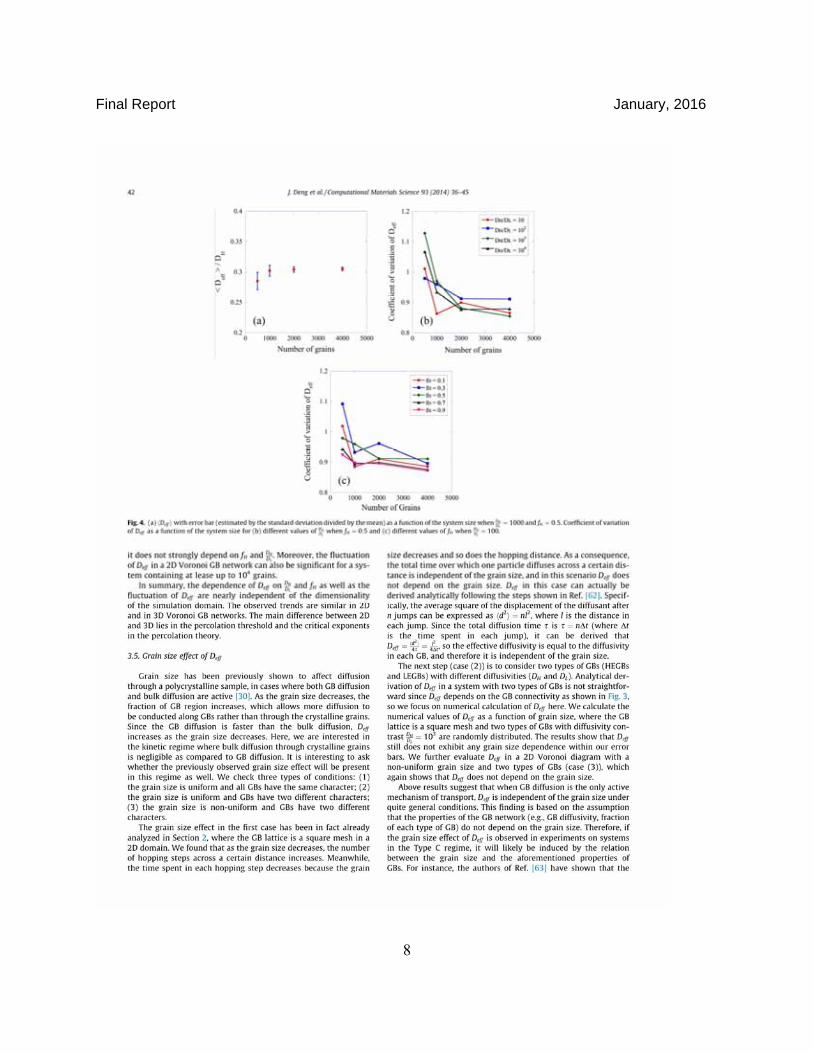
Final Report January, 2016
8
Final Report January, 2016
9

Final Report January, 2016
10

Final Report January, 2016
11

Final Report January, 2016
12

Final Report January, 2016
13

Final Report January, 2016
14
Final Report January, 2016
15

Final Report January, 2016
16

Final Report January, 2016
17

Final Report January, 2016
18

Final Report January, 2016
19

Final Report January, 2016
20


![High Current Ion Beam Investigations on Inorganic ... · PDF fileINORGANIC SCINTILLATION SCREENS ... Ce or ZnS :Ag , were irradiated with lower currents [4]. ... Ni layer (heating](https://img.dokumen.tips/doc/110x75/5aa80b827f8b9ac0258b57fc/high-current-ion-beam-investigations-on-inorganic-scintillation-screens-.jpg)