Embed Size (px)
Citation preview
LBNL-53729
After-hours Power Status of Office Equipment andInventory of Miscellaneous Plug-Load Equipment
Judy A. Roberson, Carrie A. Webber, Marla C. McWhinney,Richard E. Brown, Margaret J. Pinckard, and John F. Busch
Energy Analysis DepartmentEnvironmental Energy Technologies Division
Ernest Orlando Lawrence Berkeley National LaboratoryUniversity of California
Berkeley CA 94720, USA
January 2004
To download this paper and related data go to:http://enduse.lbl.gov/Projects/OffEqpt.html
The work described in this paper was supported by the Office of Atmospheric Programs, ClimateProtection Partnerships Division of the U.S. Environmental Protection Agency and prepared for the U.S.Department of Energy under Contract No. DE-AC03-76SF00098.


LBNL-53729 i
Table of ContentsTable of Contents .......................................................................................................................... iList of Tables, List of Figures ...................................................................................................... iiAbbreviations, Acronyms, and Glossary of Terms ......................................................................iiiAcknowledgements ........................................................................................................................ ivAbstract ........................................................................................................................................ 1Introduction ................................................................................................................................. 2Methodology................................................................................................................................. 3
Building Sample................................................................................................................................................3Survey Protocol.................................................................................................................................................5Office Equipment Data Collection .................................................................................................................5Miscellaneous Equipment Data Collection....................................................................................................6Limitations of This Methodology....................................................................................................................7
Results and Discussion ................................................................................................................ 7Equipment Density ...........................................................................................................................................7Office Equipment..............................................................................................................................................8
Computers........................................................................................................................................................................9Laptop Computers .........................................................................................................................................................10Monitors.........................................................................................................................................................................11Printers ...........................................................................................................................................................................14Multi-Function Devices.................................................................................................................................................15Copiers ...........................................................................................................................................................................15Fax Machines.................................................................................................................................................................15Scanners .........................................................................................................................................................................16
Office Equipment: Comparison of 2000 and 2003 Turn-off and PM Rates ...........................................16Miscellaneous Equipment..............................................................................................................................17External Power Supplies................................................................................................................................18
Conclusions................................................................................................................................ 19Future Work………………………………………………………………………………………21References.................................................................................................................................. 22Appendix A: Building Descriptions............................................................................................ 23Appendix B: Flowchart for Auditing Desktop Computer Power State....................................... 25Appendix C: Miscellaneous Equipment Taxonomy ................................................................... 26Appendix D: Miscellaneous Equipment Numbers, by Category and Site................................... 27

LBNL-53729 ii
List of Tables
Table 1. Building Sample and Computer Density ______________________________________________4
Table 2. Office and Miscellaneous Equipment: Number of Units and Density ________________________7
Table 3. Office Equipment: After-hours Power States __________________________________________9
Table 4. Ratio of Laptop to Desktop Computers at Two Sites____________________________________11
Table 5. Analysis of Monitor Power Management by Computer Power State________________________11
Table 6. Number and Percent of LCD Monitors, by Site________________________________________13
Table 7. Office Equipment Turn-off and Power Management Rates_______________________________16
List of Figures
Figure 1. Comparison of LBNL and CBECS Commercial Building Samples................................................5
Figure 2. Office and Miscellaneous Equipment Density, by Building Type (and number) ............................... 8
Figure 3. Office Equipment Power States........................................................................................................... 10
Figure 4. Monitor After-hours Power Status, by Building Type...................................................................13
Figure 5. Printer Sample, by Technology ........................................................................................................... 14
Figure 6. Laser Printers: Powersave Delay Settings........................................................................................... 14
Figure 7. Fax Machine Technology .................................................................................................................... 15
Figure 8. Miscellaneous Equipment Numbers, by Category and Building Type.............................................. 18
Figure 9. External Power Supplies: Number, Type and Frequency................................................................... 19

LBNL-53729 iii
Abbreviations, Acronyms, and Glossary of TermsAs Used in This Report
CRT cathode ray tube (monitor)
CPU central processing unit
ICS integrated computer system, in which computer and monitor share a power cord, (e.g., an LCDmonitor powered through a computer) and may also share a housing (e.g., an Apple iMac)
ILPS in-line power supply: a type of external power supply found on the cord between the plug andthe device; aka “fat snake” because it looks like the power cord swallowed a box or cylinder
LBNL Lawrence Berkeley National Laboratory (aka LBL or Berkeley Lab)
LCD liquid crystal display (monitor)
MFD multi-function device: a unit of digital equipment that can perform at least two of the followingfunctions: copy, fax, print, scan
OEM original equipment manufacturer
OS operating system (e.g., Windows XP or Mac OS X)
PC personal computer: a generic term that includes laptop computers, desktop computers andintegrated computer systems; it includes both Apple and Intel-architecture machines
PDA personal digital assistant; a cordless (i.e., rechargeable) hand-held computer device
PIPS plug-in power supply: a type of external power supply that is incorporated into the cord’s plug;aka “wall wart”
PM power management: the ability of electronic equipment to automatically enter a low powermode or turn itself off after some period of inactivity; PM rate is the percent of units not offthat are in low power.
PM rate: the extent to which a given sample or type of equipment is actually found to have automaticallyentered a low power mode or turned itself off.
PM Enabling rate: the extent to which settings in the user interface of a given sample or type ofequipment indicate the equipment is set to automatically enter low power or turn itself off.
XPS external power supply: a power supply external to the device that it powers; a voltageregulating device incorporated into either the power cord or the wall plug of a device

LBNL-53729 iv
Acknowledgements
This study would not have been possible without the support of the ENERGY STAR Office Equipment andCommercial Buildings programs, as well as the cooperation of the owners and facility managers of thebusinesses, institutions, and organizations that participated, and whose anonymity we promised to maintain.
We would like to thank our reviewers: Jim McMahon, Bruce Nordman, and Steve Greenberg of LBNL;Kent Dunn and Michael Thelander of Verdiem: Energy Efficiency for PC Networks, Seattle WA;and Terry O’Sullivan of Energy Solutions, Oakland CA.
LBNL-53729 1
After-hours Power Status of Office Equipment andInventory of Miscellaneous Plug-Load Equipment
Judy A. Roberson, Carrie A. Webber, Marla C. McWhinney,Richard E. Brown, Margaret J. Pinckard, and John F. Busch
Abstract
This research was conducted in support of two branches of the EPA ENERGY STAR program, whose overallgoal is to reduce, through voluntary market-based means, the amount of carbon dioxide emitted in the U.S.The primary objective was to collect data for the ENERGY STAR Office Equipment program on the after-hours power state of computers, monitors, printers, copiers, scanners, fax machines, and multi-functiondevices. We also collected data for the ENERGY STAR Commercial Buildings branch on the types andamounts of “miscellaneous” plug-load equipment, a significant and growing end use that is not usuallyaccounted for by building energy managers. This data set is the first of its kind that we know of, and is animportant first step in characterizing miscellaneous plug loads in commercial buildings.
The main purpose of this study is to supplement and update previous data we collected on the extent towhich electronic office equipment is turned off or automatically enters a low power state when not in activeuse. In addition, it provides data on numbers and types of office equipment, and helps identify trends inoffice equipment usage patterns. These data improve our estimates of typical unit energy consumption andsavings for each equipment type, and enables the ENERGY STAR Office Equipment program to focus futureeffort on products with the highest energy savings potential.
This study expands our previous sample of office buildings in California and Washington DC to includeeducation and health care facilities, and buildings in other states. We report data from twelve commercialbuildings in California, Georgia, and Pennsylvania: two health care buildings, two large offices (> 500employees each), three medium offices (50-500 employees), four education buildings, and one “smalloffice” that is actually an aggregate of five small businesses. Two buildings are in the San Francisco Bayarea of California, five are in Pittsburgh, Pennsylvania, and five are in Atlanta, Georgia.

LBNL-53729 2
Introduction
Since the 1980s there has been continual growth in the market for electronic office equipment, particularlypersonal computers and monitors, but also printers and multi-function devices (MFDs), which are replacingdiscrete copiers, fax machines and scanners in some office environments. According to 2003 projectionsby the Department of Energy, annual energy use by personal computers is expected to grow 3% per year,and energy use among other types of office equipment is expected to grow 4.2%; this growth is in spite ofimprovements in energy efficiency, which are expected to be offset by “continuing penetration of newtechnologies and greater use of office equipment” (EIA 2003).
In 1992 the US Environmental Protection Agency (EPA) launched the voluntary ENERGY STAR program,designed to curb the growth of CO2 emissions by labeling the most energy-efficient electronic products forthe mutual benefit of manufacturers, consumers, and the environment.1 The first products to be labeledwere computers and monitors; printers were added in 1993, fax machines in 1994, copiers in 1995, andscanners and multi-function devices in 1997 (EPA/DOE 2003). Continued improvement in energy savingsamong office equipment remains a focus of the ENERGY STAR program, which updates its productspecifications as necessary to respond to changes in technology, energy consumption, and usage patterns.
ENERGY STAR labeled office equipment reduces energy use primarily through power management (PM), inwhich equipment is factory-enabled to automatically turn off or enter low power (any power level betweenoff and on) after some period of inactivity, usually 15 or 30 minutes. Most office equipment is idle moreoften than it is active; among equipment that users tend to leave on when not in use, such as shared andnetworked devices, PM can save significant energy. ENERGY STAR devices have a large market share, butthe percentage that actually power manage is lower for several reasons. Power management is sometimesdelayed or disabled by users, administrators, or even software updates that change the factory settings inthe interface; in addition, some network and computing environments (e.g., the Windows NT operatingsystem) effectively prevent PM from functioning.
To accurately estimate energy savings attributable to the ENERGY STAR program, and target future efforts,current data are needed on the extent to which each type of office equipment is turned off or successfullyenters low power mode when idle. Combined with measurements of the energy used in each power state,we can estimate typical unit energy consumption (UEC), which, combined with number of units currentlyin use, provides an estimate of total energy use, and program savings (Webber, Brown et al. 2002).
In our ongoing technical support of the ENERGY STAR program, the Energy Analysis Department atLawrence Berkeley National Lab (LBNL) has conducted after-hours surveys (aka night-time audits) ofoffice equipment in commercial buildings. Our previous series of surveys was conducted during thesummer of 2000; it included nine buildings in the San Francisco Bay area and two in the Washington DCarea. We recruited and surveyed a diversity of office types and documented just over 100 computers persite, on average. We collected data on the types, power states and PM delay settings of ENERGY STARlabeled office equipment (computers, monitors, copiers, fax machines, printers, scanners and multi-functiondevices). The methods and results of that study were reported previously (Webber, Roberson et al. 2001).
1 The ENERGY STAR® program has expanded to include residential appliances and heating and cooling equipment,consumer electronics, building materials and components, refrigeration equipment, commercial buildings and newhomes. Since 1996 it has been jointly administered by the U.S. EPA and DOE (http://energystar.gov/).
LBNL-53729 3
We also recorded (but did not report) the numbers of some types of “miscellaneous office equipment”, suchas computer speakers and external drives, portable fans and heaters, boomboxes and typewriters.
In this report, we present the results of our most recent (2003) after-hours survey of commercial buildings,which was expanded to include:
• buildings in Pittsburgh, Pennsylvania and Atlanta, Georgia,• education buildings, health care buildings, and small offices, and• an inventory of miscellaneous plug-load equipment.
As part of our ongoing effort to improve the accuracy of data used to evaluate the ENERGY STAR program,we wanted to capture data from a wider range of commercial building types and geographic regions. Whileour sample is not large enough to distinguish regional differences in equipment night-time or after-hourspower status, we hope to improve the robustness of our data by increasing its geographic diversity. Also,because office equipment is not confined to offices or office buildings, we wanted to capture data fromother types of commercial buildings that have significant amounts of office equipment, such as schools.
Collecting data on after-hours power status involves visiting buildings when most employees are gone.Given the difficulty of arranging after-hours access to most commercial buildings, we used this opportunityto simultaneously collect data for the ENERGY STAR Commercial Buildings program on the types andnumbers of miscellaneous plug-load equipment, and to develop a taxonomy by which to categorize them.These data allow us to begin to better characterize the large “plug-load” building energy end use category.
Methodology
The protocol used in this series of surveys changed significantly from that of 2000 because of the need todevelop and integrate a data collection protocol for miscellaneous equipment with that of office equipment.
Building Sample
Table 1 below outlines the twelve buildings in our sample, which are identified by a letter. Appendix Adescribes them in more detail, but in generic terms only, to preserve the anonymity of their occupants. Asin 2000, our initial target was to collect data on at least 1,000 computers. In selecting types and numbers ofcommercial buildings to comprise that sample, we referred to data on computer densities provided by theCommercial Building Energy Consumption Survey (CBECS) (EIA/CBECS 2002). According to CBECS,in 1999, 74% of the U.S. population of computers were found among office, education, and health carebuildings; therefore, our building recruitment effort focused on these three types of buildings. CBECSfurther characterizes offices by number of employees: 0-19 (small), 20-499 (medium), and 500+ (large).
To familiarize ourselves with what to expect (in recruitment effort and equipment found) in schools andhealth care buildings, we began by surveying a high school and a medical clinic in the San Francisco area.We then recruited and surveyed a variety of buildings in Pittsburgh in April, and Atlanta in June 2003.
Site recruitment is one of the most difficult and time consuming aspects of commercial building surveys.Usually it involves cold-calling from a list of prospective business or building types (e.g., high schools),briefly describing our research activity, and trying to connect with the person who is able and willing togrant after-hours access, which involves providing a key and/or escort. Most facilities have real concernsabout safety, security, and privacy (e.g., of client or patient records), which of course must be addressed.
In each building, we surveyed as much area as possible in four hours or until we covered the areaaccessible to us, whichever came first. At two sites we surveyed a single floor, at four sites we surveyed

LBNL-53729 4
the entire space available to us, and at the remaining six sites we surveyed portions of two or three floors.In general, the greater the density and variety of equipment found, the less area we covered in four hours.Floor areas are approximate gross square feet, based on floor plans or information from facility managers.
Table 1. Building Sample and Computer Density
in area surveyed (approximate no.) computer density persite state building type occupancy computers ft2 employees 1000 ft2 employeeA GA education university classroom bldg 171 28,000 n/a 6.1 n/aB PA medium office non-profit headquarters 182 55,000 128 3.3 1.42C GA large office corporate headquarters 262 28,000 120 9.4 2.18D CA education high school 112 40,000 n/a 2.8 n/aE GA medium office business consulting firm 37 22,000 70 1.7 0.53F PA education high school 248 100,000 n/a 2.5 n/aG CA health care outpatient clinic 177 45,000 n/a 3.9 n/aH GA medium office information services dept 153 24,000 76 6.4 2.01J PA health care private physicians’ offices 56 26,000 n/a 2.2 n/aK PA small office 5 small businesses combined 117 20,000 77 5.9 1.52M PA large office corporate headquarters 73 40,000 125 1.8 0.58N GA education university classroom bldg 95 20,000 n/a 4.8 n/a
total 1,683 448,000 n/a = not available
Our characterization of offices differs slightly from that of CBECS. By our definition a small office has<50 employees, a medium office has 50-500 employees, and a large office has >500 employees on site.Also, CBECS appears to classify offices by the number of employees per building, while we classify themby the number of employees per location. For example, our site E is a “medium office” (50-500employees) that occupies one floor of a high-rise office tower; however, CBECS might consider the sameoffice to be part of a “large office” (over 500 employees) that includes all offices within the entire building.
Our “small office” is actually the aggregated results for five small businesses in three different buildings:• a graphics and printing business,• an environmental consulting firm,• a commodity brokerage firm,• a software development firm, and• an engineering firm.
Their approximate number of employees ranged from 4 to 25, with a collective total of 77 employees.
For the six offices in our sample, Table 1 also shows the approximate density of computers by gross squarefeet as well as per employee. We do not have number of employees (or computer density per employee)for education and medical facilities. For high schools, where the number of students is known, equipmentdensity per student could be a useful metric if we had surveyed the entire building, which we did not. Thenumber of students regularly using a university classroom building, as well as the number of employees inboth education and medical buildings is much more variable and difficult to determine.
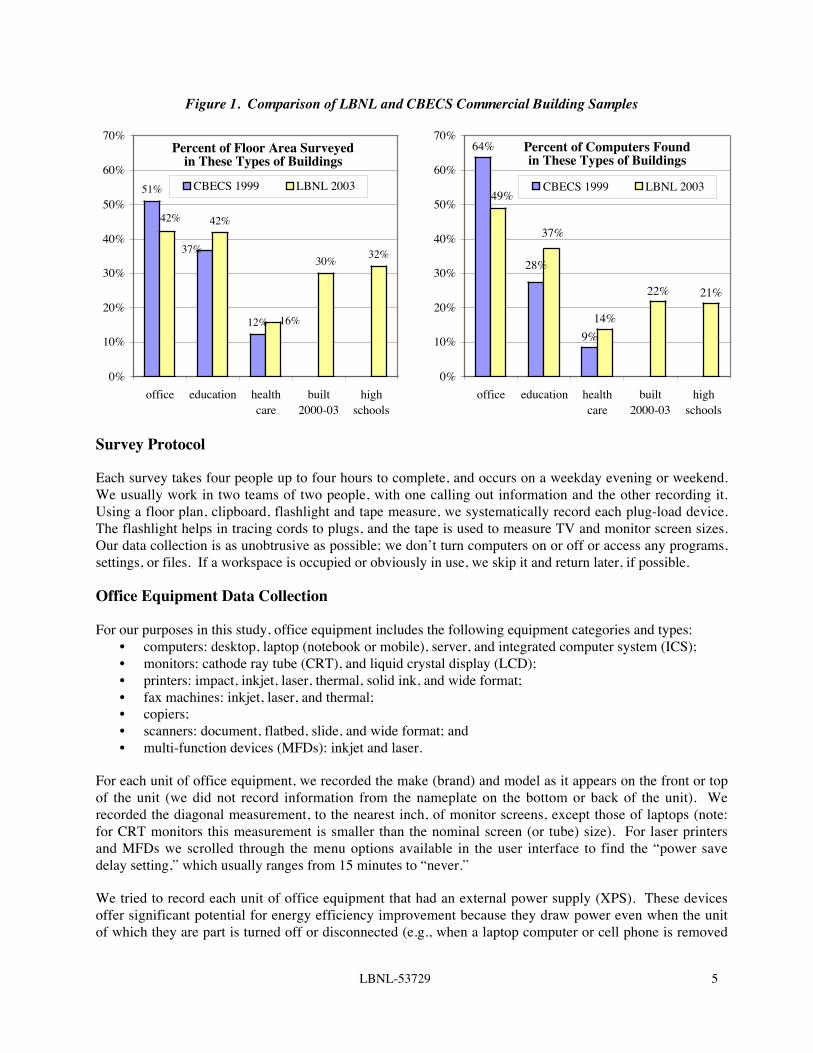
Although we used the CBECS data as a starting point in our building selection and recruitment efforts, ourresulting building sample does not necessarily correspond to the much larger CBECS building sample.Figure 1 below compares our building sample to CBECS, based on the sum of floor area surveyed andnumber of computers found among all office, education, and health care buildings in each sample.Compared to CBECS, offices are somewhat under-represented in our current sample, while education andhealth care buildings are somewhat over-represented. In addition, new buildings and high schools may beover-represented in our building sample, though we don’t have corresponding CBECS data for comparison.
LBNL-53729 5
Figure 1. Comparison of LBNL and CBECS Commercial Building Samples
Survey Protocol
Each survey takes four people up to four hours to complete, and occurs on a weekday evening or weekend.We usually work in two teams of two people, with one calling out information and the other recording it.Using a floor plan, clipboard, flashlight and tape measure, we systematically record each plug-load device.The flashlight helps in tracing cords to plugs, and the tape is used to measure TV and monitor screen sizes.Our data collection is as unobtrusive as possible; we don’t turn computers on or off or access any programs,settings, or files. If a workspace is occupied or obviously in use, we skip it and return later, if possible.
Office Equipment Data Collection
For our purposes in this study, office equipment includes the following equipment categories and types:• computers: desktop, laptop (notebook or mobile), server, and integrated computer system (ICS);• monitors: cathode ray tube (CRT), and liquid crystal display (LCD);• printers: impact, inkjet, laser, thermal, solid ink, and wide format;• fax machines: inkjet, laser, and thermal;• copiers;• scanners: document, flatbed, slide, and wide format; and• multi-function devices (MFDs): inkjet and laser.
For each unit of office equipment, we recorded the make (brand) and model as it appears on the front or topof the unit (we did not record information from the nameplate on the bottom or back of the unit). Werecorded the diagonal measurement, to the nearest inch, of monitor screens, except those of laptops (note:for CRT monitors this measurement is smaller than the nominal screen (or tube) size). For laser printersand MFDs we scrolled through the menu options available in the user interface to find the “power savedelay setting,” which usually ranges from 15 minutes to “never.”
We tried to record each unit of office equipment that had an external power supply (XPS). These devicesoffer significant potential for energy efficiency improvement because they draw power even when the unitof which they are part is turned off or disconnected (e.g., when a laptop computer or cell phone is removed
51%
12%
42%
30% 32%37%
16%
42%
0%
10%
20%
30%
40%
50%
60%
70%
office education healthcare
built2000-03
highschools
CBECS 1999 LBNL 2003
Percent of Floor Area Surveyedin These Types of Buildings
64%
9%14%
22% 21%
28%
49%
37%
0%
10%
20%
30%
40%
50%
60%
70%
office education healthcare
built2000-03
highschools
CBECS 1999 LBNL 2003
Percent of Computers Foundin These Types of Buildings
LBNL-53729 6
from its charger, which remains plugged in). We distinguish two types of external power supply: a plug-inpower supply (PIPS), in which an AC/AC voltage transformer is incorporated into the plug, and an in-linepower supply (ILPS), which is incorporated into and appears as an enlarged part of the power cord. Wealso tried to record whether or not each printer, copier, and MFD was connected to a network via cable (tothe extent that networks become wireless, network connection will become more difficult to determine).
The power state of each unit was recorded as on, low, off, or unplugged (exception: we did not record unitsthat were unplugged if it appeared they were never used). Although some office equipment, particularlycopiers, may have features that enable them to turn off automatically or enter low power manually (by useraction), we assume that the vast majority of units found off were turned off manually (i.e., by a user) andthat units found in low power entered that state automatically (i.e., without user action).
If a monitor/computer pair were both on, we recorded the screen content; the most common occurrences area screensaver, application, log-in or other dialog box (e.g., “It is now safe to turn off your computer”).When a monitor is off and the computer to which it is connected is not, it can be difficult to tell whether thecomputer is on or in low power. The method we used to determine a PC’s power state is outlined inAppendix B; in short, a clampmeter is used to measure relative current in the computer power cord beforeand after initiating a computer wake function, such as touching the mouse or keyboard (McCarthy, 2002).
The power state of a laptop computer is usually difficult to determine, unless it is in use and obviously on.A closed laptop has few external indicators, and those that are present are often ambiguous and inconsistent(e.g., between brands or models). In terms of improving our estimates of laptop unit energy consumption,the most relevant data is the amount of time each laptop spends plugged in, and how often its battery is(re)charged. Therefore, we recorded, at a minimum, whether or not each laptop was plugged in.
In this report the term “computer workstation” refers to any combination of computer(s) and monitor(s)physically used by one person at a time; generally, there is a workstation associated with each office chair.Workstation configurations vary widely; most common is one desktop computer connected to one monitor,but we have noticed growing numbers of other configurations, including multiple computers with onemonitor, multiple (usually LCD) monitors with one computer, and laptops used with a docking station andmonitor. In this series of surveys, we identified each computer workstation by a unique number; i.e., allcomponents of each workstation were identified by the same number. We did this for two reasons: first, tofacilitate subsequent analysis of the relationship between computer and monitor power states; and second,to be able to characterize the variety of workstations found. These analyses are discussed in the Results.
Miscellaneous Equipment Data Collection
Miscellaneous equipment (ME) refers to plug-load devices whose energy use is not usually accounted forby building energy managers because they are portable, often occupant-provided units whose number,power consumption and usage patterns are largely unknown. All ME in this report, including lighting, isplug-load, as opposed to hard-wired, although for some equipment (e.g., commercial refrigerators) we didassume a plug. The sheer variety of ME necessitates developing a taxonomy by which it can becategorized and summarized. Appendix C presents our current miscellaneous equipment taxonomy.
For each unit of miscellaneous equipment we recorded any information (e.g., power state or rated power)that could be used to estimate unit energy consumption (UEC). For lighting we recorded lamp type (e.g.,halogen), wattage, and fixture type (desk, floor, track, etc.). For battery chargers, we noted the portablecomponent (drill, oto-opthalmoscope, walkie-talkie. etc.) and whether the charger was empty or full. Forvending machines, we recorded temperature and product (e.g., cold beverage) and any lighting. Forunknown equipment we noted make and model for later determination of identity and power specifications.
LBNL-53729 7
As with office equipment, we noted if there was a PIPS or ILPS. We also recorded PIPSs and ILPSs thatwere plugged in but unattached to equipment (such as a PIPS used to charge an absent cell phone) andthose whose equipment could not be identified, such as among a maze of cords in a server room.Nevertheless, we undoubtedly missed some, so our reported number of PIPSs and ILPSs is actually aconservative estimate.
Limitations of This Methodology
One advantage of conducting after-hours building walk-throughs to collect data on office equipment powerstatus is that more buildings can be surveyed with a given amount of time and money. On the other hand,the data collected represents a snapshot in time, and does not capture variations in user behavior over time,which would require automated long-term time series metering of equipment power state and power levels.
This is our most robust sample of buildings to date for collecting data on the after hours power status ofoffice equipment. It includes data on 1,683 computers (including desktops, ICSs, laptops and servers) andabout 448,000 ft2 in 12 commercial buildings, including schools and health care facilities in California,Georgia, and Pennsylvania. (In comparison, our previous (2000) survey included 1,280 computers in 11office buildings in California and Washington DC.) However, we do not suggest that this sample isrepresentative of commercial buildings as a whole or in part (e.g., by type, size, age, or location), or that theresults presented here are statistically significant. It is a record of what we found that we hope will be ofuse to policy makers, researchers, and building managers.
Results and Discussion
Equipment Density
Table 2 shows the number and density, per 1000 approximate gross square feet, of office equipment (OE),miscellaneous equipment (ME), and the sum of OE and ME in each building, and for all buildings. Oursurvey captured data on over 10,000 units of equipment, including almost 4,000 units of office equipment.
Table 2. Office and Miscellaneous Equipment: Number of Units and Densitysorted by Density of Office Equipment (units/1000 ft2)
Number of Units Density (units/1000 ft2) Density (units/employee)bldg type site OE ME OE+ME OE ME OE+ME OE ME OE+MEmedium office E 98 441 539 4.5 20.0 24.5 1.4 6.3 7.7education F 574 596 1,170 5.7 6.0 11.7 ! !large office M 227 753 980 5.7 18.8 24.5 1.8 6.0 7.8education D 258 291 549 6.5 7.3 13.7 ! !health care J 171 458 629 6.6 17.6 24.2 ! !medium office B 410 422 832 7.5 7.7 15.1 3.2 3.3 6.5education N 204 234 438 10.2 11.7 21.9 ! !health care G 460 1,002 1,462 10.2 22.3 32.5 ! !education A 377 259 636 13.5 9.3 22.7 ! !small office K 275 528 803 13.8 26.4 40.2 3.6 6.9 10.4medium office H 340 630 970 14.2 26.3 40.4 4.5 8.3 12.8large office C 540 612 1,152 19.3 21.9 41.1 4.5 5.1 9.6all buildings 3,934 6,226 10,160 8.8 13.9 22.7 3.2 5.7 8.9

LBNL-53729 8
Note that the numbers of miscellaneous equipment units in Table 2 are lower than those in Appendix Dbecause Table 2 does not include plug-in and in-line power supplies, while Appendix D does.
Figure 2 illustrates office and miscellaneous equipment density (per 1000 square feet), by building type.
Figure 2. Office and Miscellaneous Equipment Density, by Building Type (and number)
From Table 2 we see that the two buildings with the lowest combined equipment density are high schools,and Figure 2 shows that education buildings in our sample had the lowest equipment densities overall.Among our sample of 12 buildings, building types with the highest densities are small and large offices.We suggest that small offices may have high equipment density because every office needs certain devices(e.g., copier, fax machine, microwave oven, refrigerator), regardless of how many (or few) people share it.Medium offices exhibited a range of density (see Table 2, sites B, H), but on average their office equipmentdensity is similar to and their miscellaneous equipment density is lower than that of health care facilities.
Closer examination of the results for each building reveals some underlying trends. For example, the onlytwo buildings with a computer density less than 2 per 1000 ft2 (from Table 1) were offices (one medium,one large) whose employees tend to rely on laptop computers, most of which were absent during our visit;one of these companies requires employees to take their laptops home or lock them up when not at work.
Office Equipment
Our sample includes data on the power state of 1,453 desktop computers (well above our target of 1,000),1,598 monitors, 353 printers, 89 servers, 79 MFDs, 47 fax machines, 45 ICSs, 34 scanners, and 33 copiers.Among printers, our discussion of results will focus on the 158 laser and 123 inkjet printers found.
13.811.3
8.9 8.4 7.5 8.8
26.4
20.120.6
14.8
7.3
13.9
0
5
10
15
20
25
30
35
40
45
small office (1) large office (2) health care (2) medium office (3) educational (4) all buildings (12)
Equi
pmen
t Den
sity
(uni
ts pe
r 100
0 sq
. ft.)
Miscellaneous Equipment
Office Equipment
LBNL-53729 9
Among all buildings, computer density ranges from 1.7 to 9.4 per 1000 ft2 gross floor area, (see Table 1).Among office buildings only, computer density ranges from 0.53 to 2.18 per employee. Office equipmentdensity ranges from 4.5 to 19.3 units per 1000 ft2 gross floor area, with an average of 8.8 (see Table 2).Among offices, office equipment density ranges from 1.4 to 4.5 units per employee, with an average of 3.2.
When analyzing the numbers of equipment in each power state, we are primarily interested in two values:turn-off rates and power management (PM) rates. ‘Turn-off rate’ is the percent of each equipment type thatis turned off, while “PM” rate is the percent of those not off that are in low power.
Table 3 shows the numbers of each type of office equipment, and their after-hours power state. Table 3does not include laptop computers, units that were unplugged, or units whose power state was unknown.
Table 3. Office Equipment: After-hours Power States
Equipment Number PercentCategory Type on low off sum on low off PM ratecomputers desktop 869 60 524 1453 60% 4% 36% 6%! server 87 2 89 98% 0% 2% n/a! ICS 7 11 27 45 16% 24% 60% 61%monitors CRT 259 648 422 1329 19% 49% 32% 71%! LCD 56 164 49 269 21% 61% 18% 75%printers laser 53 81 24 158 34% 51% 15% 60%! inkjet 86 37 123 70% n/a 30% n/a! impact 16 6 22 73% n/a 27% n/a! thermal 31 7 38 82% n/a 18% n/a! wide format 2 6 8 25% 0% 75% 0%! solid ink 1 3 ! 4 25% 75% 0% 75%MFDs inkjet 9 4 3 16 56% 25% 19% 31%! laser 36 14 13 63 57% 22% 21% 28%copiers all 12 5 16 33 36% 15% 48% 29%fax machines all 44 3 47 94% 6% 0% 6%scanners all 8 12 14 34 24% 35% 41% 60%
Note: “PM rate” is the percent of units not off that were in low power.
Not surprisingly, turn-off rates were lowest among fax machines and server computers. Turn-off rates werehighest for integrated computer systems (60%), copiers (48%), and scanners (41%). PM rates were highestamong LCD monitors (75%), CRT monitors (71%), ICSs (61%), scanners (60%), and laser printers (60%).
The lowest power management rates were among desktop computers and fax machines (6% of each).Because copiers and MFDs often have long (2-4 hour) PM delay settings that may not have elapsed at thetime of our visit, PM rates in Table 3 for this equipment should be considered a minimum or lower bound.Figure 3 (below) graphically shows the breakdown by power state of each major type of office equipment.
Computers
We categorized computers as either desktop, integrated computer systems (ICSs), servers, or laptops.Among 1,453 desktop computers the turn-off rate was 36%; it ranged from 5% (at Site E, medium office)to 67% (at Site B, medium office). Only 6% of all desktop computers that were not off were in low power.This PM rate is similar to the 5% rate found in a previous study (Webber, Roberson et al. 2001). Amongthe 45 ICSs in Table 3 the turn-off rate was 60%, and the PM rate was 61%. However, it is possible that ofthe 11 ICSs found in low power, only the display (but not the CPU) was in low power.
LBNL-53729 10
Figure 3. Office Equipment Power States
Among education buildings in our sample, the majority of the desktop computers, monitors and ICSs werefound in classrooms clearly dedicated to computer-based learning. These “computer labs” typically have a1:1 ratio between computers and chairs. Among the two high schools, 65% of desktop computers and ICSswere found in computer labs with at least 15 (and up to 77) computers each; among the two universityclassroom buildings, 68% of desktop computers and ICSs were found in computer labs with at least 15 (andup to 57) computers each. Because a single instructor likely controls the after-hours power status of allequipment in these rooms, and also because school buildings in general experience more ‘after-hours’ peryear than other buildings, computer labs present a target for energy-efficiency efforts in schools.
Laptop Computers
There are 50 laptop computers in our sample, and we recorded information on the power state of 37. Ofthose 37, all but two (or 95%) were plugged in, either through their power cord or a docking station. Nine(or 24%) of the 37 laptops were clearly on; i.e., their display showed a desktop, application, or login screen.
Sixty percent (60%, or 21) of the 35 laptops that were plugged in were plugged into docking stations.2 Ofthe 107 docking stations found, 20% (21) were “full”, i.e., contained laptop computers, while 80% (86)were “empty,” or without laptops. Those empty docking stations are evidence of at least 86 more laptopcomputers that were absent at the time of our visit. In addition, we found 35 power cords with ILPSs thatwe identified as “laptop charger, empty” (and which we consider in the “power” category of miscellaneousequipment). Combined with the 50 laptop computers and 86 empty docking stations found, we conclude
2 We consider docking stations to be in the “computer peripheral” category of miscellaneous equipment, whereaslaptop computers are office equipment.
0% 20% 40% 60% 80% 100%
scanners
fax machines
copiers
MFDs
inkjet printers
laser printers
LCD monitors
CRT monitors
ICS
desktop computers
onlowoff
LBNL-53729 11
that at least 171 laptop computers are in use among our sample of buildings. Of course, this number doesnot include – and we did not attempt to estimate – the number of people who take both their laptopcomputer and its power cord/battery charger home or lock them in a drawer at night.
If we compare this minimum number of laptop computers to the total number of non-server computers inour sample, from Table 3 (1,453 desktops + 45 ICSs, + 171 laptops = 1669 total), laptops compriseapproximately 10% of non-server computers found in our survey; again, this is a conservative estimate.
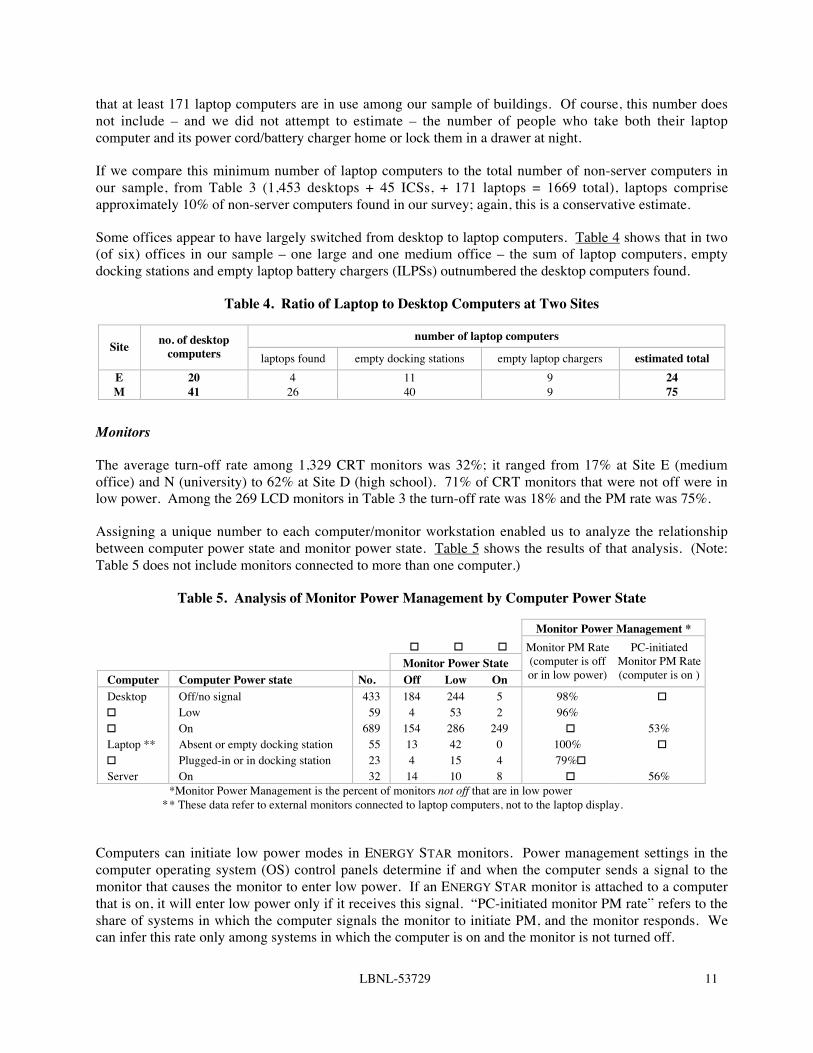
Some offices appear to have largely switched from desktop to laptop computers. Table 4 shows that in two(of six) offices in our sample – one large and one medium office – the sum of laptop computers, emptydocking stations and empty laptop battery chargers (ILPSs) outnumbered the desktop computers found.
Table 4. Ratio of Laptop to Desktop Computers at Two Sites
number of laptop computersSite no. of desktop
computers laptops found empty docking stations empty laptop chargers estimated totalE 20 4 11 9 24M 41 26 40 9 75
Monitors
The average turn-off rate among 1,329 CRT monitors was 32%; it ranged from 17% at Site E (mediumoffice) and N (university) to 62% at Site D (high school). 71% of CRT monitors that were not off were inlow power. Among the 269 LCD monitors in Table 3 the turn-off rate was 18% and the PM rate was 75%.
Assigning a unique number to each computer/monitor workstation enabled us to analyze the relationshipbetween computer power state and monitor power state. Table 5 shows the results of that analysis. (Note:Table 5 does not include monitors connected to more than one computer.)
Table 5. Analysis of Monitor Power Management by Computer Power State
Monitor Power Management *! ! !
Monitor Power StateComputer Computer Power state No. Off Low On
Monitor PM Rate(computer is offor in low power)
PC-initiatedMonitor PM Rate(computer is on )
Desktop Off/no signal 433 184 244 5 98% !! Low 59 4 53 2 96%! On 689 154 286 249 ! 53%Laptop ** Absent or empty docking station 55 13 42 0 100% !! Plugged-in or in docking station 23 4 15 4 79%!Server On 32 14 10 8 ! 56%
**Monitor Power Management is the percent of monitors not off that are in low power* These data refer to external monitors connected to laptop computers, not to the laptop display.
Computers can initiate low power modes in ENERGY STAR monitors. Power management settings in thecomputer operating system (OS) control panels determine if and when the computer sends a signal to themonitor that causes the monitor to enter low power. If an ENERGY STAR monitor is attached to a computerthat is on, it will enter low power only if it receives this signal. “PC-initiated monitor PM rate” refers to theshare of systems in which the computer signals the monitor to initiate PM, and the monitor responds. Wecan infer this rate only among systems in which the computer is on and the monitor is not turned off.

LBNL-53729 12
An ENERGY STAR monitor can also enter low power if there is no video signal from the computer, eitherbecause the computer is off, it is in low power, or the monitor is disconnected from the computer. “MonitorPM rate” refers to the share of monitors that power manage in the absence of a signal from the computer.
Among monitors that were not turned off, those connected to computers that were off or absent hadmonitor power management rates of 98% (with desktop computers) and 100% (with laptops); monitors notoff and connected to desktop computers that were in low power had a 96% monitor PM rate. In theremaining cases, the monitor may have been incapable of power managing (i.e., it was non-ENERGY STAR).Monitors not off and connected to desktop or server computers that were on had PC-initiated monitor PMrates that were much lower: 53% (for desktop computers) and 56% (for servers). Clearly, monitors thatdepended on a computer signal to initiate power management were much less likely to enter low power.
In our 2000 study we did not uniquely identify each workstation and so could not conduct this analysis.However, our 2003 monitor ”PC-initiated PM rate” differs from the monitor “PM enabling rate” of anotherrecent but unpublished study. In 2001, researchers at Energy Solutions in Oakland CA (O'Sullivan 2003)used EZ Save software3 to remotely obtain (via local area networks) the PM settings of over 7,000computer monitors at 17 commercial and institutional sites in the San Francisco Bay area. They found thatmonitor PM settings in the computer OS control panel were enabled for 44% of monitors. We wouldexpect the share of monitors that actually power manage when the computer is on to be lower than theshare of computers enabled to power manage their monitors (because some monitors may not be ENERGYSTAR, there may be network interferences with PM, etc). However, our “PC-initiated PM rate” of 53% fordesktop computers is higher than the 44% “PM enabling rate” found by Energy Solutions. There areseveral possible explanations for this:
1) Energy Solutions’ 2001 sample contained significantly more computers using the Windows NT OS(which does not support PM and is no longer supported by Microsoft) than LBNL’s 2003 sample,
2) Newer computers may be more successful at initiating monitor power management, and newercomputer equipment (like newer buildings) may be over-represented in our 2003 sample,
3) Our PC-initiated PM rate is calculated from a subset of monitors (those left on and attached to a PCleft on), while Energy Solutions’ enabling rate represents all monitors. If turn-off and enablingrates are not independent (i.e., if people who leave their devices on at night are more likely toenable than those who turn their devices off), that could explain part or all of the discrepancy.
4) PC-initiated monitor PM rates actually have risen, as individuals and organizations respond toENERGY STAR or other educational programs about the energy savings potential of monitor PM, or
5) Our 2003 sample includes a wider variety of commercial building types and locations, and so ismore representative than data collected only from office buildings in California,.
In any case, the ability of computers to power manage monitors deserves further scrutiny and improvement.
In the report on our 2000 office equipment field surveys (Webber, Roberson et al. 2001) we speculated thatmonitors in low power might be thought by users to be off. Among buildings in this report, Site M, a largeoffice, offers anecdotal evidence regarding user (mis)interpretation of monitor power state. According tothe facility manager, this company’s strict policy is that employees turn their monitors off before leaving,and security personnel turn off any monitors found left on. Our data show that only 4% of monitors wereon, but only 29% were actually off; the remaining 65% were in low power mode. This confirms our fieldobservations that if a display is black or blank, users often assume the monitor is off, even though the frontpanel power indicator (which is amber and/or blinking when the unit is in low power) indicates otherwise.
3 EZ Save software was developed by the Department of Energy and adapted by the EPA ENERGY STAR program.
LBNL-53729 13
LCD monitors were not even mentioned in the report on our 2000 field surveys of office equipment, but in2003, LCDs were 17% of all monitors. As shown in Table 6, at three sites (including two high schools, Dand F) we found no LCD monitors, but at two sites (E, medium office; A, university building), LCDmonitors outnumbered CRT monitors, and at three others (B and H, both medium offices; and J, healthcare) LCDs were over 25% of all monitors found.
Table 6. Number and Percent of LCD Monitors, by Sitesorted by percent of LCD monitors
site D F C M G K N J H B A E allLCDs 0 0 2 4 12 14 13 18 40 66 96 21 286CRTs 89 248 254 97 162 88 76 46 104 111 79 12 1366total 89 248 256 101 174 102 89 64 144 177 175 33 1652
% LCDs 0% 0% 0% 4% 7% 14% 15% 28% 28% 37% 55% 64% 17%
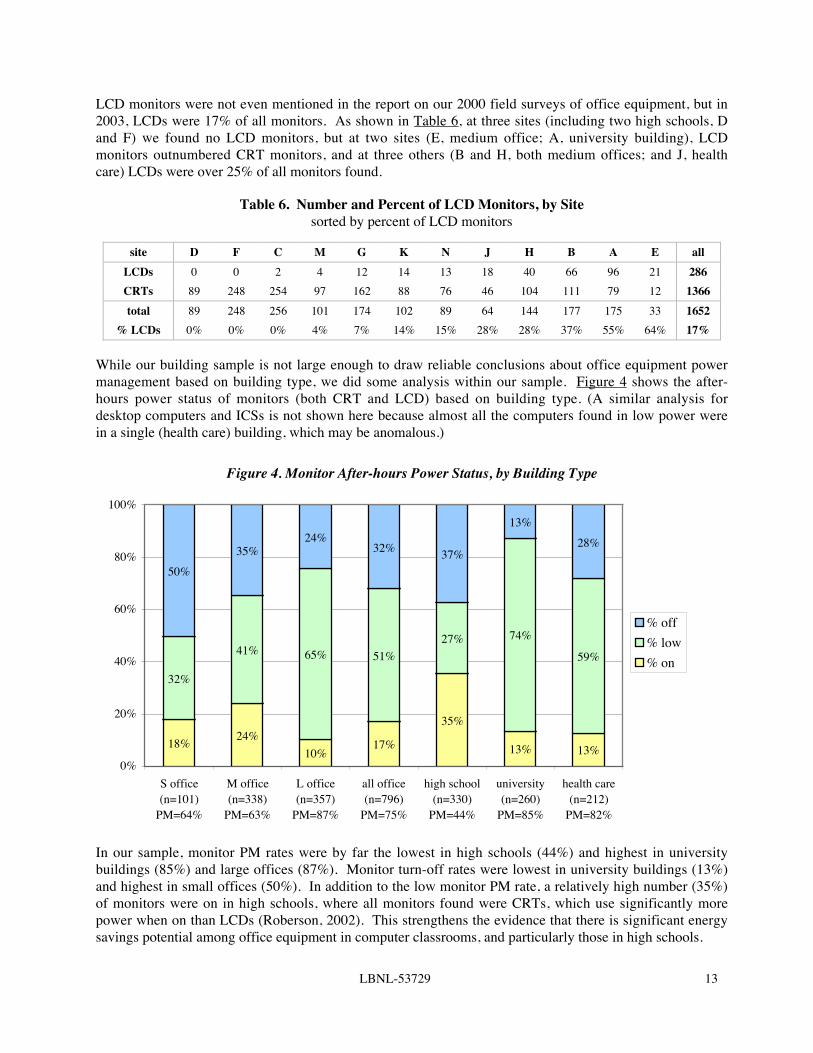
While our building sample is not large enough to draw reliable conclusions about office equipment powermanagement based on building type, we did some analysis within our sample. Figure 4 shows the after-hours power status of monitors (both CRT and LCD) based on building type. (A similar analysis fordesktop computers and ICSs is not shown here because almost all the computers found in low power werein a single (health care) building, which may be anomalous.)
Figure 4. Monitor After-hours Power Status, by Building Type
In our sample, monitor PM rates were by far the lowest in high schools (44%) and highest in universitybuildings (85%) and large offices (87%). Monitor turn-off rates were lowest in university buildings (13%)and highest in small offices (50%). In addition to the low monitor PM rate, a relatively high number (35%)of monitors were on in high schools, where all monitors found were CRTs, which use significantly morepower when on than LCDs (Roberson, 2002). This strengthens the evidence that there is significant energysavings potential among office equipment in computer classrooms, and particularly those in high schools.
18% 24%10%
17%
35%
13% 13%
32%
41% 65% 51%27% 74%
59%
50%35%
24%32% 37%
13%28%
0%
20%
40%
60%
80%
100%
S office(n=101)
PM=64%
M office(n=338)
PM=63%
L office(n=357)
PM=87%
all office(n=796)
PM=75%
high school(n=330)
PM=44%
university(n=260)
PM=85%
health care(n=212)
PM=82%
% off% low% on

LBNL-53729 14
Printers
We categorize printers based on imaging technology: laser, inkjet, impact, thermal, wide format, solid ink.4Figure 5 shows the composition of our sample. Of 385 printers, 45% (174) were laser, 34% (132) wereinkjet, 11% (41) were thermal, 6% (25) were impact, 2% (8) were wide format, and 1% (4) were solid ink.
Figure 5. Printer Sample, by Technology
impact6%
inkjet34%
thermal11%
wide format
2%
laser46%
solid ink1%
Of 158 laser printers in our sample, 15% were off, and 60% of those not off were in low power mode.Among the 123 inkjet printers the turn-off rate was 30%; we found no inkjet printers in low power. Of 38thermal printers, which do not power manage, the turn-off rate was 18%. Of four solid ink printers nonewere off, but three (75%) were in low power.
For laser printers we tried to record “powersave” (i.e., low power) delay settings and whether or not theywere networked. We did not record delay settings for laser printers that were off, or for those that did nothave user interactive menus. Of 78 laser printers for which we actually recorded delay settings, 18% (14)were set to 15 minutes, 59% (46) were 30 minutes, 12% (9) were 60 minutes, 6% (5) were 180-240minutes, and 5% (4) were set to “never” or off. Figure 6 displays this graphically.
Figure 6. Laser Printers: Powersave Delay Settings
18%
59%
12%
6% 5%15 min
30 min
60 min
180-240 min
never
4 Wide-format is not an imaging technology, but rather an ENERGY STAR category for printers that accommodate 17”x22” or larger paper. Of 8 wide format printers in our sample, 7 used inkjet, and one used impact technology.

LBNL-53729 15
Among printers for which we recorded the presence or absence of a network connection, 63% of laserprinters but only 7% of inkjet printers were networked.
Only 60% of laser printers not off were actually found in low power (see Table 3). Not all laser printerscan power manage (i.e., they are not ENERGY STAR), and so do not have powersave delay settings. Amonglaser printers that can power manage, there are several reasons they might be found on during our survey:(1) the printer has a long (3-4 hour) powersave delay setting, which had not elapsed, (2) the printer wasrecently used, and (3) the printer is in error mode, which effectively prevents it from entering low power.
Multi-Function Devices
The ENERGY STAR Office Equipment program distinguishes “digital copier-based MFDs,” which arecovered by their MFD program, from printer- and fax-based MFDs, which are covered by their printerprogram. In this study, we identify any multi-function device as an MFD, and distinguish between them onthe basis of imaging technology (inkjet or laser), which we think is most relevant to power consumption.
Many units of office equipment that we identified in the field as copiers, fax machines, or printers turnedout, on later examination of their specifications, to actually be multi-function devices (MFDs). Among the80 MFDs eventually identified, 80% (64) used laser technology, and the remaining 20% (16) were inkjets.Turn-off and PM rates were similar for laser and inkjet MFDs. Of 63 laser MFDs in Table 3 the turn-offrate was 21%, and 28% of those that were not off were in low power. Of 16 inkjet MFDs (at least some ofwhich can power manage) the turn-off rate was 19%, and 31% of those not off were in low power.
Copiers
Of the 33 copy machines in Table 3, 48% were off and 29% of those that were not off were in low power.This low PM rate may be due in part to the fact that copiers often have powersave delay settings of twohours or more, and some of the copiers that we found on would eventually have entered low power.
Our 2000 field surveys of office equipment included 34 copiers and 11 ‘digital copier-based MFDs,’ whichyields a copier to ‘digital copier-based MFD’ ratio of 3:1. Our current sample includes 33 copiers and 64laser or ‘digital copier-based MFDs,’ which yields a 2003 copier to ‘digital copier-based MFD’ ratio of0.5:1. These numbers confirm our field observations that MFDs are replacing copiers in the marketplace.
Fax Machines
It can be difficult to tell whether a fax machineis on or in low power. Also, many units meetENERGY STAR’s low power requirement whenon but idle or ‘ready’, and so do not need aseparate low power mode. In this study, unless afax machine gave a visual indication that it wasin low power, we recorded it as being on. Of the47 units in our sample and in Table 3, none wereoff and 6% (3) were in low power. Of the 44 faxmachines whose technology we were able todetermine, 69% (30) were laser, 20% (9) werethermal, and 11% (5) were inkjet. Figure 7displays this graphically.
Figure 7. Fax Machine Technology
laser69%
inkjet11%
thermal20%

LBNL-53729 16
Scanners
Of the 34 scanners in Table 3, 41% were off and 60% of those that were not off were in low power. Of thetotal 37 scanners in our sample, 76% (28) were flatbed scanners, 14% (5) were specialized documentscanners, 5% (2) were wide format, and 5% (2) were slide scanners. Among flatbed scanners only, 18%(5) were on, 43% (18) were in low power, 29% (8) were off, and 11% (3) were unplugged. All fivedocument scanners were off; both wide format scanners were found in the same room, and were on.
Office Equipment: Comparison of 2000 and 2003 Turn-off and PM Rates
A primary goal of this study is to update information on office equipment turn-off and power managementrates from previous studies, and to broaden the range of buildings in which this data is collected. Table 7compares the office equipment turn-off and PM rates from this series of surveys to those from our 2000field surveys of office buildings in California (Webber, Roberson et al. 2001).
In most cases, our 2003 field data yield turn off and PM rates that are virtually the same as those found in2000. Notable exceptions are that monitor PM rates were higher (72% in 2003 c.f. 56% in 2000) and MFDPM rates were much lower in 2003 than in 2000 (29% in 2003 c.f. 56% in 2000). Also, copier and scannerturn-off rates were higher in 2003 than in 2000.
Table 7. Office Equipment Turn-off and Power Management Rates
Turn-off Rate PM RateCategory Type no. in 2003 2000 2003 2000 2003computers desktop + ICS 1,498 44% 37% 5% 7%! desktop 1,453 ! 36% ! 6%! ICS 45 ! 60% ! 61%monitors all 1,598 32% 29% 56% 72%! CRT 1,329 ! 32% ! 71%! LCD 269 ! 18% ! 75% printers all 353 25% 23% 44% 31%! monochrome laser 24% ! 53% !! high-end color 15% ! 61% !! laser 158 ! 15% ! 60%! inkjet 123 31% 30% 3% 0%! impact 22 31% 27% 0% 0%! thermal 38 ! 18% ! 0%! wide format 8 57% 75% 32% 0%! solid ink 4 ! 0% ! 75%MFDs all 79 18% 20% 56% 29%! inkjet 16 ! 19% ! 31%! laser 63 ! 21% ! 28%copiers all 33 18% 49% 32% 28%fax machines all 47 2% 0% ! 6%scanners all 34 29% 41% ! 60%
For computers, the 2003 PM rate of 6% is similar to the estimated 2000 rate of 5%, but the 2003 turn-offrate of 36% for desktop computers is lower than the 2000 turn-off rate of 44% for all computers.

LBNL-53729 17
The 2003 turn-off rate of 32% for CRTs matches the 2000 turn-off rate for all monitors, but the 2003 turn-off rate of 18% for LCD monitors is much lower. In 2003 we found a much higher PM rate for both CRTand LCD monitors (71% and 75%, respectively) than the 56% PM rate reported for all monitors in 2000.
For all laser printers (of which <2% are color) our 2003 turn-off rate of 15% is lower than the 2000 rate of24% for monochrome laser printers. The 2003 turn-off rates for inkjet (30%) and impact (27%) printers aresimilar to the 2000 rates for both (31%). Among our small sample of 8 wide format printers in 2003, the75% turn-off rate is significantly higher than the 57% reported in 2000. The 2003 turn-off rate of 0% for (asample of four) solid ink printers is lower than the 2000 turn-off rate of 15% for high-end color printers.
The 2003 PM rate of 60% for laser printers is similar to the 2000 rate of 61% for “high end color” printers.In 2000 some inkjet and wide-format printers were in low power, but in 2003 we found none.
The 2000 study did not report on thermal or solid ink printers, probably because few or none were found.Solid ink is not a widespread printer technology; in 2003 we found four, all in the same building. Of 41thermal printers in our 2003 sample, only 15% were found in offices; another 15% were in educationbuildings, but 70% were found in health care buildings. For thermal printers the 2003 turn-off rate is 18%;for solid ink printers it is 0%. The 2003 PM rate for thermal printers is 0%; for solid ink it’s 75%.
In 2003 we distinguish between laser and inkjet MFDs, but their turn-off rates (19 and 21%, respectively)are similar to the 2000 rate of 18% for all MFDs. However, in 2003 the PM rate for both inkjet and laserMFDs (31 and 28%, respectively) are significantly lower than the 2000 rate of 56% for all MFDs.
Copiers had a much higher turn-off rate in 2003 (49%) than in 2000 (18%), but their PM rate in 2003(28%) is slightly lower than in 2000 (32%). Because of confusion about fax machine power state, no PMrate was reported in 2000; however, in 2003, at least 6% of fax machines were in low power. For scanners,the turn-off rate rose from 29% in 2000 to 41% in 2003; the 2003 PM rate was 60%.
Miscellaneous Equipment
Miscellaneous equipment outnumbered office equipment in every building except one, at a university (siteA); at one medium office (site E), the ratio of miscellaneous equipment to office equipment exceeded 4:1.For all buildings combined, if external power supplies are included as miscellaneous equipment, the ratio ofmiscellaneous equipment (7,66 units, Appendix D) to office equipment (3,934 units, Table 2) is almost 2:1.
For all buildings combined, the most numerous equipment types in each ME category are as follows:• audio/visual: television (27% of audio/visual category), VCR (23%), overhead projector (14%)• food/beverage: microwave oven (16%), undercabinet refrigerator (15%), coffee maker (12%)• portable hvac: 8-16” diameter fan (35%), heater (21%), < 8” diameter fan (20%)• laboratory: scale (24%), spectrophotometer (18%), tabletop centrifuge (13%)• lighting: fluorescent undercabinet lamp (60%), 13W compact fluorescent lamp (15%)• medical: oto-opthalmoscope charger (25%), exam light (18%), x-ray light box (12%)• networking: switch (30%), hub (22%), modem (14%)• office misc.: clock and/or radio (22%), compact audio system (18%), pencil sharpener (17%)• peripheral: computer speaker pair (52%), laptop docking station (12%), PDA dock (11%)• power: lighted power strip (36%), plug-in power supply (35%), in-line power supply (8%)• telephony: powered phone (42%), headset with network box (13%), conference phone (11%)• maintenance: vacuum cleaner (21%), floor polisher (14%), clothes washer or dryer (12%).
Appendix D lists the number of miscellaneous equipment (ME) units, by category, found in each building.For all sites combined, the most numerous miscellaneous equipment categories are power (including
LBNL-53729 18
external power supplies, which are discussed in the following section), lighting, and computer peripherals.The least numerous categories of plug-load miscellaneous equipment are money exchange and security.
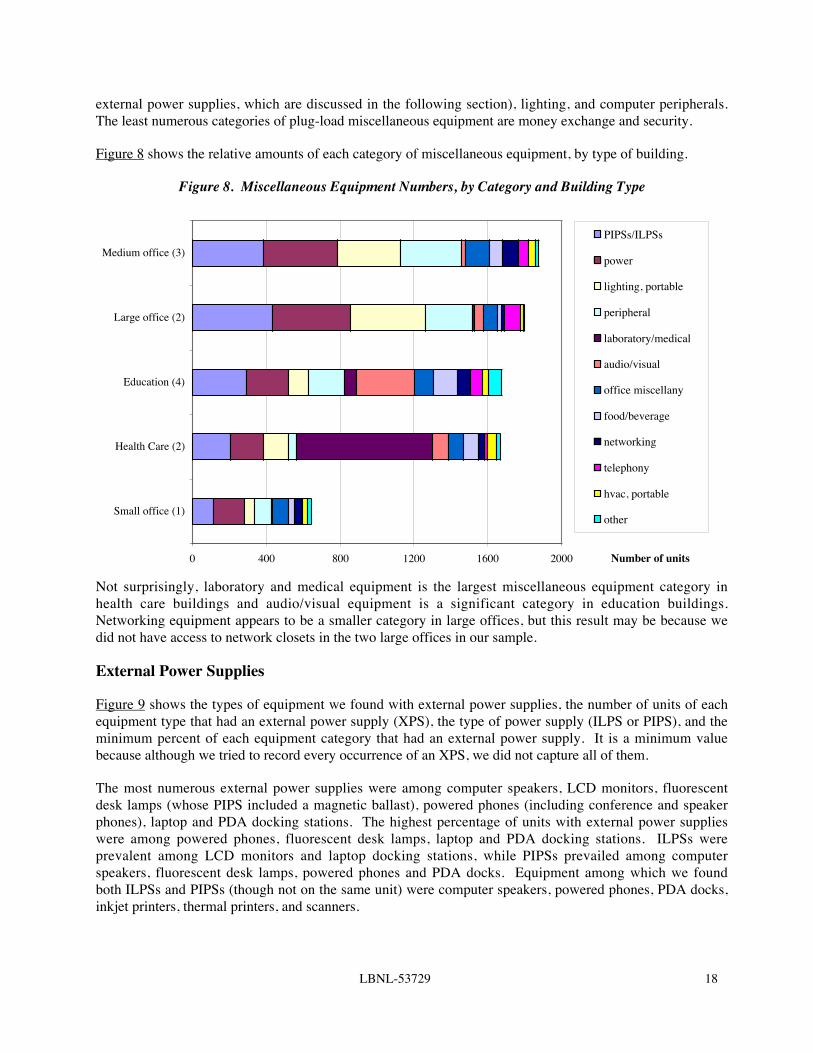
Figure 8 shows the relative amounts of each category of miscellaneous equipment, by type of building.
Figure 8. Miscellaneous Equipment Numbers, by Category and Building Type
Not surprisingly, laboratory and medical equipment is the largest miscellaneous equipment category inhealth care buildings and audio/visual equipment is a significant category in education buildings.Networking equipment appears to be a smaller category in large offices, but this result may be because wedid not have access to network closets in the two large offices in our sample.
External Power Supplies
Figure 9 shows the types of equipment we found with external power supplies, the number of units of eachequipment type that had an external power supply (XPS), the type of power supply (ILPS or PIPS), and theminimum percent of each equipment category that had an external power supply. It is a minimum valuebecause although we tried to record every occurrence of an XPS, we did not capture all of them.
The most numerous external power supplies were among computer speakers, LCD monitors, fluorescentdesk lamps (whose PIPS included a magnetic ballast), powered phones (including conference and speakerphones), laptop and PDA docking stations. The highest percentage of units with external power supplieswere among powered phones, fluorescent desk lamps, laptop and PDA docking stations. ILPSs wereprevalent among LCD monitors and laptop docking stations, while PIPSs prevailed among computerspeakers, fluorescent desk lamps, powered phones and PDA docks. Equipment among which we foundboth ILPSs and PIPSs (though not on the same unit) were computer speakers, powered phones, PDA docks,inkjet printers, thermal printers, and scanners.
0 400 800 1200 1600 2000
Small office (1)
Health Care (2)
Education (4)
Large office (2)
Medium office (3)
Number of units
PIPSs/ILPSs
power
lighting, portable
peripheral
laboratory/medical
audio/visual
office miscellany
food/beverage
networking
telephony
hvac, portable
other

LBNL-53729 19
Figure 9. External Power Supplies: Number, Type and Frequency
Conclusions
For all buildings combined, the average plug-load equipment density in units per 1000 gross ft2, was about9 for office equipment and 14 for miscellaneous equipment, for a sum of about 23 units per 1000 gross ft2.Educational buildings, where large floor areas are devoted to classrooms, had the lowest density of bothoffice and miscellaneous equipment. However, two-thirds of computers and monitors found in educationalbuildings (and thus most of the energy savings potential) were concentrated in computer-based classrooms.
Among offices only (for which we were able to estimate number of employees, or occupants), the averageequipment density, in units per employee, was approximately 3 units of office equipment and 6 units ofmiscellaneous equipment per employee, for a sum of about 9 electrical plug-load devices per employee;note that this includes equipment found in common areas such as kitchens, print centers, and utility closets.Because we have not attempted to estimate equipment density before, these data represent a baseline forreference and comparison with future data.
Office Equipment
A good overview of our results regarding office equipment power states is provided by Figure 3 (page 10),which allows a visual comparison of the percent of units found on, in low power, or off, by equipment type.Power management, indicated by the middle segment of each bar, is most successful among monitors andlaser printers; and least successful among desktop computers, inkjet printers, copiers, and fax machines.Turn-off rates, indicated by the right segment of each bar, are highest (≥ 40%) among integrated computersystems (ICS), copiers, and scanners; and lowest (≤ 20%) among laser printers, LCD monitors, and MFDs.
59%
93%96%
90%86%
31%
49%
18%
8%
54%
0
50
100
150
200
250
300
Computerspeakers
LCDMonitor
Fluor desklamp
Poweredphone
Laptop dock PDA dock InkjetPrinters
ThermalPrinters
Scanners Inkjet MFD
Number of Units
0%
10%
20%
30%
40%
50%
60%
70%
80%
90%
100%
in-line power supply
plug-in power supply
Min. % of units withexternal power supply

LBNL-53729 20
This is the first field study in which we analyzed the effect of computer power state on monitor power state.Only 6% of desktop computers in this study of commercial buildings were found in low power, and only53% of those that were on successfully initiated power management in monitors. Computers in homes(where fewer are networked) may have higher enabling rates, but we have no data from residences. Clearlythere is significant room for improvement in power management of computers, and more data are needed toidentify the parameters that affect the ability of computers to power manage themselves and their monitors.
In contrast, 96-98% of monitors connected to computers that were not on were found in low power, so avery high proportion of monitors are ENERGY STAR compliant, or capable of power managing themselves.
This report presents evidence of the growing use of laptop computers. Because of their inherent portability,accounting for laptops is difficult, especially during an after-hours survey, but our conservative estimate isthat laptops comprise at least 10% of the non-server computers in our sample. We also estimate thatlaptops outnumbered desktop computers at two sites: one medium and one large office. To the extent thatrelatively energy-efficient laptops are replacing desktop computers, significant electrical energy is saved.However, more work is needed to characterize laptop usage patterns and energy consumption, which canvary widely depending on how often they are used when plugged in and how often the battery is charged.Laptop power state data from this survey can be useful in developing a typical unit energy consumption(UEC) for laptop computers, but needs to be supplemented by data not available from after-hours surveys.
LCD monitors, which use significantly less energy when on than CRT monitors, are also penetrating themarket. They outnumbered CRT monitors at two of the twelve sites in our sample: a medium office and auniversity classroom building. In contrast, we found no LCD monitors at three sites: two high schools anda large office. We expect the market share of LCD monitors to continue to grow as older CRT monitors arereplaced and LCD monitor technology improves and becomes more affordable due to economies of scale.
For both types of education buildings in our sample (high schools and university classroom buildings), two-thirds of computers and monitors found were in “computer labs,” or classrooms with a 1:1 ratio betweencomputer workstations and chairs.5 Some university computer labs had LCD monitors, but all the highschool computer labs we visited had CRT monitors, many of which were found on after-hours. With somany workstations located in one room, and (presumably) controlled by one or very few instructor(s), wesuggest efficiency efforts in high schools focus on reducing power consumed by equipment in these rooms.
Among our sample of printers, 46% were laser and 34% were inkjet. The turn-off rate was twice as high(30%) for inkjet printers as for laser printers (15%); inkjet printers are more likely to be turned off thanlaser printers because they are much less likely to be networked. Among laser printers, 77% had powermanagement (PM) delay settings of 30 minutes or less, and only 5% were disabled (i.e., set to “never”).This indicates a high market penetration for ENERGY STAR laser printers; however, for reasons discussedabove (including error messages and after-hours network use), the actual PM rate for laser printers is lowerthan indicated by PM delay settings. Nevertheless, the 2003 PM rate of 60% for laser printers is higherthan the 2000 PM rate of 53% for monochrome laser printers, suggesting improvement in actual PM rates.
Eighty percent (80%) of multi-function devices (MFDs) that we found used laser imaging technology; theother 20% were inkjet. For both types, the average turn-off rate was about 20%, and the average PM ratewas 30%, significantly lower than the 56% PM rate for MFDs observed in 2000. Power management ratesamong MFDs are important because MFDs appear to be replacing copiers in the workplace; the ratio ofdigital copier-based MFDs to copiers rose from 1:3 in our 2000 survey of office equipment to 2:1 in the 5 We do not necessarily assume a 1:1 ratio between chairs and people; occupancy rates may vary between classes.

LBNL-53729 21
2003 survey reported here. However, while most MFDs can also fax, print, and scan, we did not observe acorresponding decrease in the relative number of fax machines, printers and scanners.
Miscellaneous Equipment
The inventory of miscellaneous plug-load equipment presented in this report represents a first step towardcharacterizing the electrical demand of this large end-use category. Miscellaneous equipment outnumberedoffice equipment in our sample by a factor of almost two to one. While some energy-intensive devices,such as commercial refrigeration equipment, have been the target of efficiency efforts, including ENERGYSTAR labeling, other less consumptive but more numerous devices, such as computer peripherals andexternal power supplies, may offer significant energy savings potential.
According to our system of taxonomy, by far the most numerous category of miscellaneous plug-loadequipment was ‘power,’ including power strips, surge suppressors, and external power supplies. Thesecond most numerous category was ‘lighting,’ particularly undercabinet and compact fluorescent lamps,and the next most numerous category was computer ‘peripherals,’ 52% of which were computer speakerpairs. However, the numbers of each type of equipment do not necessarily reflect their relative energyintensity. The next step is to estimate typical unit energy consumption (UEC) for the most common typesof miscellaneous equipment, so we can begin to sort out their relative contribution to plug-load end use.
Future Work
The low rate of power management in desktop computers causes concern and deserves further investigationto ascertain barriers to computer power management as well as the most effective ways to mitigate them.One possibility would be to conduct more in-depth case studies in several types of buildings to identifyspecific institutional or technological impediments and evaluate the efficacy of various counter measures.Increasing power management among PCs would yield significant savings in both computers and monitors.
The increasing use of laptop computers makes it important to characterize their unit energy consumption.This would likely involve visiting offices during working hours and asking laptop users about their usagepatterns, including how often the laptop is powered from a wall outlet and how often the battery is charged.It would also be useful to estimate the extent to which laptops are used in addition to or instead of desktops.
Results of this study point to the savings potential among computers and monitors in computer classrooms.We should improve our assessment of computer usage patterns in schools and develop effective strategiesfor realizing these savings. It would then be possible to implement prospective energy-saving measures inseveral computer classrooms and schools, and conduct follow-up surveys to evaluate their relative efficacy.
It would be useful to supplement these survey results with automated, network-based collection of dataregarding usage patterns and power management settings of computers, printers, fax machines, and MFDs.While the former provides more detail, the latter yields significantly more data over longer periods of time.
Developing estimates of typical unit energy consumption (UEC) for miscellaneous equipment entails:• estimating the power consumption of each type of device by using any existing metered data,
power specifications (from the manufacturer), or metering of equipment power use,• estimating the hours per year each type of equipment type spends in each power state, through
survey results and long-term metering, and• documenting our assumptions and sources of uncertainty, for future reference and refinement.
LBNL-53729 22
Once we have UECs for most common types of miscellaneous equipment, we can calculate their relativeenergy intensity among all buildings in our sample, or between various types of buildings. Given the utilitybills for an individual building, we could work with building managers to estimate the portion of totalbuilding energy load attributable to miscellaneous plug-loads, and identify opportunities for saving energy.
Additional after-hours building surveys could improve our understanding of office equipment usage andmiscellaneous plug loads. Surveying a single building more than once (e.g., at weekly, monthly intervals)would help us to assess the robustness of the results from a single survey. The representativeness of ouroffice equipment sample would be improved (compared to CBECS, for example) by visiting more largeoffices, and the completeness of our miscellaneous equipment inventory could be improved by ensuringthat we survey their common or service areas such as network, phone and other utility closets.Furthermore, now that we have a baseline inventory of miscellaneous equipment, additional surveys wouldenable us to track changes in the numbers and types of miscellaneous equipment, as well as their after-hours power status, and begin to characterize the typical ‘plug-load profile’ for various types of buildings.
References
EIA. 2003. Annual Energy Outlook 2003 with Projections to 2025, Dept of Energy, Energy InformationAdministration, Washington DC.
EIA/CBECS. 2002. Computers and Photocopiers in Commercial Buildings. Energy Information Agency,Commercial Building Energy Consumption Survey. US Dept of Energy (DOE), Washington DC,.6 pgs.
EPA/DOE. 2003. History of Energy Star. http://208.254.22.7/index.cfm?c=about.ab_history
McCarthy, Kathryn, and R.E. Brown. 2002. (Draft) A Field Method to Quickly Detect Power State inPlug-in Devices. LBNL-54169. Lawrence Berkeley National Laboratory, Berkeley CA.
O'Sullivan, Terry, of Energy Solutions, Oakland CA. 2003. Personal Communication, November 30:Monitor power management enabling rates determined by EZ Save software.
Roberson, Judy A., G.K. Homan, et al. 2002. Energy Use and Power Levels in New Monitors andPersonal Computers. LBNL-48581. Lawrence Berkeley Lab, Berkeley CA. 36 pgs.http://enduse.lbl.gov/Info/Pubs.html
Webber, Carrie A., R.E. Brown, et al. 2002. Savings Estimates for the Energy Star Voluntary LabelingProgram: 2001 Status Report. LBNL-48496. Lawrence Berkeley National Laboratory, BerkeleyCA. 29 pgs.
Webber, Carrie A., J.A. Roberson, et al. 2001. Field Surveys of Office Equipment Operating Patterns.LBNL-46930. Lawrence Berkeley National Laboratory, Berkeley CA.http://enduse.lbl.gov/Info/Pubs.html
LBNL-53729 23
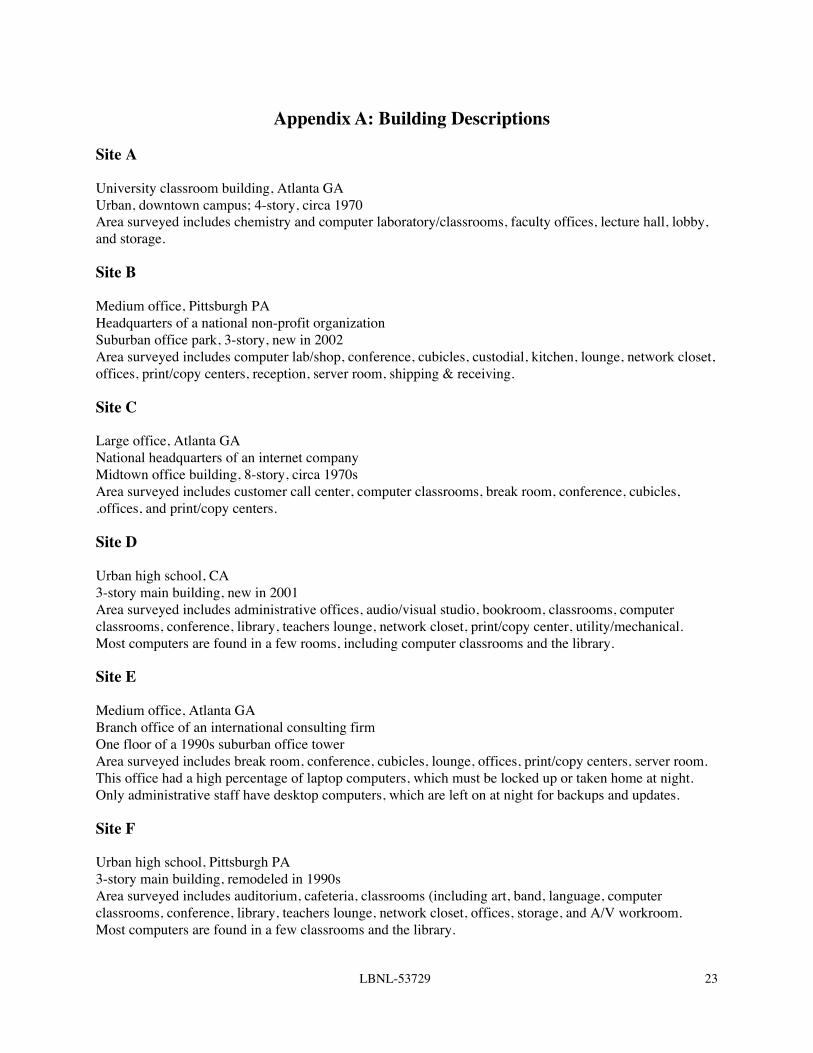
Appendix A: Building Descriptions
Site A
University classroom building, Atlanta GAUrban, downtown campus; 4-story, circa 1970Area surveyed includes chemistry and computer laboratory/classrooms, faculty offices, lecture hall, lobby,and storage.
Site B
Medium office, Pittsburgh PAHeadquarters of a national non-profit organizationSuburban office park, 3-story, new in 2002Area surveyed includes computer lab/shop, conference, cubicles, custodial, kitchen, lounge, network closet,offices, print/copy centers, reception, server room, shipping & receiving.
Site C
Large office, Atlanta GANational headquarters of an internet companyMidtown office building, 8-story, circa 1970sArea surveyed includes customer call center, computer classrooms, break room, conference, cubicles,.offices, and print/copy centers.
Site D
Urban high school, CA3-story main building, new in 2001Area surveyed includes administrative offices, audio/visual studio, bookroom, classrooms, computerclassrooms, conference, library, teachers lounge, network closet, print/copy center, utility/mechanical.Most computers are found in a few rooms, including computer classrooms and the library.
Site E
Medium office, Atlanta GABranch office of an international consulting firmOne floor of a 1990s suburban office towerArea surveyed includes break room, conference, cubicles, lounge, offices, print/copy centers, server room.This office had a high percentage of laptop computers, which must be locked up or taken home at night.Only administrative staff have desktop computers, which are left on at night for backups and updates.
Site F
Urban high school, Pittsburgh PA3-story main building, remodeled in 1990sArea surveyed includes auditorium, cafeteria, classrooms (including art, band, language, computerclassrooms, conference, library, teachers lounge, network closet, offices, storage, and A/V workroom.Most computers are found in a few classrooms and the library.
LBNL-53729 24
Site G
Outpatient clinic, San Francisco CA10-story urban medical campus buildingArea surveyed includes conference, cubicles medical labs, library, lounges, exam rooms (including E/N/T,general medicine, ophthalmology, pediatric), nurses stations, offices, patient registration, phone bank,medical utility, treatment rooms, and waiting. Each exam and treatment room had a computer/monitor.
Site H
Medium office, Atlanta GAInformation services department of a university6-story urban campus building, circa 1970sArea surveyed includes break room, conference, copy/print center, cubicles, custodial, lounge, networkcloset, offices, server room , and utility/mechanical.
Site J
Medical office building, Pittsburgh PASuites of physicians in private practice5-story suburban building,Area surveyed includes break room, conference, exam rooms (including cardiology, E/N/T, endocrinology,ophthalmology, sleep disorders, urology), kitchen, labs, offices, server room, storage, utility, and waiting.
Site K
Small office, Pittsburgh PA5 small businesses in 3 different suburban buildingsArea surveyed includes break room, conference, copy/print center, cubicles, electronics shop, networkcloset, offices, server room , and storage.
Site M
Large office, Pittsburgh PACorporate headquarters of a major manufacturerUrban downtown office building, 6-story, new in 2001Area surveyed includes conference, copy/print centers, cubicles, kitchen, lounge, health center, offices.Many employees in this office use laptop computers. Company policy is to turn monitors off at night (toprevent fires); special permission is required to bring in or use small appliances (fans, heaters, lamps, etc).
Site N
University classroom building, Atlanta GAUrban, downtown campus; 4-story, circa 1960The area surveyed included computer laboratories and classrooms, other classrooms, and offices of faculty,staff, and graduate students.
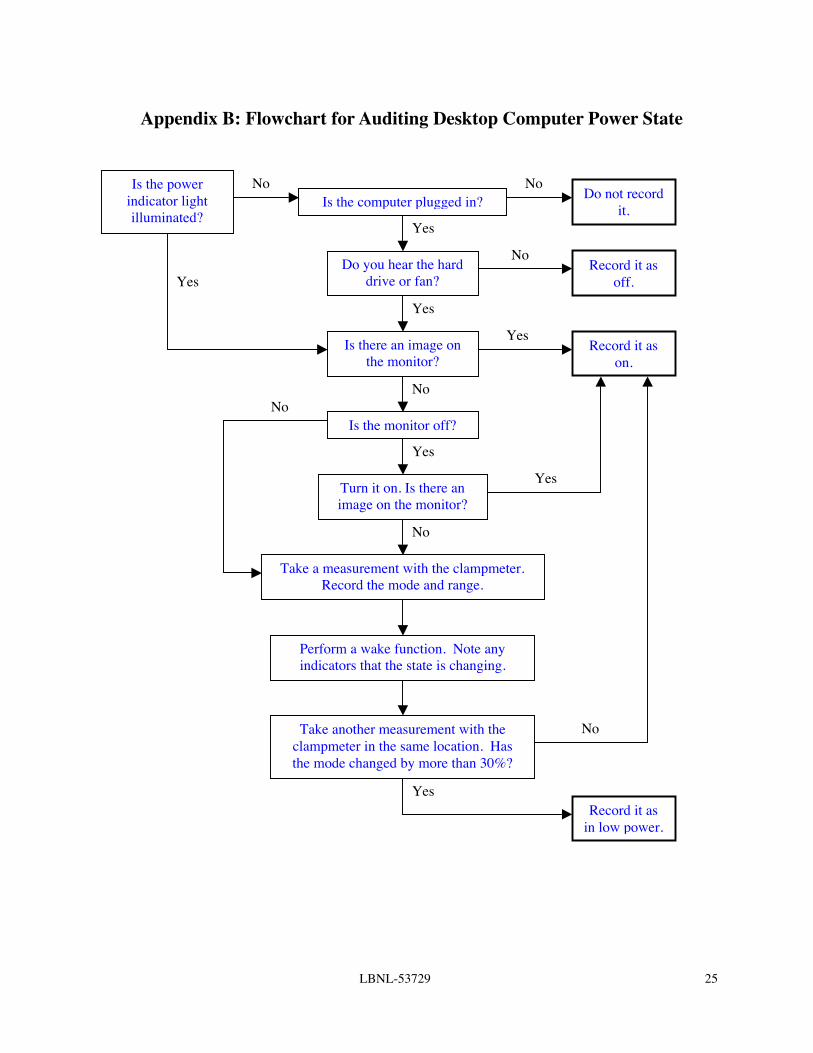
LBNL-53729 25
Appendix B: Flowchart for Auditing Desktop Computer Power State
No
Is the powerindicator lightilluminated?
Is the computer plugged in?No
Do not recordit.
Do you hear the harddrive or fan?
Yes
Record it asoff.
No
Yes
Is there an image onthe monitor?
No
YesRecord it as
on.
Turn it on. Is there animage on the monitor?
No
Yes
Take a measurement with the clampmeter.Record the mode and range.
Perform a wake function. Note anyindicators that the state is changing.
Take another measurement with theclampmeter in the same location. Hasthe mode changed by more than 30%?
YesRecord it as
in low power.
No
Yes
Is the monitor off?No
Yes

LBNL-53729 26
Appendix C: Miscellaneous Equipment Taxonomy
Category Equipment Type (not an exhaustive list)
audio/visualtelevision, video cassette player/recorder, overhead projector, audio amplifier, compact disk audiodevice, digital video disk device, slide projector, video monitor, audio mixer, audio tape device, LEDdisplay sign, receiver, speaker, tuner, digital video camera, video conferencing device, microfilmviewer, scan converter, public address system, set-top box
food & beveragemicrowave oven, refrigerator (all sizes), coffee maker, toaster/toaster oven, vending machine,hot/cold bottled water tap, hot pot/kettle, water cooler, freezer, hot beverage dispenser, hot foodcabinet, ice maker, coffee grinder, drinking fountain, fryer/griddle, steam trays, visi-cooler, meatslicer, mixer, soda fountain pump, blender, refrigerated case
hvac, portable fan, heater, air cleaner, room air conditioner
laboratory scale, spectrophotometer, tabletop centrifuge, temperature monitor, lab refrigerator, microscope,autoclave, shaker/stirrer, lab freezer, hot plate/warmer, drying oven, timer
lightingfluorescent undercabinet lamp (by size), desk/table/floor lamp (by lamp type and power use),incandescent spotlight or studio lamp, decorative lamp, strand or cable lights, fluorescent light box,incandescent or halogen track light or recessed lamp, exterior fluorescent sign
medical oto-opthalmoscope charger, exam light or headlamp, x-ray light box, exam chair or table, body scale,hospital bed, utensil sterilizer, blood pressure monitor, IV cart
medical specialtyvital signs monitor, respirator, defibrillator charger, EKG machine & accessories, pulse oxymeter, eyechart projector, lensmeter, glucometer charger, hot bead sterilizer, suction pump charger, hearing testdevice, retinal scanner, fundus camera, hyfrecator, sonoscope
money exchange credit card reader, cash register, bar code scanner, change or stamp vending machine
networking modem, router, hub, printer hub, switch, print controller/server, video processor, wireless accesspoint, audio/video modulator, tape drive, broadband distribution amplifier, driver
office miscellanyclock and/or radio, boombox or compact audio system, pencil sharpener, adding machine, shredder,typewriter, stapler, postage meter or scale, hole punch, laminator, time stamper, binding machine,microfiche reader
peripheralcomputer speakers (pair), laptop docking station, personal digital assistant dock, computer projector,keyboard/video/mouse switch, external drive (CD, zip, hard disk, tape backup), pen tablet, digitalwhiteboard,
power power strip, surge protector, PIPS, ILPS, uninterruptible power supply, charger (for laptop computer,cell or cordless phone, power tool), power conditioner, battery backup system
security badge reader, book demagnetizer, shoplifting sensor, article surveillance system
specialty pottery wheel, mobile bookshelves, oscilloscope, shrinkwrapper, bench wheel, soldering iron
telephonyconference or speaker phone, answering machine, intercom, phone switch, phone jack or box,dictation machine, PBX phone line converter, voice control box, switchboard phone, integrated voiceserver
utility/maintenance vacuum cleaner, floor polisher, dishwasher, ultrasonic cleaner, water purifier, clothes washer or dryer

27
Appendix D: Miscellaneous Equipment Numbers, by Category and Site
Sorted in descending order
Note; Plug-in and in-line power supplies are listed separately, but are actually part of the power category
site code G M C H F K E J B A D N Allbldg type medical L office L office M office school S office M office medical M office school school school
ME Category sumpower 114 220 205 174 57 167 87 64 139 36 44 86 1393
lighting 85 226 179 158 70 52 172 51 15 8 10 20 1046plug-in power supply 92 123 221 111 34 84 76 35 88 60 24 42 990
peripheral 13 104 150 125 85 82 87 9 118 36 30 44 883audio/visual 58 28 24 8 144 7 8 27 2 65 90 23 484
office miscellany 28 68 6 34 38 86 18 56 86 9 33 19 481medical 393 5 76 474
in-line power supply 25 72 16 69 27 32 29 56 10 95 13 444food/beverage 29 9 15 31 71 33 14 51 24 19 30 14 340
networking 27 8 8 48 43 46 31 21 6 4 11 11 264telephony 5 76 15 26 49 10 20 8 12 3 1 8 233
medical specialty 149 3 2 70 224hvac, portable 41 1 13 24 7 24 5 11 6 3 20 4 159
laboratory 44 1 10 63 118utility/maintenance 3 2 14 4 2 2 4 9 8 4 52
specialty 1 2 13 14 3 1 9 1 44money exchange 12 1 3 3 2 6 3 3 33
security 1 1 1 1 2 6sum 1119 948 853 810 658 644 549 549 520 414 315 289 7668