Embed Size (px)
Citation preview

Africa’s Missed Agricultural Revolution: A QuantitativeStudy of the Policy Options
Melanie O’Gorman∗
October 11, 2012
Abstract
Despite the widespread diffusion of productivity-enhancing agricultural technologies theworld over, agriculture in Sub-Saharan Africa has typically stagnated. This paper developsa quantitative model in order to shed light on the sources of low labor productivity inAfrican agriculture. The model provides a vehicle for understanding the mechanismsleading to low agricultural labor productivity, in particular, how the interactions betweenfactor endowments, government investment and technology adoption may have culminatedin agricultural stagnation. I calibrate the model to data for four Sub-Saharan Africaneconomies, and use this calibrated model to provide insight into policy aimed at increasingagricultural productivity in Africa. Policies aimed at improving rural infrastructure orproductivity in the non-agricultural sectors, or allowing for land transferability, wouldbe most effective for increasing agricultural labor productivity, and would further bringincreases in household welfare for each of the countries I calibrate to.
Journal of Economic Literature Classification Numbers: O11, O33, O55Keywords: Africa; Agricultural labor productivity; Technology adoption; Macroeco-
nomic Analyses of Economic Development
∗Department of Economics, The University of Winnipeg, 515 Portage Avenue, Winnipeg, Manitoba, CanadaR3B 2E9. [email protected]. Phone: 1-204-786-9696. Fax: 1-204-774-4134.
1

1 Introduction
The purpose of this paper is to gain insight into the sources of agricultural stagnation in Sub-Saharan Africa over the past few decades. Whereas labor productivity in agriculture grew at anaverage annual rate of 3% between 1960 and 2000 across the developing countries as a whole,it grew at an average annual rate of only 0.6% in Sub-Saharan Africa (FAOSTAT (2004)). Theimplications of this dilemma are huge - with roughly 60% of the region’s labor, and 90% of theregion’s poor, currently working directly in agriculture, it is difficult to imagine how significantpoverty reduction in Africa can occur without increased productivity in agriculture. While theliterature has, qualitatively, identified important mechanisms leading to agricultural stagnationin Africa, this paper provides a theory that allows the relative importance of the various factorsinfluencing agricultural productivity to be quantified. The question of this paper is then: giventhe multitude of possible impediments to agricultural growth in Africa, which are quantitativelyimportant?
The answer to this question in turn provides insight into where policy should focus forimproving agricultural labor productivity in Sub-Saharan Africa. In the near future, thereshould be increased resources flowing to the agricultural sector in many African countries, as36 African governments have signed on to the 2003 Maputo Declaration, which committed themto spend at least 10% of their national budgets on the agricultural sector. The question of thispaper could therefore be re-framed to ask: what is the best use of increased resources beingdevoted to the agricultural sector in terms of increasing agricultural labor productivity?
In order to address the question of this paper, I develop a static 3-sector model with en-dogenous agricultural technology adoption. This model provides the first attempt to develop atheoretical framework for analyzing the factors influencing agricultural productivity in Africaat the macroeconomic level. The theory demonstrates how the interactions between factorendowments, technological innovation and adoption, and government investment in agriculturemay have culminated in agricultural stagnation in Sub-Saharan Africa. It illustrates that alack of expenditure on agricultural research and development, both at the international andnational levels may have reduced high-yielding seed productivity and consequently adoption ofsuch seeds in Sub-Saharan Africa relative to other developing regions. Furthermore, the benefitsof other productivity-enhancing innovations, such as fertilizers, may have been outweighed bythat of the more traditional agricultural techniques, such as labor. This is because agriculturallabor has been relatively inexpensive in many Sub-Saharan African countries. Low governmentinvestment in road networks has compounded this situation by increasing the shadow costsor reducing the benefits of modern agricultural technologies, reinforcing farmers’ decisions tomaintain traditional production patterns.
The quantitative nature of the model allows me to quantify which of the above-mentionedmechanisms is most important for understanding agricultural stagnation in Africa. I calibrate

the model to data for the four Sub-Saharan African economies in 2000. In calibrating toSub-Saharan African data, I follow a recent trend in the literature of using calibrated modelsto examine macroeconomic phenomena in the Sub-Saharan African context (see for exampleCaucutt and Kumar (2008), Wobst (2001), Rattso and Stokke (2007) and Thissen and Lensink(2001)).
That the model endogenizes technology adoption illustrates the potentially important im-pact of various factors on Sub-Saharan African agricultural development. I use the calibratedmodels to perform a number of counterfactual scenarios, as mentioned above, to shed light onwhich mechanisms of the model are most important, but also to investigate the relevance ofvarious hypotheses put forward in the literature for explaining African agricultural stagnation.The first is that agricultural stagnation in Sub-Saharan Africa stems largely from the poorquality of African soils, in particular due to the lower fertility of tropical soils. The secondhypothesis asserts that a lack of land transferability in many Sub-Saharan African countrieshas entailed an inefficient land distribution. A system of land titling could thus spur input useand technology adoption, consequently leading to higher labor productivity in agriculture. Thethird hypothesis is that ‘transport costs matter’, that governments in Africa have not investedin their road networks sufficiently so as to increase the marginal benefit of modern technologiesand hence improve agricultural productivity. The fourth hypothesis and fifth hypotheses arethat Africa’s missed agricultural revolution has to do with a dearth of international agriculturalresearch and hiring of scientists for the agricultural research sector. The final hypothesis is thatweaknesses in other sectors of Sub-Saharan African economies have constrained agricultural de-velopment through negative feedback effects between the sectors. This hypothesis then assertsthat a key root cause of stagnation of agricultural labor productivity is actually inefficienciesin the non-agricultural sectors, stemming for example from things such as corruption, excessiveregulation or human capital scarcity.
The counterfactual scenarios conducted suggest that a lack of high quality land and lownon-agricultural total factor productivity have been key constraints for agricultural labor pro-ductivity. Of all the experiments conducted, an improvement in rural infrastructure would leadto the largest increase in labor productivity (on average 8%), while also entailing a welfare gainfor households. The largest welfare gain would occur with the allowance of land transferability,while such a policy would also improve agricultural labor productivity on average by 7.8%.An increase in non-agricultural TFP would bring an average increase in labor productivity of7% for the 4 countries considered, while an increase in land quality would bring on average a3% increase in labor productivity. Such experiments point to important policies for improv-ing agricultural labor productivity. In particular, they suggest that African governments anddonor organizations should prioritize investment in rural infrastructure and soil conservation,land titling and the labor productivity of sectors other than agriculture.
The literature studying the determinants of productivity growth in Sub-Saharan Africanagriculture is vast. A multitude of micro-level studies have pointed to key impediments to

agricultural productivity growth in specific areas in Africa.1 Studies at the macro-level havealso given much insight into factors which are likely at the root of agricultural stagnation acrossAfrica.2 While the latter literature has, qualitatively, identified important mechanisms leadingto agricultural stagnation in Africa, policy must be directed at factors found to be quantitativelyimportant. This paper provides a comprehensive theory that allows the relative importance ofthe various factors influencing agricultural productivity to be quantified.
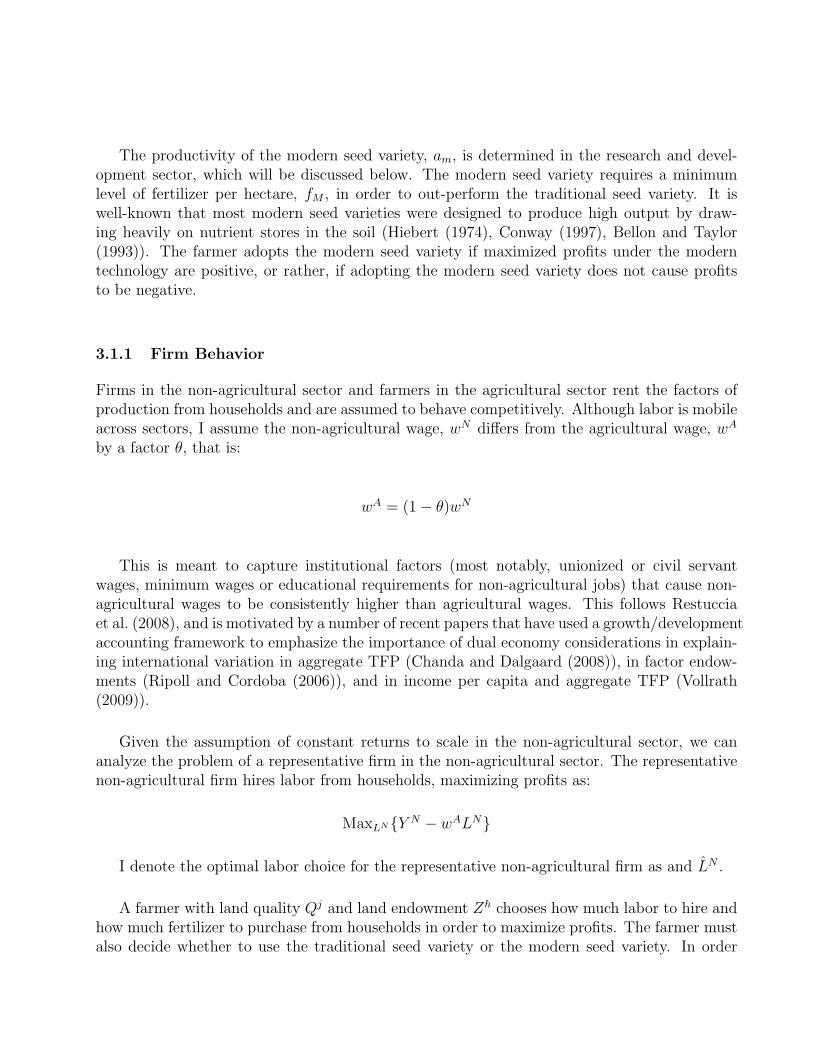
Understanding the determinants of agricultural labor productivity in Sub-Saharan Africa iscrucial for understanding the large agricultural productivity differences that exist across coun-tries around the world. This is because the Sub-Saharan African countries occupy the bottomtail of the global agricultural labor productivity distribution. Of the 46 African countries forwhich there is data available, all countries (with the exception of South Africa and Mauritius)were in the bottom 50% of the global labor productivity distribution in both 1965 and 2000.Labor productivity in the Sub-Saharan African countries has consistently been the lowest inthe world. As mentioned above, Africa’s lack of convergence of agricultural labor productiv-ity is especially evident given rapid productivity growth in agriculture in the other developingregions, as demonstrated in Figure 1 below.
Hence understanding the barriers to agricultural productivity growth in Sub-Saharan Africawill bring us closer to understanding the large disparity of agricultural labor productivity acrosscountries. As demonstrated by a number of important theories put forward in the macroeco-nomics literature recently (in particular Restuccia et al. (2008), Gollin et al. (2007), Gollinet al. (2002) and Adamopoulos (2008)), such an understanding is crucial for decomposing thesources of disparity of aggregate income per capita across countries.
In the next section, I present empirical evidence to motivate the hypotheses tested in thepaper, while Section 3 presents the model of agricultural development. Section 4 presents thesolution of the model so as to motivate the mechanisms behind the counterfactual experimentsthat I conduct. In Section 5 I describe the calibration strategy and results. In Section 6, Ipresent the results of the counterfactual scenarios, while Section 7 concludes.
2 Sources of Agricultural Stagnation in Africa
A glance at the data on agricultural development indicators across developing regions is illu-minating. Table 1 below shows agricultural input use and public expenditure on agriculturein Sub-Saharan Africa relative to Asia and Latin America in 1965 and 2000. I consider three
1A few examples are Byiringiro and Reardon (1996), Winter-Nelson and Temu (2005), Ndjeunga and Bantilan(2005), Johnson and Masters (2004) and Dalton and Guei (2003).
2A few examples of such studies are Frisvold and Ingram (1995), Fulginiti et al. (2004), Kayizzi-Mugerwa(1998), Binswanger and Pingali (1988), Smale and Jayne (2003), Johnson and Evenson (2000), and an IDSBulletin Institute of Development Studies (2005).

01
00
02
00
03
00
0L
ab
or
Pro
du
ctiv
ity (
Int. D
olla
rs))
1960 1970 1980 1990 2000 2010Year
Africa AsiaLat. America Mid. EastE. Europe
Source: Food and Agriculture Organization, FAOSTAT, 2008
1961−2005, International DollarsFigure 1: Agricultural Labor Productivity by Developing Region
different indicators of what can be termed ‘technology adoption’ in agriculture. These threemodern technologies are fertilizer usage, mechanical inputs, and high-yielding seed varieties.Africa has lagged behind Asia and Latin America in terms of each indicator of technologyadoption. Although African agriculture was equally as capital-intensive as Asian agriculture in1965, this advantage was lost over the following 35 years. The use of mechanical implements inAfrica as well as in Asia pales in comparison to mechanization in Latin America.3 There wasalso very slow growth in fertilizer use in Africa over the 1965-2000 period relative to the othertwo regions. Fertilizer use per worker increased only 3-fold in Africa, compared with 7-fold inLatin America and 12-fold in Asia. The diffusion of high-yielding seed varieties, where diffusionis defined as the percentage of area planted to high-yielding varieties of crop seeds, was rapid inAsia and Latin America. However with the exception of wheat, diffusion of such seeds has onlyoccurred since the 1980’s in Africa. This lack of technology adoption in Sub-Saharan Africa hasrendered an agricultural system still very much characterized by traditional techniques. Indeed,the majority of production increases in Sub-Saharan Africa have been based on extending thearea under cultivation (FAOSTAT (2004)).
3So as to not complicate the model of this paper, I have ignored the role of capital. This is an input forwhich there is little variance across Sub-Saharan Africa, and given shrinking land to labor ratios across theregion, this will likely continue to be the case.

Table 1: Agricultural Technology Adoption Across Developing Regions∗
Indicator \ Region Sub-Saharan Asia LatinAfrica America
Year 1965 2000 1965 2000 1965 2000
Capital per worker 0.001 0.0009 0.001 0.003 0.009 0.2Fertilizer per 0.0037 0.009 0.0038 0.041 0.019 0.098workerHigh-yielding seed 0.83 18.5 9.2 50.2 5.3 41.0diffusion∗ Variable definitions and data sources are provided in the Appendix.
Further, much of the literature on agricultural stagnation in Sub-Saharan Africa drawsattention to poor land quality, due to the fact that 83% of Africa’s soils are thought to haveserious soil fertility or other limitations Eswaran et al. (1997).4 Nutrient recovery in Africa hasbeen estimated at roughly 30%, half the rate compared with other developing regions, largelyattributed to poor soil fertility. The majority of available nutrients are thus not used by crops,so that poor soil fertility may have significantly decreased farmers’ ability to raise output ona sustainable basis.5 An additional hypothesis tested with the calibrated model is that thepoor land quality in many African countries has been a quantitatively important constraint foragriculture.
In contrast to the latter proposition that ‘factor endowments matter’, a competing hypoth-esis is that the low level of public expenditure on the agricultural sector in Africa has beenthe critical factor behind agricultural productivity decline. Table 2 above shows that publicexpenditure per worker on agriculture has indeed been lower in Sub-Saharan Africa relativeto Asia and Latin America. Such low expenditure has implied a lower level of what I call‘complementary investments’ for agriculture - things such as irrigation, rural infrastructure,land development and agricultural extension services. Low provision of such public investmentsfor agriculture may decrease farm productivity directly, however it may also be detrimentalfor spurring the adoption of productivity-enhancing technologies. Investment in public sectoragricultural research and development (R&D) has also stagnated in much of Africa since 1980,despite impressive growth in the 1960’s and 1970’s. As a result, the quantity of resourcesper researcher in 1991 averaged about 66% of the amount provided in 1961 for a group of 19African countries considered by Pardey et al. (1998). This suggests that many African coun-tries have lost ground with regards to financing national agricultural research and development.Exacerbating such reduced funding of African national agricultural research and development
4Numerous authors, for example, Bloom and Sachs (1998), Collier (2006), and Wood (2002) have discussedhow features of African geography, such as Africa’s tropical climate, how many countries are landlocked or thehigher virulence of disease across the continent, have served as barriers to economic development.
5A recent paper by Barrios et al. (2008) demonstrates empirically that the dryness of African soils has beena significant barrier to economic growth across the continent.
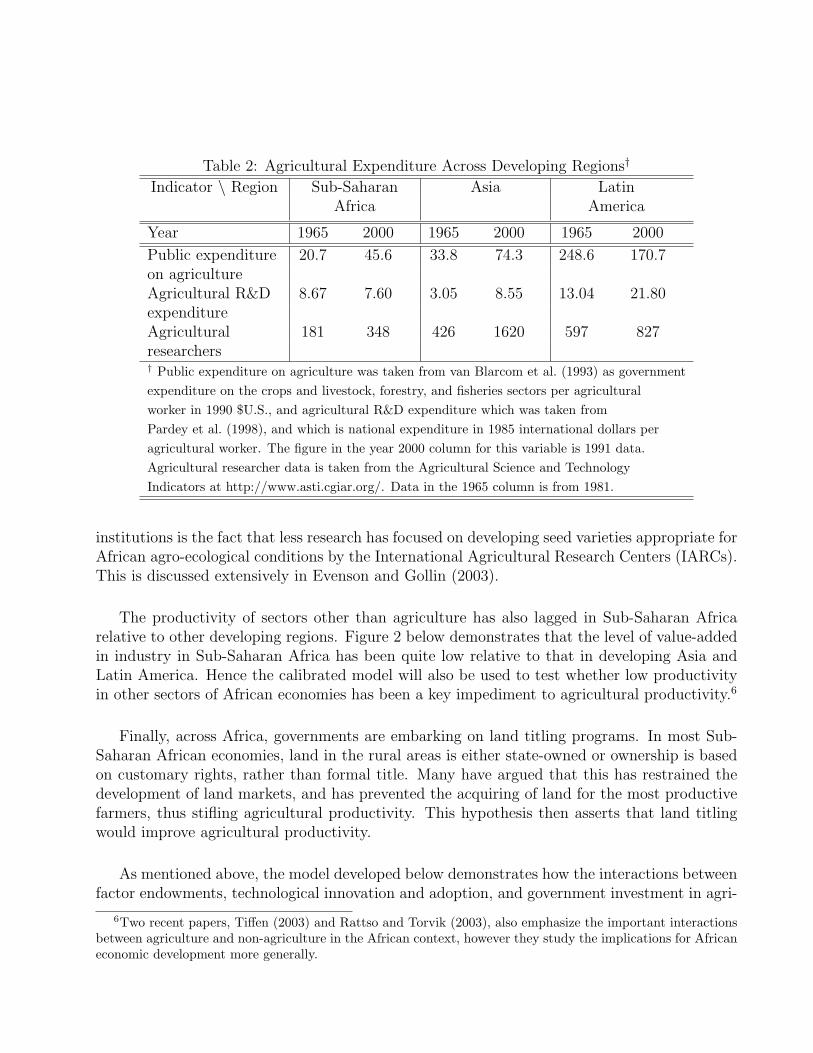
Table 2: Agricultural Expenditure Across Developing Regions†
Indicator \ Region Sub-Saharan Asia LatinAfrica America
Year 1965 2000 1965 2000 1965 2000
Public expenditure 20.7 45.6 33.8 74.3 248.6 170.7on agricultureAgricultural R&D 8.67 7.60 3.05 8.55 13.04 21.80expenditureAgricultural 181 348 426 1620 597 827researchers† Public expenditure on agriculture was taken from van Blarcom et al. (1993) as governmentexpenditure on the crops and livestock, forestry, and fisheries sectors per agriculturalworker in 1990 $U.S., and agricultural R&D expenditure which was taken fromPardey et al. (1998), and which is national expenditure in 1985 international dollars peragricultural worker. The figure in the year 2000 column for this variable is 1991 data.Agricultural researcher data is taken from the Agricultural Science and TechnologyIndicators at http://www.asti.cgiar.org/. Data in the 1965 column is from 1981.
institutions is the fact that less research has focused on developing seed varieties appropriate forAfrican agro-ecological conditions by the International Agricultural Research Centers (IARCs).This is discussed extensively in Evenson and Gollin (2003).
The productivity of sectors other than agriculture has also lagged in Sub-Saharan Africarelative to other developing regions. Figure 2 below demonstrates that the level of value-addedin industry in Sub-Saharan Africa has been quite low relative to that in developing Asia andLatin America. Hence the calibrated model will also be used to test whether low productivityin other sectors of African economies has been a key impediment to agricultural productivity.6
Finally, across Africa, governments are embarking on land titling programs. In most Sub-Saharan African economies, land in the rural areas is either state-owned or ownership is basedon customary rights, rather than formal title. Many have argued that this has restrained thedevelopment of land markets, and has prevented the acquiring of land for the most productivefarmers, thus stifling agricultural productivity. This hypothesis then asserts that land titlingwould improve agricultural productivity.
As mentioned above, the model developed below demonstrates how the interactions betweenfactor endowments, technological innovation and adoption, and government investment in agri-
6Two recent papers, Tiffen (2003) and Rattso and Torvik (2003), also emphasize the important interactionsbetween agriculture and non-agriculture in the African context, however they study the implications for Africaneconomic development more generally.

culture may have culminated in agricultural stagnation in Sub-Saharan Africa. The quantitativenature of the model allows me to test which of the competing hypotheses discussed above arethe most likely causes of low labor productivity in Sub-Saharan African agriculture.
Source: World Development Indicators The World Bank (2005)
3 Model
There are three sectors in the economy - an agricultural sector which produces the agriculturalgood, a non-agricultural sector which produces non-agricultural goods, and a research anddevelopment sector, which produces high-yielding seed varieties to be used in the agriculturalsector. The agricultural good is produced from land, labor, fertilizer and crop seeds. It issimply consumed. The non-agricultural good is produced using labor, and it is consumed.The non-agricultural good is taken as the numeraire. Seed varieties developed by the nationalresearch and development sector are produced using labor and research equipment, and theybuild upon cultivars developed in the IARCs.
3.1 Production
The non-agricultural sector produces output, Y N , using labor LN , as an input. The non-agricultural production function is given as:
Y N = ANLN
Above, AN is the level of labor-augmenting technology in the non-agricultural sector, and itis meant to capture cross-country differences in non-agricultural labor productivity which arenot explicitly modeled.
Farms differ according to their land endowment, Zh, for h = 1...H, and the quality of theirland, represented by Qj, for j = 1...J , so that a farm type is denoted by the superscript (j, h).The agricultural technology is given as:
Y A =∑J
j
∑Hh (f j,h)φ(ZhQjai)
ε(Lj,h)µ
where:
ai =
{am if fj,h
Zh ≥ fM
ao otherwise.
f j,h, and Lj,h above denote, respectively, fertilizer and labor allocations chosen by a farmerwith land quality j and land endowment size h. The parameters φ, ε and µ denote the elasticitiesof agricultural output with respect to fertilizer, effective land and labor respectively. Seedproductivity is denoted ai, where subscript i = o denotes the ‘traditional’ seed type, seeds thathave typically been in use in Africa, while the subscript i = m denotes the ‘modern’ seed type.
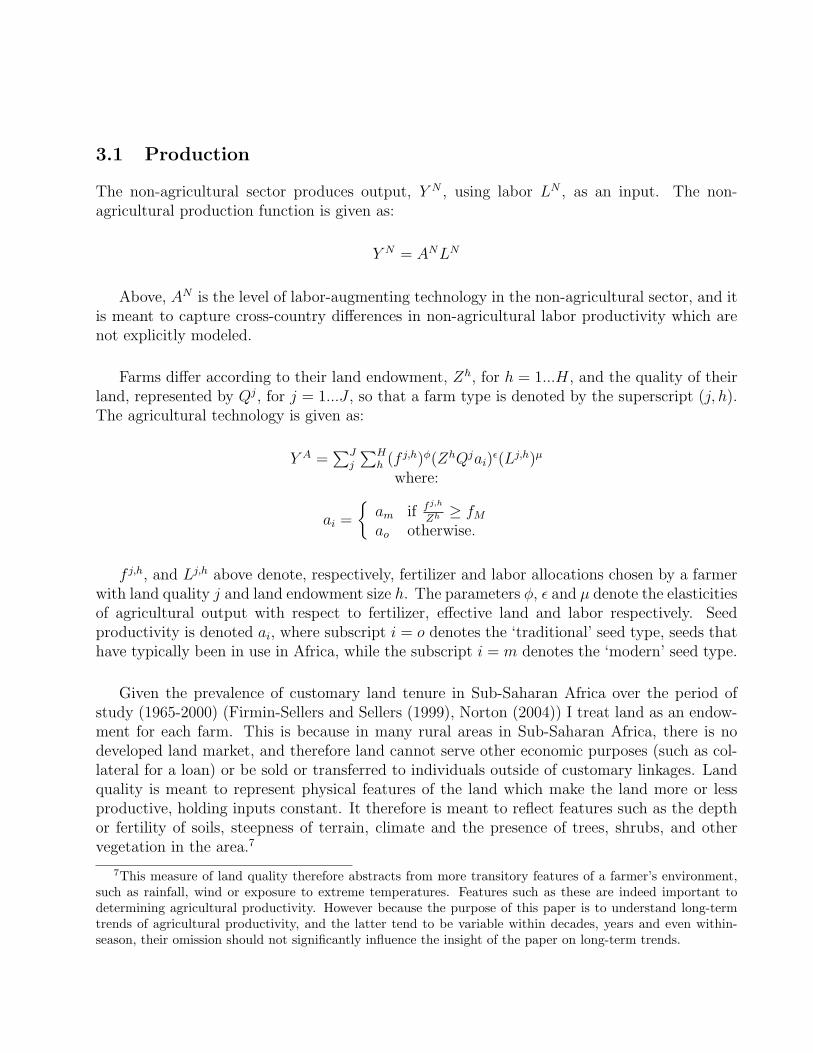
Given the prevalence of customary land tenure in Sub-Saharan Africa over the period ofstudy (1965-2000) (Firmin-Sellers and Sellers (1999), Norton (2004)) I treat land as an endow-ment for each farm. This is because in many rural areas in Sub-Saharan Africa, there is nodeveloped land market, and therefore land cannot serve other economic purposes (such as col-lateral for a loan) or be sold or transferred to individuals outside of customary linkages. Landquality is meant to represent physical features of the land which make the land more or lessproductive, holding inputs constant. It therefore is meant to reflect features such as the depthor fertility of soils, steepness of terrain, climate and the presence of trees, shrubs, and othervegetation in the area.7
7This measure of land quality therefore abstracts from more transitory features of a farmer’s environment,such as rainfall, wind or exposure to extreme temperatures. Features such as these are indeed important todetermining agricultural productivity. However because the purpose of this paper is to understand long-termtrends of agricultural productivity, and the latter tend to be variable within decades, years and even within-season, their omission should not significantly influence the insight of the paper on long-term trends.
The productivity of the modern seed variety, am, is determined in the research and devel-opment sector, which will be discussed below. The modern seed variety requires a minimumlevel of fertilizer per hectare, fM , in order to out-perform the traditional seed variety. It iswell-known that most modern seed varieties were designed to produce high output by draw-ing heavily on nutrient stores in the soil (Hiebert (1974), Conway (1997), Bellon and Taylor(1993)). The farmer adopts the modern seed variety if maximized profits under the moderntechnology are positive, or rather, if adopting the modern seed variety does not cause profitsto be negative.
3.1.1 Firm Behavior
Firms in the non-agricultural sector and farmers in the agricultural sector rent the factors ofproduction from households and are assumed to behave competitively. Although labor is mobileacross sectors, I assume the non-agricultural wage, wN differs from the agricultural wage, wA
by a factor θ, that is:
wA = (1− θ)wN
This is meant to capture institutional factors (most notably, unionized or civil servantwages, minimum wages or educational requirements for non-agricultural jobs) that cause non-agricultural wages to be consistently higher than agricultural wages. This follows Restucciaet al. (2008), and is motivated by a number of recent papers that have used a growth/developmentaccounting framework to emphasize the importance of dual economy considerations in explain-ing international variation in aggregate TFP (Chanda and Dalgaard (2008)), in factor endow-ments (Ripoll and Cordoba (2006)), and in income per capita and aggregate TFP (Vollrath(2009)).
Given the assumption of constant returns to scale in the non-agricultural sector, we cananalyze the problem of a representative firm in the non-agricultural sector. The representativenon-agricultural firm hires labor from households, maximizing profits as:
MaxLN{Y N − wALN}
I denote the optimal labor choice for the representative non-agricultural firm as and LN .
A farmer with land quality Qj and land endowment Zh chooses how much labor to hire andhow much fertilizer to purchase from households in order to maximize profits. The farmer mustalso decide whether to use the traditional seed variety or the modern seed variety. In order

to make this decision, the farmer compares profits under the traditional technology with thoseobtained under the modern technology. The relative price of the agricultural good is denotedpA, while the relative price of fertilizer is denoted pf . The determination of these prices willbe discussed in the next section. Using a seed of type of i, a farmer of type (j, h) faces thefollowing optimization problem:
Max{Lj,h,fj,h}{pA(f j,h)φ(ZhQjai)ε(Lj,h)µ − wALj,h − pff j,h}
where, as noted above, use of the modern seed variety requires a minimum level of fertilizer.Let maximized profits for a farm of type (j, h) under the traditional technology be denoted πj,h
o .Given the productivity of the modern seed variety available in his/her region, a farmer of type(j, h) then compares maximized profits while using the modern seed, πj,h
m , with πj,ho . A farmer
will adopt the modern seed variety if it is profitable to do so, that is, if profits while using themodern seed variety are greater than or equal to those while using the traditional seed variety.Adoption will therefore depend on the quality and quantity of land the farmer is endowed with,the productivity of the modern seed variety relative to the traditional one, and the farmer’soptimal choices of labor and fertilizer. Let T j,h be an indicator variable that takes on the valueof 1 if a farmer adopts and zero otherwise.
Aggregate input demand of farms are given by:
LA =∑J
j
∑Hh Lj,h
f =∑J
j
∑Hh f j,h
while aggregate profits are:
π =∑J
j
∑Hh T j,hπj,h
m + (1− T j,h)πj,ho
Finally, let the proportion of land planted to the modern seed variety be denoted by PA
and be given by:
PA =∑J
j
∑Hh T j,h Zh
Z

3.2 Prices
The relative price of the agricultural good is denoted pA, and it is the price that ensures thatagricultural labor demand is equal to agricultural labor supply.8 Given that households supplylabor perfectly elastically to farms at the wage rate wA, and that aggregate labor demand isgiven by:
LA =(pA( µ
wA )1−φ( φpf )φ
∑Jj
∑Hh (ZhQj)ε
[T j,h(am)ε + (1− T j,h)(ao)
ε]) 1
1−φ−µ
the labor-market clearing relative price of the agricultural good is given by:
pA =(wA)2(1−φ)−µ(pf )φ
µ1−φφφ
J∑j
H∑
h
1
(ZhQj)ε
[1
T j,h(am)ε+
1
(1− T j,h)(ao)ε
](1)
I assume that households in the economy own equal portions of a fertilizer supply company.This company supplies fertilizer to farmers perfectly elastically at a cost per unit of cf . Howeverthe cost of transporting this fertilizer to farmers in rural areas adds to the cost of supplyingfertilizer so that there is a percentage transport cost markup of 1
F. That is, the transport cost
markup is an inverse function of road infrastructure provided by the government, F , meant toreflect the large barriers n Africa face in acquiring fertilizer due to high transportation costs. Ithas been documented that the differences between world prices and the landed cost of fertilizertend to be twice as high in many sub-Saharan countries as compared to Asian countries (Mwangi(1996)). Hence households supply fertilizer to farms perfectly elastically at a cost per unit ofcf
Ft. The market price of fertilizer, pf is then the price that equates fertilizer supply with the
total demand of farmers for fertilizer.
8Agricultural prices were controlled by the government in the majority of Sub-Saharan African countriesprior to the mid-1980’s. This was often achieved through government restrictions on the prices that privatetraders could charge to consumers and in turn on the price remitted to farmers. Price controls were oftenimplemented through parastatal organizations, which fixed both producer and consumer prices, provided storageof agricultural surpluses, and which facilitated the marketing and transport of agricultural produce. There isgreat diversity in the experience with price controls across Sub-Saharan Africa, with some governments holdingproducer prices below market-clearing levels and some setting prices above market-clearing levels. Further, giventhe costs involved in monitoring whether officially-set prices were being charged, and the delays that resultedin providing payment to farmers for their produce through official channels, parallel unofficial markets operatedalongside official markets whereby market-clearing prices would prevail(Harvey (1988), Jaeger (1992), Ghai andSmith (1987), de Wilde (1984)). Given the diversity of experience across Africa in the setting of agriculturalprices, and that in many countries, agricultural output prices have been liberalized, I chose not to incorporateprice controls in this model.
Recently a great deal of attention has been placed on the macroeconomic effects of ‘transportcosts’. A large literature has studied the relationship between infrastructure, a key determinantof transport costs, and economic growth (for example Aschauer (1989), Easterly and Rebelo(1993), Kilkenny (1998) and Sanchez-Robles (1998)). More emphasis was placed on the impor-tance of infrastructure for economic growth in the less developed economies with the releaseof the 1994 World Development Report (The World Bank (1994)). Two important papers inthe macroeconomics literature have also recently underscored the importance of changes intransport costs for economic development. Adamopoulos (2008) studies the importance of dif-ferences in transport labor productivity in explaining aggregate labor productivity differencesacross countries, while Herrendorf et al. (2009) analyze how the large reduction in transportcosts in the U.S. in the late 19th century affected regional specialization and convergence.
3.3 The Agricultural Research Technology
The productivity of the modern seed, am,t, is determined by the national agricultural researchsector. In particular the productivity of the modern seed at time t is given by:
am,t =t−10∑
t0
Rt−10Sγ1
t−10Xγ2
t−10 (2)
where 0 < γ1, γ2 < 1
This equation implies that the productivity of the modern seed variety in the current periodt depends on the stock of funding for national agricultural research in each country sincean initial time period, t0 (taken to be shortly after independence for the African countries Icalibrate to), until 10 years earlier, Xt−10, and on the number of agricultural researchers withinnational agricultural research centers 10 years earlier, Rt−10. It also depends on the numberof modern varieties that have been released by the international agricultural research centers(IARCs) for that region since the initial time period until ten years earlier, St−10.
9 Each variablethat contributes to the modern seed’s productivity in time t is referenced 10 years earlier, toreflect the lag between research activity and the time that it takes for appropriate modern seedvarieties for a given country to be developed (Evenson and Gollin (2003)). This productionfunction then implies that any modern seeds introduced from breeding activities of the IARCscomplement the breeding activities of the National Agricultural Research Systems (NARSs) ofa given country. The NARSs then serve as a platform for local adaptation, where the IARC
9There are currently four IARCs in Africa - the International Institute of Tropical Agriculture (IITA),the International Livestock Research Institute (ILRI), the West African Center for Research in Agroforestry(WARDA) and the International Center for Research in Agroforestry (ICRAF).

‘plant-type’ (such as a high-yielding semi-dwarf stream of rice) is bred for location-relevanttraits.10
3.4 Individual Behavior
The economy is populated by a large number, L, of individuals. All individuals in the economyare endowed with equal shares of land in the economy, therefore each individual receives anequal share of profits remitted from farms in the economy. All household income is taxed bythe government at the rate τ . Each individual is also endowed with one unit of raw laborwhich they supply inelastically to firms. Individuals may either work for a farm, earning theagricultural wage wA, or for a non-agricultural firm, earning the wage wN . As noted in section3.2, they also sell fertilizer to farms. Individuals working in the agricultural sector thereforeearn an income of:
(1− τ)[wA + pf f + π]
while individuals working in the non-agricultural sector earn an income of:
(1− τ)[wN + pf f + π]
Individuals allocate their income between consumption, c, which consists of non-agriculturalconsumption cN and a subsistence level of the agricultural good, a, and fertilizer production andtransport, xf .11 Preferences take the constant intertemporal elasticity of substitution (CIES)form per period, with σ denoting the inverse of the intertemporal elasticity of substitution.Individuals of both types choose cN and xf to maximize:
(pat a+cN )1−σ−1
1−σ
subject to:xf = cf
F
10The interaction between national agricultural research and international agricultural research was studiedrecently by Evenson and Gollin (2003). This study constructed genealogies for 11 major food crops in over 100countries, covering the period 1965 to 1998. Their results indicate a high degree of complementarity betweeninternational agricultural research and national agricultural research, that the value of IARC germplasm islargely realized through ‘second-stage’ NARS research.
11Allowing consumption of the agricultural good above the subsistence level would imply a larger agriculturalsector, which would in turn alter the relative price of the agricultural good and input choices of farmers.Allowing for income-elastic agricultural consumption would however significantly complicate the computationof the model.

and subject to the budget constraints:
{(1− τ)[wA + pf f + π] = pAa + cN + xf if the individual works in the agricultural sector
(1− τ)[wN + pf f + π] = pAa + cN + xf if the individual works in the non-agricultural sector.
After substituting the budget constraint and cost of producing fertilizer into the objectivefunction and maximizing, we get that pf = cf
F (1−τ).
3.5 The Government
The government provides public goods for agriculture in the form of road infrastructure, F ,national agricultural research expenditure, X, taken to be physical resources for research such aslabs, chemicals and equipment, and hires researchers, R to work in these labs. The government’sincome consists of revenue from an income tax at the rate τ . The equation for a balanced budgetby the government, which is assumed to hold each period, is given by:
F + X + wNR = τL[(1− l)(wA + pf f + π) + l(wN + pf f + π)] (3)
where l denotes the share of labor that works in the non-agricultural sector. τ must adjustas government expenditure and total income changes.
3.6 Equilibrium
A competitive equilibrium for this economy consists of prices wA, wN , pf , and pA, a tax rate τ ,government expenditures F, X, and R, the technology adoption decision, T j,h, aggregate inputchoices of farms, LA and f , aggregate labor demand by the representative non-agricultural firm,LN , and household allocations, cN and xf such that:
1. Given prices, firm allocations solve the firms’ profit maximization problems;
2. Given prices and profits, household allocations solve the household’s maximization prob-lem;
3. All markets clear:
Y A = aL;
Y N = L[cN + xf ] + F + X + wNR
L = LA + LN + R;
4. The government’s budget balances each period:
τ = (F+X+wNR)Y N+pAY A
4 Motivation of Counterfactual Experiments
In this section I present the solution to the farmer’s profit maximization problem, in orderto describe the model’s mechanisms and to motivate the counterfactual experiments that Iconduct. A farmer with land of size Zh and land quality Qj will choose fertilizer f j,h and laborLj,h given by:
f j,h = [(pA(ZhQjai)ε)( µ
wA )µ( φpf )1−µ]
11−φ−µ
Lj,h = [(pA(ZhQjai)ε)( µ
wA )1−φ( φpf )φ]
11−φ−µ
With these input choices, agricultural output is given by:
Y A =
((pA)φ+µ(
µ
wA)µ(
φ
pf)φ
J∑j
H∑
h
(ZhQj)ε[T j,h((am)ε) + (1− T j,h)((ao)
ε)]) 1
1−φ−µ
(4)
and labor productivity in agriculture is given by:
Y A
LA=
wA
pAµ(5)
The expression above highlights that labor productivity in agriculture is a positive functionof the agricultural wage, wA (which in turn is a function of TFP in the non-agricultural sector,A, and the ratio of the agricultural wage relative to the non-agricultural wage, 1− θ) and is anegative function of the relative price of the agricultural good, pA and the labor share of incomein the agricultural sector, µ.
Given the determinants of the relative price of the agricultural good as shown in equation(1) above, labor productivity is then positively related to TFP in the non-agricultural sector,A, the ratio of the agricultural wage relative to the non-agricultural wage, 1 − θ, the landendowment, Zh, land quality, Qj and seed productivity, ai. Labor productivity is negativelyrelated to the price of fertilizer, which is in turn negatively related to infrastructure provision,F . These factors then represent key determinants of labor productivity in the model. Thecounterfactual experiments discussed below will reveal which of these factors is quantitativelymost important in spurring labor productivity in Sub-Saharan African agriculture.
The share of labor working in the agricultural sector, (1− l), is determined by agriculturalgoods market clearing. That is, given that aggregate demand for agricultural good is given byaL, the agricultural labor share is given by:
1− l =
(aL1−µ
(f j,h)φ
J∑j
H∑
h
[1
T j,h(ZhQjam)ε+
1
(1− T j,h)(ZhQjao)ε
]) 1µ
(6)
We see that improvements in each of the factors that contribute positively to labor produc-tivity cause the agricultural labor share to decrease. A higher price of fertilizer, which causesfertilizer usage and therefore labor productivity to fall, causes the agricultural labor share torise. An increase in land quality, seed productivity or land endowments cause labor produc-tivity to rise and the agricultural labor share to fall. Hence the counterfactual scenarios belowwhich will comment on important determinants of labor productivity will in turn be able tocomment on important determinants of the economy’s structural transformation.
5 Calibration
To gain insight from the model outlined above, it is necessary to calibrate the parametersof the model. I calibrate the model to data for the year 2000 for four Sub-Saharan Africaneconomies - Burkina Faso, Kenya, Rwanda and Zambia. These four countries vary a great dealin terms of their agricultural development. For example, there was growth of agricultural laborproductivity in Burkina Faso between 1965-2000, but stagnation in the other three countries.Rwanda faces extreme land scarcity, while Zambia is relatively land abundant (FAOSTAT(2004)). By the year 2000, only Kenya had experienced significant adoption of high-yieldingseed varieties, while only 4% of Burkina Faso’s agricultural land was planted to high-yieldingseed varieties (Evenson and Gollin (2003)).12 All countries however rely largely on rain for
12Kenya is therefore an outlier in that it has thought to have experienced a ‘mini Maize Revolution’, spear-headed by large-scale commercial farmers and due to support for agricultural R&D through the Kenyan Agri-cultural Research Institute.

moisture for their crops, and have low road coverage relative to their total area. All countriesalso experienced growth of labor productivity over the period 2000-2010, and indeed all at anaverage annual rate of 2.5% or higher.
Many of the parameter values for this model can be taken directly from the data. Theseparameters are listed in Table 8 and Table 9 in the Appendix. However there are 4 parametervalues for whom there is no empirical counterpart: fM , a, cf and ao. The resulting calibratedparameter values are given in 3. The 4 parameter values were calibrated by targeting 4 relevantstatistics (listed in Table 4) for each country in the data for 2000 while solving the model. 13
Table 3: Calibrated Parameter Values
Calibrated parameter values
FM - Minimum fertilizer required for adoptionBurkina Faso Kenya Rwanda Zambia
0.03 0.02 0.0008 0.02a - Subsistence level of the agricultural good
Burkina Faso Kenya Rwanda Zambia0.000406 0.00018 0.0007 0.0008
cf - Cost of fertilizerBurkina Faso Kenya Rwanda Zambia
0.008 0.00018 3.0 0.04ao - Traditional seed productivity
Burkina Faso Kenya Rwanda Zambia3.0 ∗ 10−6 6.0 ∗ 10−7 0.21 3.0 ∗ 10−5
13There is not a one-to-one mapping between each target and a given parameter. Rather, each parameter inthe model affects each of the targets, however there are certain targets which are more closely influenced by agiven parameter relative to the others. The final calibration I chose represents the combination of parameterswhich minimizes a loss function which is a simple average of the squared deviations between the values of thetargets as produced by the model and the values of the targets in the data, normalized by the value of the targetin the data.

Table 4: Targets and Model Statistics
Model statistic/Target in Data
Share of land planted to modern seed variety (Evenson and Gollin (2003))Burkina Faso Kenya Rwanda Zambia
0.08/0.04 0.38/0.43 0.22/0.15 0.06/0.05Share of labor in agriculture (FAOSTAT (2004))
Burkina Faso Kenya Rwanda Zambia0.92/0.92 0.74/0.75 0.92/0.91 0.68/0.69
Fertilizer per hectare (MT) (FAOSTAT (2004))Burkina Faso Kenya Rwanda Zambia0.003/0.003 0.0076/0.0054 0.0002/0.0002 0.0015/0.0014Average Labor Productivity (hundreds of int. dollars) (FAOSTAT (2004))Burkina Faso Kenya Rwanda Zambia
1.26/1.27 1.80/1.82 1.64/1.65 1.20/1.22
In order to calibrate the minimum fertilizer requirement for adoption, fM , I targeted theproportion of land planted to the modern variety in the data. The proportion of total landdevoted to modern seed varieties is largely influenced by fM - by increasing fM , adoption ofthe modern seed variety will be more costly, all else held equal, causing the proportion ofland planted to the modern seed variety to decline. Therefore targeting the proportion of landplanted to the modern seed variety in 2000 provided a way of disciplining the choice of fM inthe calibration.
I calibrated a using the share of labor in agriculture (1 − l in the model) in the data as atarget. Across the 4 countries, this share ranged from 69% in Zambia to 92% in Burkina Faso inthe year 2000 (FAOSTAT (2004)). As shown in equation 6 above, the agricultural labor shareis directly influenced by a - the higher is a, the higher will be the share of labor in agriculture.
The farmer’s choice of fertilizer is influenced by cf , the unit cost of fertilizer. The higheris cf , the higher is pf , the relative price of fertilizer, and the higher will be fertilizer use perhectare. I adjusted this parameter to aid in achieving the level of fertilizer per hectare thatis found in the data for each country in 2000 (FAOSTAT (2004)). Across the 4 economiesI calibrate to, this ranges from 0.0002 metric tonnes per hectare in Rwanda to 0.005 metrictonnes per hectare in Kenya.
I calibrate the productivity of the traditional seed variety, denoted ao, by targeting the aver-age level of labor productivity in agriculture in 2000 in each country. Average labor productivity

in this model is given by equation 5 above. The higher is the productivity of the traditional seedvariety, the higher will be seed productivity for those farmers that do not adopt the modernseed variety, and the lower will be the relative price of the agricultural good, thus increasingaverage labor productivity. Therefore I target the level of labor productivity in 2000, whichranges from 122 international dollars per agricultural worker in Zambia to 181 internationaldollars per agricultural worker in Kenya in order to calibrate this parameter value. Data onthe value of agricultural production and agricultural labor were taken from FAOSTAT (2004).
The calibrated model matches relatively closely the level of diffusion of modern seed varietiesin each country as holds in the data in the year 2000. There are a number of factors influencingadoption in the calibrated model. Adoption will occur if a farm has sufficient income to purchasethe minimum fertilizer per hectare requirement for adoption. The higher is rural infrastructure,all else held equal, the lower is the cost of purchasing this needed fertilizer, which increases thelikelihood that more farms will adopt the modern seed variety.
Table 5: Modern seed adoption by land size/quality type for Rwanda
Land size/quality type Proportion adopting
Z1 62.2%Z2 48.3%Z3 29.4%Z4 1.1%Q1 1.6%Q2 38.1%Q3 40.7%Q4 84.0%
The relative price of the agricultural good is also a crucial determinant of modern seedadoption - if it falls (for example, due to a decrease in a), adoption is less likely because profitsare lower and may not cover the minimum fertilizer requirement. The land quality and land sizedistributions determine the proportion of farms that adopt, as shown in Table 5. As both theland size and land quality distributions are discrete, adoption occurs in a step-wise fashion, onceeach farm type finds it profitable to adopt the modern seed variety. The first farms to adopt asfM decreases are the farms with high land quality. This is because these farms have a highermarginal benefit for adopting the modern seed variety, given complementary between landquality and seed productivity. Adoption also differs by land size class. It is only the smallestfarms that adopt for some calibrations. This is because small farms have disproportionatelyhigher land quality, which entails a higher marginal product of seed productivity for a givenlevel of fM .

The calibration also closely replicates the level of agricultural labor productivity and theagricultural labor share for each country. As noted in Section 4, these 2 variables are inverselyrelated, hence the final calibration represents the combination of parameters which minimizesthe discrepancy between both statistics and the data.
The calibrated model produces a level of fertilizer per hectare that is close to that in thedata for each country. As noted above, each calibrated parameter influences each of the targets,however fertilizer per hectare is largely influenced by the setting of cf for each country, giventhe level of road infrastructure in each country. For example, this is very much the case forRwanda, which has the lowest level of fertilizer per hectare in the year 2000, but which has byfar the highest level of road coverage per hectare, hence cf must be quite high to match thefertilizer per hectare target.
6 Counterfactual Scenarios
In this section I conduct a number of counterfactual scenarios in order to decipher which featuresof the model are quantitatively important for understanding Africa’s agricultural stagnation.These experiments also provide insight into what types of policies might contribute to increasingagricultural labor productivity or household welfare in the countries that I calibrate to.
I compare the effect of each counterfactual scenario on the statistics produced by the modelto those of the benchmark calibration. For each, I calculate the proportion of average incomefollowing the change to the benchmark economy that would cause household utility to be thesame as that in the benchmark economy, the compensating variation of the policy. The extentof this transfer provides an indication of the welfare change that would result from a givenpolicy or counterfactual scenario.
The results of each experiment for the Rwandan calibration are given in Table 6. The resultsfor the other calibrations are provided in Tables 10 - 12 in Section D of the Appendix, howeverthe results are qualitatively similar for the other three calibrations.
6.1 Improved Land Quality in Sub-Saharan Africa
In the context of the benchmark economy, I investigate what improved land quality, Q, mighthave entailed for Sub-Saharan Africa. I increase the value of each land quality type by 25%relative to values in the benchmark economy, and assume that the costs of improving landquality are covered by the government through increased income taxes.14 The results areshown in column 2 of Table 6 and Tables 10-12.
14The New Economic Partnership for Africa’s Development (NEPAD) through the Comprehensive AfricaAgricultural Development Program (CAADP) estimates that land quality improvement measures such as water
This policy experiment indicates that higher land quality would bring many positive benefitsfor the four countries that this model is calibrated to. Higher land quality increases land rentswhich may be spent on fertilizer, and higher land quality increases the marginal benefit offertilizer as it is complementary with fertilizer in the agricultural production function. Howeverthe latter effects are counteracted by the decrease in the relative price of the agricultural goodwhich is caused by the increase in effective land that results directly from an increase in landquality. Fertilizer per hectare therefore increases slightly or not at all for the 4 calibrations.
Fertilizer per worker (which is given by pAφwA
µpf in the model) falls for each calibration due to
the fall in pA.
The increase in agricultural output caused by the increase in land quality entails that labormoves out of agriculture at a faster rate relative to the benchmark economy for each country.This is because the subsistence level of the agricultural good can be produced with less labor.Labor productivity increases indirectly due to the reduction in pA. Labor productivity increasesby roughly 3% in each calibration. The proportion of land that is planted with the modernseed variety does not change as fertilizer per hectare is hardly affected by the increase in landquality.
The proportion of income following the increase in land quality that would have to be takenaway from the representative household to make them as well off as in the benchmark economy,the compensating variation of the counterfactual scenario, ranges from 6% of aggregate incomein Zambia to a high of 27% of aggregate income in Burkina Faso. This indicates that utility ishigher under the scenario of higher land quality. Utility increases because higher agriculturaloutput (due to increased input use per farmer, as well as higher land quality) and highernon-agricultural output (because of the faster structural transformation) cause the tax rateto decline more quickly, leaving the household with more disposable income out of which toconsume.
6.2 A Transition from Land Endowments to a Land Market
Recently there has been much discussion of the role of customary land tenure and agriculturalproductivity in the Sub-Saharan African context (for example Besley (1995), Abegaz (2004),Tassel (2004), Jacoby and Minten (2007)). Interest in this topic has increased due to therealization that Sub-Saharan African economies are not as land abundant as had been thought.The main focus of this literature has been on how insecure land tenure dissuades producersfrom investing in their land, because of the uncertainty that the returns from such investment
harvesting, soil and water conservation schemes, and land improvement will require an average investment of$300 million (U.S.) per year through 2015. Operation and maintenance costs from such measures will requireincreasing funds over the years, to the tune of $100 million (U.S.) per year by 2015.

Table 6: Results of Counterfactual Scenario for Rwanda
Improved Land Increased Increased Increased IncreasedLand Transfer International Agricultural Non- Infra-
Quality -ability Agricultural Researchers agricultural structureResearch TFP
Variable Figures Represent Average Change Relative to the Benchmark Economy (%)
Share of -3.0 -54.0 -0.1 -0.3 -19.6 -2.4Labor inAgricultureFertilizer -2.9 -6.7 -0.4 -1.5 45.7 16.3per FarmerFertilizer per 0.2 513.8 -0.8 -2.8 79.0 7.7HectareLabor 3.0 7.2 0.4 1.5 7.2 7.5ProductivityCompensating -0.25 -0.85 -0.01 -0.03 -0.75 -0.21Variation% of Land 0.0 346.4 0.0 0.0 122.2 2.3Planted tothe ModernSeed VarietyRelative price -2.9 -6.7 -0.4 -1.5 16.6 -7.0of the agri-cultural goodIncome tax -15.3 -70.7 -1.3 -3.1 -74.2 -14.0rate
will accrue to them. This literature has also focused on the potential increase in access tocredit with tenure security, as land can serve as collateral for loans. The model of this papercannot capture these types of effects, as it is a static model without a credit market. Howeverthe model can investigate quantitatively the impact of a transition from a system of customaryland tenure or state-owned land to a system where farmers have land transfer rights - one wherefarmers may buy and sell land as they please.
In the benchmark economy, each farm is endowed with land of a fixed size and quality. Inthis experiment, each farm may now:
1. operate as in the benchmark economy, tilling their original land endowment (i.e. notengage in the land market)

2. Sell its land endowment.
3. Buy more land from farms that are willing to sell.
The payoff for option 1 above is simply π1 = max(πo, πm), as in the benchmark economy,depending on whether it is profitable for the farm to adopt the modern seed variety or not.The payoff for option 2 above is simply π2 = pZQjZh, where pZ denotes the price of effectiveland. The payoff for option 3 is:
π3 = pA(f j,h)φ([ZhQj + ZiQi]ai)ε(Lj,h)µ − wALj,h − pff j,h − pZZiQi
where again i ∈ [o,m] as farmers that purchase additional land must again make the choiceof whether to adopt the modern seed variety or not. Each farmer then compares π1, π2 and π3
and chooses the option that maximizes their profit. Those farms that choose to sell their landprovide effective land supply for the newly-functioning land market. Those that choose to buyland provide the demand for effective land. This may lead to a re-allocation of land which inturn may influence labor productivity.
The results are presented in column 3 of Table 6 and Tables 10 to 12. There are 2 maindrivers of the result of this experiment. On the one hand, farms that originally had a largelandholding and/or high land quality have higher land rents with which to purchase more land.On the other hand, farms that originally had a small landholding and/or low land quality facea higher marginal productivity of effective land. Below is a table showing each of the originalland quality/size types and their choice of options 1-3 above, and in the case of option 3, whattype of land they decided to purchase for Rwanda.
It is evident that the largest farms sell their land, and the smallest farms choose to buy land.This entails that the second effect mentioned above - the higher marginal productivity of landfor small landholders - outweighs the first effect mentioned above - the lower land rent of smalllandholders. The results are roughly similar for the other 3 countries that I calibrate to, withvarying cutoffs for land size/qualities for which farmers choose to buy or sell land. However ingeneral no farms choose the autarkic situation where they neither purchase nor sell land.
This re-allocation of land from large to small farms increases fertilizer use per hectaresignificantly on the small and lower land quality farms, which all increases adoption of themodern seed to 100% of land. This increases average seed productivity, as more farms are usingthe modern seed variety relative to the traditional seed variety compared to the benchmarkeconomy in each country. The relative price of the agricultural good therefore falls, whichincreases agricultural labor productivity.

Table 7: Land re-allocations after land transferability is allowed in the Rwandan calibration
Original land size/quality type (1-16) Choice 1, 2 or 3 Land size/quality choice (1-16)
1 (Z1/Q4) 3 152 (Z1/Q4) 3 163 (Z1/Q2) 3 154 (Z1/Q2) 3 165 (Z2/Q3) 3 156 (Z2/Q1) 3 167 (Z2/Q2) 3 158 (Z2/Q4) 3 169 (Z3/Q2) 2 –10 (Z3/Q3) 3 1611 (Z3/Q2) 2 –12 (Z3/Q3) 3 1613 (Z4/Q1) 2 –14 (Z4/Q1) 2 –15 (Z4/Q2) 2 –16 (Z4/Q3) 2 –
Increased seed productivity and increased fertilizer usage in turn causes the agriculturallabor share to decrease - indeed to plummet in the Burkina Faso, Kenyan and Zambian cali-brations - as increased farm productivity entails that far fewer workers are needed to producedemanded food.
Increased income, stemming from increased agricultural output and the faster structuraltransformation, leads to a reduction in the tax rate. This causes average utility to rise, andwelfare to increase in each country, with a high compensating variation of 100% of ex-postincome in Burkina Faso, Kenya and Zambia and a low of 85% of ex-post income in Rwanda.That is, a large amount of income following the experiment would have to be given to individualsbefore the experiment to make them as well off as after the experiment.
6.3 Increased International Agricultural Research
I now investigate the consequences for agricultural development in this model if each countryhad had a higher number of (in particular 25% more) international agricultural research contri-butions. After 1970, modern seed variety releases from the international agricultural researchcenters for Asia were about double the number of releases for Africa. This has often been citedas one of Africa’s major constraints in agricultural production relative to Asia. This counter-

factual experiment investigates this claim in the context of the benchmark economies. It mayalso shed light on the potential benefits of efforts such as “New Rice for Africa”.15 The resultsof this experiment are given in column 4 of Table 6 and Tables 10 - 12.
Perhaps surprisingly, the counterfactual scenario of Africa having had more internationalagricultural research directed toward African conditions has very little impact on labor pro-ductivity. The impact ranges from 0.2% in Zambia to 1.2% in Kenya. Increased releases ofmodern seed varieties by the international agricultural research (IAR) community (increasedS) causes higher productivity of the modern seed variety. However this model draws attentionto importance of the productivity of agricultural research - that higher IAR contributions mustbe complemented by domestic resources for research, X, and researchers, R.16
A 25% increase in international agricultural research causes the relative price of the agricul-tural good to decrease due to the increased seed productivity it brings about among adoptingfarmers. This in turn causes a small increase in labor productivity, and a decrease in fertilizeruse per worker relative to the benchmark calibrations. There is a welfare increase in each cali-bration due to the reduce agricultural price and the faster structural transformation. It howevercauses no change in the proportion of land that is planted to the modern seed variety. This isbecause a key constraint to adoption of the modern seed variety in this model is the purchase ofthe required amount of fertilizer for adoption, fM . Although seed productivity increases withan increase in international agricultural research, it is not sufficient to increase the net benefitof adopting the modern seed variety. Hence an increase in international agricultural researchhardly aids in closing the significant gaps in the statistics for Africa relative to Asia shown inTable 1.
In conclusion, although Asia benefited from the ‘starting material’ that the internationalagricultural research community provided, the results of this counterfactual exercise suggestthat their more dynamic path of agricultural development likely resulted from a confluence ofother factors affecting seed productivity and technology adoption, which Africa did not haveover the period 1965-2000. This suggests that new research, such as that exemplified by Nerica,should be accompanied by efforts to increase national research efforts and to increase fertilizeruse among farmers.17
15“New Rice for Africa”, or Nerica, is a rice variety that has been developed by researchers at the West AfricaRice Development Association (WARDA), by crossing the high-yielding semi-dwarf varieties of rice developedfor Asian conditions with African species of rice. Nerica therefore combines the ruggedness of local African ricespecies with the high productivity of Asian rice, to produce a rice species that can better tolerate weeds and isless dependent on fertilizers.
16Expenditure per researcher was actually higher in Sub-Saharan Africa relative to Asia through the 1960’sand 1970’s, however the number of agricultural researchers in Asia was much higher relative to Sub-SaharanAfrica (Pardey et al. (1998)). Therefore the resulting productivity of the modern seed would not be as high asthat of Asia despite a similar level of IAR contributions as imposed in this policy experiment.
17This is especially important given that international financing of agricultural R&D in Africa has strength-ened since 1971 with the formation of the CGIAR. As mentioned earlier, 39% of all CGIAR expenditure, or

6.4 Increased Agricultural Researchers
Another important publicly-provided good for agricultural development is the human capitalneeded to work in agricultural research and development. As shown in Table 1, Sub-SaharanAfrica has had fewer scientists employed in agricultural R&D, so this could be an importantfactor causing labor productivity to stagnate in Africa relative to the other developing regions.The next counterfactual scenario investigates the impact on calibrated models’ statistics of anincrease in the number of agricultural researchers by 25%, financed by the government’s taxrevenue.
The mechanisms leading to improved labor productivity from increased agricultural re-searchers are similar to those resulting from increased international agricultural research. Morescientists working in agricultural R&D increases the productivity of the modern seed varietyamong adopters, thus increasing fertilizer use among modern seed adopters, and causing the rel-ative price of the agricultural good to fall. This in turn increases agricultural labor productivitybut decreases fertilizer per worker.
More agricultural scientists causes more land to be planted to the modern seed variety inthe Burkina Faso calibration, because it increases the productivity of the modern seed varietysufficiently to outweigh the minimum fertilizer cost for some farms. Modern seed variety adop-tion does not increase in the other three calibrations because a 25% increase in agriculturalresearchers does not increase the net benefit of adoption relative to the benchmark economysufficiently. Finally, because seed productivity has increased, the structural transformation ismore rapid in each calibration.
We see from column 5 of Table 6 and Tables 10-12 that the effects of this experiment arelarger than those of the last experiment, despite the same mechanisms being at play. This isbecause the elasticity of the modern seed productivity with respect to agricultural researchersis 1, while that with respect to international agricultural research (S) (or national agriculturalresearch expenditure X) is 0.5.
6.5 Increased Non-Agricultural TFP
The important interactions or feedback effects between agriculture and non-agriculture dis-cussed in the seminal work of Johnston and Mellor (1961) have been emphasized in the liter-ature ever since. This experiment asks whether a higher level of non-agricultural TFP wouldhave brought a quantitative improvement for agricultural labor productivity in the 4 countries
$127 million, was spent directly on African agricultural research in 1991. This policy experiment suggests thatin order to be effective, such international support must be complemented by greater financing of the NARs.

I consider. In order to address this question I increase the level of non-agricultural TFP by25% relative to the benchmark calibrations. The results are given in column 6 of Table 6 andTables 10 - 12.
An increase in non-agricultural TFP increases both the agricultural and the non-agriculturalwage. This causes the relative price of the agricultural good to rise. The rise in the relative priceof the agricultural good allows more farms in the Burkina Faso and Rwandan calibrations toafford the minimum fertilizer requirement for modern seed adoption, so that adoption increases.
The increase in the agricultural wage causes fertilizer use per worker to increase in each ofthe calibrations. Labor productivity also increases in all calibrated economies due to the reduc-tion in the relative price of the agricultural good. The share of labor in agriculture decreases inall of the calibrated economies, with the largest fall occurring in Burkina Faso (a 26% reduc-tion). As an increase in non-agricultural TFP increases both agricultural and non-agriculturalwages, income of households increases, which increases utility relative to the benchmark cali-bration. This experiment has the largest compensating variation of all experiments after theland transferability experiment, ranging from a low of 21% in Zambia to a high of 81% inBurkina Faso.
In summary, an increase in TFP in sectors other than agriculture appears quantitativelyimportant for improving agricultural labor productivity. Interestingly, Gollin, Parente andRogerson Gollin et al. (2007) find that differences in agricultural TFP are important for un-derstanding disparities in aggregate income across countries, as agricultural productivity spursthe structural transformation and hence determines the start date of industrialization. Thesequantitative findings together bolster the evidence of the strong links between agriculture andother sectors stressed by the earlier development economics literature.18
6.6 Increased Infrastructure Provision
Studies of African agricultural development almost exclusively mention rural infrastructure asa constraint on agricultural productivity. As has been emphasized in the model of this paper, alack of rural infrastructure has consequences for technology adoption in agriculture in particular.Road density in Africa is much lower than what it was in much of Asia before the ‘greenrevolution’ there took place, creating barriers to fertilizer, seed, and output distribution (Hazell
18Note that the effects of this experiment would be similar to an experiment investigating a decrease inthe ratio of the non-agricultural wage to the agricultural wage, θ. This is because both an increase in non-agricultural TFP and a decrease in θ increase the agricultural wage. The effect on households’ income would bemuted because the non-agricultural wage would not be affected, but impacts on the agricultural sector wouldbe the same.

(2004)).19 In this policy experiment I investigate the impact on the benchmark economies of a25% increase in infrastructure provision, financed through the government’s tax revenue. Theresults are shown in column 7 of Table 6 and Tables 10-12.
A higher amount of infrastructure provision decreases pf , the price of fertilizer, because theprice of fertilizer is inversely related to the level of infrastructure. A lower price of fertilizerincreases fertilizer per worker by an average of 15.4% across the 4 countries I calibrate to. Thereduction in the price of fertilizer causes the relative price of the agricultural good to fall.
The increase in infrastructure provision causes the proportion of land planted to the modernseed variety to increase in only the Rwandan calibration, but not in the other three calibra-tions. This indicates that a 25% increase in road provision is not sufficient to reduce thecost of the requisite minimum level of fertilizer for adoption in these economies. The levelof labor productivity increases for each calibration however due to the decreases in pA whichoccur. Due to increased fertilizer use, labor can move out of the agricultural sector to thenon-agricultural sector while still maintaining the subsistence level of consumption. Finally,income, non-agricultural consumption and utility all increase due to the increase in profits thatfarms experience, and the reduction in pA which decreases the cost of the agricultural good forhouseholds.
The calibrated model therefore suggests that an increase in infrastructure provision by thegovernment would indeed stimulate technology adoption and be beneficial for agricultural laborproductivity and welfare.
7 Conclusion
Sub-Saharan Africa is the only developing region not to have experienced significant declinesin undernourishment over the past 40 years.20 The persistence of undernourishment in Sub-Saharan Africa is inextricably linked to the region’s stagnating agricultural sector. If hunger isto be significantly reduced in Africa, the factors contributing to low agricultural productivitymust be further understood. This paper therefore asks: what policies would be effective inimproving agricultural labor productivity in Sub-Saharan Africa? In order to address thisquestion, I develop a model that highlights the important interconnections between factorendowments, public good provision and technology adoption in agriculture.
19The Comprehensive Africa Agriculture Development Programme (CAADP) of the New Economic Part-nership for African Development (NEPAD), has cited poor infrastructure as one of the chief constraints oneconomic growth in Africa.
20The proportion of the population that is malnourished was halved in Asia and Latin America between1960 and 2000, while this proportion fell by only 2% in Sub-Saharan Africa over the same period Food andOrganization (2003).
The counterfactual experiments conducted using this model indicate which mechanismsare most important for understanding stagnation of agricultural labor productivity in Africa,and highlight that solutions for improving agricultural productivity in Africa are not straight-forward. Of all the experiments conducted, an increase in non-agricultural TFP and roadinfrastructure, or the allowance of land transferability, would lead to the largest increases inagricultural labor productivity. The allowance of land transferability was found to bring a verylarge increase in aggregate income and therefore in household welfare. All experiments wouldspur the region’s structural transformation and improve welfare. The publicly-provided goodrevealed to be most important in terms of understanding Africa’s agricultural stagnation isrural infrastructure - a 25% increase in rural infrastructure is estimated to bring an 8% increasein labor productivity. An increase in non-agricultural TFP would bring an average increase inlabor productivity of 7% for the 4 countries considered, while an increase in land quality wouldbring on average a 3% increase in labor productivity. The paper therefore points to the criticalneed for African governments and donor organizations to prioritize investment in rural infras-tructure and soil conservation, land titling and efforts to increase TFP in the manufacturingand service sectors.

Appendices
A Definitions and Data Sources for Table 1
Physical capital for agriculture is the sum of harvesters-threshers, milking machines and trac-tors, and was taken from FAOSTAT (2004), the statistical database of the Food and AgricultureOrganization (FAO). To obtain capital per worker I divided the capital variable by agriculturallabor, which was also taken from FAOSTAT, and which the FAO defines as “all persons de-pending for their livelihood on agriculture, hunting, fishing or forestry ... [including] all personsactively engaged in agriculture and their non-working dependants” FAOSTAT (2004). I usedthis definition of the agricultural population to avoid the problem of under-counting thosehousehold workers who contribute to agricultural output yet who would not be considered a‘worker’ because their work is done within the household. Fertilizer is the quantity of fertil-izer in metric tons of nitrogenous, phosphate and potash fertilizers in agriculture. This wasalso taken from FAOSTAT. High-yielding seed diffusion is the proportion of agricultural landplanted to high-yielding seed varieties across countries. It was taken from a dataset compiledby Robert Evenson at Yale University (this dataset is discussed in Evenson and Gollin (2001)and Evenson and Gollin (2003)). Evenson’s dataset provides this information for 5-year inter-vals between 1965 and 2005, and the data covers land planted to 11 major crop seed varieties(wheat, rice, maize, sorghum, millet, barley, groundnuts, beans, lentils, cassava and potatoes).
B Common Exogenous Parameter Values
There are a number of parameter values that can be chosen directly (without solving the model).These are listed in Table 8 below.
I set the inverse of the constant intertemporal elasticity of substitution, σ, to 2, given thatmicroeconomic evidence suggests it lies between 0.5 and 3. This is discussed in Keane andWolpin (2001) and Hubbard et al. (1994). The stock of modern variety seed releases by theIARCs, S, was taken from Evenson and Gollin (2003). This is the sum of modern seed varietyreleases by the IARCs from 1965-1998. The shares of NARS and IARC research in a country’sagricultural research system provide guidance on the values of γ1 and γ2 respectively in themodern seed variety production function (see equation (2)). Evenson and Gollin (Evenson andGollin (2001)) note that more than 35% of modern varieties in use in the developing countriesoriginated from a direct IARC contribution, and a further 22% had an IARC-crossed parent orancestor. This suggests a value for γ1 of 0.5, and consequently of γ2 as well.
I restrict land quality values (Q1 − Q4) to lie uniformly between zero and one, so thateach land quality value provides a measure of ‘effective’ land in use. The distribution of land

quality, δ(Q1) − δ(Q4), is the average distribution of land qualities across Africa, taken fromthe Food and Agricultural Organization’s Terrastat database (FAO (2010)). In this datasettype 1 denotes ‘not suitable for agriculture’, type 2, ‘marginally suitable’, type 3, ‘moderatelysuitable’ and type 4, ‘suitable and very suitable’. High land quality is assumed to be founddisproportionately on small farms in the model. This is due to the relationship that has beenfound between land quality and farm size in the inverse farm size productivity (IFSP) puzzleliterature. The IFSP puzzle refers to the finding that smaller farms tend to have higher yields.However incorporation of data on land quality has often removed the IFSP pattern (Bhalla(1988), Bhalla and Roy (1988), Benjamin (1995) and Assuncao and Braido (2004)). Henceconsistent with this literature, I assume that 84% of the highest (Q4) land quality farms arethe very smallest land size types (Z1), and that 98% of the second-highest (Q3) land qualityfarms are the second smallest land size type (Z2). I set the value of total factor productivity(TFP) in the non-agricultural sector, A, to 1 for each country.
Table 8: Common Exogenous Model Parameters
Parameter Role in Model Parameter value
σ Coefficient of relative risk aversion 2S Number of Modern Variety Seed Releases by the IARCs 164γ1 Share of International Agricultural Research 0.5
in Seed Productivityγ2 Share of National Agricultural Research 0.5
in Seed ProductivityQ1 −Q4 Values for Land Quality 0.2/0.4/0.6/0.8
δ(Q1)− δ(Q4) Distribution of Land Quality (FAO (2010)) 0.25/0.36/0.18/0.21A TFP for non-agriculture (Heston et al. (2012)) 1
C Country-specific Exogenous Parameter Values
The parameter values that can be chosen directly (without solving the model) and for whichthere is data at the country-level are listed in Table 9 below.
The shares of income accruing to agricultural fertilizer, land and agricultural labor, theparameters φ, ε, and µ respectively, are set equal to the agricultural cost shares for these factorsof production for each country I calibrate to, as given in the Global Trade Analysis Project(Dimaranan (2006)) database. The amount of agricultural land is taken from FAOSTAT andis the sum of arable land, land for permanent crops, and land for permanent pastures. Land
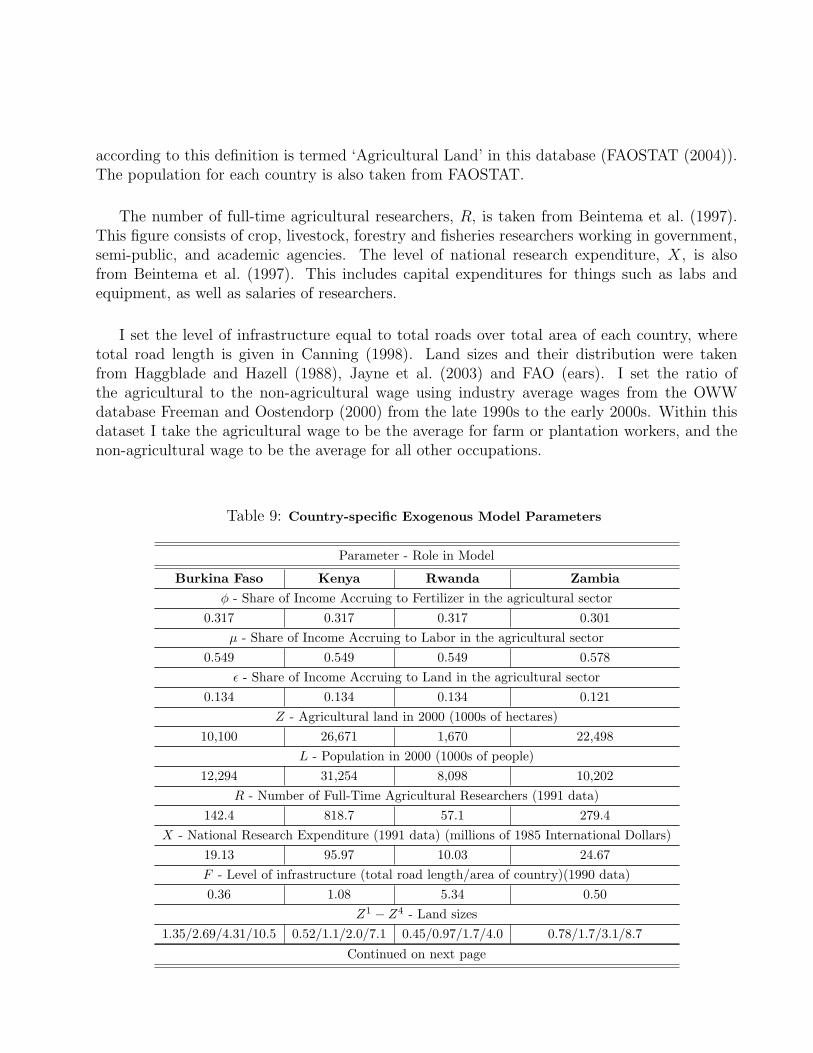
according to this definition is termed ‘Agricultural Land’ in this database (FAOSTAT (2004)).The population for each country is also taken from FAOSTAT.
The number of full-time agricultural researchers, R, is taken from Beintema et al. (1997).This figure consists of crop, livestock, forestry and fisheries researchers working in government,semi-public, and academic agencies. The level of national research expenditure, X, is alsofrom Beintema et al. (1997). This includes capital expenditures for things such as labs andequipment, as well as salaries of researchers.
I set the level of infrastructure equal to total roads over total area of each country, wheretotal road length is given in Canning (1998). Land sizes and their distribution were takenfrom Haggblade and Hazell (1988), Jayne et al. (2003) and FAO (ears). I set the ratio ofthe agricultural to the non-agricultural wage using industry average wages from the OWWdatabase Freeman and Oostendorp (2000) from the late 1990s to the early 2000s. Within thisdataset I take the agricultural wage to be the average for farm or plantation workers, and thenon-agricultural wage to be the average for all other occupations.
Table 9: Country-specific Exogenous Model Parameters
Parameter - Role in Model
Burkina Faso Kenya Rwanda Zambiaφ - Share of Income Accruing to Fertilizer in the agricultural sector
0.317 0.317 0.317 0.301µ - Share of Income Accruing to Labor in the agricultural sector
0.549 0.549 0.549 0.578ε - Share of Income Accruing to Land in the agricultural sector
0.134 0.134 0.134 0.121Z - Agricultural land in 2000 (1000s of hectares)
10,100 26,671 1,670 22,498L - Population in 2000 (1000s of people)
12,294 31,254 8,098 10,202R - Number of Full-Time Agricultural Researchers (1991 data)
142.4 818.7 57.1 279.4X - National Research Expenditure (1991 data) (millions of 1985 International Dollars)
19.13 95.97 10.03 24.67F - Level of infrastructure (total road length/area of country)(1990 data)0.36 1.08 5.34 0.50
Z1 − Z4 - Land sizes1.35/2.69/4.31/10.5 0.52/1.1/2.0/7.1 0.45/0.97/1.7/4.0 0.78/1.7/3.1/8.7
Continued on next page

Table 9 – Continued from previous page
Parameter - Role in Model
1− θ - Ratio of ag./non-ag. wage0.5 0.24 0.43 0.48
D Results of Counterfactual Scenarios for Countries other
than Rwanda
Below I present the results of the policy experiments or counterfactual scenarios for BurkinaFaso, Kenya and Zambia.
Table 10: Results of Counterfactual Scenario for BurkinaFaso
Results of Counterfactual Scenario for Burkina Faso
Improved Land Increased Increased Increased IncreasedLand Transfer International Agricultural Non- Infra-
Quality -ability Agricultural Researchers agricultural structureResearch TFP
Variable Figures Represent Average Change Relative to the Benchmark Economy (%)
Share of -3.0 -98.9 -0.2 -26.6 -25.6 -0.6Labor inAgricultureFertilizer -2.9 -0.2 -0.6 -1.2 44.4 14.0per FarmerFertilizer per 0.0 1.1x10¹⁶ 0.0 106.3 112.5 3.1HectareLabor 3.0 0.2 0.6 1.2 8.2 9.5ProductivityCompensating -0.27 -1.00 -0.019 -0.77 -0.81 -0.07Variation% of Land 0.0 1154.7 0.0 153.3 153.3 0.0Planted to
Continued on next page
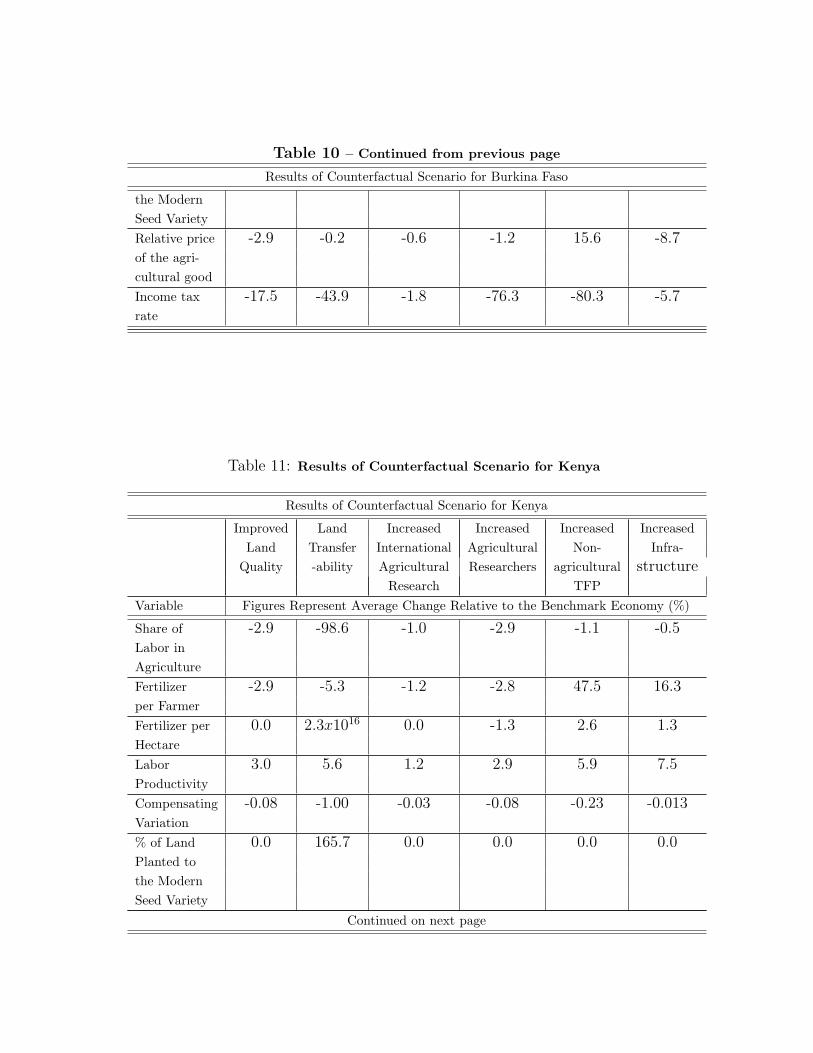
Table 10 – Continued from previous page
Results of Counterfactual Scenario for Burkina Faso
the ModernSeed VarietyRelative price -2.9 -0.2 -0.6 -1.2 15.6 -8.7of the agri-cultural goodIncome tax -17.5 -43.9 -1.8 -76.3 -80.3 -5.7rate
Table 11: Results of Counterfactual Scenario for Kenya
Results of Counterfactual Scenario for Kenya
Improved Land Increased Increased Increased IncreasedLand Transfer International Agricultural Non- Infra-
Quality -ability Agricultural Researchers agricultural structureResearch TFP
Variable Figures Represent Average Change Relative to the Benchmark Economy (%)
Share of -2.9 -98.6 -1.0 -2.9 -1.1 -0.5Labor inAgricultureFertilizer -2.9 -5.3 -1.2 -2.8 47.5 16.3per FarmerFertilizer per 0.0 2.3x10¹⁶ 0.0 -1.3 2.6 1.3HectareLabor 3.0 5.6 1.2 2.9 5.9 7.5ProductivityCompensating -0.08 -1.00 -0.03 -0.08 -0.23 -0.013Variation% of Land 0.0 165.7 0.0 0.0 0.0 0.0Planted tothe ModernSeed Variety
Continued on next page

Table 11 – Continued from previous page
Results of Counterfactual Scenario for Kenya
Relative price -2.9 -5.3 -1.1 -2.8 18.0 -7.0of the agri-cultural goodIncome tax -5.9 -563.0 -2.5 -6.7 -21.8 -0.8rate
Table 12: Results of Counterfactual Scenario for Zambia
Results of Counterfactual Scenario for Zambia
Improved Land Increased Increased Increased IncreasedLand Transfer International Agricultural Non- Infra-
Quality -ability Agricultural Researchers agricultural structureResearch TFP
Variable Figures Represent Average Change Relative to the Benchmark Economy (%)
Share of -2.7 -98.5 -0.5 -1.6 -0.6 -0.4Labor inAgricultureFertilizer -2.4 -15.4 -0.2 -0.7 44.6 15.1per FarmerFertilizer per 0.0 2.9x10¹⁸ 0.0 0.0 0.0 0.0HectareLabor 2.5 18.1 0.2 0.7 8.1 8.6ProductivityCompensating -0.056 -1.00 -0.01 -0.033 -0.21 -0.01Variation% of Land 0.0 1482.3 0.0 0.0 0.0 0.0Planted tothe ModernSeed VarietyRelative price -2.4 -15.4 -1.2 -2.4 -21.4 0.0of the agri-cultural goodIncome tax 2.4 -642.9 -1.2 -2.4 -21.4 0.0rate

References
Abegaz, B. (2004, September). Escaping ethiopia’s poverty trap: The case for a second agrarianreform. The Journal of Modern African Studies 42 (3), 313–342.
Adamopoulos, T. (2008). Transportation costs, agricultural productivity and cross-countryincome differences. Manuscript, York University.
Aschauer, D. (1989). Is public expenditure productive? Journal of Monetary Economics 23,167–200.
Assuncao, J. J. and L. H. Braido (2004). Testing among competing explanations for the in-verse productivity puzzle. Working Paper, Department of Economics, Pontifical CatholicUniversity of Rio de Janeiro.
Barrios, S., L. Bertinelli, and E. Strobl (2008). Rainfall and africa’s growth tragedy. Manuscript.
Beintema, N. M., P. G. Pardey, and J. Roseboom (1997). Investments in African agriculturalresearch. World Development 25 (3), 409–423.
Bellon, M. R. and J. E. Taylor (1993, July). Folk soil taxonomy and the partial adoption ofnew seed varieties. Economic Development and Cultural Change 41 (4), 763–786.
Benjamin, D. (1995). Can unobserved land quality explain the inverse productivity relationship?Journal of Development Economics 46, 51 84.
Besley, T. (1995, October). Property rights and investment incentives: Theory and evidencefrom ghana. Journal of Political Economy 103 (5), 903–937.
Bhalla, S. (1988). Does land quality matter? Journal of Development Economics 29, 45–62.
Bhalla, S. and P. Roy (1988). Mis-specification in farm productivity analysis: The role of landquality. Oxford Economic Papers 40, 55–73.
Binswanger, H. and P. Pingali (1988). Technological priorities for farming in Sub-SaharanAfrica. Technical report, World Bank Research Observer.
Bloom, D. E. and J. D. Sachs (1998). Brookings Papers on Economic Activity, Chapter Ge-ography, Demography, and Economic Growth in Africa, pp. 207–273. Brookings InstitutionPress.
Byiringiro, F. and T. Reardon (1996). Farm productivity in rwanda: effects of farm size, erosionand soil conservation investments. Agricultural Economics 15, 127–136.

Canning, D. (1998, June). A database of world infrastructure stocks. Policy Research WorkingPaper 1929, The World Bank.
Caucutt, E. M. and K. B. Kumar (2008). Africa: Is aid an answer? B.E. Journal of Macroe-conomics: Advances in Macroeconomics 8 (1).
Chanda, A. and C.-J. Dalgaard (2008, November). Dual economies and international total factorproductivity differences: Channelling the impact from institutions, trade, and geography.Economica 75 (200), 629–661.
Collier, P. (2006, July). Africa: Geography and growth. Centre for the Study of AfricanEconomies, Department of Economics, Oxford University.
Conway, G. (1997). The Doubly Green Revolution. Penguin Books.
Dalton, T. J. and R. G. Guei (2003, February). Productivity gains from rice genetic enhance-ments in west Africa: Countries and ecologies. World Development 31 (2), 359–74.
de Wilde, J. C. (1984). Agriculture, Marketing and Pricing in Sub-Saharan Africa. Regents ofthe University of California.
Dimaranan, B. V. (2006). Global trade, assistance, and production: The GTAP 6 data base.Center for Global Trade Analysis, Purdue University.
Easterly, W. and S. Rebelo (1993, December). Fiscal policy and economic growth: An empiricalinvestigation. Journal of Monetary Economics 32 (3), 417–458.
Eswaran, H., R. Almaraz, E. van den Berg, and P. Reich (1997). An assessment of the soilresources of Africa in relation to productivity. Geoderma 77, 1–18.
Evenson, R. and D. Gollin (2001, April). The green revolution at the end of the twentiethcentury. Technical Advisory Committee Secretariat, Food and Agriculture Organization ofthe United Nations.
Evenson, R. and D. Gollin (May 2, 2003). Assessing the impact of the green revolution, 1960to 2000. Science 300 (758-762).
FAO (2010). Terrastat database. Technical report, Food and Agriculture OrganizationInterna-tional Instiute for Applied Systems Analysis (IIASA).
FAO (Various years). World census of agriculture. Technical report, Food and AgricultureOrganization, Statistics Division.
FAOSTAT (2004). Agricultural statistical database of the food and agriculture organization.Technical report.
Firmin-Sellers, K. and P. Sellers (1999). Expected failures and unexpected successes of landtitling in Africa. World Development 27 (7), 1115–1128.

Food and A. Organization (2003). The state of food insecurity in the world 2003: Monitoringprogress towards the world food summit and millennium development goals. Technical report,Food and Agriculture Organization (FAO), Rome, Italy.
Freeman, R. B. and R. H. Oostendorp (2000). Wages around the world: Pay across occupationsand countries. NBER Working Papers 8058, National Bureau of Economic Research, Inc.
Frisvold, G. and K. Ingram (1995). Sources of agricultural productivity growth and stagnationin Sub-Saharan Africa. Agricultural Economics 13, 51–61.
Fulginiti, L. E., R. Perrin, and B. Yu (2004, December). Institutions and agricultural produc-tivity in Sub-Saharan Africa. Agricultural Economics 31 (2-3), 169–80.
Ghai, D. and L. D. Smith (1987). Agricultural prices, policy, and equity in Sub-Saharan Africa.L. Rienner.
Gollin, D., S. Parente, and R. Rogerson (2002, May). The role of agriculture in development.American Economic Review Papers and Proceedings 92 (2), 160–164.
Gollin, D., S. L. Parente, and R. Rogerson (2007). The food problem and the evolution ofinternational income levels.
Haggblade, S. and P. B. Hazell (1988, april). Prospects for equitable growth in rural Sub-Saharan Africa. Agriculture and Rural Development Department Working Paper, WorldBank. WPS 8.
Harvey, C. (1988). Agricultural pricing policy in Africa : four country case studies. Basingstoke:Macmillan.
Hazell, D. P. (2004, May). International development committee - minutes of evidence. UnitedKingdom Parliament.
Herrendorf, B., J. A. S. Jr., and A. Teixeira (2009). Transportation and development: Insightsfrom the u.s., 1840 - 1860. Manuscript, Arizona State University.
Heston, A., R. Summers, and B. Aten (2012, July). Penn world table version 7.1. Techni-cal report, Center for International Comparisons of Production, Income and Prices at theUniversity of Pennsylvania.
Hiebert, L. D. (1974, November). Risk, learning and the adoption of fertilizer responsive seedvarieties. Economic Journal .
Hubbard, G. R., J. Skinner, and S. P. Zeldes (1994). The importance of precautionary motives inexplaining individual and aggregate saving. Carnegie-Rochester Conference Series in PublicPolicy. 40, pages 59-125.

Institute of Development Studies (2005). New directions for African agriculture. IDS Bul-letin 36 (2).
Jacoby, H. G. and B. Minten (2007). Is land titling in sub-saharan africa cost-effective? evidencefrom madagascar. The World Bank Economic Review 21 (3), 461–485.
Jaeger, W. K. (1992). The Economic Effects of Economic Policies on African Agriculture.World Bank Discussion Papers: African Technical Department Series. The World Bank.
Jayne, T., T. Yamano, M. T. Weber, D. Tschirley, R. Benfica, A. Chapoto, and B. Zulu(2003). Smallholder income and land distribution in Africa: implications for poverty reductionstrategies. Food Policy 28, 253–275.
Johnson, D. and R. E. Evenson (2000). How far away is Africa? technological spillovers toagriculture and productivity. American Journal of Agricultural Economics 82 (3), 743–49.
Johnson, M. E. and W. A. Masters (2004, January). Complementarity and sequencing ofinnovations: New varieties and mechanized processing for cassava in west Africa. Economicsof Innovation and New Technology 13 (1), 19–31.
Johnston, B. and J. Mellor (1961). The role of agriculture in economic development. AmericanEconomic Review 51 (4), 566–93.
Kayizzi-Mugerwa, S. (1998, June). A review of macroeconomic impediments to technologyadoption in African agriculture. African Development Review 10 (1), 211–225.
Keane, M. and K. Wolpin (2001). The effect of parental transfers and borrowing constraintson educational attaintment. International Economic Review 42 (4), 1051–1103.
Kilkenny, M. (1998). Transport costs and rural development. Journal of Regional Science 38 (2),293–312.
Mwangi, W. (1996). Low use of fertilizers and low productivity in Sub-Saharan Africa. CIM-MYT, Natural Resources Group Paper 96-05.
Ndjeunga, J. and M. S. Bantilan (2005). Uptake of improved technologies in the semi-aridtropics of west Africa: Why is agricultural transformation lagging behind? Journal ofAcricultural and Development Economics 2 (1), 85–102.
Norton, R. D. (2004). Agricultural development policy : concepts and experiences. Hoboken,NJ: Wiley.
Pardey, P. G., J. Roseboom, and S. Fan (1998). Financing Agricultural Research: A Sourcebook,Chapter Trends in Financing Asian and Australian Agricultural Research, pp. 342–356.
Rattso, J. and H. E. Stokke (2007, December). A growth model for south africa. South AfricanJournal of Economics 75 (4), 616–30.

Rattso, J. and R. Torvik (2003, February). Interactions between agriculture and industry:Theoretical analysis of the consequences of discriminating agriculture in sub-saharan Africa.Review of Development Economics 7 (1), 138–151.
Restuccia, D., D. T. Yang, and X. Zhu (2008, March). Agriculture and aggregate productivity:A quantitative cross-country analysis. Journal of Monetary Economics 55 (2), 234–250.
Ripoll, M. and J. C. Cordoba (2006, February). Agriculture, aggregation, wage gaps, andcross-country income differences. University of Pittsburgh.
Sanchez-Robles, B. (1998, January). Infrastructure investment and growth : Some empiricalevidence. Contemporary Economic Policy , 98–108.
Smale, M. and T. Jayne (January 2003). Maize in eastern and southern Africa: Seeds of successin retrospect. International Food Policy Research Institute, Environment and ProductionTechnology Division Discussion Paper #97.
Tassel, E. V. (2004, January). Credit access and transferable land rights. Oxford EconomicPapers 56 (1), 151–166.
The World Bank (1994). World Development Report 1994: Infrastructure for Development.World Bank.
The World Bank (2005). World development indicators. Technical report.
Thissen, M. and R. Lensink (2001, May). Macroeconomic effects of a currency devaluation inegypt: An analysis with a computable general equilibrium model with financial markets andforward-looking expectations. Journal of Policy Modeling 23 (4), 411–19.
Tiffen, M. (2003). Transition in sub-saharan Africa: Agriculture, urbanization and incomegrowth. World Development 31 (8), 1343–1366.
van Blarcom, B., O. Knudsen, and J. Nash (1993.). The reform of public expenditures foragriculture. Technical report, World Bank Discussion Paper 216.
Vollrath, D. (2009, March). How important are dual economy effects for aggregate productivity?Journal of Development Economics 88 (2), 325–334.
Winter-Nelson, A. and A. Temu (2005, November). Impacts of prices and transactions costs oninput usage in a liberalizing economy: Evidence from Tanzanian coffee growers. AgriculturalEconomics 33 (3), 243–53.
Wobst, P. (2001). Structural adjustment and intersectoral shifts in tanzania: A computablegeneral equilibrium analysis. International Food Policy Research Institute, Research Report117.
Wood, A. (2002, April). Could africa be like america? Manuscript.