Embed Size (px)
Citation preview

AFRL-AFOSR-UK-TR-2015-0002
Fatigue micromechanism characterization in carbon fibre reinforced polymers using synchrotron radiation computed
tomography
Serafina Consuelo Garcea Prof S. Mark Spearing Prof. Ian Sinclair
University of Southampton University Road
Southampton, SO17 1BJ United Kingdom
EOARD GRANT FA8655-11-1-3040
Report Date: December 2014
Final Report from 1 October 2011 to 30 September 2014
Air Force Research Laboratory Air Force Office of Scientific Research
European Office of Aerospace Research and Development Unit 4515, APO AE 09421-4515
Distribution Statement A: Approved for public release distribution is unlimited.

REPORT DOCUMENTATION PAGE Form Approved OMB No. 0704-0188
Public reporting burden for this collection of information is estimated to average 1 hour per response, including the time for reviewing instructions, searching existing data sources, gathering and maintaining the data needed, and completing and reviewing the collection of information. Send comments regarding this burden estimate or any other aspect of this collection of information, including suggestions for reducing the burden, to Department of Defense, Washington Headquarters Services, Directorate for Information Operations and Reports (0704-0188), 1215 Jefferson Davis Highway, Suite 1204, Arlington, VA 22202-4302. Respondents should be aware that notwithstanding any other provision of law, no person shall be subject to any penalty for failing to comply with a collection of information if it does not display a currently valid OMB control number. PLEASE DO NOT RETURN YOUR FORM TO THE ABOVE ADDRESS. 1. REPORT DATE (DD-MM-YYYY)
18 December 2014 2. REPORT TYPE
Final Report 3. DATES COVERED (From – To)
1 October 2011 – 30 September 2014 4. TITLE AND SUBTITLE
Fatigue micromechanism characterization in carbon fibre reinforced polymers using synchrotron radiation computed tomography
5a. CONTRACT NUMBER
5b. GRANT NUMBER
FA8655-11-1-3040 5c. PROGRAM ELEMENT NUMBER
61102F 6. AUTHOR(S)
Serafina Consuelo Garcea Prof S. Mark Spearing Prof. Ian Sinclair
5d. PROJECT NUMBER
5d. TASK NUMBER
5e. WORK UNIT NUMBER
7. PERFORMING ORGANIZATION NAME(S) AND ADDRESS(ES)University of Southampton University Road Southampton, SO17 1BJ United Kingdom
8. PERFORMING ORGANIZATIONREPORT NUMBER
N/A
9. SPONSORING/MONITORING AGENCY NAME(S) AND ADDRESS(ES)
EOARD Unit 4515 APO AE 09421-4515
10. SPONSOR/MONITOR’S ACRONYM(S)
AFRL/AFOSR/IOE (EOARD)
11. SPONSOR/MONITOR’S REPORT NUMBER(S)
AFRL-AFOSR-UK-TR-2015-0002
12. DISTRIBUTION/AVAILABILITY STATEMENT
Distribution A: Approved for public release; distribution is unlimited. 13. SUPPLEMENTARY NOTES
14. ABSTRACT
Carbon fiber reinforced polymers (CFRPs) are well established as an important weight-reducing structural technology, particularly within the aerospace sector due to their high specific stiffness and strength. CFRPs are widely identified as being very fatigue resistant, but typically this advantage is not fully exploited in design. Understanding and predicting the durability of these materials is of great interest. The current work aimed to delineate the micro-mechanisms of fatigue damage in carbon fiber-epoxy laminated composites using in situ and ex situ synchrotron radiation computed tomography (SRCT). Several novel observations have been obtained for the micro-mechanisms of fatigue crack growth. Broadly similar micro-mechanisms of damage initiation have been identified in fatigue and quasi-static loading in a particle-toughened carbon fiber-epoxy composite system. Results showed that damage propagation is closely related to the local microstructure. Toughened systems exhibit different damage behavior in resin-rich regions and fiber-packed zones, which appears to exaggerate non-uniform crack growth. Zones of retarded crack growth correspond to resin rich regions, which contain bridging ligaments. There is evidence that the load cycling contributes to progressive failure of bridging ligaments in the crack wake, especially in the toughened particle system. The un-toughened system showed more uniform damage propagation across the crack front, due to the more uniform microstructure and showed a higher number of fiber breaks within the 0º plies with respect to the toughened systems, particularly within regions close to the 0º ply splits. It seems likely that a key mechanism of fatigue in the toughened-particle system on intralaminar loading is the degradation of bridging ligaments introduced by particles in the fatigue crack wake rather than due to processes at, or ahead of the crack tip.15. SUBJECT TERMS
EOARD, Composites, carbon fiber reinforced polymers, fatigue 16. SECURITY CLASSIFICATION OF: 17. LIMITATION OF
ABSTRACT
SAR
18, NUMBER OF PAGES
26
19a. NAME OF RESPONSIBLE PERSONMatt Snyder a. REPORT
UNCLASb. ABSTRACT
UNCLASc. THIS PAGE
UNCLAS19b. TELEPHONE NUMBER (Include area code)
+44 (0)1895 616420
Standard Form 298 (Rev. 8/98) Prescribed by ANSI Std. Z39-18
Fatigue micromechanism characterisation in carbon fibre reinforced polymers using
synchrotron radiation computed tomography
Serafina Consuelo Garcea
Supervised by Prof. S. Mark Spearing
Prof. Ian Sinclair
AFOSR EOARD Program Monitor: Col. Randall Pollak
Engineering Materials Research Group Faculty of Engineering and Environment
University of Southampton
December 2014
Distribution A: Approved for public release; distribution is unlimited.

AFOSR-‐EOARD Report
Table of Contents
Publications ........................................................................................................... 3
Journal papers ..................................................................................................................................................... 3 Conference papers ............................................................................................................................................. 3
1. Introduction ....................................................................................................... 4
2. Materials and methodology ............................................................................... 5
2.1 Material systems ......................................................................................................................................... 5 2.2 Fatigue tests and SRCT scan procedure ............................................................................................ 6 2.3 Damage analysis .......................................................................................................................................... 8
3. Damage initiation in particle toughened system ................................................. 8
4. Effect of toughening strategies on fatigue micromechanisms ........................... 10
4.1 Particle toughened system .................................................................................................................. 10 4.2 Untoughened system .............................................................................................................................. 12 4.3 Intrinsically toughened matrix system .......................................................................................... 13 4.4 Crack morphology ................................................................................................................................... 14
5. Fatigue damage quantification ......................................................................... 16
6. Fatigue and quasi-‐static damage comparison ................................................... 18
7. Conclusions ...................................................................................................... 20
8. Significant Contributions .................................................................................. 21
9. Future Work ..................................................................................................... 22
Acknowledgments ............................................................................................... 22
References ........................................................................................................... 23
Distribution A: Approved for public release; distribution is unlimited.

AFOSR-‐EOARD Report Publications 3
3
Publications
This work has been disseminated through the following publications and conference
presentations. AFOSR EOARD funding has been acknowledged in each publication
and presentation:
Journal papers
• S.C. Garcea, M.N. Mavrogordato, A.E. Scott, I. Sinclair, S.M. Spearing,“Fatigue micromechanism characterisation in carbon fibre reinforcedpolymers using synchrotron radiation computed tomography”, CompositesScience and Technology, Vol. 99, pp. 23-30, 2014.
• S.C. Garcea, I. Sinclair, S.M. Spearing, “In situ synchrotron tomographicevaluation of the effect of toughening strategies on fatigue micromechanismsin carbon fibre reinforced polymers”, submitted to Composites Science andTechnology, in review.
• S.C. Garcea, I. Sinclair, S.M. Spearing, “Fatigue damage initiation in carbonfibre reinforced polymers using synchrotron radiation computed tomography”,journal letter, in preparation.
• S.C. Garcea, I. Sinclair, S.M. Spearing, “Size effect study of particletoughened carbon/epoxy under fatigue loading using high-resolutionsynchrotron radiation computed tomography imaging”, in preparation.
Conference papers
• S.C. Garcea, M.N. Mavrogordato, A.E. Scott, I. Sinclair, S.M. Spearing,“Synchrotron computed tomography of fatigue micromechanisms in CFRP”,Proceeding of 19th International Conference on Composite Materials,Montreal, 2013.
• S.C. Garcea, I. Sinclair, S.M. Spearing, “Characterisation of fatiguemicromechanisms in toughened carbon fiber-polymer composites usingsynchrotron radiation computed tomography”, Proceeding of the 16th
European Conference on Composite Materials, Seville, 2014.
Distribution A: Approved for public release; distribution is unlimited.

AFOSR-‐EOARD Report Publications 4
4
1. Introduction
Carbon fibre reinforced polymers (CFRPs) are well established as an important
weight-reducing structural technology, particularly within the aerospace sector due to
their high specific stiffness and strength [1]. Whilst CFRPs are widely identified as
being very fatigue resistant, typically this advantage is not fully exploited in design.
As such, understanding and predicting the durability of these materials is of great
interest. Fatigue design methodologies for composite laminates are not well-
established due to degradation via multiple interacting damage modes, including
fibre/matrix debonding, matrix cracking, delamination, and fibre breaks [2]. Previous
studies have focused on assessing fatigue damage mechanisms and the link to fatigue
life using various experimental techniques [2-8]. However, reliable predictions based
on physical observations remain key to improving CFRP structural design. Different
non-destructive techniques have been employed historically to detect fatigue damage
in composites: for example, ultrasonic C-scans to evaluate delamination [9,10],
acoustic emission to monitor the formation and growth of damage [11,12],
thermography and thermo-elastic stress analysis to correlate damage and surface
strains [13]. These methods have intrinsic limitations, such as the inability to provide
direct information on type, size and orientation of damage, to resolve fine-scale
failure events (e.g. fibre/matrix debonding and fibre breaks), and to provide a
thorough three-dimensional representation of damage. In this respect, computed
tomography (CT) has become established as a powerful technique for contemporary
material science studies, allowing multiscale analysis (macro-, meso-, micro- and
nano-scale) of material structure and damage to be performed [14]. Previous studies
conducted on CFRPs have demonstrated that high resolution CT allows the imaging
of damage at the scale of individual broken fibres [15], and that a voxel resolution on
the order of one micrometre is reasonable to detect and distinguish fundamental
damage modes [15-18].
The current work has the aim of delineating for the first time the micromechanisms of
fatigue damage in carbon fibre-epoxy laminated composites using in situ and ex situ
synchrotron radiation computed tomography (SRCT). The ability to explore three-
dimensional volumes is of fundamental importance in multidirectional laminates that
exhibit multiple damage mechanisms, as in this work. Performing in situ experiments
is relevant to follow damage propagation, capturing the chronology of micro-
Distribution A: Approved for public release; distribution is unlimited.

AFOSR-‐EOARD Report Publications 5
5
mechanistic interactions. Mechanically representative constraint conditions are
preserved (triaxiality, residual stress states), whilst sectioning artefacts and relaxation
processes associated with surface preparation are avoided. The objectives of this
project have three elements: first to conduct an investigation of the mechanisms that
underpin fatigue behaviour across a range of composite systems employing different
toughening strategies. At this stage two-and three-dimensional damage imaging
reveals similarities and differences associated with toughened and untoughened
systems. The second element is to evaluate the micromechanisms of fatigue damage
initiation in a particle-toughening system, assessing the role of toughening particle at
the early stage of fatigue failure. The third element is the quantification of damage
and the investigation of the effectiveness of toughening mechanisms in order to
inform modelling.
2. Materials and methodology
2.1 Material systems
Three carbon/epoxy material systems, all produced by the Hexcel Corporation, have
been assessed in the present work: two toughened systems; one containing
thermoplastic toughening particles (T700/M21), the other utilizing a homogeneous,
intrinsically toughened matrix (IM7/8852), and an untoughened system (IM7/3501-6).
All systems contain intermediate modulus carbon fibres. A cross-ply lay-up was used,
with a [90/0]s stacking sequence for the particle-toughened system, and a [90/0]2s lay-
up for the other two systems. The nominal overall laminate thickness was maintained
at ~1 mm for all three systems.
Figure 1- Coupons used: (a) geometry and dimensions of the specimen, (b) detail of the notch, and (c) specimen with tabs bonded.
Distribution A: Approved for public release; distribution is unlimited.

AFOSR-‐EOARD Report Publications 6
6
Materials were laid up and auto-clave cured as flat plates using a standard aerospace
cure cycle [19-21]. Rectangular coupons containing two semi-circular notches of
radius 1.5 mm were introduced by water jet cutting, leaving a nominal central cross-
section between the notches of 1 mm.
The geometry and the dimensions of the specimens used are shown in Figure 1. The
coupon length was selected with the requirement to fit the specimen into the
compact/portable fatigue-loading device to perform ex situ and in situ experiments,
which resulted in lengths of 68 mm and 34 mm respectively. In addition, for the
specimens used for ex situ scans, aluminium tabs were glued with the aim of loading
them in the tensile rig. The average ultimate tensile failure strength (UTS) for each
material system has been evaluated in previous studies [16], and is calculated based
on the failure load and the net cross-sectional area between the notches. Values
reported are: 918 MPa for the particle-toughened system, 1419 MPa for the
untoughened, and 1271 MPa for the intrinsically toughened system [16].
2.2 Fatigue tests and SRCT scan procedure
Fatigue loading conditions and scan procedure were slightly different, depending on
the specific objectives of the experiment. The experimental settings were divided into
three sections for clarity.
Set 1 Damage initiation evaluation
The main aim of these experiments was to initiate damage in both fatigue and quasi-
static cases. Therefore, the peak load considered was relatively low, 30% UTS for the
fatigue case and 35% UTS for the quasi-static loading. Two hundred fatigue cycles
were applied at a frequency of 5 Hz, with an R-ratio (maximum:minimum load) =0.1.
Pre-fatigued coupons were loaded, using 90% of the load peak, in the in situ loading
rig, to open the cracks initiated, but at the same time avoid any further propagation.
Quasi-static experiments were conducted by loading the specimen in situ and holding
at the peak load while imaging. A high voxel resolution of 0.325 µm was chosen in
order to obtain the clearest possible indication of the earliest stages of damage. This
is the first time that such a high CT resolution has been used to damage in composite
materials.
Distribution A: Approved for public release; distribution is unlimited.

AFOSR-‐EOARD Report Publications 7
7
Set 2 Assessment of the influence of toughening strategies
Fatigue cycling was initially carried out at a frequency of 5 Hz with a peak load of
50% UTS and R=0.1 using a standard servo-hydraulic load frame to apply 700 load
cycles. After the pre-cycling had been applied, each specimen was placed in the in
situ load frame, and a load just below the maximum peak load (∼90% of peak) was
applied to open the cracks, and the coupon was scanned. Following these initial scans,
the in situ load frame was used to apply an additional 100 cycles, and then the
specimens were imaged again. A voxel resolution of 0.69 µm was used. For the
particular micromechanistic focus of this work, a balance between resolution and field
of view was employed, allowing detailed observations to be made along the initial
and propagated crack paths.
Set 3 Damage quantification
Tensile fatigue tests with a peak load of 30% and 50% of the nominal UTS were
performed using a load ratio of R=0.1. Experiments were conducted at 10 Hz, up to a
104 cycles. The pre-fatigue coupons were loaded (∼90% of peak) in the tensile
loading rig during the scan to allow the opening of the crack. Quasi-static tests were
conducted with the aim to create a similar crack length (split) to the fatigue case,
allowing a direct comparison between the modes of crack extension. The required
tensile loads were 60% UTS and 70% UTS, which are higher than those used for
fatigue. The voxel resolution chosen was 1.5 µm, which again represents a trade-off
between the resolution desirable and the optimum field of view (i.e. keeping the entire
damage region inside the field of view). The voxel resolution used for the quasi-static
tests was very similar, at 1.4 µm.
Scans were conducted at the Swiss Light Source (SLS), TOMCAT-X02DA Beamline,
Paul Scherrer Institut, Switzerland. Beamtime was obtained via a competitive bidding
process and peer evaluation. The specimens were placed at a distance of ~22-30 mm
from the detector to allow a degree of phase contrast edge enhancement to be
obtained (near-field Fresnel conditions). This facilitates the identification of cracks
with small opening displacements. During each tomographic scan, 1500 projections
were collected through the rotation of 180º. The beam energy was in the range of 14-
Distribution A: Approved for public release; distribution is unlimited.

AFOSR-‐EOARD Report Publications 8
8
19 KeV. Three-dimensional reconstruction was obtained from radiographs using an
in-house (SLS) code based on the GRIDREC/FFT approach [22].
2.3 Damage analysis
Micromechanical analysis of damage initiation and propagation has been conducted
considering 2D slices. Damage segmentation allowed the 3D visualization of the
different damage modes, their reciprocal location, and understanding the influence of
microstructure on the crack growth, as shown in Figure 2. Segmentation was
performed using the VG studio Max v2.1 package via a “seed-growing” algorithm.
Figure 2 – Three-dimensional fatigue damage for: (a) 30% UTS and (b) 50% UTS, at 104 load cycles.
Segmented crack volumes were separately extracted and quantified in terms of crack
length (considered as maximum extension), and Crack Opening Displacement (COD).
Specifically, the public domain software, ImageJ was employed to binarize the crack
volume, and basic image processing. The data obtained has been processed via
MATLAB to describe the crack front shape and the COD corresponding to the root
and near-tip regions of the 0º ply splits.
3. Damage initiation in particle toughened system The results obtained from the fatigue tests showed that particles do not exhibit an
active role in terms of 0º ply split initiation, and do not represent the location where
damage occurs in the first instance. Cracks nucleate in the resin between fibres in the
fibre-packed regions within the 0º plies (Figure 3(a)), and at this early stage do not
Distribution A: Approved for public release; distribution is unlimited.

AFOSR-‐EOARD Report Publications 9
9
propagate into the resin rich regions. Damage is discontinuous: many parallel
microcracks initiate, separated from each other by the presence of small bridging
ligaments (on the order of a few micrometers), as is clearly visible in Figure 3(b). The
small bridging ligaments detected along the fibre/matrix interface fail progressively
due to cyclic loading, as shown in Figure 3(c) and 3(d), where the nucleation
locations are indicated with white arrows. The bridging between them, as shown in
Figure 3(b) is failed and the crack appears continuous. A direct comparison with the
quasi-static case (Figure 3(e) and 3(f)), using a similar peak load, exhibits similar
behaviour to the fatigue case (Figure 3(a) and 3(b)), i.e. locally discontinuous crack
formation.
Figure 3 - Cross-sections parallel to the loading direction of 0º ply split: (a)-(b) discontinuous fatigue damage initiation for a peak load of 30% UTS and 200 cycles, (c)-(d) continuous fatigue damage for a peak load of 30%
UTS and 200 cycles, (e)-(f) quasi-static case for a load of 35% UTS.
Three-dimensional rendering of the 0º ply splits for the fatigue and quasi-static case
are reported in Figure 4. A somewhat longer crack length, larger number of crack
initiation sites across the ply thickness, and longer single “spikes” characterize the
fatigue case, as shown in Figure 4(a). In contrast, the quasi-static case shows damage
mainly localized over only half of the ply thickness, with smaller and more frequent
peaks, as shown in Figure 4(b). A noticeable difference between the two loading
conditions is a reduction in the number density of bridging ligaments in the fatigue
case, Figure 4(a).
Distribution A: Approved for public release; distribution is unlimited.

AFOSR-‐EOARD Report Publications 10
10
Figure 4 – Three-dimensional rendering of damage initiation in the fibre-packed regions: 0º ply split in (a) fatigue case with peak load of 30% UTS up to 200 cycles, (b) quasi-static case for a load of 35% UTS.
From these observations it appears that the initial stage of fatigue damage
development consists of the nucleation of very localized cracks, which tend to grow
parallel to the loading direction. Their coalescence across the ply thickness
(perpendicular to the loading direction) is initially limited. The quasi-static case
displays more apparent connections between initiation sites across the ply thickness
(split width), and more bridging ligaments along the loading direction, as shown in
Figure 4(b).
4. Effect of toughening strategies on fatigue micromechanisms
4.1 Particle toughened system
The particle-toughened M21/T700 system showed highly non-uniform growth of the
fatigue crack front [23]. Detailed imaging has been focused on resin rich regions with
the aim of understanding potential shielding mechanisms that may influence the
overall damage progression, see Figure 5. Damage development appears very
discontinuous in the resin rich regions, characterized by multiple microcracks, which
are mainly associated with the debonding of toughening particles, as shown in Figure
5a. Interfacial debonding of particles tends to follow a specific direction: damage is
typically oriented at 45º with respect to the loading direction, and this is consistent
with the influence of macroscale shear on what appears to be essentially a tensile
particle debonding/crack initiation process at the microscale. The growth of a 0º ply
split associated with a 100 cycle fatigue increment at a peak load of 50% UTS is
Distribution A: Approved for public release; distribution is unlimited.

AFOSR-‐EOARD Report Publications 11
11
shown in Figure 5b. Damage progression is seen to be highly discontinuous, with
crack extension being dominated by the growth and coalescence of many small
cracks, rather than the progression of a dominant crack tip. The primary process of
damage propagation at the nominal crack tip, defined as the furthest extent of the
damage zone, is represented by particle debonding (Figure 5b, (A)), which results in
the creation of bridging ligaments along the crack wake. The process is distributed
over a length of approximately 1 mm around the nominal crack tip, with partially
debonded particles remaining intact relatively far behind the nominal crack tip (over
several hundred micrometers) and acting as bridging ligaments between the crack
flanks.
Figure 5 - 0º ply split growth propagation in the particle toughened system within the resin rich region for a peak
load of 50% UTS: two comparisons at 700 cycles and 800 cycles (corresponding to (a)-(b) and (c)-(d)).
The periodicity and scale of microcracking is clearly defined by the particle size and
separation distances, as shown in Figure 5b. Crack bridging ligaments consist of resin
between particles debonds (e.g. Figure 5b, (B)) and/or particles themselves (e.g.
Figure 5b, (C)). The presence of particles clearly promotes crack deflection,
increasing the crack path tortuosity and the surface roughness. Figure 5a, (D) shows
the difference between the split growth propagation along the fibre/matrix interface,
which appears smooth/straight, versus the damage developed in the resin rich region,
characterized by significant crack deflection. Considering another region of interest in
Distribution A: Approved for public release; distribution is unlimited.

AFOSR-‐EOARD Report Publications 12
12
the coupon (Figure 5(c) and 5(d)), several bridging ligaments present at 700 cycles
(Figure 5c (A) and (B)) are removed, wholly or partially, at 800 cycles (Figure 5d (A′)
and (B′)). Two different behaviours have been detected, depending on the resin
ligament size: (i) small bridges (on the order of ∼10-20 µm); these fail by connecting
adjacent microcracks along the direction of damage propagation, as shown in Figure
5d (A′); and (ii) large ligaments (on the order of ∼50-100 µm cross-section), fail by
the formation of local echelon cracks within the bulk resin itself (i.e. not from
toughening particles) at 45º to the loading direction, as shown in Figure 5d (B).
Toughening particles act also as bridging ligaments when they are partially debonded
along the crack wake, as shown in Figure 5d (C).
Single fibre breaks and doublets (two adjacent broken fibres) have been detected
along the 0˚ ply split path associated with misaligned and bridging fibres. Further
analyses conducted on tensile tests showed that the first cycle introduces just a few
fibre breaks (∼4) over the average crack length of 400 µm. The number of fibre
breaks detected after 700 cycles is roughly fifteen times higher (56 fibre breaks) than
in the quasi-static case, indicating that whilst fatigue loadings leads to additional fibre
breaks.
4.2 Untoughened system
The untoughened system exhibits fewer and smaller resin-rich regions, especially
within each individual ply. This microstructure clearly affects damage propagation,
which occurs preferentially at the fibre/matrix interface (rather than at secondary
phase particles in the toughened material) for both 0˚ ply splits and delaminations, as
shown in Figure 6 for the specific case of a 0º ply split. As such, 0º ply splits manifest
similar behaviour to the particle toughened system within the fibre packed regions,
developing relatively straight and smooth fracture paths. This is depicted in Figure 6a
and 6b, where damage (in cyan) was segmented to distinguish features with similar
greyscale values.
When the fibres are surrounded by resin, the crack propagation was seen to be
discontinuous, assuming the form of small microcracks at the fibre/matrix interface,
retaining very small resin ligaments (on the order of a few micrometers), e.g. Figure
6c.
Distribution A: Approved for public release; distribution is unlimited.
AFOSR-‐EOARD Report Publications 13
13
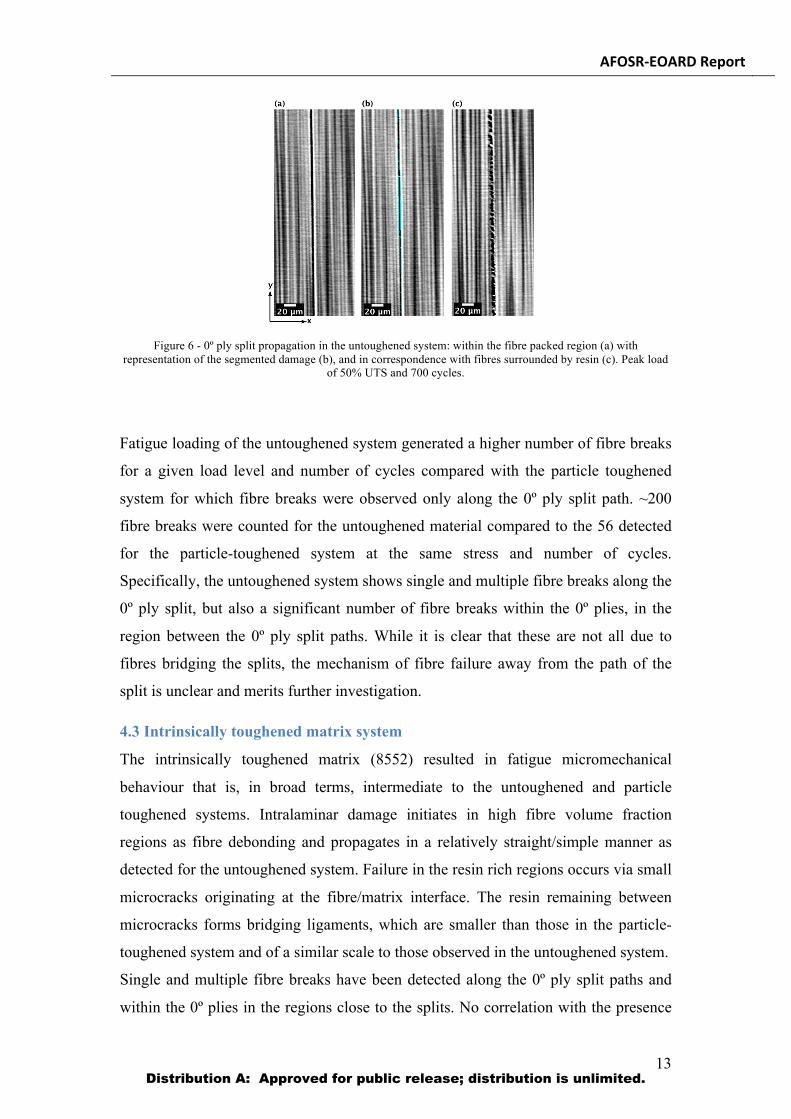
Figure 6 - 0º ply split propagation in the untoughened system: within the fibre packed region (a) with
representation of the segmented damage (b), and in correspondence with fibres surrounded by resin (c). Peak load of 50% UTS and 700 cycles.
Fatigue loading of the untoughened system generated a higher number of fibre breaks
for a given load level and number of cycles compared with the particle toughened
system for which fibre breaks were observed only along the 0º ply split path. ~200
fibre breaks were counted for the untoughened material compared to the 56 detected
for the particle-toughened system at the same stress and number of cycles.
Specifically, the untoughened system shows single and multiple fibre breaks along the
0º ply split, but also a significant number of fibre breaks within the 0º plies, in the
region between the 0º ply split paths. While it is clear that these are not all due to
fibres bridging the splits, the mechanism of fibre failure away from the path of the
split is unclear and merits further investigation.
4.3 Intrinsically toughened matrix system
The intrinsically toughened matrix (8552) resulted in fatigue micromechanical
behaviour that is, in broad terms, intermediate to the untoughened and particle
toughened systems. Intralaminar damage initiates in high fibre volume fraction
regions as fibre debonding and propagates in a relatively straight/simple manner as
detected for the untoughened system. Failure in the resin rich regions occurs via small
microcracks originating at the fibre/matrix interface. The resin remaining between
microcracks forms bridging ligaments, which are smaller than those in the particle-
toughened system and of a similar scale to those observed in the untoughened system.
Single and multiple fibre breaks have been detected along the 0º ply split paths and
within the 0º plies in the regions close to the splits. No correlation with the presence
Distribution A: Approved for public release; distribution is unlimited.

AFOSR-‐EOARD Report Publications 14
14
of delamination, as observed in the untoughened material, was found. For equivalent
load conditions ~150 fibre breaks were detected for the intrinsically toughened
material system in similar order to the untoughened system (191), cf. ~50 in the
particle toughened material.
4.4 Crack morphology
Two-dimensional slices were exploited to segment fatigue damage and provide a 3D
representation of the crack front profile, as shown in Figure 7. The investigation was
focused on 0º ply splits with different crack profiles being detected, depending on the
matrix system, and in particular on the interaction between damage and the local
microstructure. The three-dimensional rendering of the damage within the particle-
toughened system (Figure 7a) confirms that particles play a fundamental role in crack
development. The local crack path is three-dimensional with a roughness and
tortuosity defined by the particle size, with the crack and associated damage
occupying a fraction of the intra-ply resin rich regions. By contrast, the untoughened
material exhibits much more planar/uniform crack surfaces, with 3-D features largely
determined by the scale of the fibre diameter and the inter-fibre spacing.
Figures 7a-c show plan views of splits from each material. Toughening mechanisms
in the particle system are seen to act locally, within bands in the material, resulting in
local fracture energy dissipation, consistent with the uneven crack advance, as shown
in Figure 7a. The presence of retarded zones (pinning of the crack front) is related to
the location of resin-rich regions containing the majority of toughening particles,
which inhibit crack propagation, as shown in the cross-section perpendicular to the
loading direction, Figure 7d. The result is a crack front that exhibits a “jagged” shape
(Figure 7a), characterized by extended crack growth in the high fibre volume fraction
regions, associated with extensive debonding of fibre/matrix interfaces. Figure 7b
displays the 0º ply split segmentation for the untoughened system. Split propagation
at the matrix/fibre interface is more uniform across the ply split width due to the
absence of resin and particle-rich bands.
The crack propagation across the ply thickness is seen to occur on two distinct planes
in this particular instance, corresponding to two different initiation sites, as shown in
cross-section in Figure 7e. However, considering each branch separately the crack
growth is relatively uniform, as shown in Figure 7b. Resin bridging ligaments (black
regions within the segmentation) comprise a relatively small area fraction compared
Distribution A: Approved for public release; distribution is unlimited.

AFOSR-‐EOARD Report Publications 15
15
with the particle-toughened material, with a corresponding expectation of reduced
effectiveness of bridging and hence crack shielding.
Figure 7 - Three-dimensional rendering of the 0º ply split, with a typical cross section perpendicular to the loading
direction: (a), (d) particle-toughened system; (b), (e) untoughened system; and (c), (f) intrinsically toughened system. Peak load of 50% UTS and 800 cycles.
The intrinsically toughened system demonstrated an intermediate behaviour, between
that of the particle-toughened and the untoughened systems, as shown in Figure 7c. In
particular, even though no toughening particles are present within the matrix, the resin
rich regions act as crack retardation sites, creating non-uniform crack growth. The
cross-section perpendicular to the loading direction presented in Figure 7f confirms
Distribution A: Approved for public release; distribution is unlimited.

AFOSR-‐EOARD Report Publications 16
16
that the split is constrained by a resin-pocket, whereas in fibre rich volumes crack
growth is extended. The density of bridging ligaments along the crack wake is much
less than for the particle-toughened system but is slightly higher than for the
untoughened system.
The root mean square (RMS) “roughness” of the crack front profiles was calculated in
order to quantify the variation. The particle toughened and the intrinsically toughened
systems exhibited similar values (RMS ∼230 µm), which were much higher than for
the untoughened system (RMS∼70 µm).
5. Fatigue damage quantification
Damage quantification has been conducted focusing on the evaluation of the crack
length and crack opening displacement of 0º ply splits, as shown in Figure 8. Three-
dimensional damage rendering, shown in Figure 2, demonstrates that 0º ply splits are
not planar; however, the COD map represents a 2D projection of the split onto the
plane of the 0° plies, obtained by summing the voxels in the through-thickness
direction. Figure 8(a) and Figure 8(b) show the crack opening contour map of 0º ply
splits grown in fatigue loading at 30% and 50% UTS respectively for 104 cycles;
where red corresponds to large values of COD, and blue regions are uncracked. The
COD maps again show that the crack front growth does not advance evenly.
The COD map for an applied load of 30% UTS, Figure 8(a), exhibits two main
regions across the split width (ply thickness) separated by a large resin rich region
located roughly in the middle (250 µm), at the interface between the two central 0°
plies. Both regions, from 50−220 µm and the other from 270-420 µm, are
characterized by a jagged crack front; with a similar overall extent on each side and
retarded crack growth close to the interfaces with the 90° plies, i.e. from 0 µm to 50
µm and from 420 µm to 450 µm, where the crack interacts with particles at the
interfaces. Another prominent resin rich region is located between 180-200 µm. The
COD values appear similar across the majority of the split, with average values on the
order of 2.5-3.5 µm at the root and 1.5-2.5 µm in the region 200 µm back from the
crack tip. The COD map obtained for an applied load of 50% σf is shown in Figure
8(b). Similar behaviour at the lower load is observed: two main zones are visible
across the split width (ply thickness), from 50 µm to 250 µm and from 270 µm to 500
Distribution A: Approved for public release; distribution is unlimited.
AFOSR-‐EOARD Report Publications 17
17
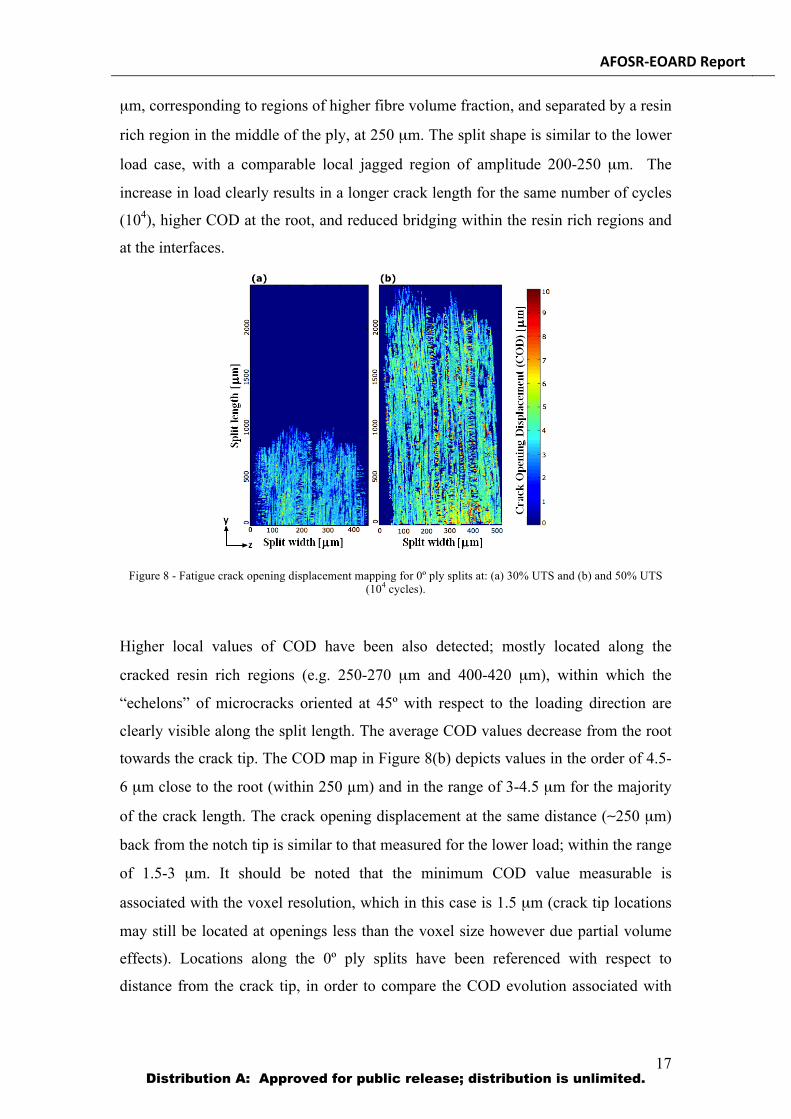
µm, corresponding to regions of higher fibre volume fraction, and separated by a resin
rich region in the middle of the ply, at 250 µm. The split shape is similar to the lower
load case, with a comparable local jagged region of amplitude 200-250 µm. The
increase in load clearly results in a longer crack length for the same number of cycles
(104), higher COD at the root, and reduced bridging within the resin rich regions and
at the interfaces.
Figure 8 - Fatigue crack opening displacement mapping for 0º ply splits at: (a) 30% UTS and (b) and 50% UTS (104 cycles).
Higher local values of COD have been also detected; mostly located along the
cracked resin rich regions (e.g. 250-270 µm and 400-420 µm), within which the
“echelons” of microcracks oriented at 45º with respect to the loading direction are
clearly visible along the split length. The average COD values decrease from the root
towards the crack tip. The COD map in Figure 8(b) depicts values in the order of 4.5-
6 µm close to the root (within 250 µm) and in the range of 3-4.5 µm for the majority
of the crack length. The crack opening displacement at the same distance (~250 µm)
back from the notch tip is similar to that measured for the lower load; within the range
of 1.5-3 µm. It should be noted that the minimum COD value measurable is
associated with the voxel resolution, which in this case is 1.5 µm (crack tip locations
may still be located at openings less than the voxel size however due partial volume
effects). Locations along the 0º ply splits have been referenced with respect to
distance from the crack tip, in order to compare the COD evolution associated with
Distribution A: Approved for public release; distribution is unlimited.

AFOSR-‐EOARD Report Publications 18
18
these two different split lengths. For instance, at a position of 500 µm back from the
crack tip for both loading conditions, the COD is lower for the lower load case. This
is in part simply attributable to the load difference, but it is also clear that there has
been additional degradation of crack wake bridging ligaments at the higher loading. In
particular at the central ply interfaces, close to the crack tip, there is a smaller intact
bridging region at the higher load case (8(b)) compared to that present in the lower
load case (8(a)).
6. Fatigue and quasi-static damage comparison Qualitative analyses via 3D rendering of damage demonstrate broadly similar
behaviour between fatigue and quasi-static loading [15] in terms of crack location and
shape. However, fatigue loading results in more extensive damage than for quasi-
static loading at the same peak load. In addition, delamination is not detected under
quasi-static loading for these load levels, whereas delamination is clearly observed in
the fatigue case. In both quasi-static and fatigue a similar correlation between
intralaminar damage and microstructure was observed, suggesting broadly similar
micromechanical behaviour of 0º ply split propagation in resin rich regions and high-
fibre volume fraction regions. Figure 9 displays a cross section of a 0º ply split in a
resin rich-region for quasi-static loading (Figure 9(a)), and for fatigue (Figure 9(b));
both cases loaded at 50% UTS.
Figure 9 - Comparison of the micromechanical behaviour along the 0˚ ply split in (a) quasi-static case loaded to 60% UTS, and (b) fatigue loaded to 50% UTS with number of cycles of 104.
Distribution A: Approved for public release; distribution is unlimited.

AFOSR-‐EOARD Report Publications 19
19
The discrete microcracks in the resin rich regions are much more apparent in the
quasi-static loading case, as shown in Figure 9(a). In cyclic loading the bridges
between the individual microcracks appear to have largely failed, presumably due to
local cyclic degradation, yielding more continuous cracks as shown in Figure 9(b).
In order to provide a direct comparison of crack morphology between the fatigue and
quasi-static loading, CODs have been compared between 0º ply splits of two similar
total lengths (1mm and 2.5mm) obtained in fatigue (albeit at lower maximum load
levels) and quasi-static loading as shown in Figure 10. Fatigue plots correspond to the
cases with peak loads of 30% and 50% UTS, and 104 cycles; whereas the quasi-static
cases were obtained at load levels of 70% and 60% UTS respectively. Both fatigue
and quasi-static loading result in similar features: a jagged crack front, with greater
crack advance along areas with higher local fibre volume fractions, and crack
retardation along resin rich regions with the formation of bridging ligaments and
echelons of microcracks oriented at 45º with respect to the loading direction in the
resin rich regions.
Figure 10 - Split crack opening displacement contours: (a) crack length of 1 mm: fatigue case with peak load of 30% UTS and 104 cycles, (b) quasi-static case for 70% UTS; crack length of 2.5 mm: (c) fatigue case with peak load of
50% UTS and 104 cycles, and (d) quasi-static case for the load of 60% UTS.
The fatigue-loaded specimens show more uniform crack advance across the ply
thickness, along with more uniform crack opening displacement over the area of the
crack (width and length). In terms of uniformity of crack length across the ply
thickness (split width), large uncracked resin rich areas characteristically seen in static
load cases (e.g. a band of ~100µm width along the right hand ply interface of the 0º
Distribution A: Approved for public release; distribution is unlimited.

AFOSR-‐EOARD Report Publications 20
20
ply split in Figure 10(b)) were largely absent in the fatigue loading cases. Comparing
Figure 10(a) with 10(b) and Figure 10(c) with 10(d), it is apparent that in the quasi-
static cases (10b, 10d) there is a significantly higher crack opening displacement
towards the centre line of the 0º ply split and/or the centre line of the resin rich
regions. Figures 10(a) and 10(c), associated with fatigue loading, show more uniform
crack opening displacements across the ply thickness. The comparison between these
two loading conditions highlights the presence of higher average values of COD in
the fatigue cases (Figure 10a, 10c), even though the applied loads were higher for the
quasi-static cases (Figure 10b, 10d). In the first instance, this is consistent with a
reduced number and strength of load bearing ligaments in the wake of the fatigue
cracks, and/or the corresponding incidence of delamination in fatigue. The presence
of delamination in the fatigue case could affect the COD due to the fact that the 0º
plies are less constrained. However, the delamination is not completely developed
along the split length, as shown in Figure 2, extending only along 10% and 35% of
the total 0º ply split lengths considered for the COD maps for the cases of loading at
30% and 50% σf respectively. Quasi-static cases showed no delamination for the
smaller crack and minimal of delamination for the longer crack (amounting to ~5% of
the 0º ply split length). As such, higher CODs for the fatigue cases compared to
similar split lengths in quasi-statically loaded specimens are consistent with the local
degradation of bridging ligaments under fatigue loading, as illustrated in Figure 10(a)
and 10(c), resulting in reduced effectiveness of bridging and higher crack opening and
shear displacements.
7. Conclusions SRCT combined with in situ loading has been demonstrated as an effective technique
for investigating the micromechanisms of fatigue in composite materials with
toughened matrices. Several novel observations have been obtained for the
micromechanisms of fatigue crack growth.
Broadly similar micromechanisms of damage initiation have been identified in fatigue
and quasi-static loading in a particle-toughened carbon fibre-epoxy composite system.
Cracks nucleate in the matrix/fibre-matrix interface region within volumes of high
local fibre-volume fraction within the 0˚ plies. This initial stage is not characterized
by the propagation of a single dominant crack, but multiple microcracks separated by
Distribution A: Approved for public release; distribution is unlimited.

AFOSR-‐EOARD Report Publications 21
21
bridging ligaments. As such, the micromechanisms of damage initiation are similar to
those of damage propagation. Results showed that damage propagation is closely
related to the local microstructure. Toughened systems exhibit different damage
behaviour in resin-rich regions and fibre-packed zones, which appears to exaggerate
non-uniform crack growth. Zones of retarded crack growth correspond to resin rich
regions, which contain bridging ligaments. This was most pronounced in the particle-
toughened system, and less so in the intrinsically-toughened system. There is
evidence that the load cycling contributes to progressive failure of bridging ligaments
in the crack wake, especially in the toughened particle system. The untoughened
system showed more uniform damage propagation across the crack front, due to the
more uniform microstructure. Consequently, fracture occurs by the propagation of a
well-defined crack front, whereas in the toughened systems there is extensive micro-
cracking ahead of the crack tip and crack bridging processes behind the crack tip. The
untoughened system showed a higher number of fibre breaks within the 0º plies with
respect to the toughened systems, particularly within regions close to the 0º ply splits.
It seems likely that a key mechanism of fatigue in the toughened-particle system on
intralaminar loading is the degradation of bridging ligaments introduced by particles
in the fatigue crack wake rather than due to processes at, or ahead of the crack tip;
resulting in higher, more uniform crack opening displacements and less-serrated crack
fronts compared to quasi-static loading.
8. Significant Contributions This study has made the following original contributions:
1. First use of synchrotron radiation computed tomography to investigate the
micromechanisms of fatigue in fibre composite materials, identifying 3D
crack behaviour down to ~300nm resolutions.
2. First comparison of micromechanisms of fatigue between toughened and
untoughened systems.
3. First identification of the role of bridging ligaments in generating damage
resistance (toughness) in all materials investigated via quantitative mapping
of local crack opening displacements
4. First identification of the effect of fatigue on failure of crack bridging
ligaments.
Distribution A: Approved for public release; distribution is unlimited.

AFOSR-‐EOARD Report Publications 22
22
5. First quantification of the effect of fatigue on fibre failure, particularly
identifying systematic differences between toughened and untoughened
systems.
9. Future Work The study has made significant contributions to our understanding of the effects of
fatigue in fibre-reinforced composite materials. It has identified several important
areas for follow-on research:
1. The ability to quantify damage at high resolution allows for the possibility of
the application of data rich mechanics techniques to model the processes and
provide guidance for design and material improvement. In a separate project
the augmented finite element method (AFEM) is being applied to understand
the progression of cracks through particle-toughened interlayers. This work
could be extended to include the effect of fatigue loading.
2. The work carried out herein has necessarily been conducted on small-scale
specimens. A key piece of follow-on work is to link the results to macro-scale
coupons and in service test articles, to ensure that similar mechanisms are
observed. There is also the possibility to link to NDE and Structural Health
Monitoring techniques to provide validation.
3. The observations of fibre fracture in fatigue are of great significance. They
are quite different from observations previously made in quasi-static loading.
Understanding the fibre failure is a key to understanding tensile strength, and
has the potential to improve fibre-utilisation and the structural efficiency of
composite parts. There are also long standing questions about very long term
strength reduction in composite parts held under load.
Acknowledgments The authors would like to acknowledge funding from AFOSR-EOARD, grant 113040,
Programme Monitor: Lt. Col. Randall Pollak. Also funding from EPSRC, grant
EP/H1506X/1. The authors are grateful to the Swiss Light Synchrotron Radiation for
access to TOMCAT-X02DA beamline, and to the assistance of Dr. Bernd Pinzer, Dr.
Sarah Irvine, and Dr. Peter Modregger. Thanks to µ-VIS at the University of
Distribution A: Approved for public release; distribution is unlimited.

AFOSR-‐EOARD Report Publications 23
23
Southampton for the computer analysis facilities. Materials were supplied via Airbus
SAS and Teledyne Technologies Incorporated.
References [1] C. Soutis “Fibre reinforced composites in aircraft construction”. Progress in Aerospace Science,
Vol. 41, No. 7, pp. 143-151, 2005. [2] S.M. Spearing and P.W.R. Beaumont “Fatigue damage mechanics of composite materials. I:
Experimental measurement of damage and post-fatigue properties”. Composites Science and Technology, Vol. 44, No. 2, pp. 159-168, 1992.
[3] C. Koimtzoglou, V. Kostopoulos and C. Galiotis “Micromechanics of reinforcement and damage initiation in carbon fibre/epoxy composites under fatigue loading”. Composites Part A: Applied Science and Manufacturing, Vol. 32, No. 3-4, pp. 457-471, 2001.
[4] J.R. Gregory and S.M. Spearing “Constituent and composite quasi-static and fatigue fracture experiments”. Composites Part A: Applied Science and Manufacturing, Vol. 36, No. 5, pp. 665-674, 2005.
[5] O.J. Nixon-Pearson, S.R. Hallett, P.J. Withers, J. Rouse. “Damage development in open-hole composite specimens in fatigue. Part 1: Experimental investigation”. Composite Structures, Vol. 106, pp. 882-889, 2013.
[6] Y.A. Dzenis “Cycle-based analysis of damage and failure in advanced composite under fatigue 1. Experimental observation of damage development within loading cycles”. International Journal of Fatigue, Vol. 25, No. 6, pp. 499-510, 2003.
[7] S.M. Spearing, P.W.R. Beaumont and M.F. Ashby “Fatigue damage mechanics of composite materials. II: a damage growth model”. Composites Science and Technology, Vol. 44, No. 2, pp. 169-177, 1992.
[8] O.J. Nixon-Pearson, S.R. Hallett, P.W. Harper, L.F. Kawashita “Damage development in open-hole composite specimens in fatigue. Part 2: Numerical modelling”. Composite Structures, Vol. 106, pp. 890-898, 2013.
[9] M. Beghini, L. Bertini and E. Vitale “Analysis of fatigue delamination growth in carboresin specimen with central hole”. Composite Structures, Vol. 17, No. 3, pp. 257-274, 1991.
[10] A.P. Mouritz, C. Townsend and M.Z. Shah Khan “Non-destructive detection of fatigue damage in thick composites by pulse-echo ultrasonics”. Composites Science and Technology, Vol. 60, No. 1, pp. 23-32, 2000.
[11] Y.A. Dzenis “Cycle-based analysis of damage and failure in advanced composite under fatigue 1. Experimental observation of damage development within loading cycles”. International Journal of Fatigue, Vol. 25, No. 6, pp. 499-510, 2003.
[12] S. Blassiau, A.R. Bunsell and A. Thionnet “Damage accumulation processes and life prediction in unidirectional composites”. Proceeding of the Royal Society A, Vol. 463, No. 2080, pp. 1135-1152, 2007.
[13] L. Toubal, M. Karama and B. Lorrain “Damage evolution and infrared thermography in woven composites laminates under fatigue loading”. International Journal of Fatigue, Vol. 28, No. 12, pp. 1867-1872, 2006.
[14] E. Maire, P.J. Withers “Quantitative X-ray tomography”. International Materials Review, Vol. 59, No. 1, pp. 1-43, 2014.
[15] A.E. Scott, M. Mavrogordato, P. Wright, I. Sinclair and S.M. Spearing “In situ fibre fracture measurement in carbon-epoxy laminates using high resolution computed tomography”. Composites Science and Technology, Vol. 71, No. 12, pp. 1471-1477, 2011.
[16] P. Wright, A. Moffat, I. Sinclair and S.M. Spearing “High resolution tomographic imaging and modeling of notch tip damage in laminated composite”. Composites Science and Technology, Vol. 70, No. 10, pp. 1444-1452, 2010.
[17] A.J. Moffat, P. Wright, J.-Y. Buffiere, I. Sinclair and S.M. Spearing “Micromechanisms of damage in 0° splits in a [90/0]s composite material using synchrotron radiation computed tomography”. Scripta Materialia, Vol. 59, No. 10, pp. 1043-1046, 2008.
[18] D.J. Bull, S.M. Spearing, I. Sinclair, L. Helfen “Three-dimensional assessment of low velocity impact damage in particle toughened composite laminates using micro-focus X-ray computed
Distribution A: Approved for public release; distribution is unlimited.

AFOSR-‐EOARD Report Publications 24
24
tomography and synchrotron radiation laminography”. Composites: Part A, Vol. 52, pp. 62-69, 2013.
[19] Hexcel HexPly M21. http://www.hexcel.com/Resources/DataSheets/Prepreg-Data-Sheets/M21_global.pdf.
[20] Hexcel HexPly 8552. http://www.hexcel.com/Resources/DataSheets/Prepreg-Data-Sheets/8552_eu.pdf
[21] 3501-6 Epoxy Matrix, Hexcel. http://www.hexcel.com/Resources/DataSheets/Prepreg-Data-Sheets/3501-6_eu.pdf
[22] B.A. Dowd, G.H. Campbell, R.B. Marr, V. Nagarkar, S. Tipnis, L. Axe and D.P. Siddons “Developments in synchrotron x-ray computed tomography at the National Synchrotron Light Source”. Proc. SPIE 3372, pp. 224-236, 1999.
[23] S.C. Garcea, M.N. Mavrogordato, A.E. Scott, I. Sinclair, S.M. Spearing “Fatigue micromechanism characterisation in carbon fibre reinforced polymers using synchrotron radiation computed tomography”. Composites Science and Technology, Vol. 99, pp. 23-30, 2014.
Distribution A: Approved for public release; distribution is unlimited.


![Report on EOARD Grant FA8655-13-1-2147 MAYRHOFERThermal Conductivity Designed Hard Protective Thin Films Paul H. Mayrhofer EOARD Grant/Award FA8655-13-1-2147 2/6 properties [4]. Cr](https://img.dokumen.tips/doc/110x75/6012c8ff5a8dae165638cc28/report-on-eoard-grant-fa8655-13-1-2147-mayrhofer-thermal-conductivity-designed-hard.jpg)